Structural Assessment of Reinforced Concrete Beams Incorporating Waste Plastic Straws


Abstract
1. Introduction
2. Materials and Methods
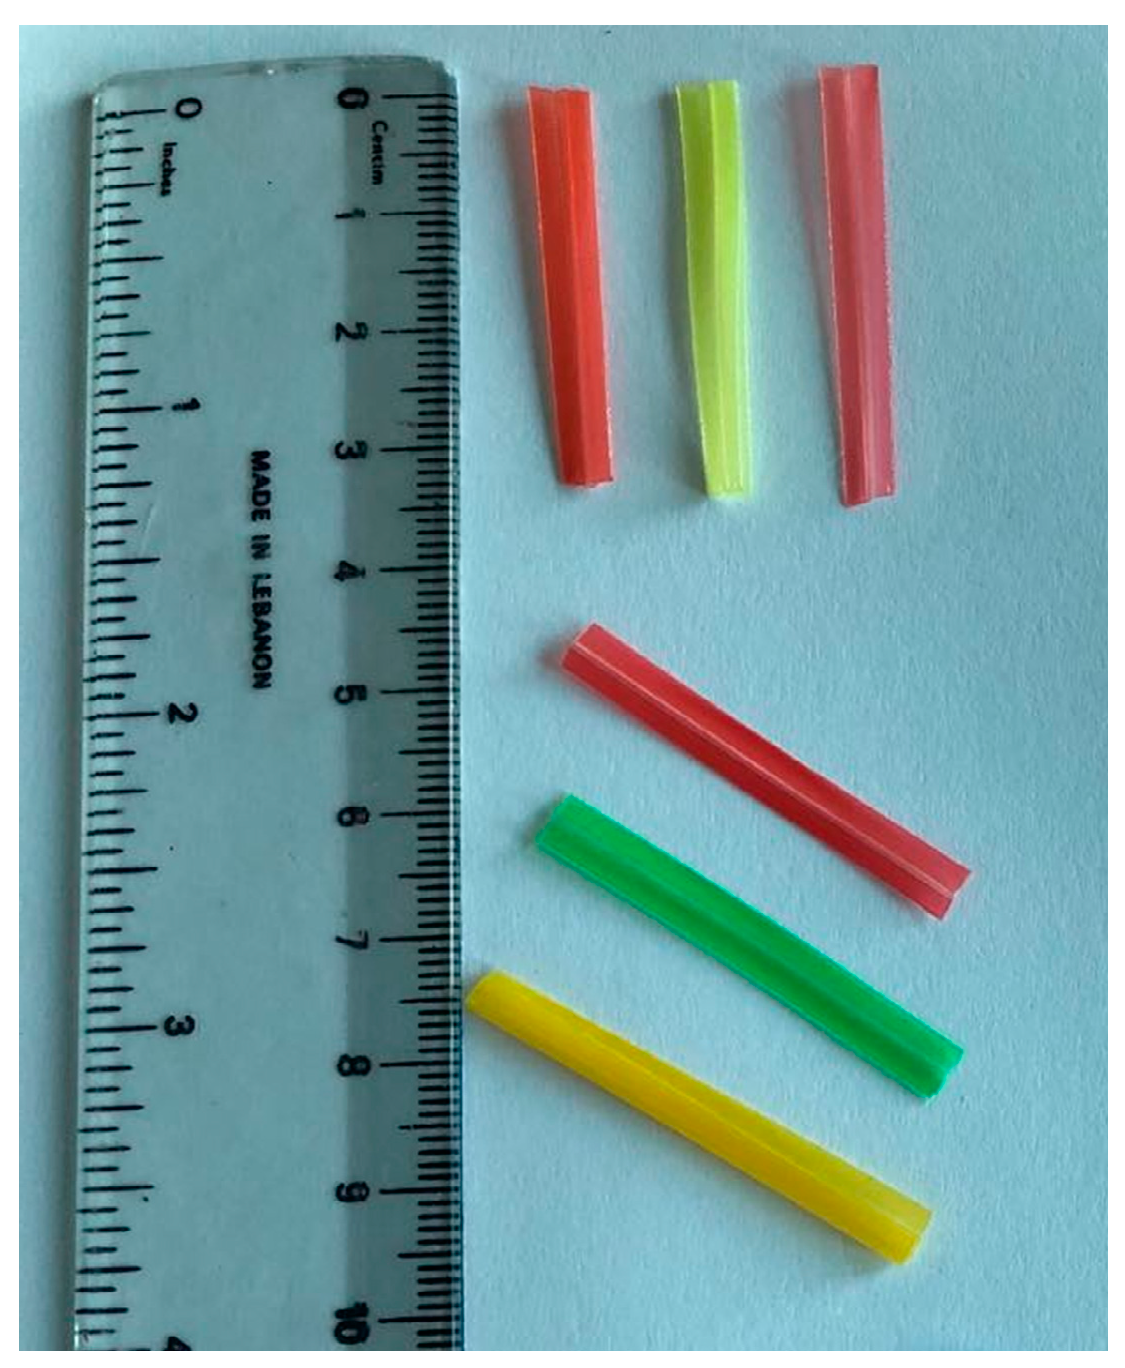
2.1. Materials
2.2. Mix Design
2.3. Mixing Procedure
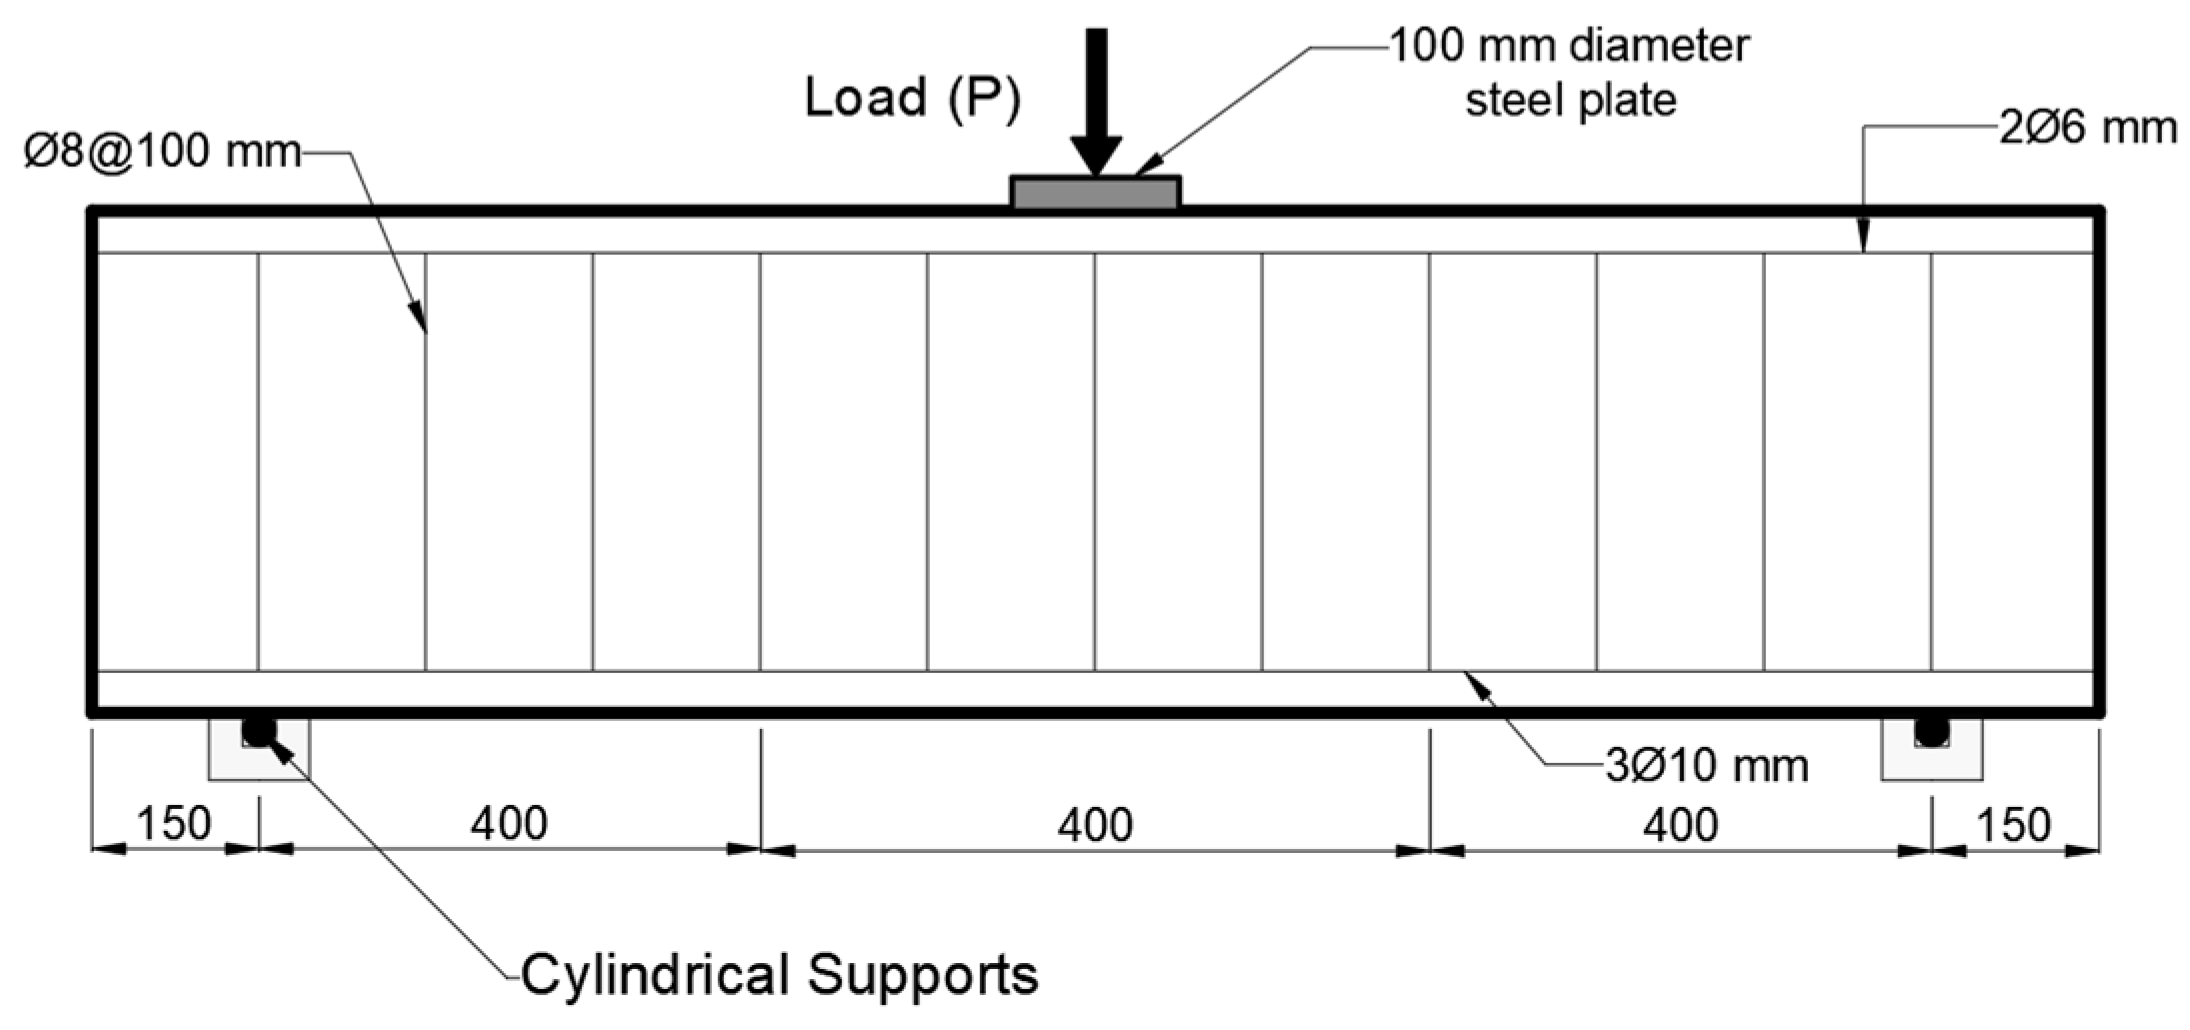
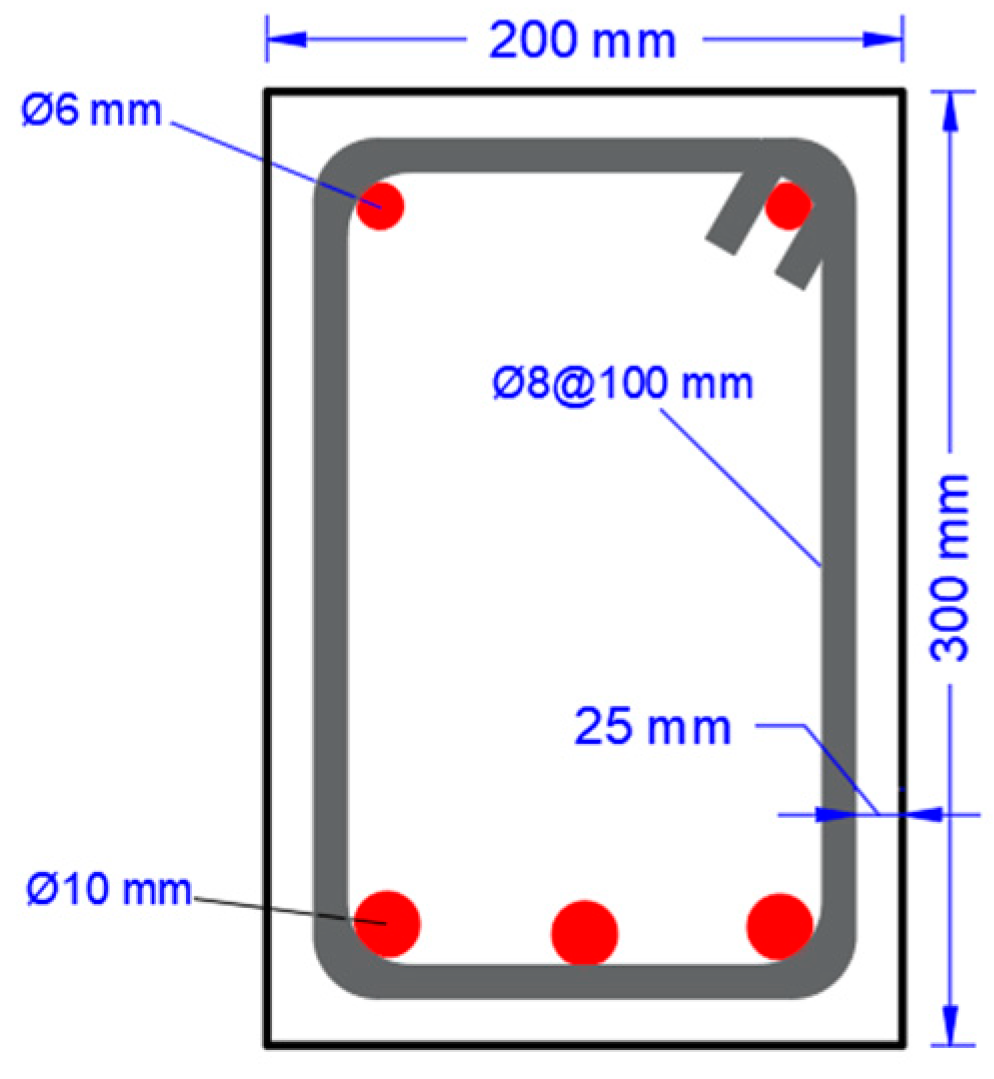
2.4. Beam Details
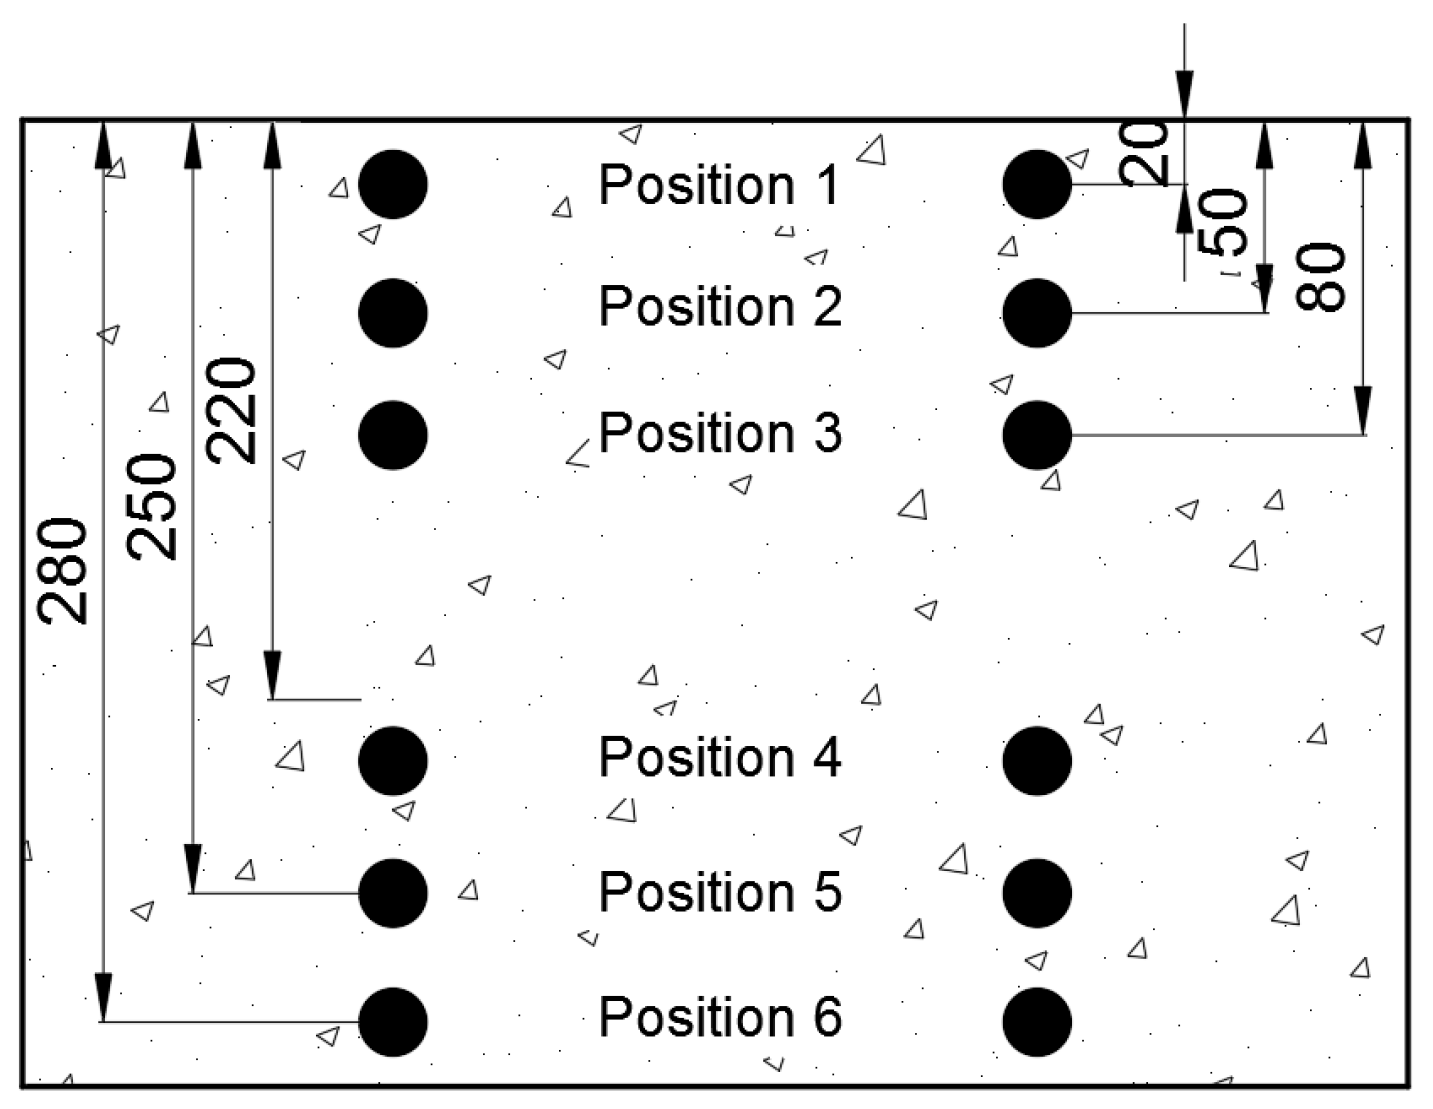
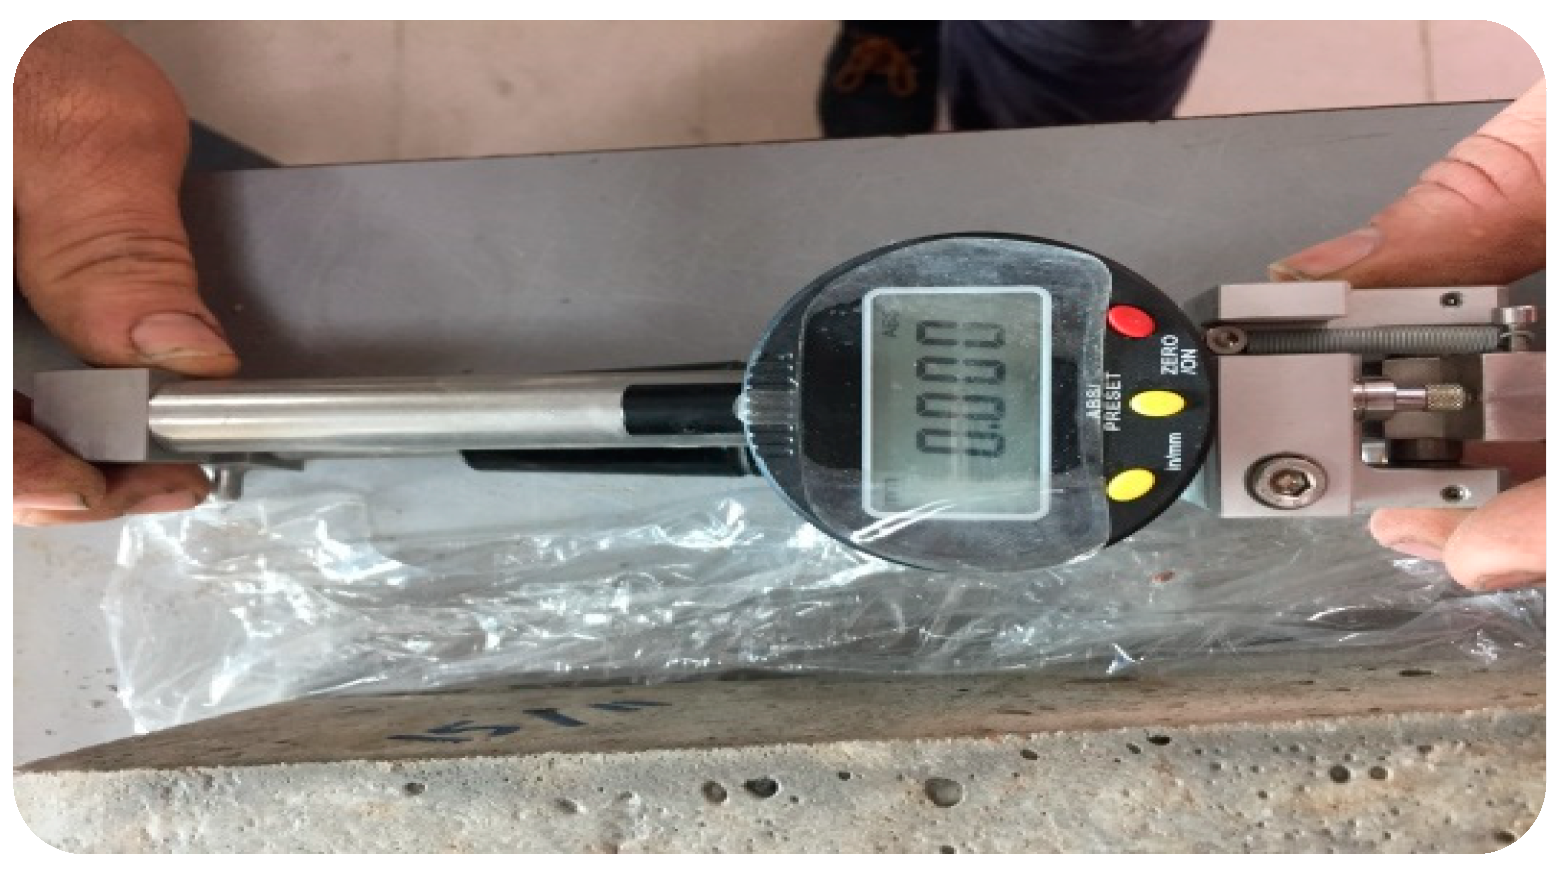
2.5. Testing
2.5.1. Compressive Strength
2.5.2. Split tensile Strength
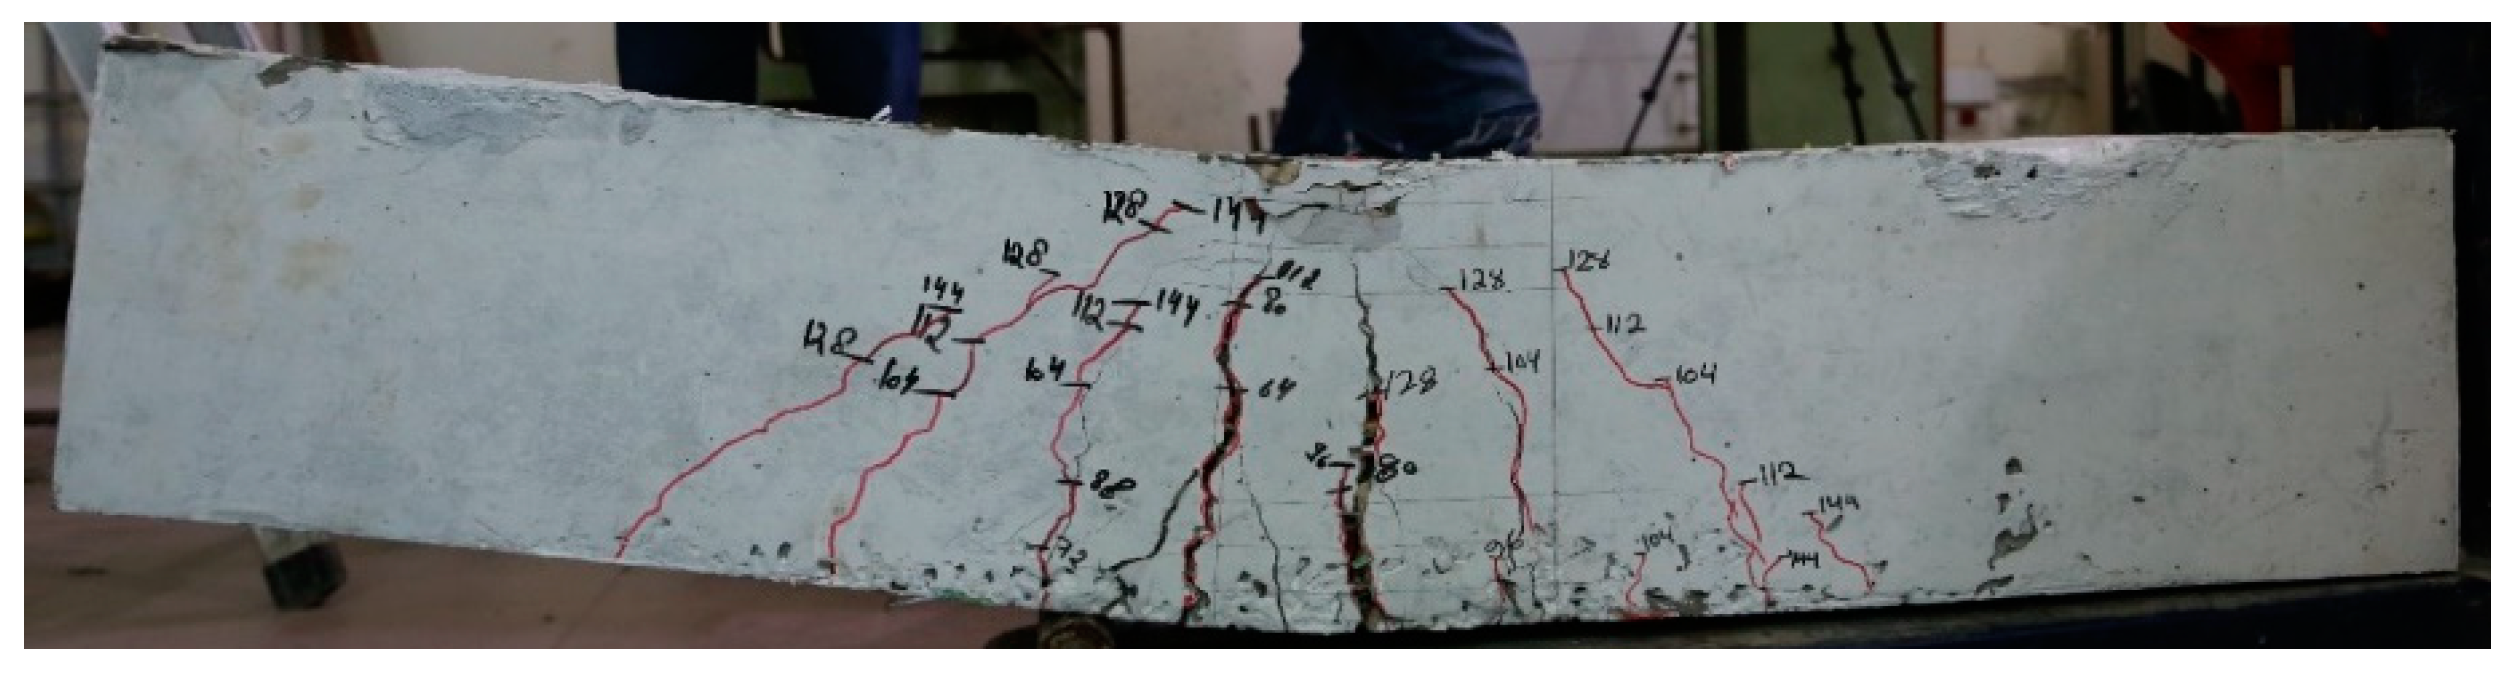
2.5.3. Beam Testing
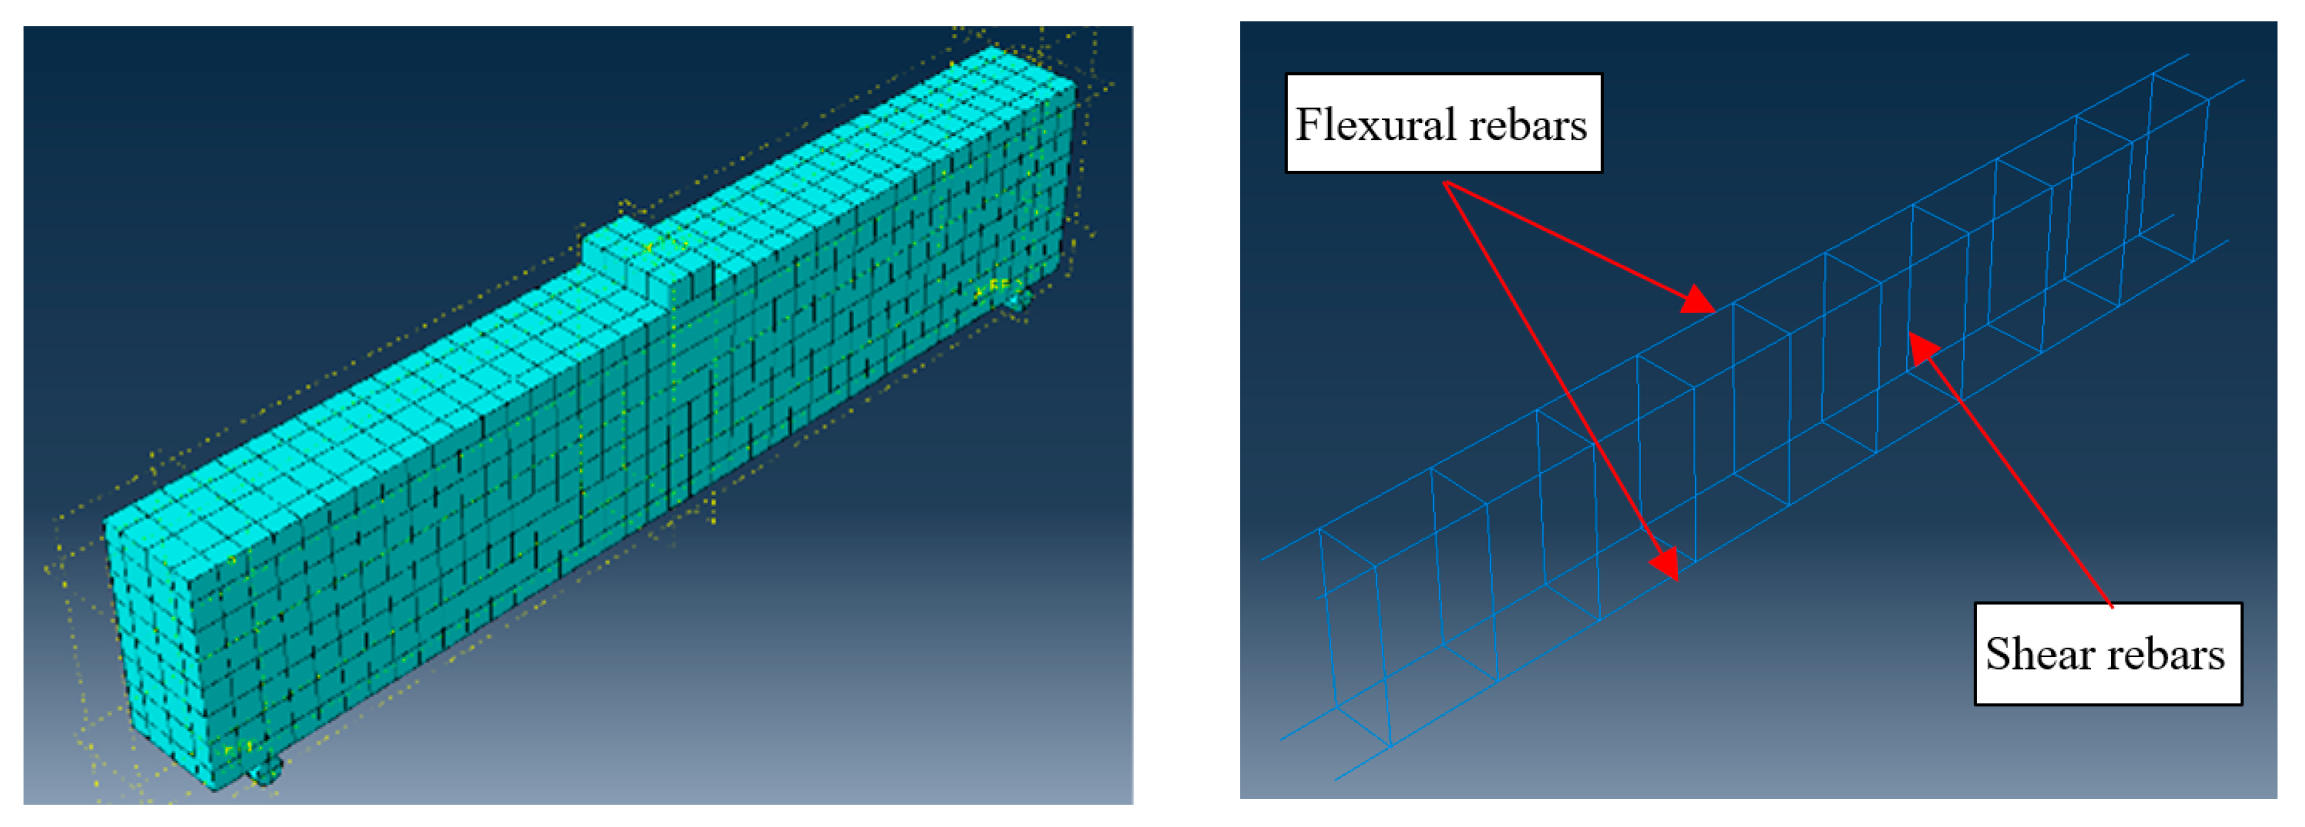
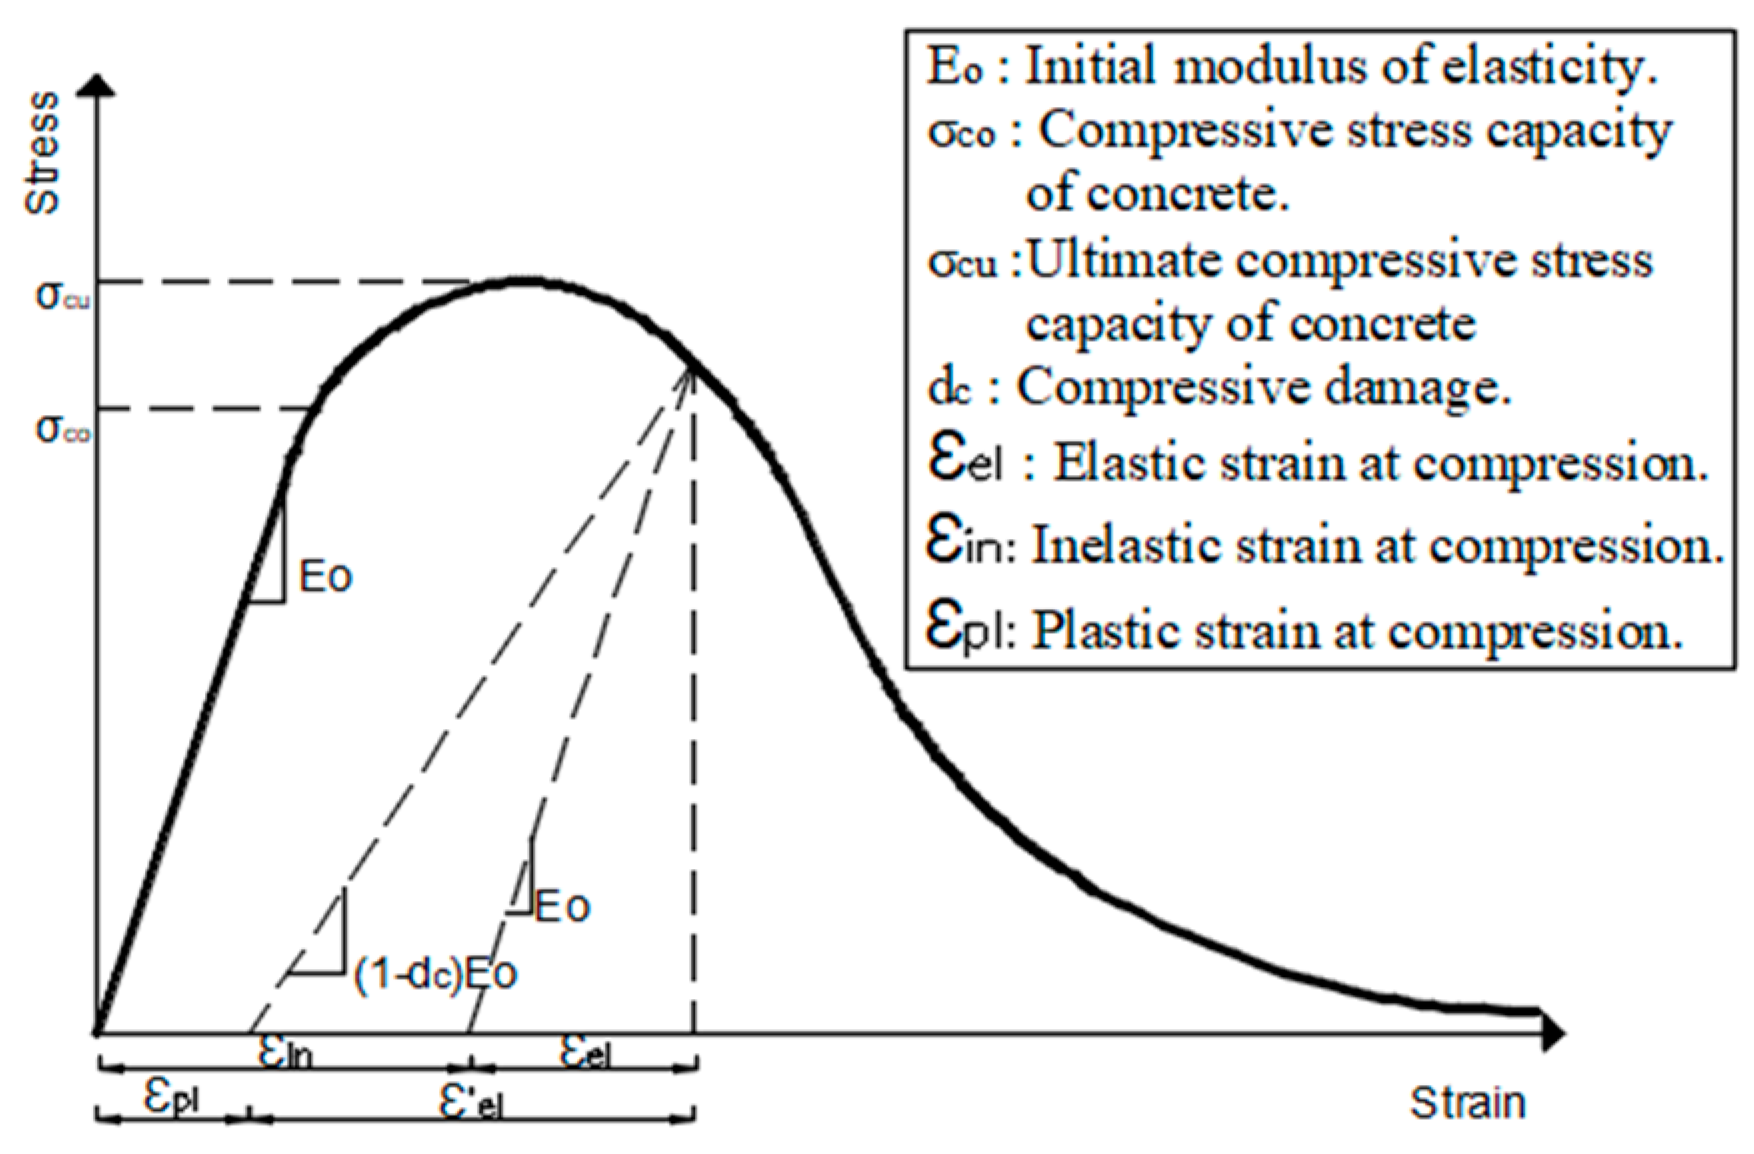
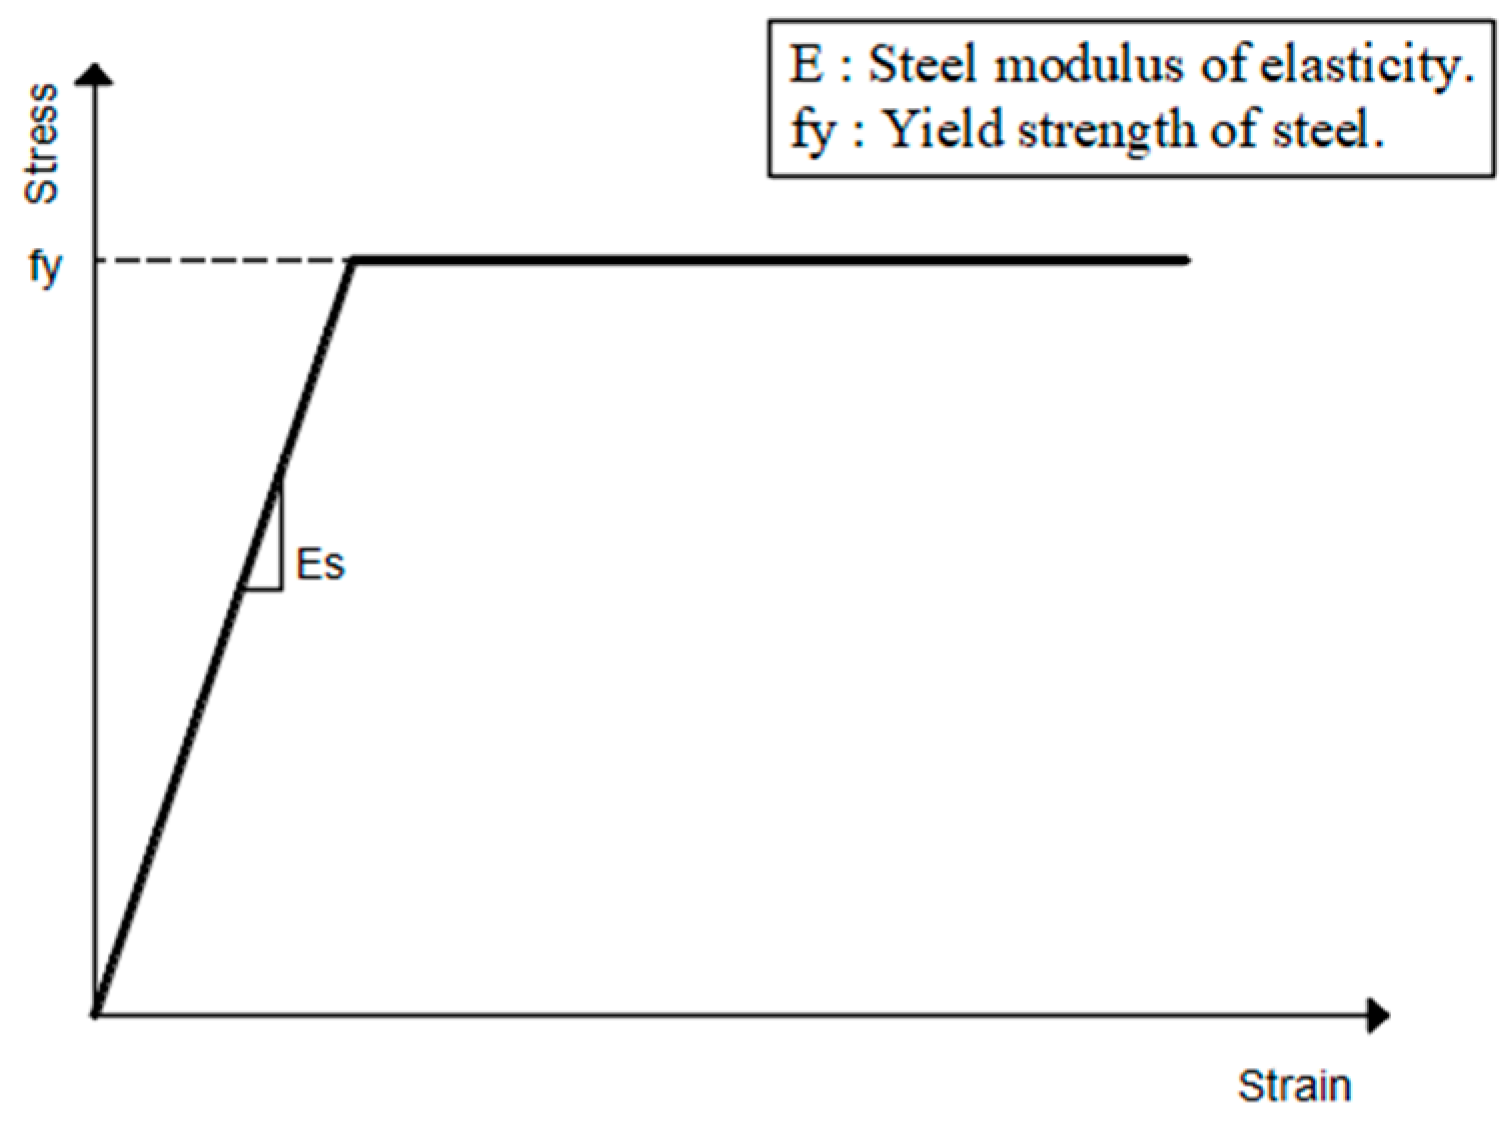
2.6. Numerical Modeling
3. Results and Discussion
3.1. Experimental Results
3.2. Numerical Results
4. Conclusions
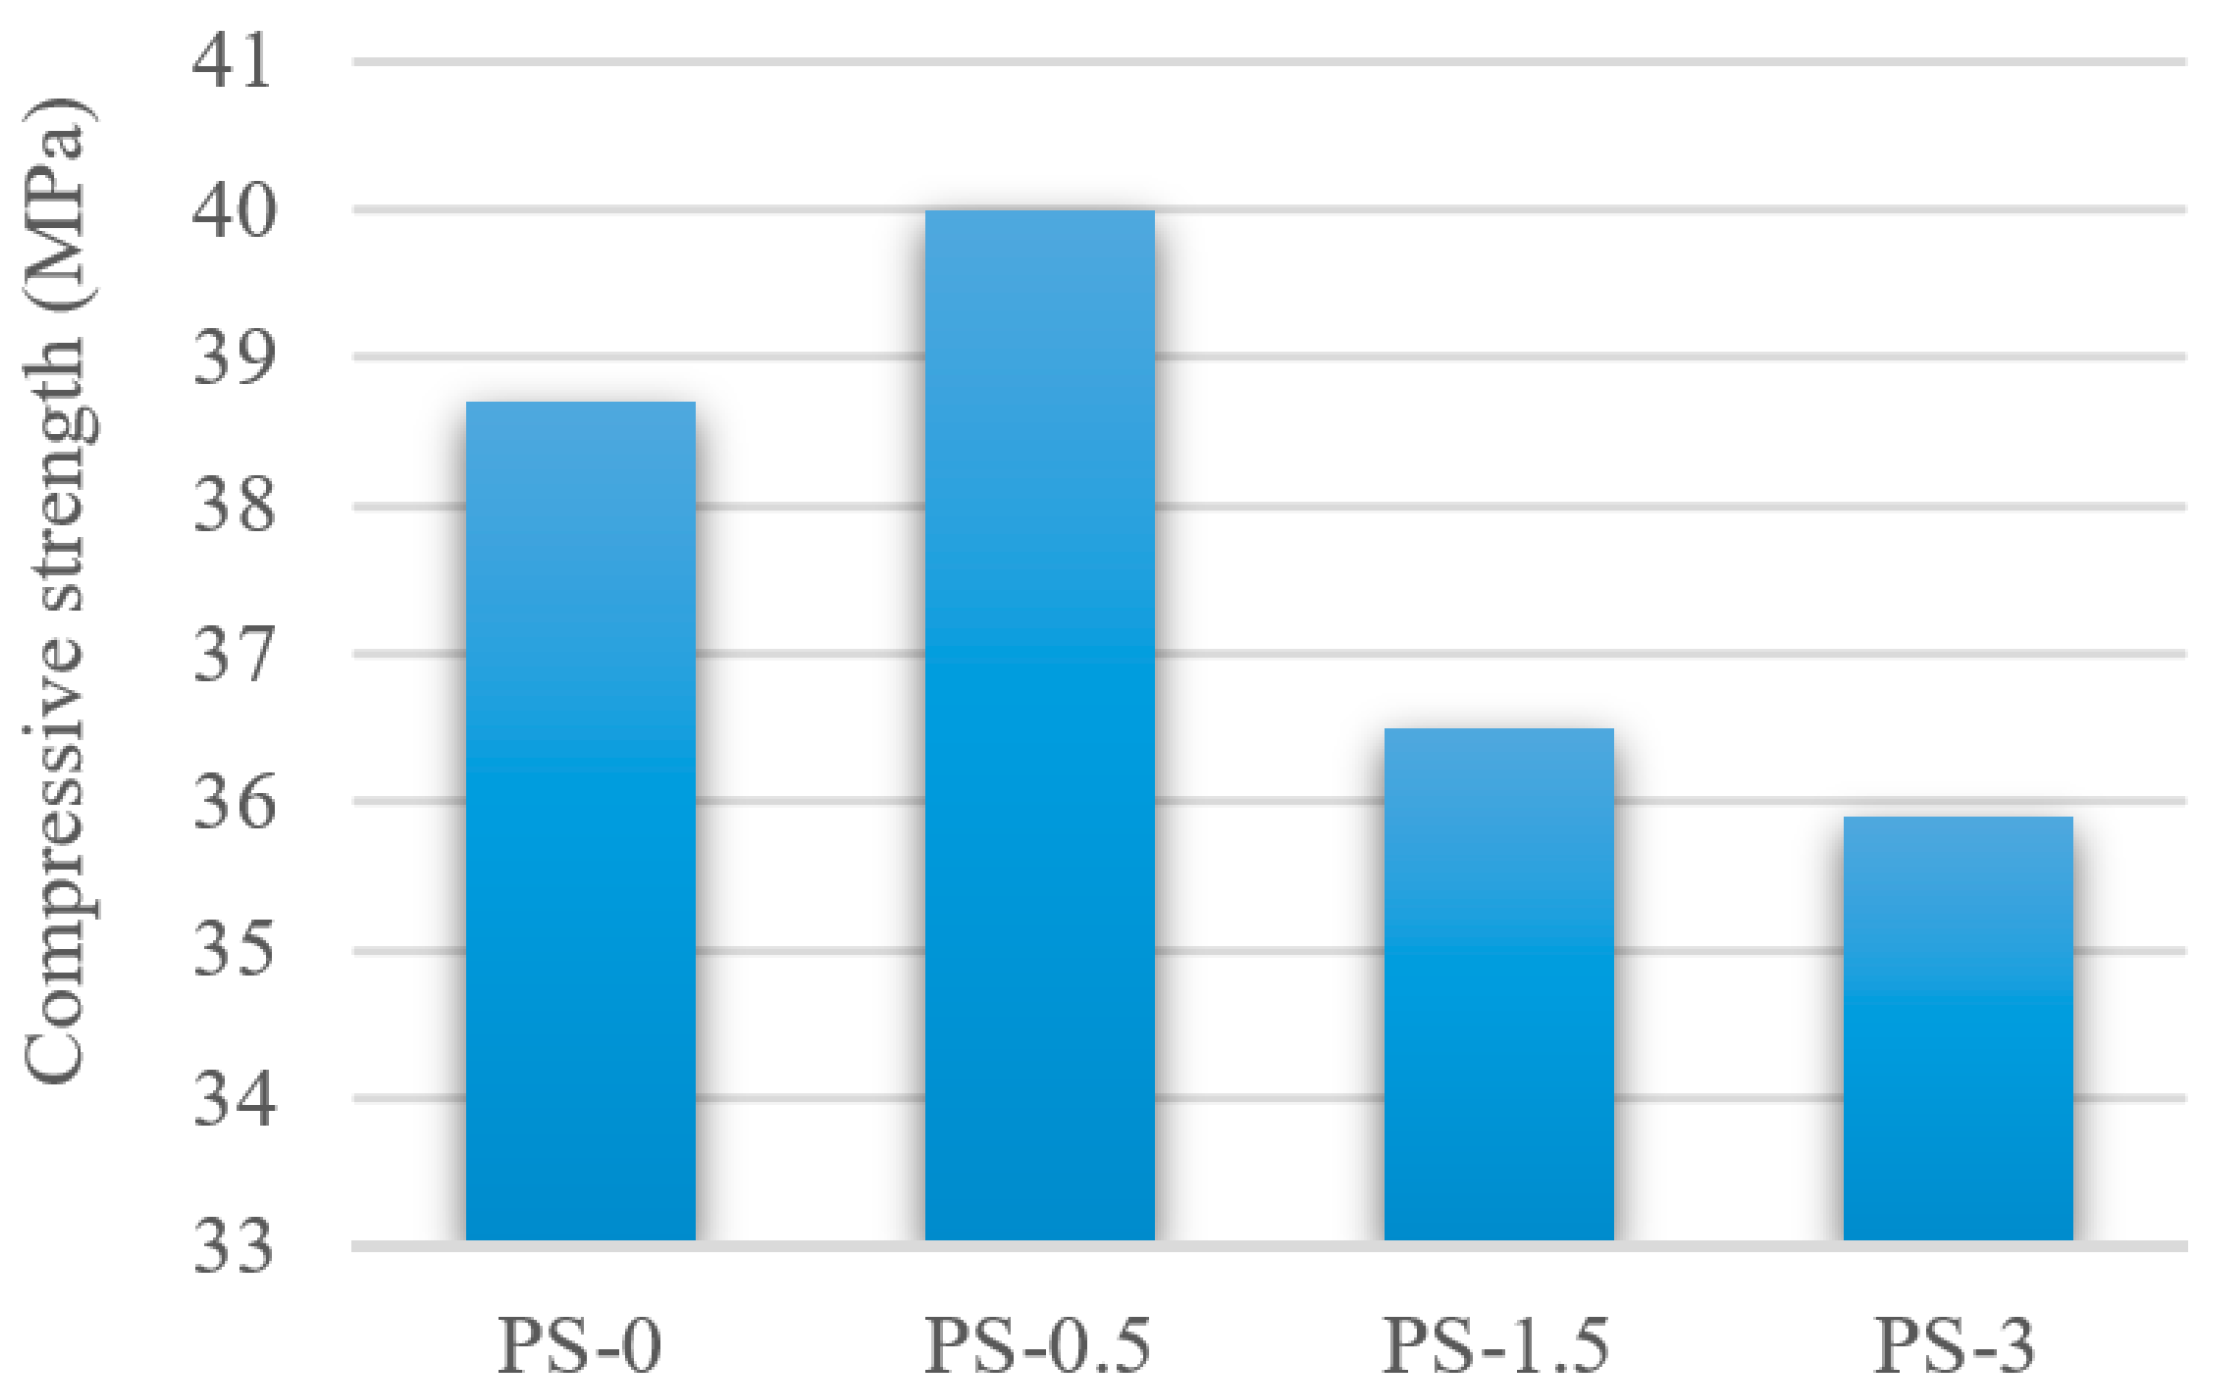
- Adding 0.5% WPS fibers (by volume) resulted in a slight increase (3.4%) in concrete compressive strength. There was a decrease in compressive strength by 5.7% and 7.2% for concrete containing 1.5% and 3% WPS fibers respectively.
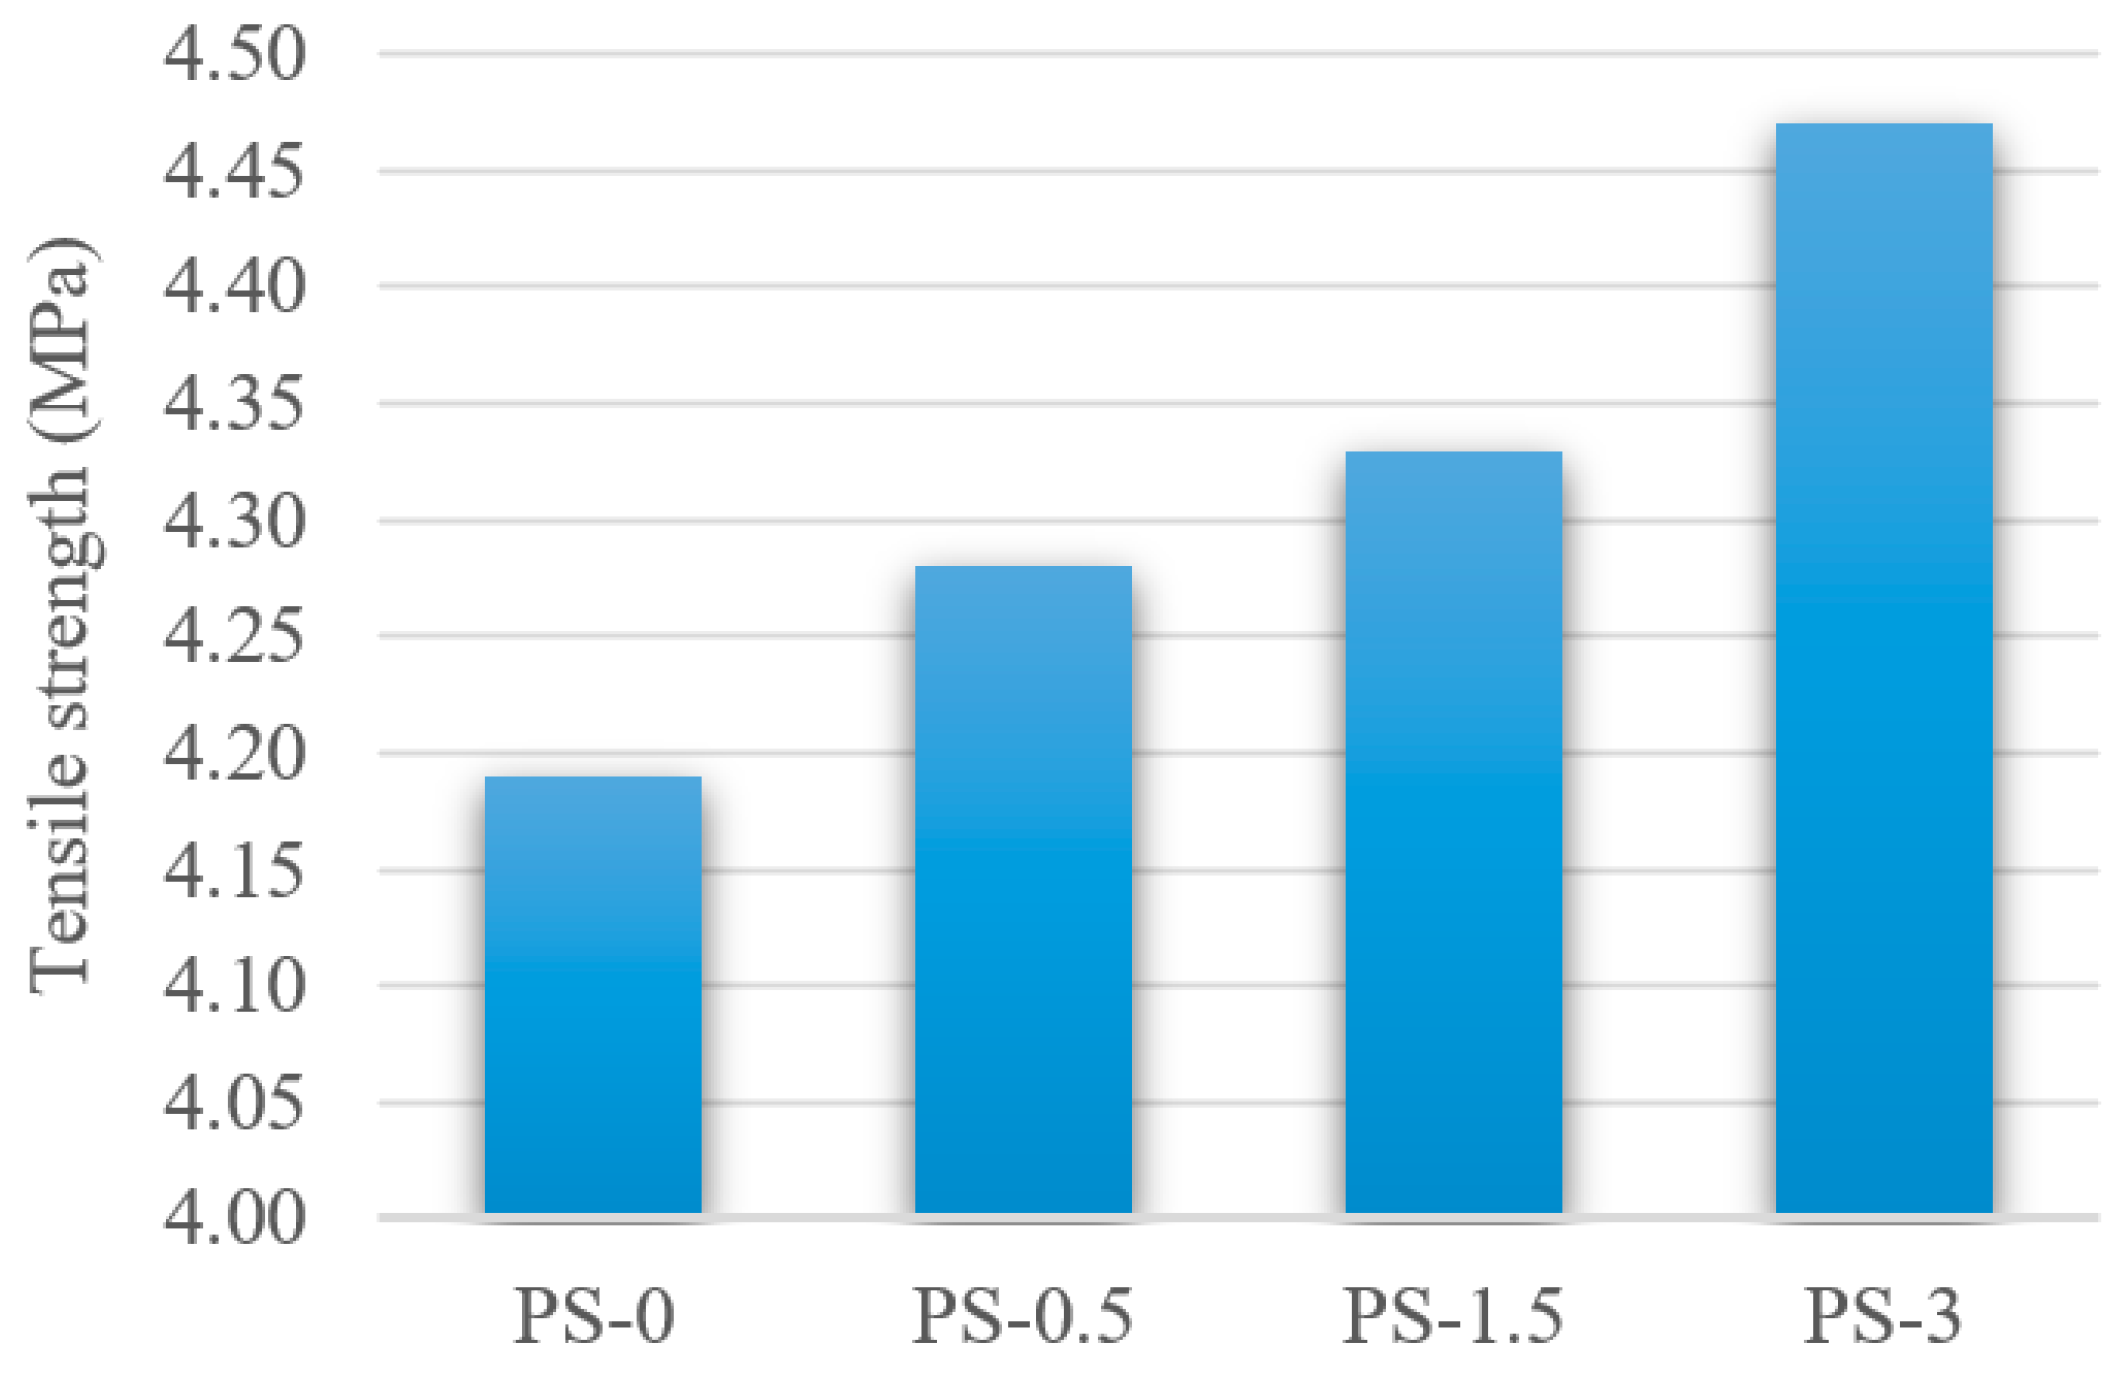
- Adding WPS fibers showed an increase in the split tensile strength of concrete. As the percentage of WPS increased, the split tensile strength of concrete increased. The increasing percentages were 2.2%, 3.3% and 6.7% for specimens PS-0.5, PS-1.5 and PS-3 respectively. There was a slight increase in the ratio of split tensile to compressive strength from 10.8% for control specimen (PS-0) to 12.5% for specimen PS-3.
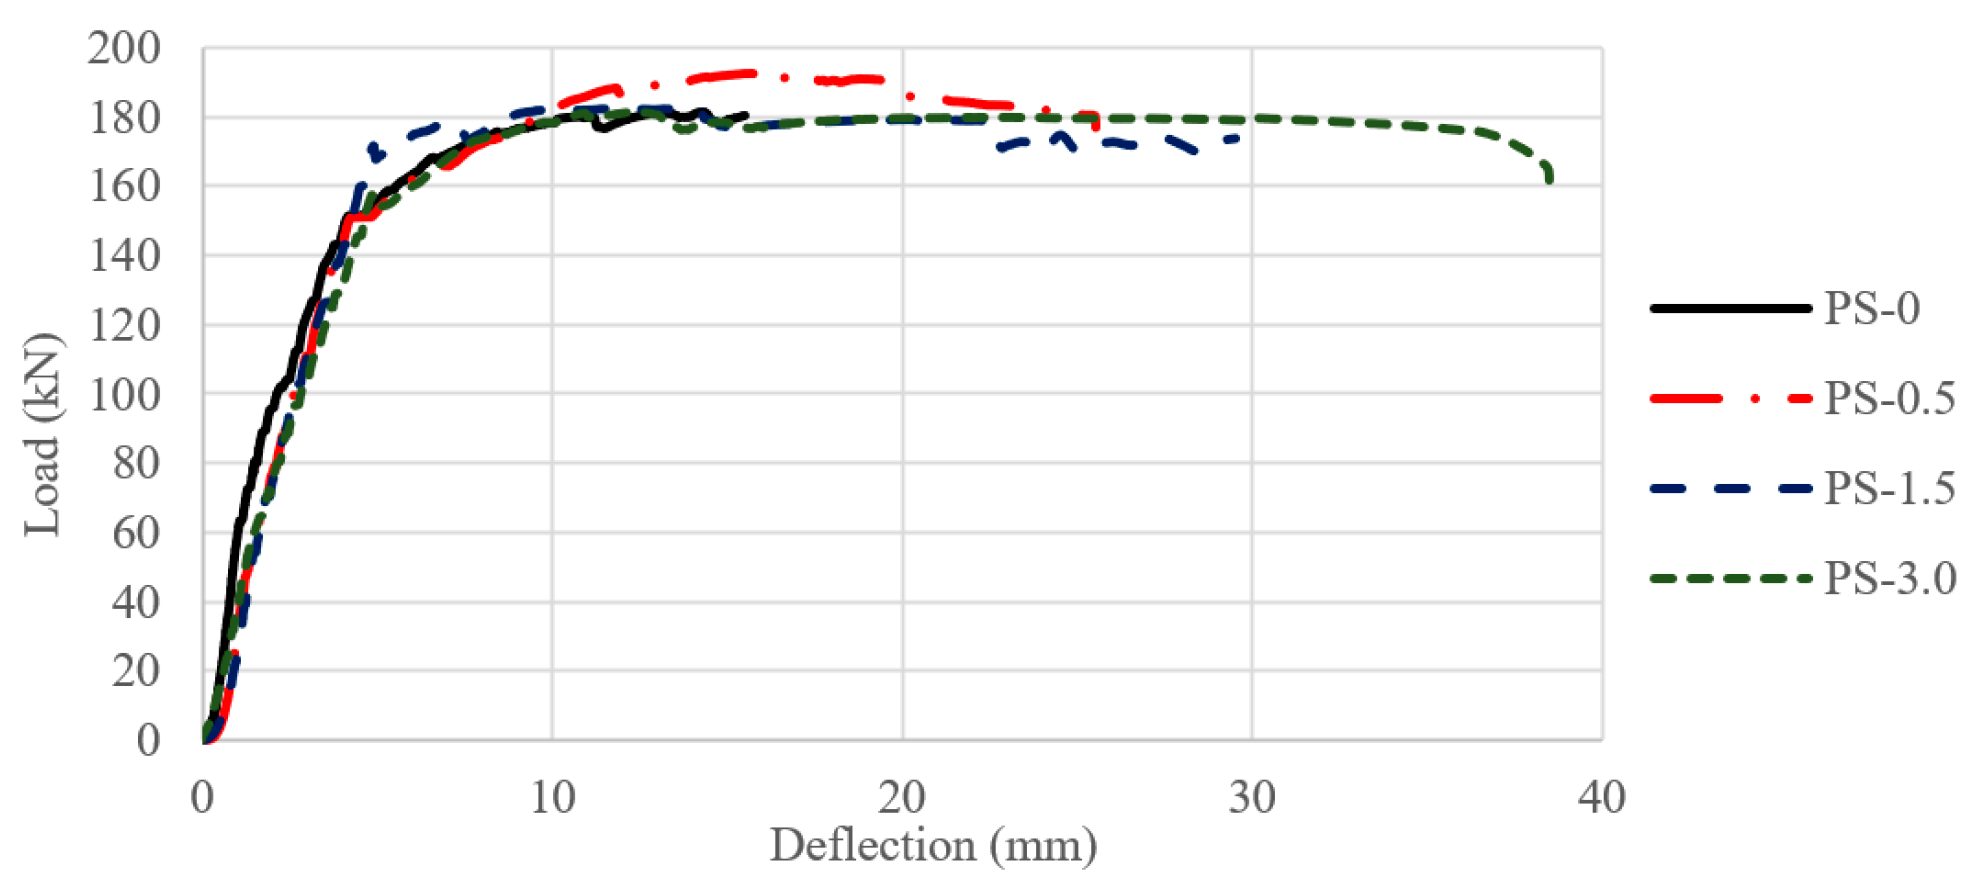
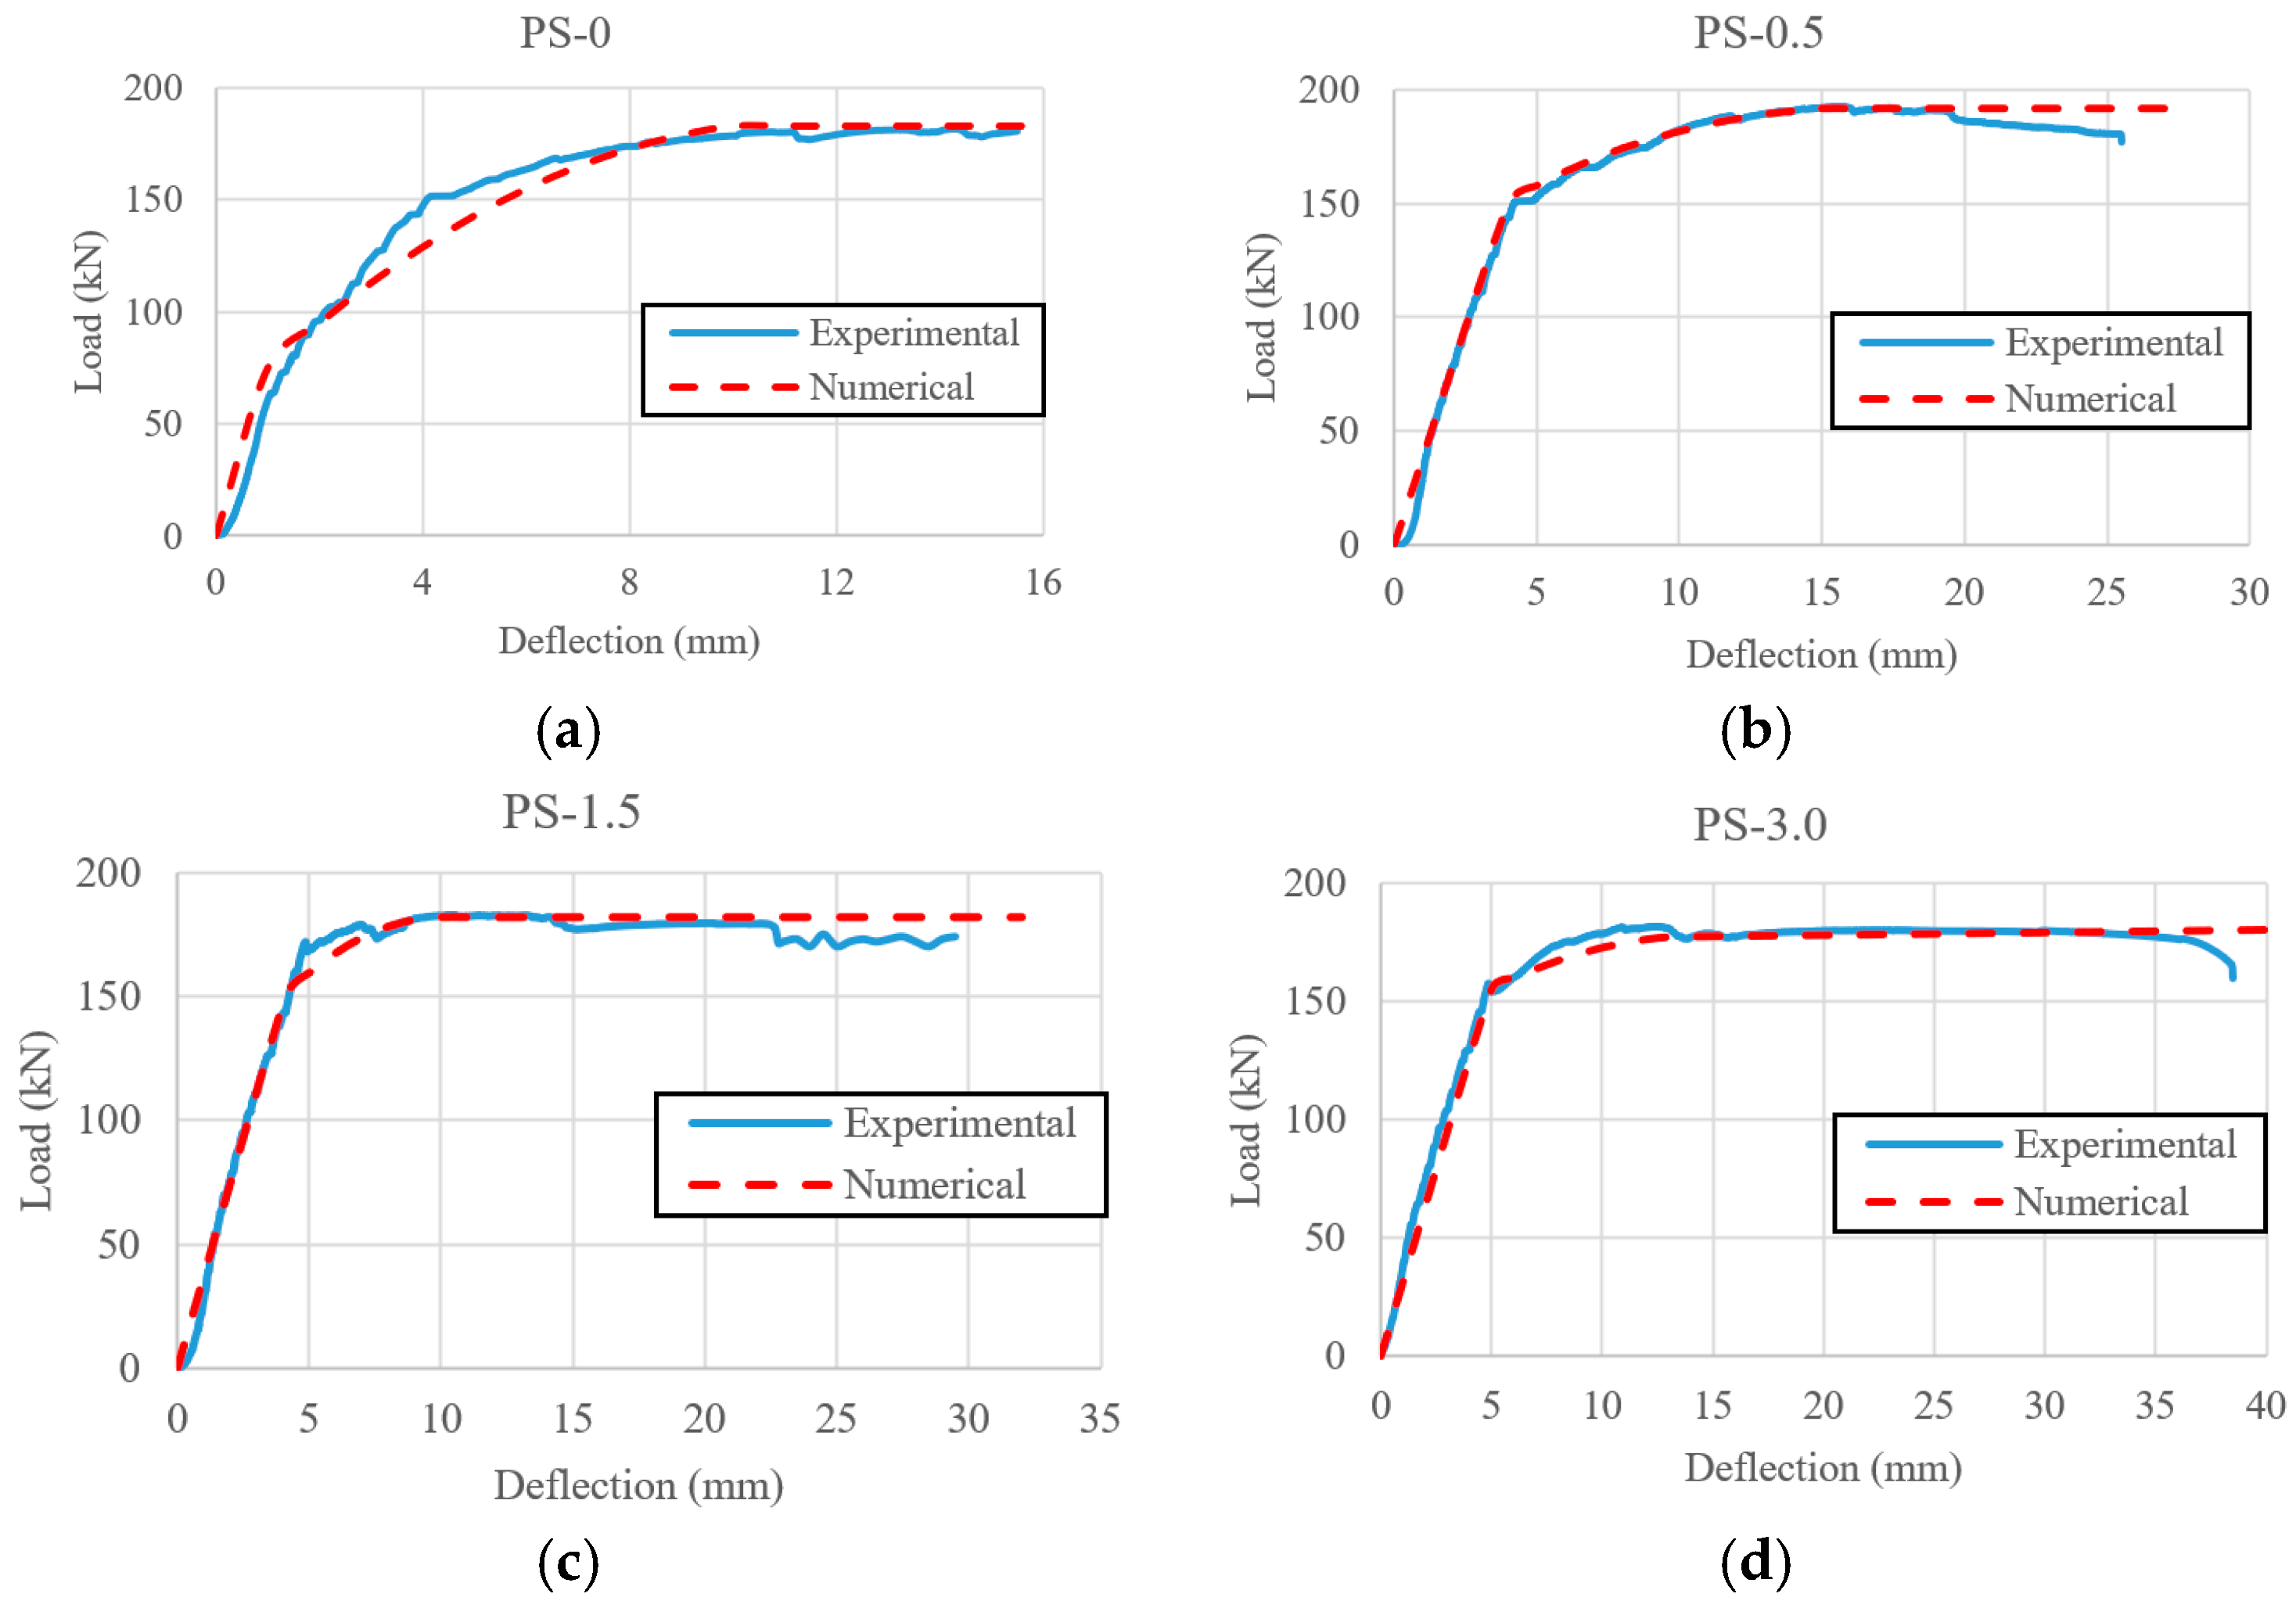
- The load deflection curves showed a better ductility as the percentage of WPS fiber increased from 0 to 3%. The ductility factor ranged from 3.7 for the control beam (PS-0) to 8 for beams containing 3% WPS fiber (PS-3). The percentage increase in ductility was 65%, 70% and 116% for beams PS-0.5, PS-1.5 and PS-3 respectively. As for the maximum load capacity, all beams had nearly the same load regardless of the amount of WPS fiber.
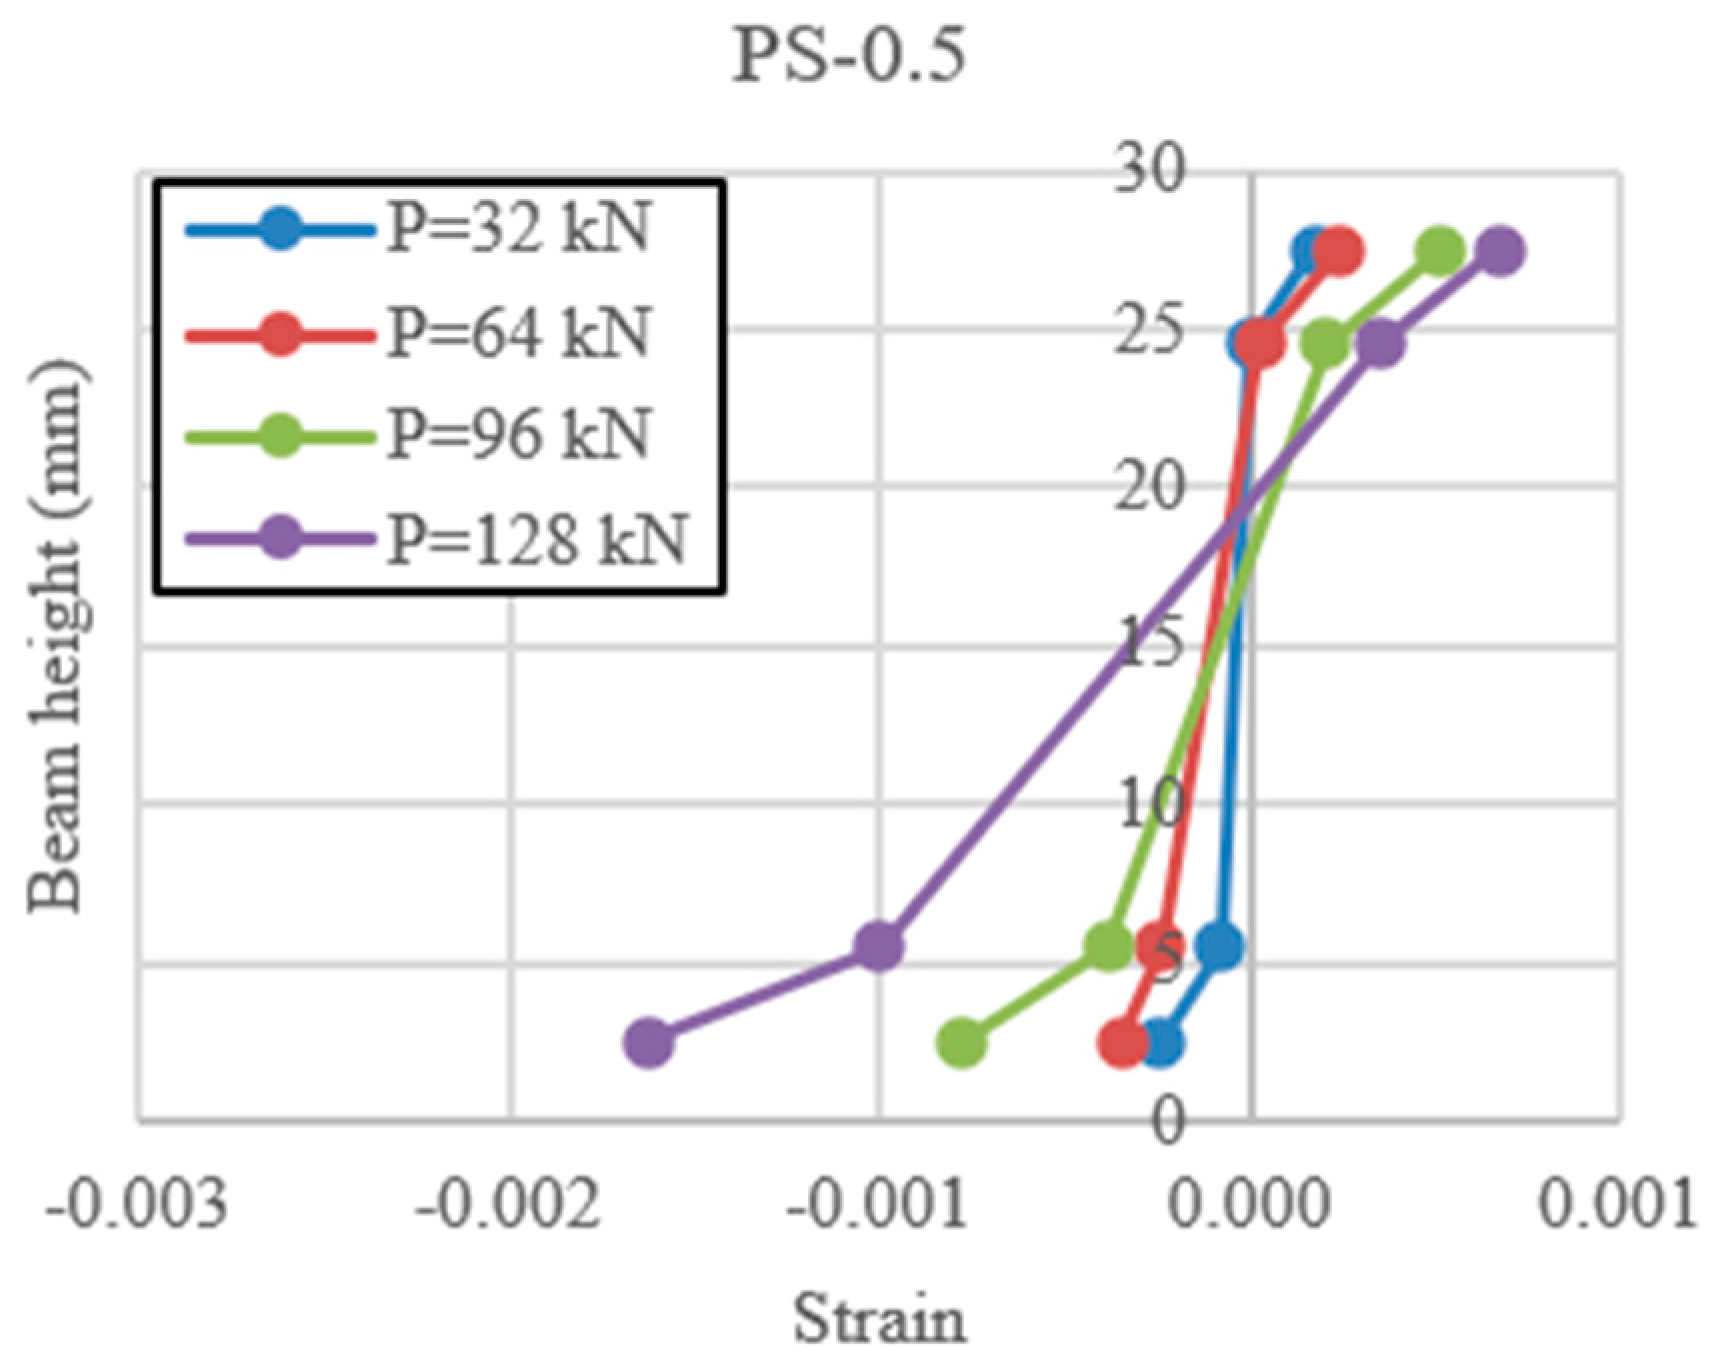
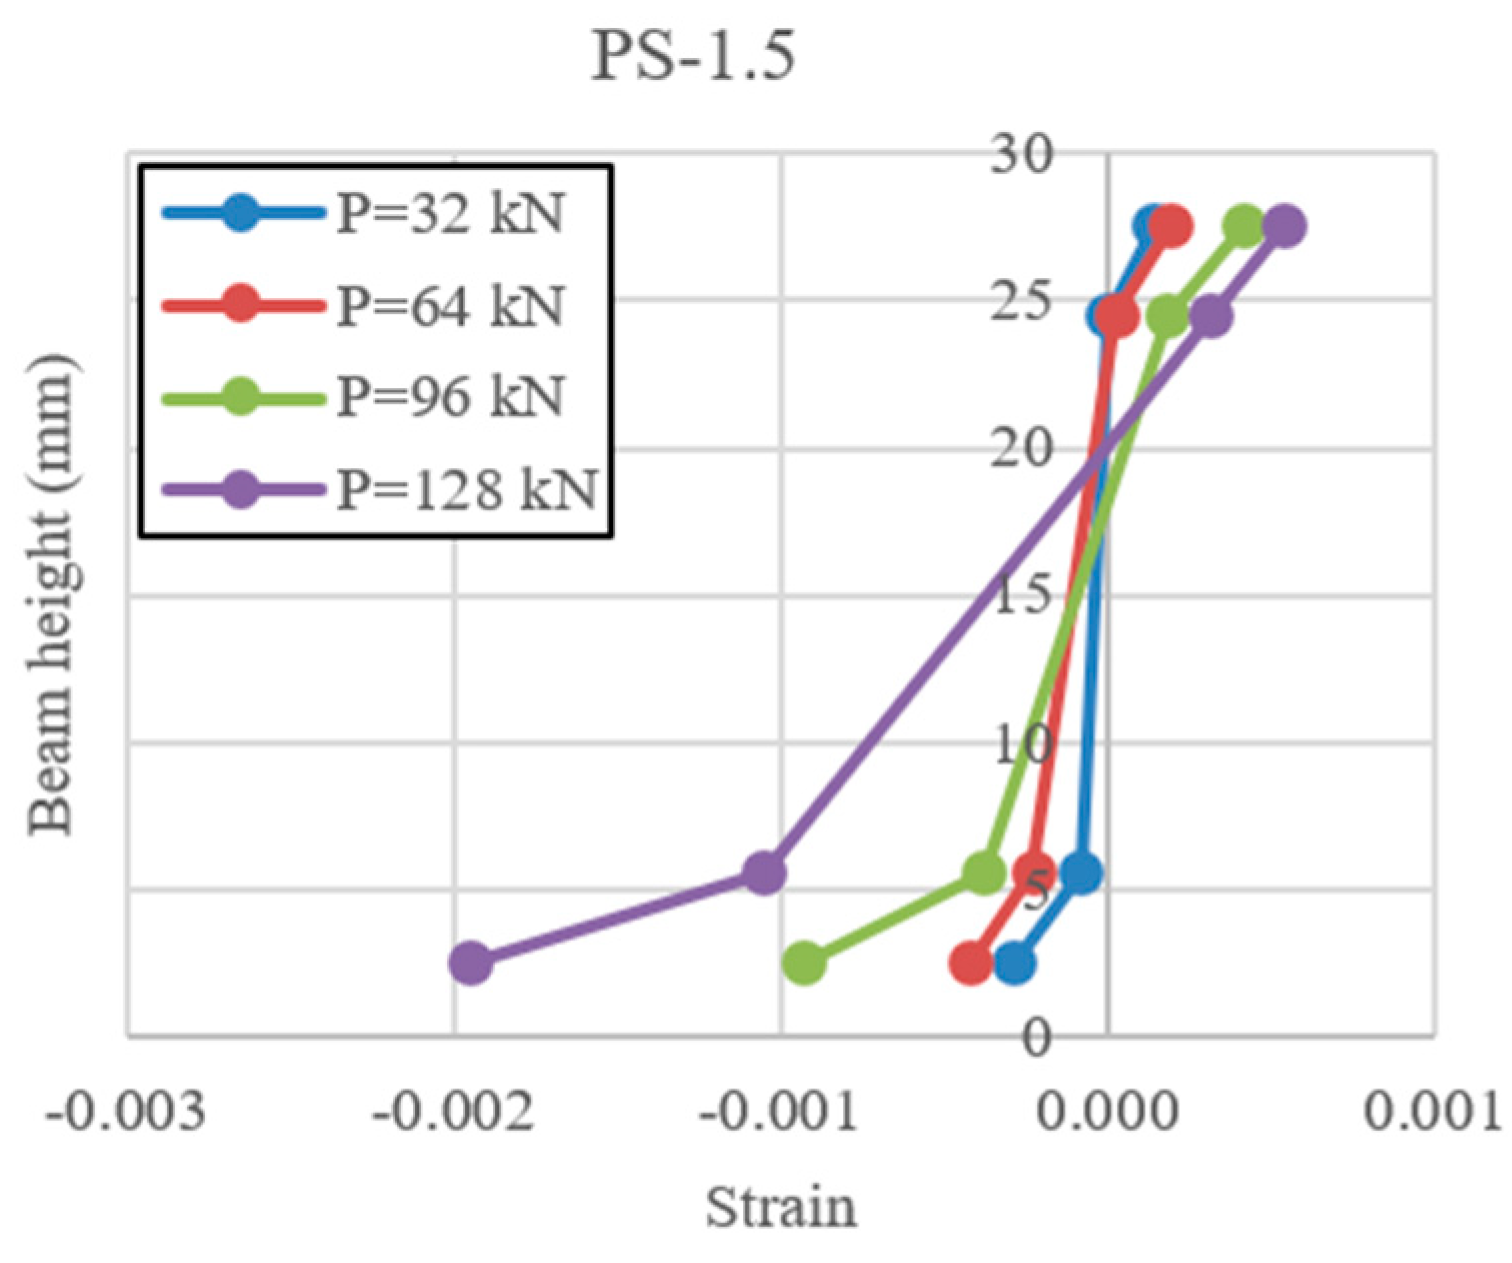
- The higher the percentage of WPS fibers in concrete, the higher the tensile strain at the same loading level. The tensile strain was 0.0012, 0.0016, 0.0019 and 0.0024 for beams PS-0, PS-0.5, PS-1.5 and PS-3 respectively. This is an increase of 100% in the presence of 3% WPS fiber. Additionally, the neutral axis depth was shifted to the top face as the load increased for all beams.
- The load–defection curves derived from the numerical analysis seemed to be similar to those of the experimental curves. The error percentages for both maximum load capacity and maximum deflection ranged from 3% to 10%. This indicates that the parameters used in numerical modeling were suitable for predicting the load deflection curve and failure mode.
- As a general conclusion, using 3% WPS fibers (by volume) results in an adequate strength and higher ductility compared with the control.
Author Contributions
Funding
Conflicts of Interest
References
- Guo, Y.-C.; Zhang, J.-H.; Chen, G.-M.; Xie, Z.-H. Compressive behaviour of concrete structures incorporating recycled concrete aggregates, rubber crumb and reinforced with steel fibre, subjected to elevated temperatures. J. Clean. Prod. 2014, 72, 193–203. [Google Scholar] [CrossRef]
- Su, H.; Yang, J.; Ling, T.-C.; Ghataora, G.S.; Dirar, S. Properties of concrete prepared with waste tyre rubber particles of uniform and varying sizes. J. Clean. Prod. 2015, 91, 288–296. [Google Scholar] [CrossRef]
- Hossain, F.Z.; Shahjalal, M.; Islam, K.; Tiznobaik, M.; Alam, M.S. Mechanical properties of recycled aggregate concrete containing crumb rubber and polypropylene fiber. Constr. Build. Mater. 2019, 225, 983–996. [Google Scholar] [CrossRef]
- Bravo, M.; De Brito, J. Concrete made with used tyre aggregate: Durability-related performance. J. Clean. Prod. 2012, 25, 42–50. [Google Scholar] [CrossRef]
- Khatib, J.; Jahami, A.; Elkordi, A.; Baalbaki, O. Structural performance of reinforced concrete beams containing plastic waste caps. Mag. Civ. Eng. 2019, 91, 73–79. [Google Scholar] [CrossRef]
- Jahami, A.; Khatib, J.; Baalbaki, O.; Sonebi, M. Prediction of Deflection in Reinforced Concrete Beams Containing Plastic Waste. SSRN Electron. J. 2019, 551–555. [Google Scholar] [CrossRef]
- Khatib, J.; Jahami, A.; Baalbaki, O. Flexural characteristics of reinforced concrete beams containing lightweight aggregate in the tensile zone. In Proceedings of the Fifth International Conference on Sustainable Construction Materials and Technologies, Kingston University, London, UK, 14–17 July 2019. ISSN 2515-3048 (Print); ISSN 2515-3056 (Online). [Google Scholar]
- Jahami, A.; Khatib, J.; Firat, S. Load deflection characteristics of reinforced concrete beams incorporating fibers made of waste plastic straw. In Proceedings of the 2nd International Turkish World Engineering and Science Congress, Antalya, Turkey, 7–10 November 2019; pp. 326–333. [Google Scholar]
- Balaguru, P.N.; Shah, S.P. Fibre Reinforced Cement Composites; McGraw-Hill: New York, NY, USA, 1992; Chapter 13; p. 351. [Google Scholar]
- Maniac, B. Experimental study & strength of concrete by using steel & glass fibers. IRJET 2016, 3, 261–267. [Google Scholar]
- Fard, A.T.; Soheili, H.; Movafagh, S.R.; Ahmadi, P.F. Combined Effect of glass fiber and polypropylene fiber on mechanical property of self-compacting concrete. Mag. Civ. Eng. 2016, 62, 26–31. [Google Scholar] [CrossRef]
- Vairagade, S.V.; Kene, K.S. Introduction to Steel Fiber Reinforced Concrete on Engineering Performance of Concrete. Int. J. Sci. Technol. Res. 2012, 1, 141. [Google Scholar]
- Yakhlaf, M.; Safiuddin, M.; Soudki, K. Properties of freshly mixed carbon fibre reinforced self-consolidating concrete. Constr. Build. Mater. 2013, 46, 224–231. [Google Scholar] [CrossRef]
- Donnini, J.; Bellezze, T.; Corinaldesi, V. Mechanical, electrical and self-sensing properties of cementitious mortars containing short carbon fibers. J. Build. Eng. 2018, 20, 8–14. [Google Scholar] [CrossRef]
- Samani, M.A.; Lak, S.J. Experimental investigation on the mechanical properties of recycled aggregate concrete reinforced by waste carbon fibers. Int. J. Environ. Sci. Technol. 2018, 16, 4519–4530. [Google Scholar] [CrossRef]
- Phong, N.T.; Fujii, T.; Chuong, B.; Okubo, K. Study on How to Effectively Extract Bamboo Fibers from Raw Bamboo and Wastewater Treatment. J. Mater. Sci. Res. 2011, 1. [Google Scholar] [CrossRef]
- Kim, S.B.; Yi, N.H.; Kim, H.Y.; Kim, J.-H.J.; Song, Y.-C. Material and structural performance evaluation of recycled PET fiber reinforced concrete. Cem. Concr. Compos. 2010, 32, 232–240. [Google Scholar] [CrossRef]
- Foti, D. Use of recycled waste pet bottles fibers for the reinforcement of concrete. Compos. Struct. 2013, 96, 396–404. [Google Scholar] [CrossRef]
- Foti, D. Recycled Waste PET for Sustainable Fiber-Reinforced Concrete; Elsevier Ltd.: Amsterdam, The Netherlands, 2019. [Google Scholar]
- Foti, D. Preliminary analysis of concrete reinforced with waste bottles PET fibers. Constr. Build. Mater. 2011, 25, 1906–1915. [Google Scholar] [CrossRef]
- Wang, J.; Dai, Q.; Si, R.; Guo, S. Mechanical, durability, and microstructural properties of macro synthetic polypropylene (PP) fiber-reinforced rubber concrete. J. Clean. Prod. 2019, 234, 1351–1364. [Google Scholar] [CrossRef]
- Sadrinejad, I.; Madandoust, R.; Ranjbar, M.M. The mechanical and durability properties of concrete containing hybrid synthetic fibers. Constr. Build. Mater. 2018, 178, 72–82. [Google Scholar] [CrossRef]
- Khalid, F.; Irwan, J.; Ibrahim, M.W.; Othman, N.; Shahidan, S. Splitting tensile and pullout behavior of synthetic wastes as fiber-reinforced concrete. Constr. Build. Mater. 2018, 171, 54–64. [Google Scholar] [CrossRef]
- Jahami, A.; Temsah, Y.; Khatib, J. The efficiency of using CFRP as a strengthening technique for reinforced concrete beams subjected to blast loading. Int. J. Adv. Struct. Eng. 2019, 11, 411–420. [Google Scholar] [CrossRef]
- Temsah, Y.; Jahami, A.; Khatib, J.M.; Sonebi, M. Numerical Derivation of Iso-Damaged Curve for a Reinforced Concrete Beam Subjected to Blast Loading. MATEC Web Conf. 2018, 149, 1–5. [Google Scholar] [CrossRef]
- Jahami, A.; Temsah, Y.; Khatib, J.; Baalbaki, O.; Darwiche, M.; Chaaban, S. Impact behavior of rehabilitated post-tensioned slabs previously damaged by impact loading. Mag. Civ. Eng. 2020, 93, 134–146. [Google Scholar] [CrossRef]
- Temsah, Y.; Jahami, A.; Khatib, J.M.; Sonebi, M. Numerical analysis of a reinforced concrete beam under blast loading. MATEC Web Conf. 2018, 149, 02063. [Google Scholar] [CrossRef]
- Temsah, Y.; Jahami, A.; Khatib, J.; Firat, S. Numerical study for RC beams subjected to blast waves. In Proceedings of the 1st International Turkish World Engineering and Science Congress in Antalya, Antalya, Turkey, 7–10 December 2017. [Google Scholar]
- Temsah, Y.; Jahami, A.; Khatib, J.; Firat, S. Single degree of freedom approach of a reinforced concrete beam subjected to blast loading. In Proceedings of the 1st International Turkish World Engineering and Science Congress in Antalya, Antalya, Turkey, 7–10 December 2017. [Google Scholar]
- ASTM C192/C192M—19 Standard Practice for Making and Curing Concrete Test Specimens in the Laboratory. Available online: https://www.astm.org/Standards/C192 (accessed on 31 March 2020).
- BS EN 934-2: Admixtures for Concrete, Mortar and Grout Part 2: Concrete Admixtures—Definitions, Requirements, Conformity, Marking and Labelling. Available online: https://global.ihs.com/doc_detail.cfm?document_name=BSEN934-2&item_s_key=00290909 (accessed on 31 March 2020).
- Khatib, J.; Jahami, A.; Baalbaki, O.; Elkordi, A.; Bakri, A.; Alaina, R. Performance of Concrete Containing Waste Plastic Straw Fibers. BAU J. Sci. Technol. 2020, 1, 1–10. [Google Scholar]
- ASTM C39/C39M—20 Standard Test Method for Compressive Strength of Cylindrical Concrete Specimens. Available online: https://www.astm.org/Standards/C39 (accessed on 27 March 2020).
- American Society for Testing and Materials. ASTM C496/C496M-17, Standard Test Method for Splitting Tensile Strength of Cylindrical Concrete Specimens; ASTM International: West Conshohocken, PA, USA, 2017; p. 5. [Google Scholar]
- ASTM D790-03, Standard Test Methods for Flexural Properties of Unreinforced and Reinforced Plastics and Electrical Insulating Materials; ASTM International: West Conshohocken, PA, USA, 2003; Available online: www.astm.org (accessed on 9 December 2019).
- ASTM C78/C78M-18, Standard Test Method for Flexural Strength of Concrete (Using Simple Beam with Third-Point Loading); ASTM International: West Conshohocken, PA, USA, 2018; Available online: www.astm.org (accessed on 9 December 2019).
- ASTM C1609/C1609M-19, Standard Test Method for Flexural Performance of Fiber-Reinforced Concrete (Using Beam with Third-Point Loading); ASTM International: West Conshohocken, PA, USA, 2019; Available online: www.astm.org (accessed on 9 December 2019).
- ASTM E606/E606M-12, Standard Test Method for Strain-Controlled Fatigue Testing; ASTM International: West Conshohocken, PA, USA, 2012; Available online: www.astm.org (accessed on 9 December 2019).
- ASTM E251-92(2014), Standard Test Methods for Performance Characteristics of Metallic Bonded Resistance Strain Gages; ASTM International: West Conshohocken, PA, USA, 2014; Available online: www.astm.org (accessed on 9 December 2019).
- ACI Committee. Building Code Requirements for Structural Concrete (ACI 318-14); American Concrete Institute, ACI: Farmington Hills, MI, USA, 2014. [Google Scholar]


| Color | Storage Temperature | Chemical Base | Density | PH Value | Quantity | Mixing Time |
|---|---|---|---|---|---|---|
| Yellowish liquid | +5 °C to +35 °C | Synthetic Poly Carboxylates Ethers | 1.05 Kg/L | 4.3 + 0.5 | 0.6–2% of the weight of cement | 60 s |
| Weight (kg/m3) | ||||||
|---|---|---|---|---|---|---|
| Mix | Cement | Sand | Water | Gravel | WPS * | Admixture ** |
| PS-0 | 670 | 670 | 270 | 1340 | 0 | 0 |
| PS-0.5 | 670 | 670 | 270 | 1340 | 0.5 | 0.1 |
| PS-1.5 | 670 | 670 | 270 | 1340 | 1.5 | 0.15 |
| PS-3 | 670 | 670 | 270 | 1340 | 3 | 0.2 |
| Sample | “fc” Compressive Strength(MPa) | “ft” Split Tensile Strength (MPa) | ft/fc |
|---|---|---|---|
| PS-0 | 38.70 | 4.19 | 0.108 |
| PS-0.5 | 40.00 | 4.28 | 0.107 |
| PS-1.5 | 36.50 | 4.33 | 0.119 |
| PS-3 | 35.90 | 4.47 | 0.125 |
| Beam | Maximum Load “Pmax” (kN) | Pmax(PS)/Pmax(0) | |||
|---|---|---|---|---|---|
| PS-0 | 181.4 | --- | 15.5 | 4.2 | 3.7 |
| PS-0.5 | 192.7 | 1.062 | 25.5 | 4.2 | 6.1 |
| PS-1.5 | 182.7 | 1.007 | 29.0 | 4.6 | 6.3 |
| PS-3.0 | 181.3 | 0.999 | 38.4 | 4.8 | 8.0 |
| PS-0 | PS-0.5 | PS-1.5 | PS-3 | ||||
|---|---|---|---|---|---|---|---|
| P (kN) | x (mm) | P (kN) | x (mm) | P (kN) | x (mm) | P (kN) | x (mm) |
| 32 | 13.6 | 32 | 13.2 | 32 | 11.5 | 32 | 10.8 |
| 64 | 13.3 | 64 | 12.9 | 64 | 10.9 | 64 | 10.5 |
| 96 | 12.1 | 96 | 12.5 | 96 | 10.2 | 96 | 9.5 |
| 128 | 10.5 | 128 | 9.8 | 128 | 7.9 | 128 | 7.4 |
| Experimental | Numerical | |||
|---|---|---|---|---|
| Beam | Maximum Load “Pmax” (kN) | Maximum Deflection | Maximum Load “Pmax” (kN) | Maximum Deflection |
| PS-0 | 181.4 | 15.5 | 183.0 | 16.0 |
| PS-0.5 | 192.7 | 25.5 | 192.0 | 27.0 |
| PS-1.5 | 182.7 | 29.0 | 182.0 | 32.0 |
| PS-3.0 | 181.3 | 38.4 | 180.0 | 41.0 |
Publisher’s Note: MDPI stays neutral with regard to jurisdictional claims in published maps and institutional affiliations. |
© 2020 by the authors. Licensee MDPI, Basel, Switzerland. This article is an open access article distributed under the terms and conditions of the Creative Commons Attribution (CC BY) license (http://creativecommons.org/licenses/by/4.0/).
Share and Cite
Khatib, J.M.; Jahami, A.; Elkordi, A.; Abdelgader, H.; Sonebi, M. Structural Assessment of Reinforced Concrete Beams Incorporating Waste Plastic Straws. Environments 2020, 7, 96. https://doi.org/10.3390/environments7110096
Khatib JM, Jahami A, Elkordi A, Abdelgader H, Sonebi M. Structural Assessment of Reinforced Concrete Beams Incorporating Waste Plastic Straws. Environments. 2020; 7(11):96. https://doi.org/10.3390/environments7110096
Chicago/Turabian StyleKhatib, Jamal M., Ali Jahami, Adel Elkordi, Hakim Abdelgader, and Mohammed Sonebi. 2020. "Structural Assessment of Reinforced Concrete Beams Incorporating Waste Plastic Straws" Environments 7, no. 11: 96. https://doi.org/10.3390/environments7110096
APA StyleKhatib, J. M., Jahami, A., Elkordi, A., Abdelgader, H., & Sonebi, M. (2020). Structural Assessment of Reinforced Concrete Beams Incorporating Waste Plastic Straws. Environments, 7(11), 96. https://doi.org/10.3390/environments7110096