1. Introduction
Over recent decades, many scientists all over the world have investigated the health impact due to PM
10 Lee et al. (2020) [
1] studied the adverse health effects of particulate matter (PM) in the mortality of patients diagnosed with asthma in Seoul, Korea. They have found that average PM
10 exposures are associated with non-accidental mortality in patients with chronic obstructive pulmonary disease (COPD) and especially those diagnosed with asthma-chronic obstructive (ACO). In addition, the adverse effects of PM
10 exposure are reported to be more severe in women and never-smokers. Hwang et al. (2020) [
2] studied the impact of air pollution on breast cancer incidence and mortality in South Korea. According to their results, no significant association is found between air pollutant exposure and breast cancer mortality rate except the exposure that is due to PM
10 pollutants. Zanobetti and Schwartz (2009) [
3] applied a city- and season-specific Poisson regression in 112 U.S.A cities in order to examine the association of the mean PM
2.5 and PM coarse exposure with daily deaths. They also combined the city-specific estimates using a total approach of random effects by season and region. According to their results, there is an increased risk of mortality for all causes associated with the exposure to PM
2.5, the corresponding risks are higher than those previously observed for PM
10 exposure and the coarse particles are also associated with more deaths. Pope et al. (1992) [
4], studied the daily mortality in relation to the PM
10 pollution in Utah Valley (U.S.A) between April 1985 and December 1989. It was found that a local steel mill was a major source of particulate air pollution in the area, in which concentrations of ozone, sulphur dioxide and nitrogen dioxide are generally low. The total respiratory and cardiovascular mortality were found to be related to the 5-day moving average PM
10 concentration. The 24-hour average concentrations ranged up to 365 μg/m
3, with 5-day moving average concentrations of up to 297 μg/m
3 in the observation period [
4,
5]. Finally, epidemiological studies have traditionally played an important role in deriving guideline values for airborne suspended particulate matter [
6].
Due to the major concern on the adverse health effects of PM
10 exposure, many researchers have studied the variations of PM
10 time series concentrations in cities all over the world. For Athens, the Capital of Greece, a large number of papers have been published, which depict that PM
10 pollutants are among the most problematic ones for its inhabitants [
6,
7,
8,
9,
10,
11,
12]. The recordings of PM
10 concentrations started in 2001 in the GAA. The measurements are performed by the Department of Environmental Protection of the Hellenic Ministry of Environment and Energy with a sampling frequency of 1 min
−1. The present study employs a sub-series of the whole data-set; specifically, the average daily concentrations between 2001 and 2018 from five different PM
10 monitoring stations installed within the GAA. This sub-series is considered more suitable for a long-term analysis because it averages the intra-day variations and minimises, consequently, the overall bias to the estimations. The methodological approach is multi-level. Descriptive statistics are employed to outline the general behaviour of the series. Mean monthly PM
10 concentrations are utilised for each one of the five monitoring stations to find the seasonality of PM
10 time-series. Furthermore, the annual trend of PM
10 concentrations is investigated in order to be related with some measures that have been taken by the state during the examined time period, as well as with the Greek economic crisis. Then, the correlation between the mean annual PM
10 concentrations with the annual number of exceedances (days with mean daily concentration above the European threshold of 50 μg/m
3) is studied. Finally, the intraday variation of PM
10 concentrations at the five examined locations is extracted to investigate the sources influence on the formation of hourly concentrations. The different approaches are analysed and discussed.
3. Results
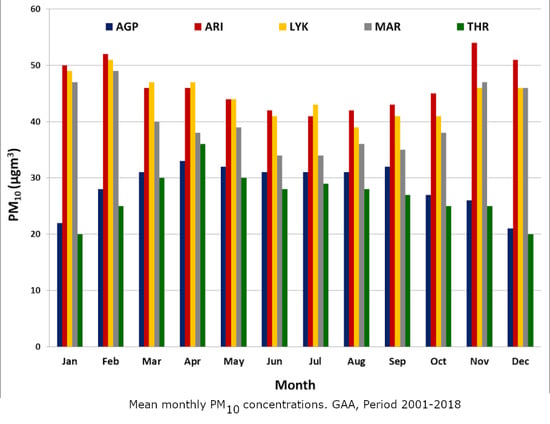
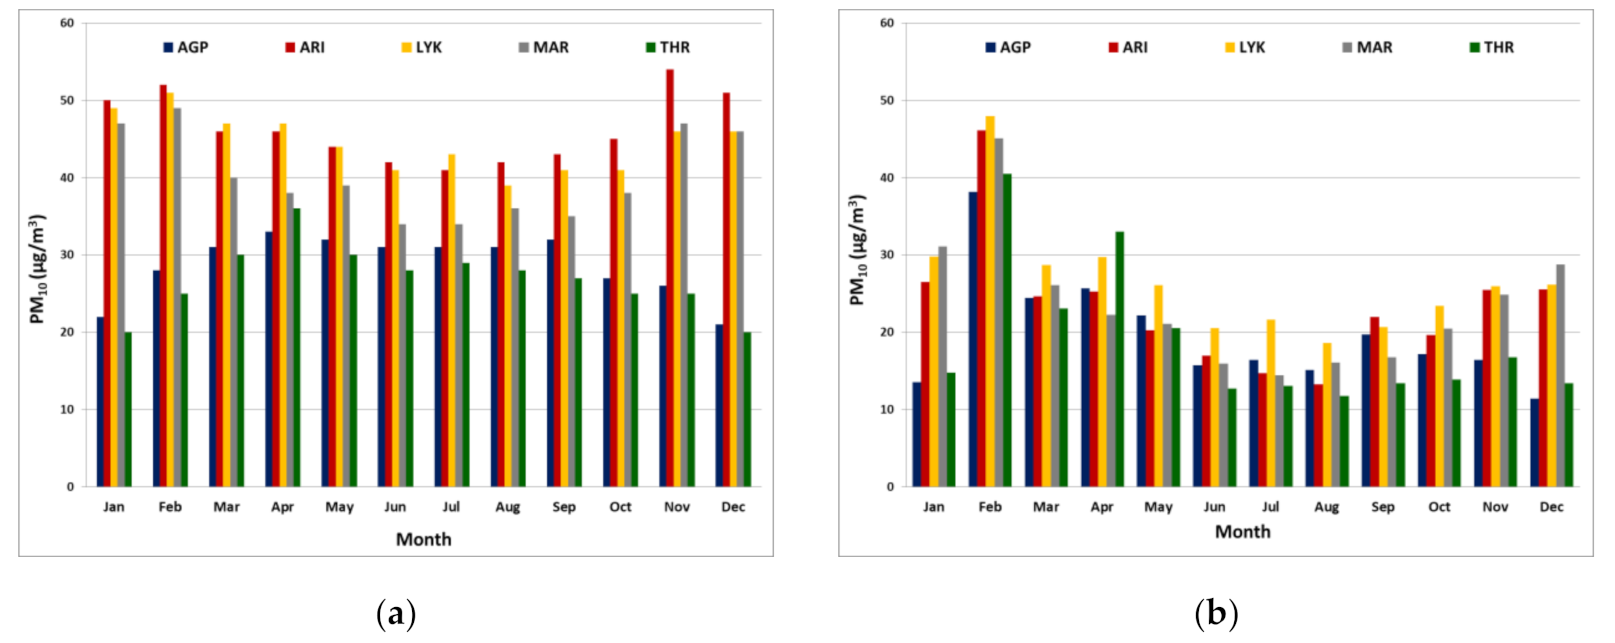
Figure 2 presents the mean monthly PM
10 concentrations and the standard deviation of the mean monthly PM
10 concentrations through the examined time period 2001–2018 for the five locations within the GAA. As can be observed from
Figure 2, the AGP and THR stations present two different types of seasonality. The first type refers to the high concentrations which appear during the warm periods of the year (May-September), while the second type, to the low concentrations during the cold periods of the year (October-April). Both stations are characterised as Suburban-Background (SB) sites which means that they are affected indirectly from the sources of pollutants. Note that the pollution level of SB stations is not influenced, significantly, by any single source or street, but rather, by the integrated contribution from all sources around these, e.g., by all traffic and nearby combustion sources in a city. The other three examined air pollution stations, namely ARI, MAR and LYK, exhibit a totally different kind of seasonality. It is important that both ARI and MAR stations are referred by the HMEE as Urban-Traffic (UT) stations. These types of stations (UT) are characterised by a continuously built-up urban area with medium and high buildings, such that their pollution level is determined, predominantly, by the emissions from the nearby traffic (roads, motorways, highways). In contrast, although the LYK station is mentioned by the Hellenic authorities (HMEE) as an SB station, according to
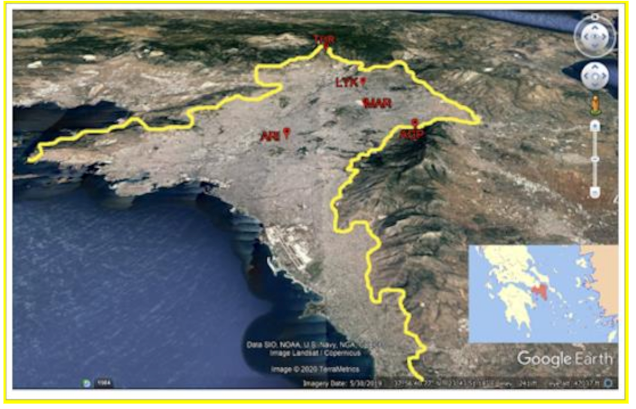
Figure 2a, the station behaves, more or less, as a UT station. Due to this, according to the opinion of the authors, the LYK station should be characterised as a UT station. This claim is reinforced by the station's position within the GAA (
Figure 1). Further arguments will be presented later in text. In addition, the LYK station is located within an urban environment 500 ~ 600 meters from two main boulevards and about 1.5 km from the highway connecting the central and northern Greece.
Concerning the standard deviation of the mean monthly PM
10 concentrations (
Figure 2b) it can be observed that during summer months is lower than the winter months. This is maybe due to the fact that during summer months, the PM
10 sources present a more “stable” behaviour than the winter months where the weather conditions determine oil consumption for heating purposes, thus increasing or decreasing particulate emissions. Moreover, during summer the meteorological conditions are stable, presenting a very similar synoptic pattern with no abrupt changes from day to day. In addition, on cold nights with clear skies during the winter, there is often very strong thermal stability that captures air pollutants near the ground and results in very high concentrations. January and February are the coldest months of the year for the GAA. February, for example, often presents great temperature differences and weather changes from day to day leading, according to the opinion of the authors, to great daily differences of oil and wood consumption for heating purpose and, as a result, to daily differences of PM
10 emissions. The reader should note that a further statistical investigation of potential associations between PM
10 concentrations and meteorological parameters such as wind speed, rain, etc. would provide additional evidence but this is out of the scope of the specific paper and is left as a future work. Finally, the high standard deviation during spring months (March, April and May) could be due to the Saharan dust event which mainly occurs in Athens during spring period [
16,
17,
18]. According to Dimitriou et al. (2019) [
18], the maximum probability of dust events, during the period 2018–2018, was detected in spring, when the dust transport pathways were also vertically extended. Dust intrusions from the Sahara Desert, mainly from areas in Egypt and Libya, were associated with daily PM
10 episodes (PM
10 > 50 μg/m
3) during all seasons, mainly through back trajectories within the layer up to 1000 m above ground level. Nevertheless, during spring the frequency of occurrence of the dust episodes was the highest and the dust pathways were vertically extended in comparison with the other seasons. The daily PM
10 episodes in winter were mainly connected to northern air masses approaching from the Balkan Peninsula and North Greece [
18]. The phenomenon is not observed so often in summer because in Greece, strong north winds, known as the “Etesians” or “Meltemia”, prevail [
19,
20].
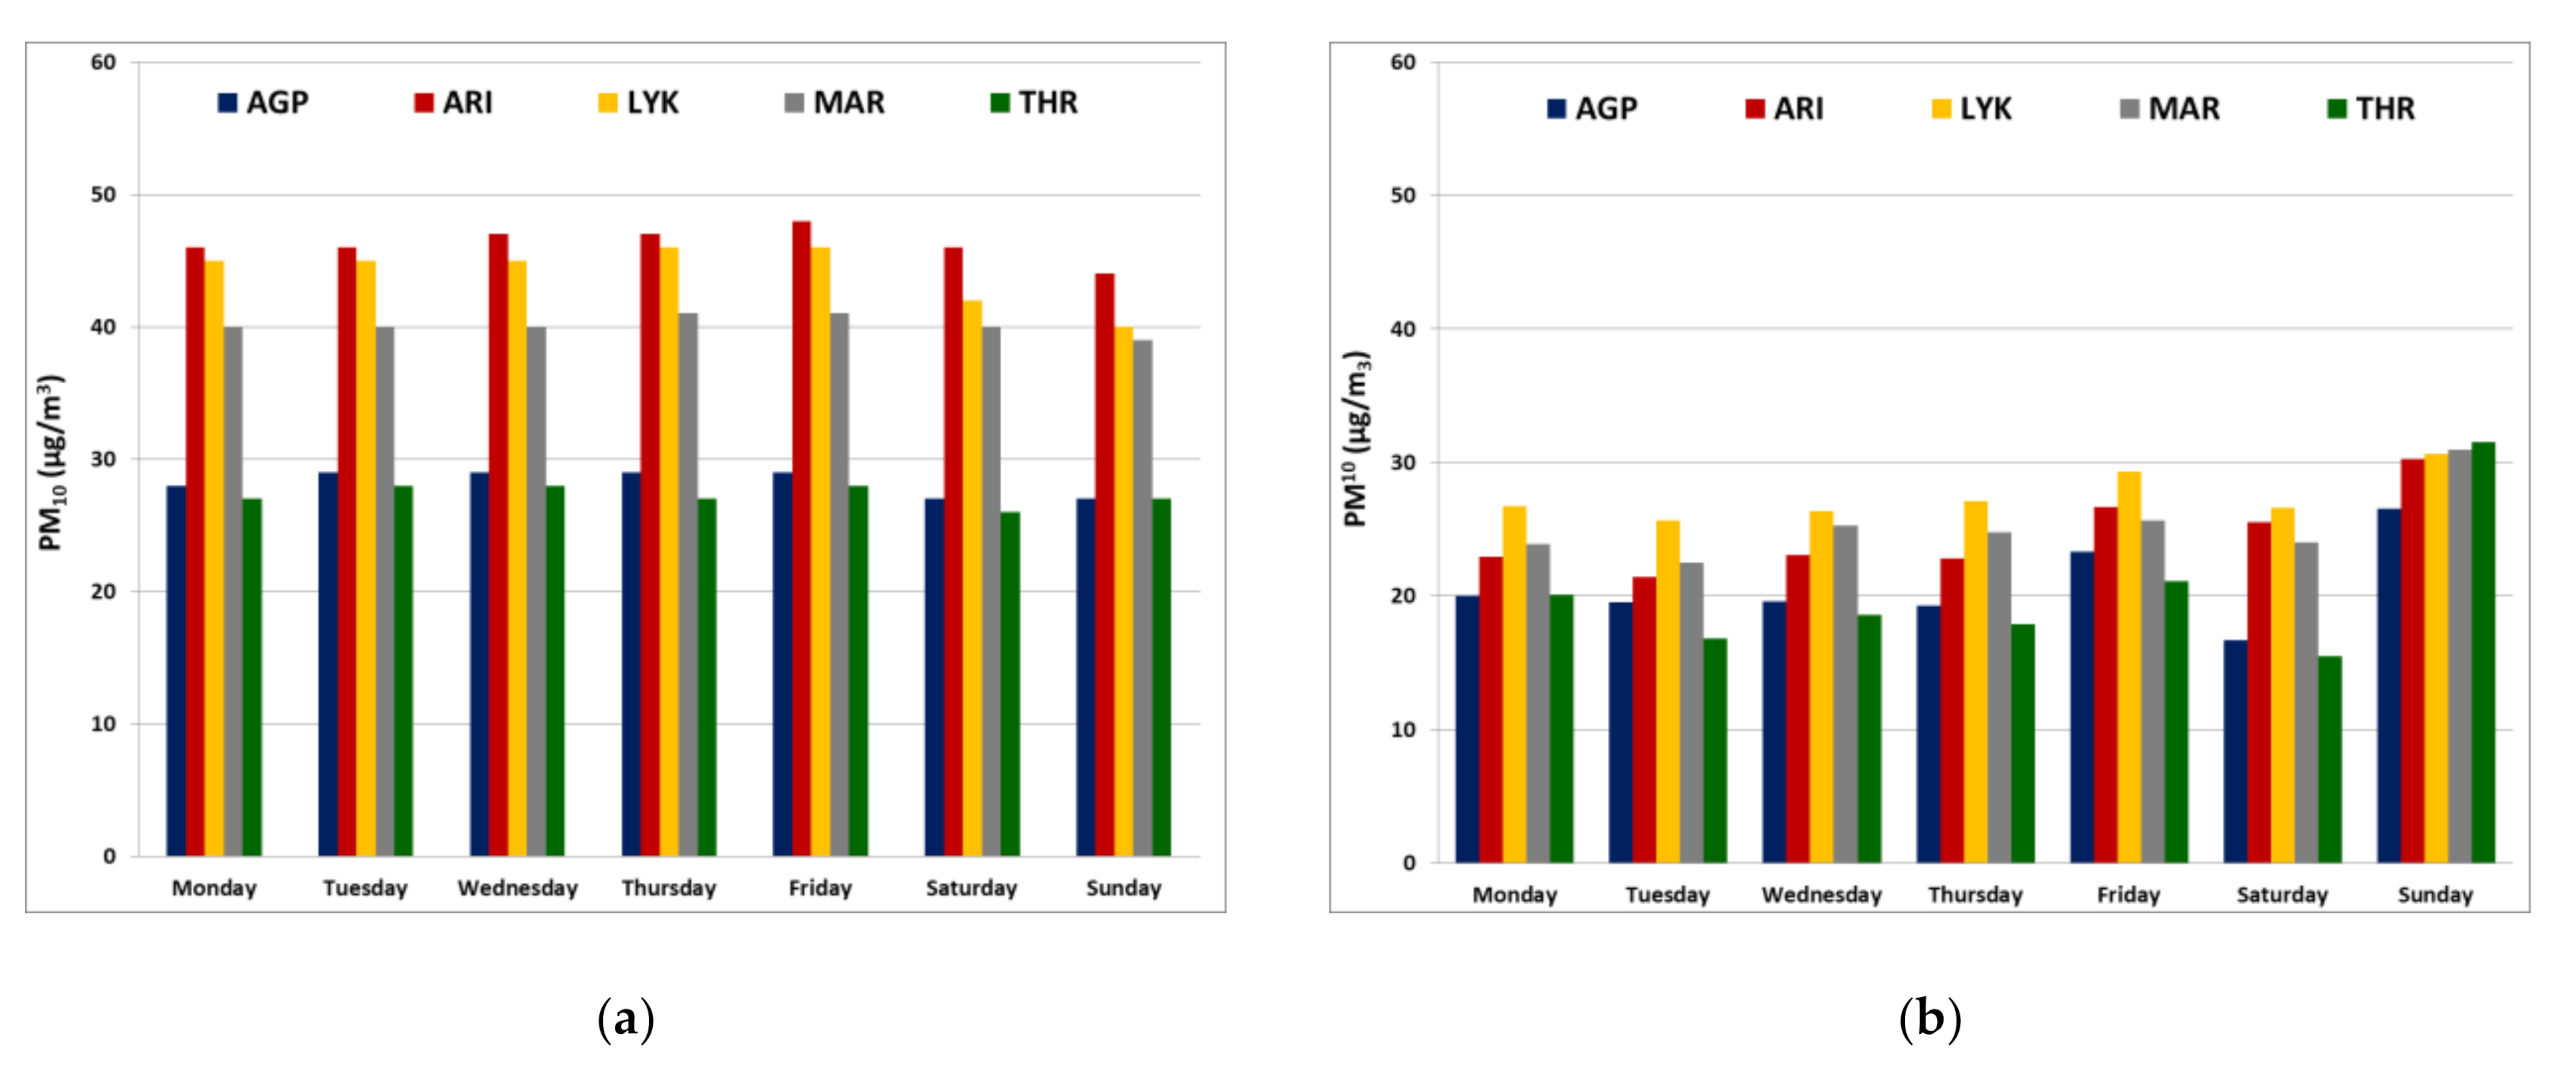
The intra-week variation of PM
10 concentrations is presented in
Figure 3. As can be observed, there is no significant change of PM
10 concentrations from day to day during the week. The PM
10 levels seem to be constant with not any substantial variation at the working days of the week as well as during the weekend. However, in urban traffic monitoring stations (ARI, LYK and MAR), a slight decrease of PM
10 mean daily concentration occurs during Sunday. However, this reduction is very small and is possibly due to changes in traffic volumes between working and not working days, such as Sunday. Finally, it is obvious that at the two SB monitoring stations (AGP and THR) the daily PM
10 levels are about 40.0% lower than the levels at the three other stations (ARI, MAR and LYK). This provides further evidence that LYK station presents similar behaviour with UT stations and not with SB stations. Concerning the standard deviation of the intra-week mean daily PM
10 concentrations (
Figure 3b), it can be observed that there are non-significant differences between each day of a week and each station between the five examined ones. The slightly greater concentration values during Sunday, could be due to the fact that on Sundays the traffic is lower and, hence, the “momentum” of the concentrations of the previous days and the PM
10 transportation from neighbouring areas could be significant.
Table 2 presents the correlation coefficient between the mean daily PM
10 concentrations at the five monitoring during the examined period 2001–2018 (N = 2999 available days with no gaps for all of the five monitoring sites).
According to
Table 2, there is a very strong linear correlation among the mean daily PM
10 concentrations of the five examined stations.
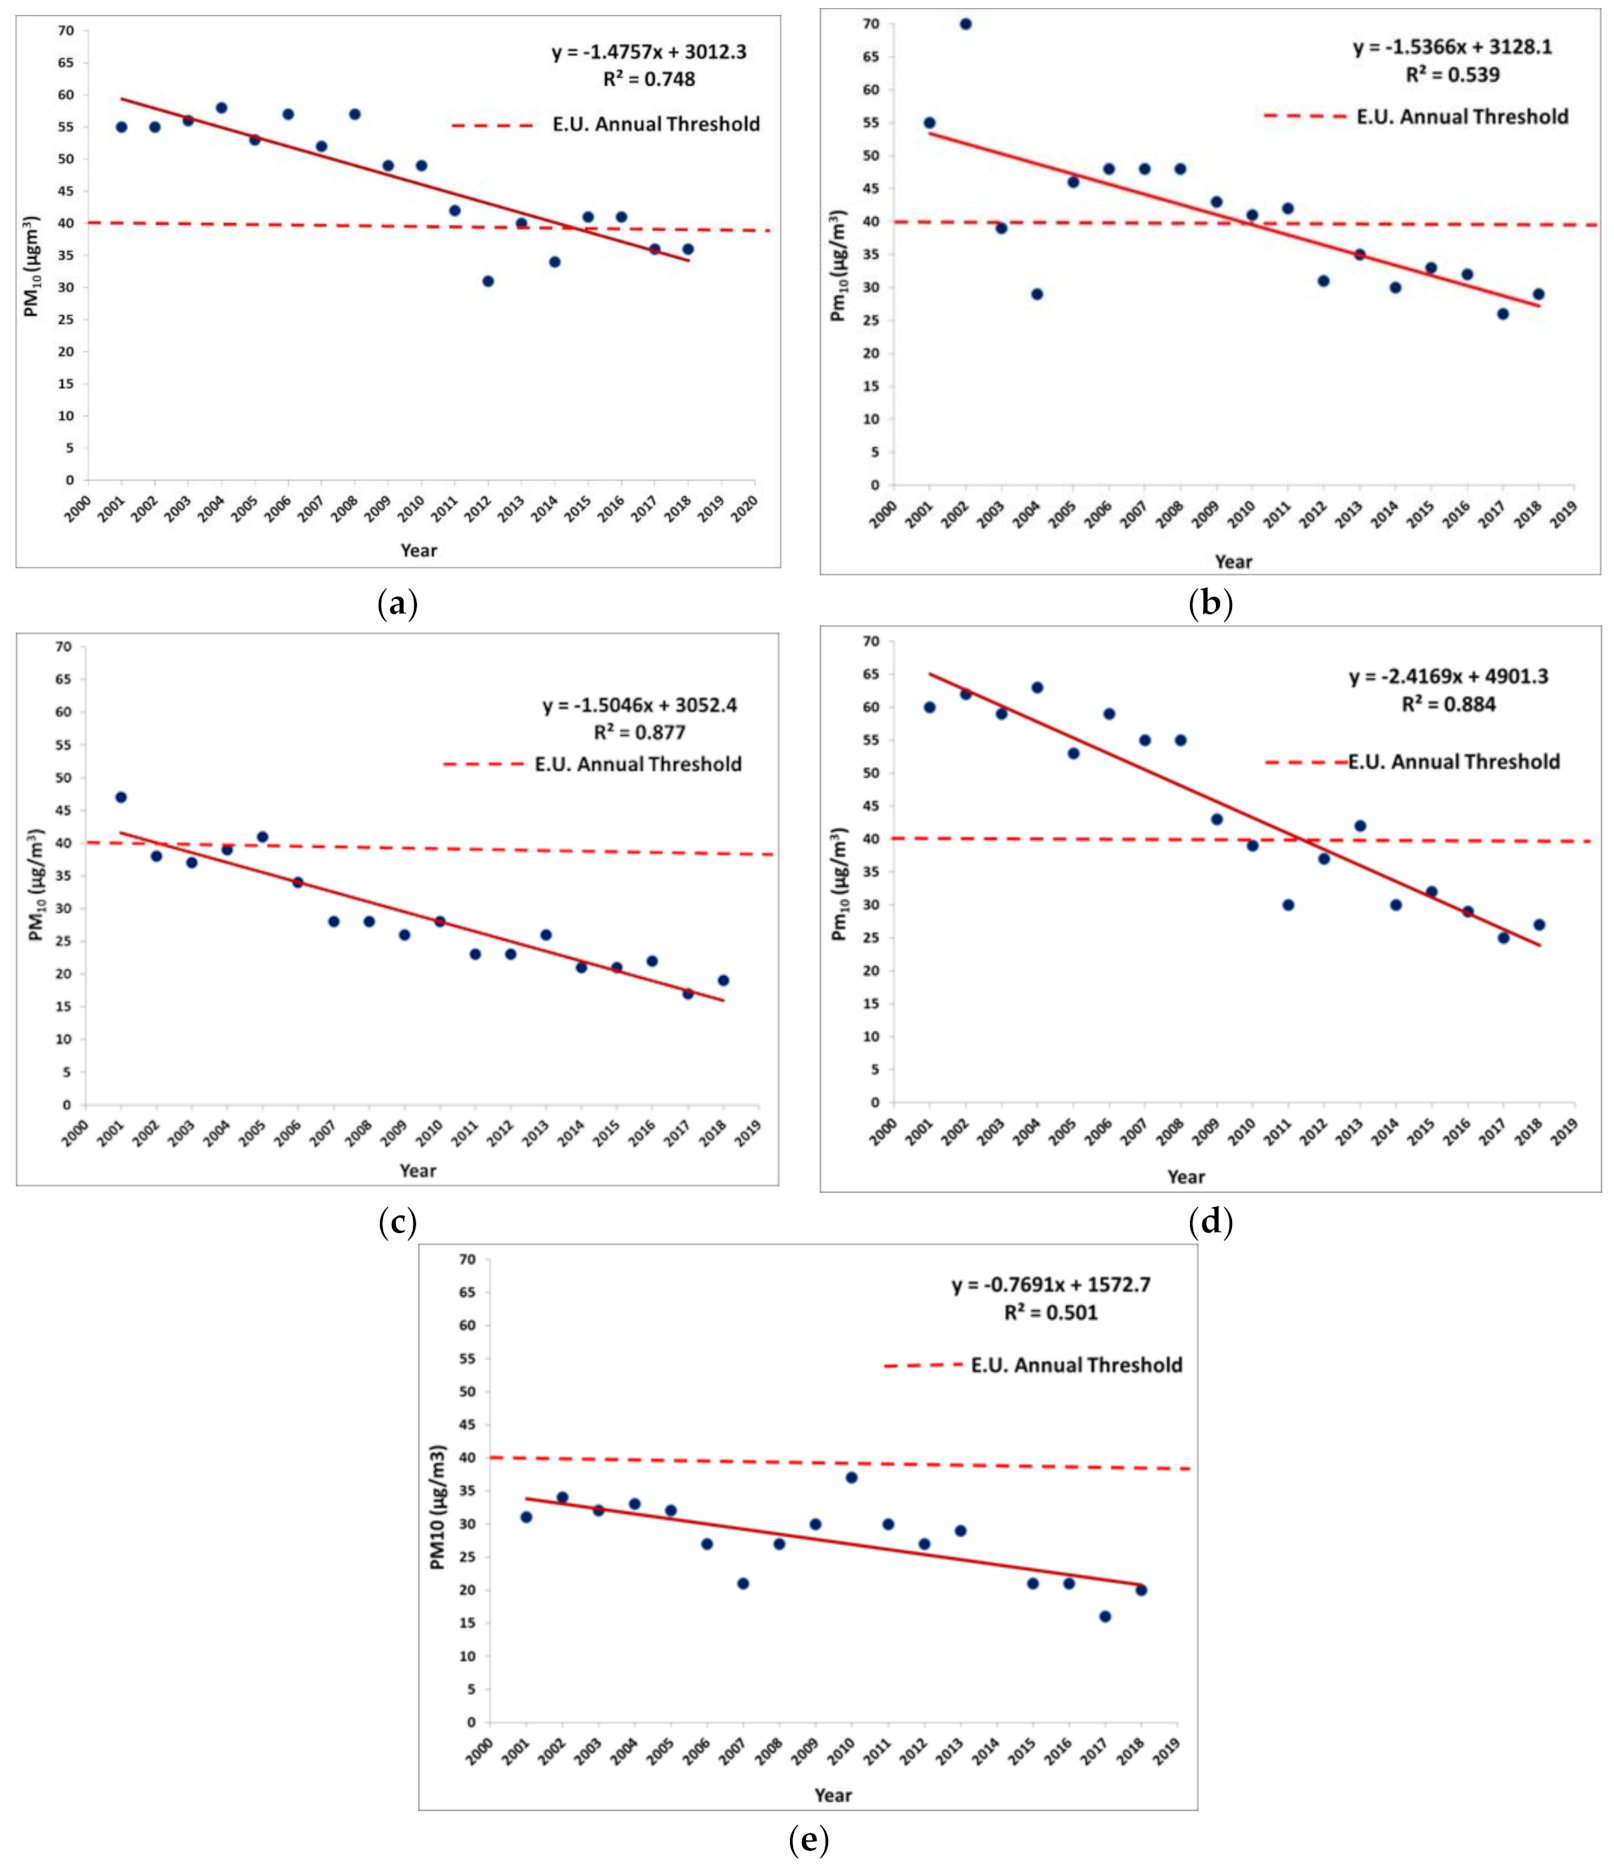
In order to investigate further the decreasing tendency of the data series,
Figure 4 presents the annual trends of the examined PM
10 concentration series during the last two decades. To produce
Figure 4, the mean annual PM
10 concentration was calculated for each one of the five examined monitoring stations within the GAA during the period 2001–2018. The reader should note that according to the EU directive 2008/50/EC for the protection of public health, clean air and environment, the mean annual PM
10 concentrations have to be lower than 40 μg/m
3 [
15]. This threshold is depicted as a dashed line in
Figure 4. As can be observed from
Figure 4, the ARI, AGP and LYK stations present a noteworthy decreasing annual linear trend with R
2 ranging between 0.75 and 0.88. The other two stations, namely MAR and THR, show a decreasing annual linear trend, as well, however, with R
2 around 0.5. More specifically, the ARI, MAR and LYK stations exhibit decreasing annual linear trend with slopes between −1.4 μg/m
3 per year and −2.4 μg/m
3 per year. For the SB stations AGP and THR the annual decreasing trend is −1.5 μg/m
3 per year and −0.77 μg/m
3 per year, respectively. Finally, according to
Figure 4, big differences in trends among the five examined monitoring stations are observed. This could be due to the fact that the monitoring stations that are impacted more by traffic and local emissions, exhibit more pronounced annual fluctuations, especially, during the years of the economic crisis of Greece. In general terms, the decreasing annual trends that are observed in the mean annual PM
10 concentrations, can be splinted in two different periods.
Period 1 (2001–2009), during which a number of different measures have been taken by the Greek State that are considered to have influenced significantly the PM10 concentration distribution. More specifically:
Two new lines of the underground train (metro lines) which started to operate in 2000 and, thereafter, serve daily about 1.0 ~ 1.5 million passengers. This means that on a daily basis, at least hundreds of thousands of cars move a few million kilometres less and, hence, a few million tons of CO2 less are emitted to the atmosphere of the capital.
In 2001, the new international airport “Eleftherios Venizelos”, located away from the urban fabric on the east side of the GAA, started to operate in substitution of the old international airport, located within the GAA, on its south coast (now completely ruined). Furthermore, the new airport is connected with the city centre the majority of GAA’s suburban areas the new underground train and the new, highly used, GAA’s urban-suburban connecting highway called “Attiki Odos”. Prior to the above, transportation to and from the old airport, could be only via a private car, a taxi or a public bus that, all, crossed the city from one side to the other, in most times, through the city’s centre.
In 2001, “Attiki Odos”, which is the main regional ring of the GAA and the backbone of the Attica basin road network (length about 70 km), provides fewer traffic jams, higher speeds and, hence, lower emissions.
Around 2002~2003, new bus lanes were established on the right side of the roads, where the public buses move exclusively at higher speeds and, as a result, have lower emissions. For example, it was observed that the speed of the public buses inside the new lanes was increased from 5~10 km/h to 23 km/h, improving, hence, the quality of the transport by bus, making it more attractive to the public [
21]. Furthermore, with an increase that has been observed [
21] in the use of the new-lane moving buses by the GAA’s inhabitants [
21], the use of private vehicles was reduced, and, as a result, fuel consumption and pollutant emissions.
Period 2 (2010–2018), during which the use of private vehicles and the fuel consumption for heating were reduced by significant levels, possibly due to the Greek economic crisis [
22]. In this way, the annual decreasing trend of PM
10 concentrations was continued at a steady rate. Moreover, concerning the annual threshold proposed in the EU Directive 2008/50/EC [
15], it seems that, in all monitoring stations, the mean annual PM
10 concentration is less than 40 μg/m
3. Especially, for the cases of the two SB monitoring stations (AGP and THR), it can be observed that, in most of the years of the examined period 2001–2018, the mean annual PM
10 concentrations are lower than the EU annual threshold of 40 μg/m
3. This fact can be considered as additional evidence of the view that LYK station is a UT station, rather than an SB one. Apart from the annual threshold of PM
10 concentration another threshold was established by the EU through the Directive 2008/50/EC [
15]. More specifically, the mean daily PM
10 concentrations have to be less than 50 μg/m
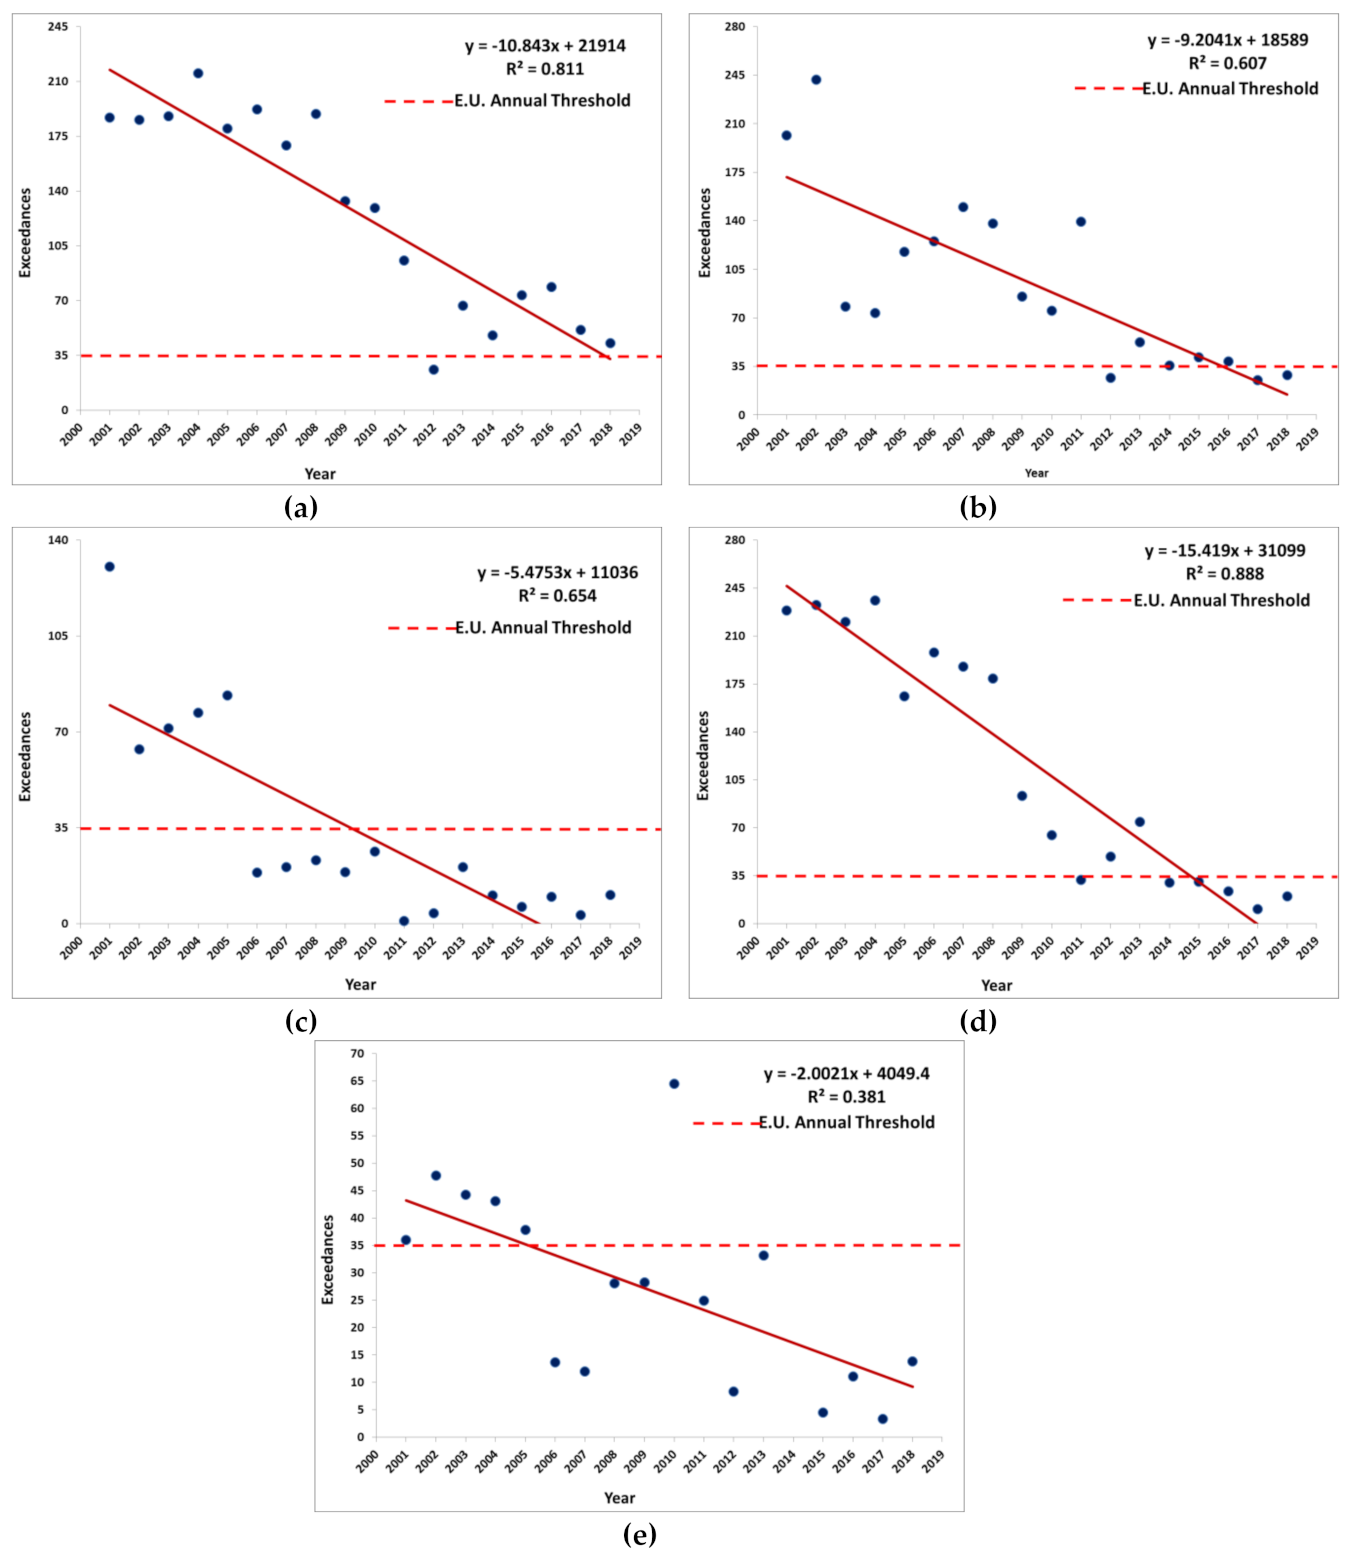
3. So, if the mean daily concentration exceeds this threshold, this day is considered as an exceedance day. Finally, the maximum number of exceedances during the year has to be lower than 35 days. By this concept, the annual number of exceedances during the period 2001–2018 for each one of the five examined monitoring stations was calculated.
Figure 5 depicts the annual variation of PM
10 exceedances for the five stations within the GAA during the period 2001–2018. The least squares method was applied, and the annual trend of the exceedances was estimated. According to
Figure 5, there is a significant decreasing trend, in all cases. More specifically, for the five monitoring stations, it seems that every year, there is a reduction in exceedances, from 2 up to 15 exceedance days per year. The coefficient of determination is 0.381 ≤ R
2 ≤ 0.888 which means that the decreasing trend of the exceedances can explain from 38.1% up to 88.8% of the data variance.
It should be noted also that the two SB monitoring stations AGP and THR, exhibit lower decreasing annual linear trend in the concentration exceedances compared to the ones of the other stations. The corresponding decreasing trend ranges between 2 (case of THR) and 5.5 (case of AGP) exceedance days per year. Regarding the threshold of 35 annual exceedances (days with PM10 mean daily concentration greater than 50 μg/m3), it can be observed that in the case of ARI, MAR and LYK monitoring sites there are no violations during the last 3 ~ 4 years of the examined period 2001–2018. On the other hand, for the two stations of AGP and THR there are no violations of the threshold of the 35 exceedances per year from 2006 and more specifically after the Greek economic crisis. This provides further evidence that the LYK monitoring station has to be characterised as a UT station and not as an SB one.
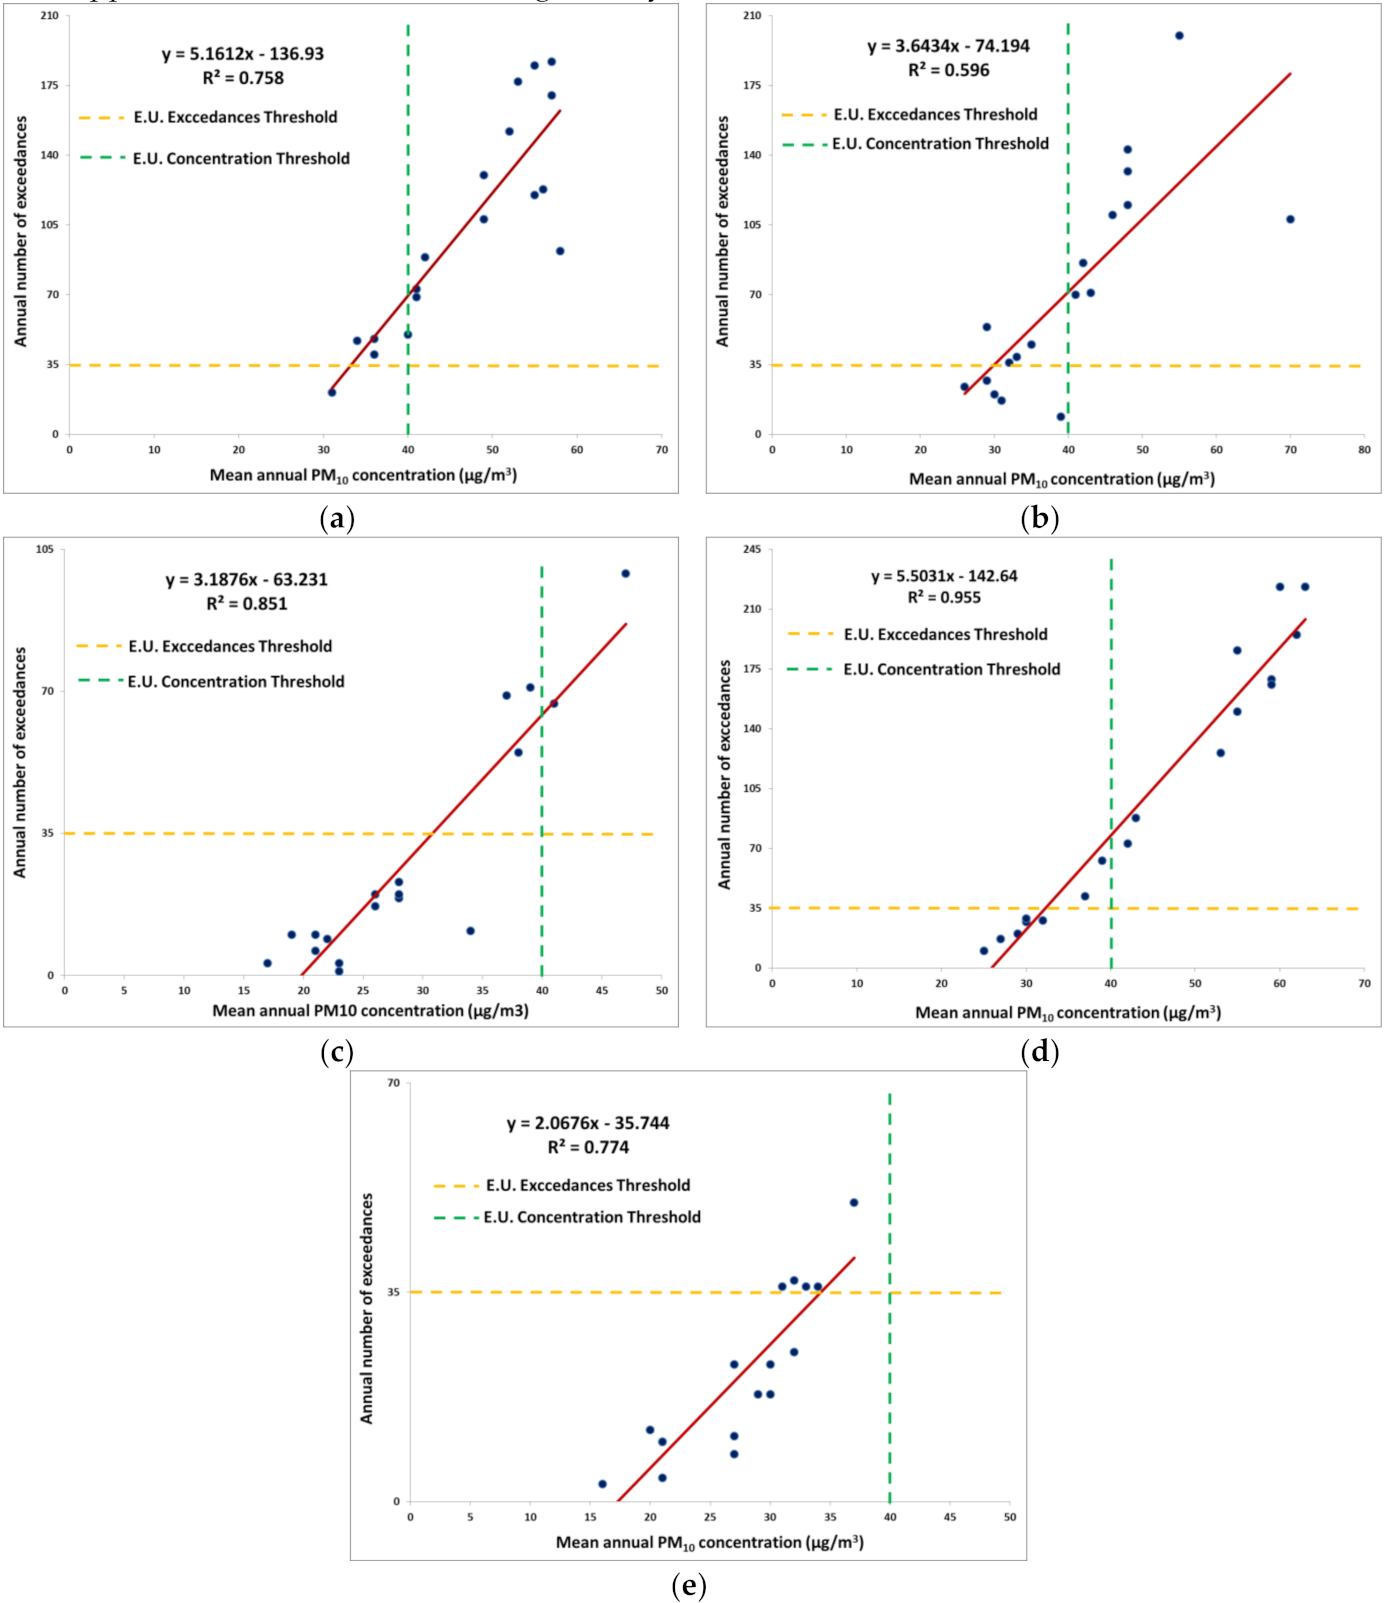
As can be observed from
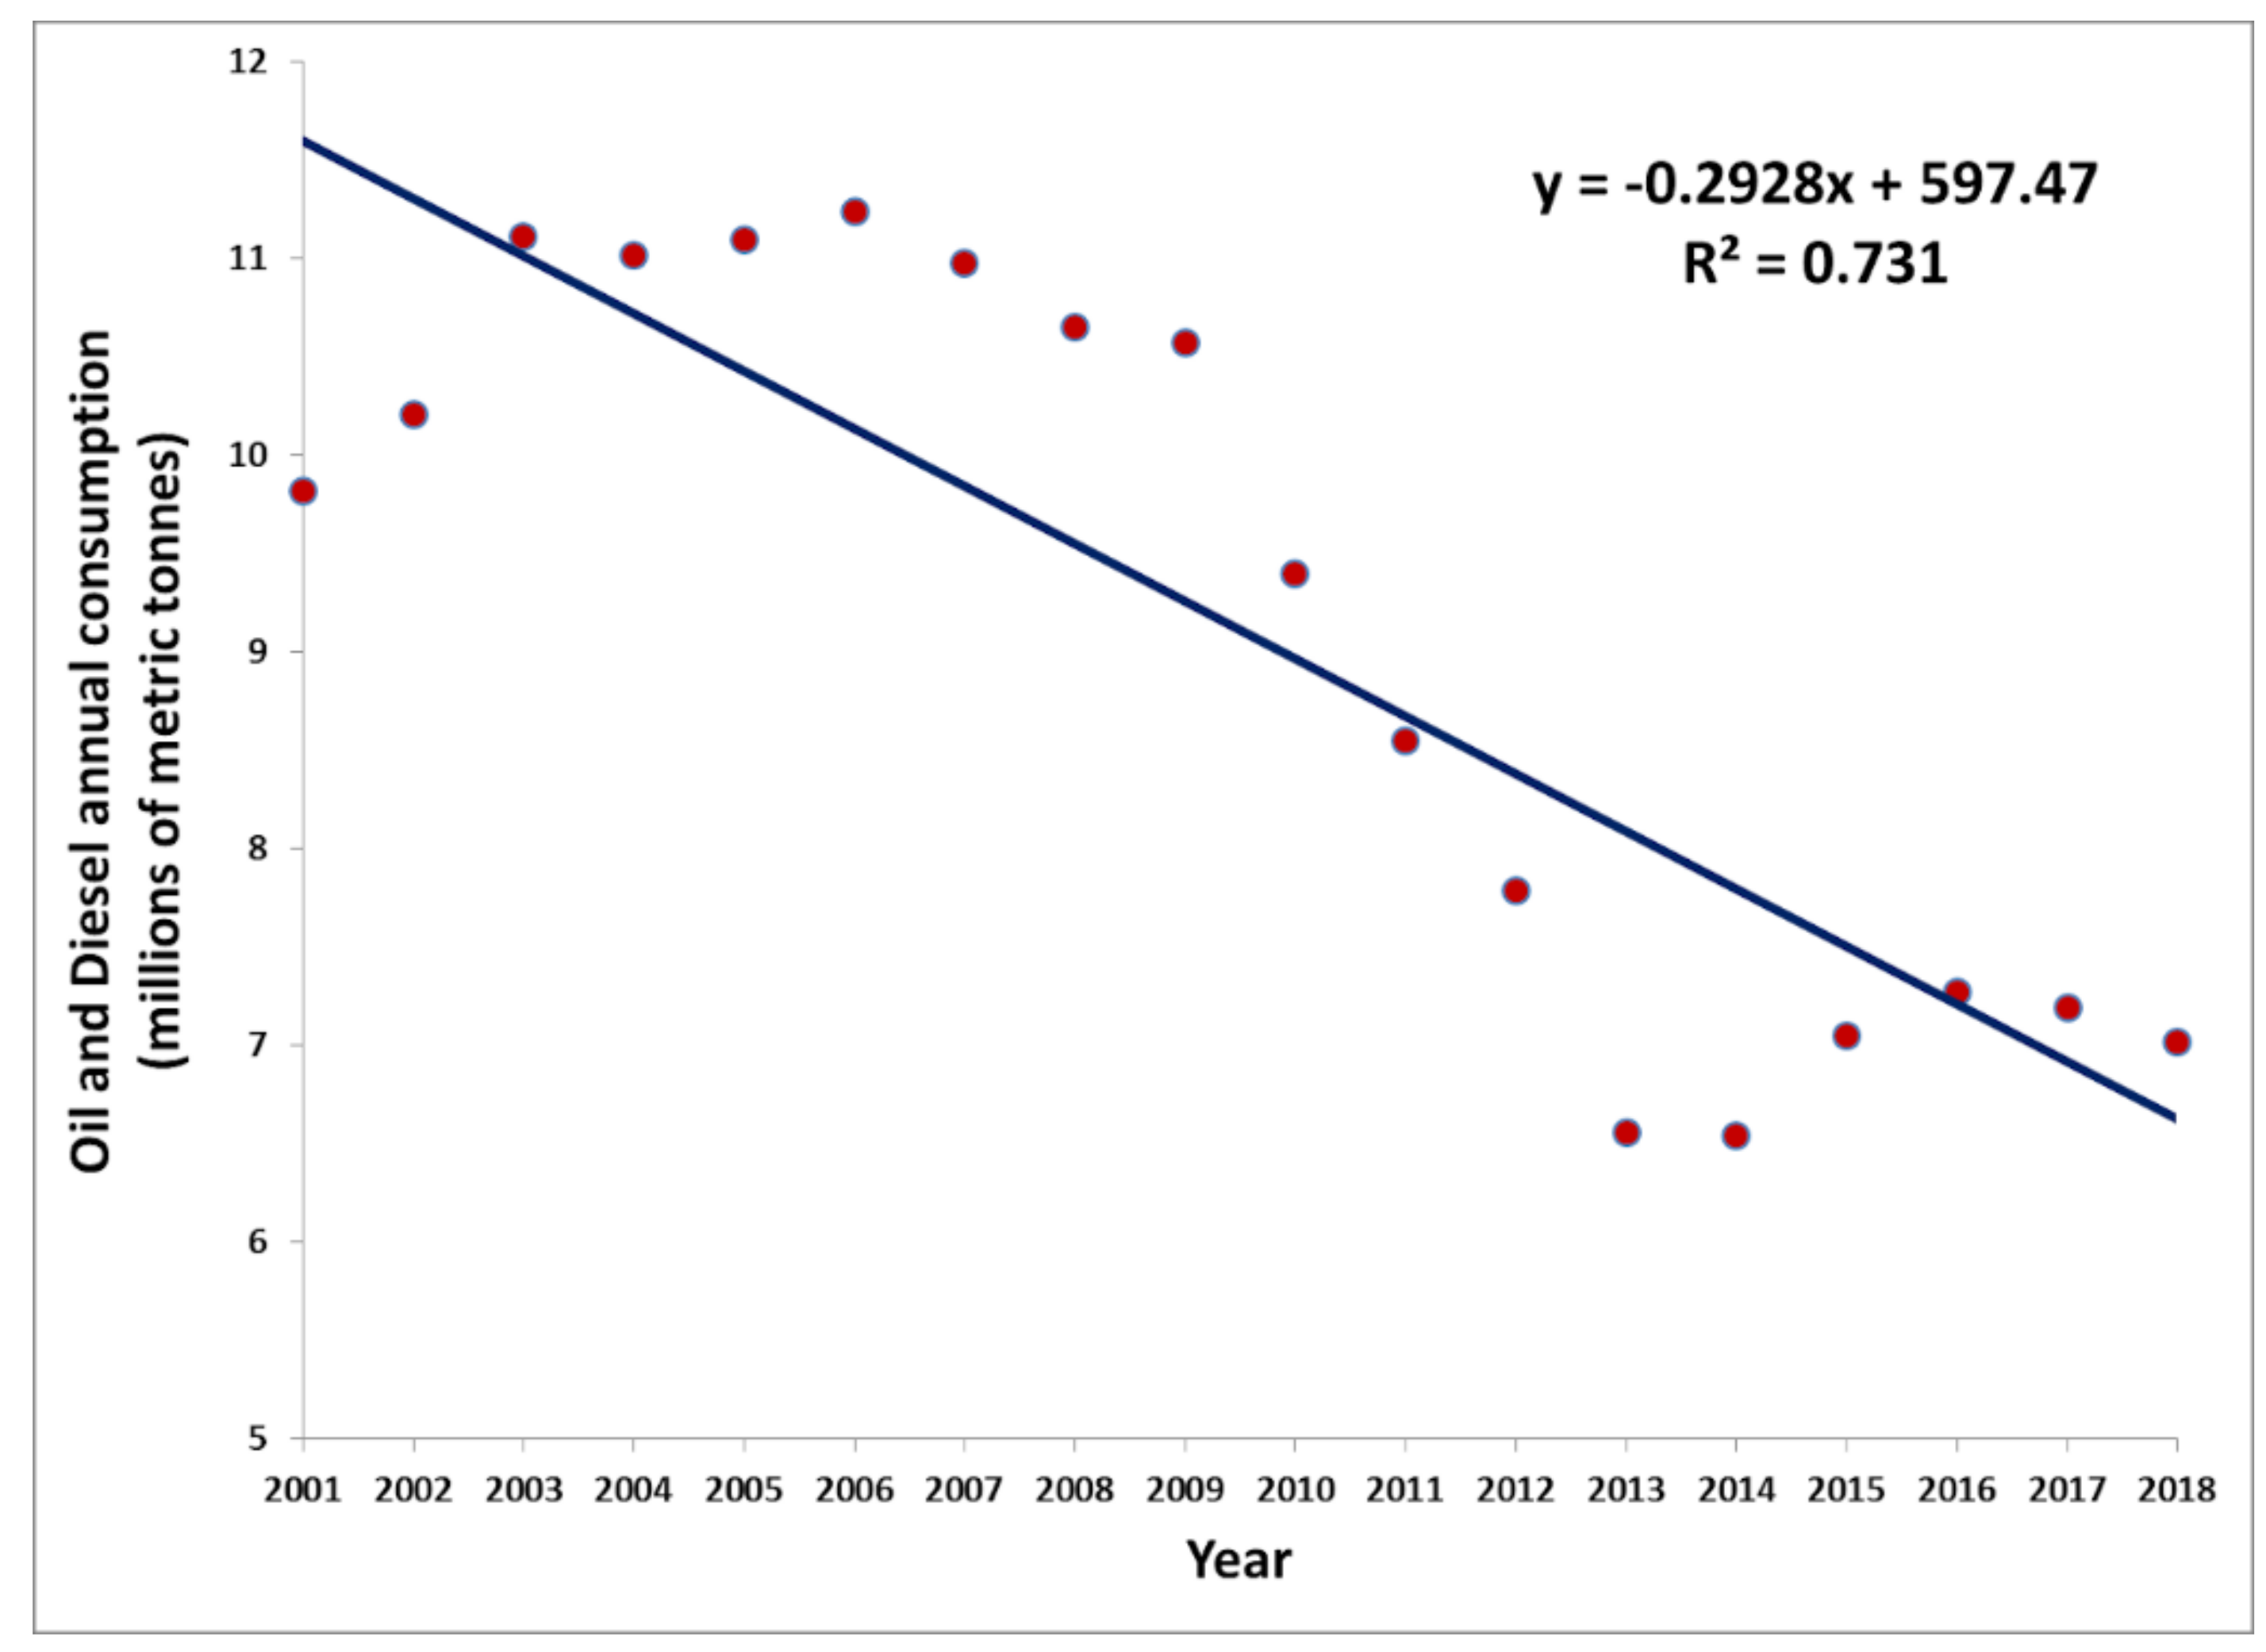
Figure 6, from 59.6% up to 95.5% of the data variance can be explained indicating, thus, a very strong correlation in each case. Furthermore, the three monitoring stations of ARI, MAR and LYK, during most of the years, do not meet the corresponding requirements and limits of the EU directive. On the contrary, this is not observed in the other two SB stations, namely AGP and THR, for which, during most of the years, the requirements and limits of the EU directive are met. The common tendencies of the ARI, MAR and LYK stations versus the AGP and THR ones can be interpreted as additional evidence that the LYK monitoring station has to be characterised as a UT station instead of an SB station. In association to the above,
Figure 7 depicts the annual variation of gasoline, vehicle diesel and heating oil total consumption in Greece [
22]. It can be observed that during the years of the Greek economic crisis, there is a significant decreasing trend. Despite the fact that
Figure 7 concerns the total Greek population, it can be assumed that the decreasing trend within GAA is similar, because almost half of the population of Greece lives and works in the GAA. Interpreting the limits of
Figure 6 (horizontal orange dashed lines) in view of the data of
Figure 7, it can be supported in the years after 2010 where the EU thresholds are met (Greek economic crisis), gasoline, vehicle diesel and heating oil consumption was significantly reduced (
Figure 7) [
22].
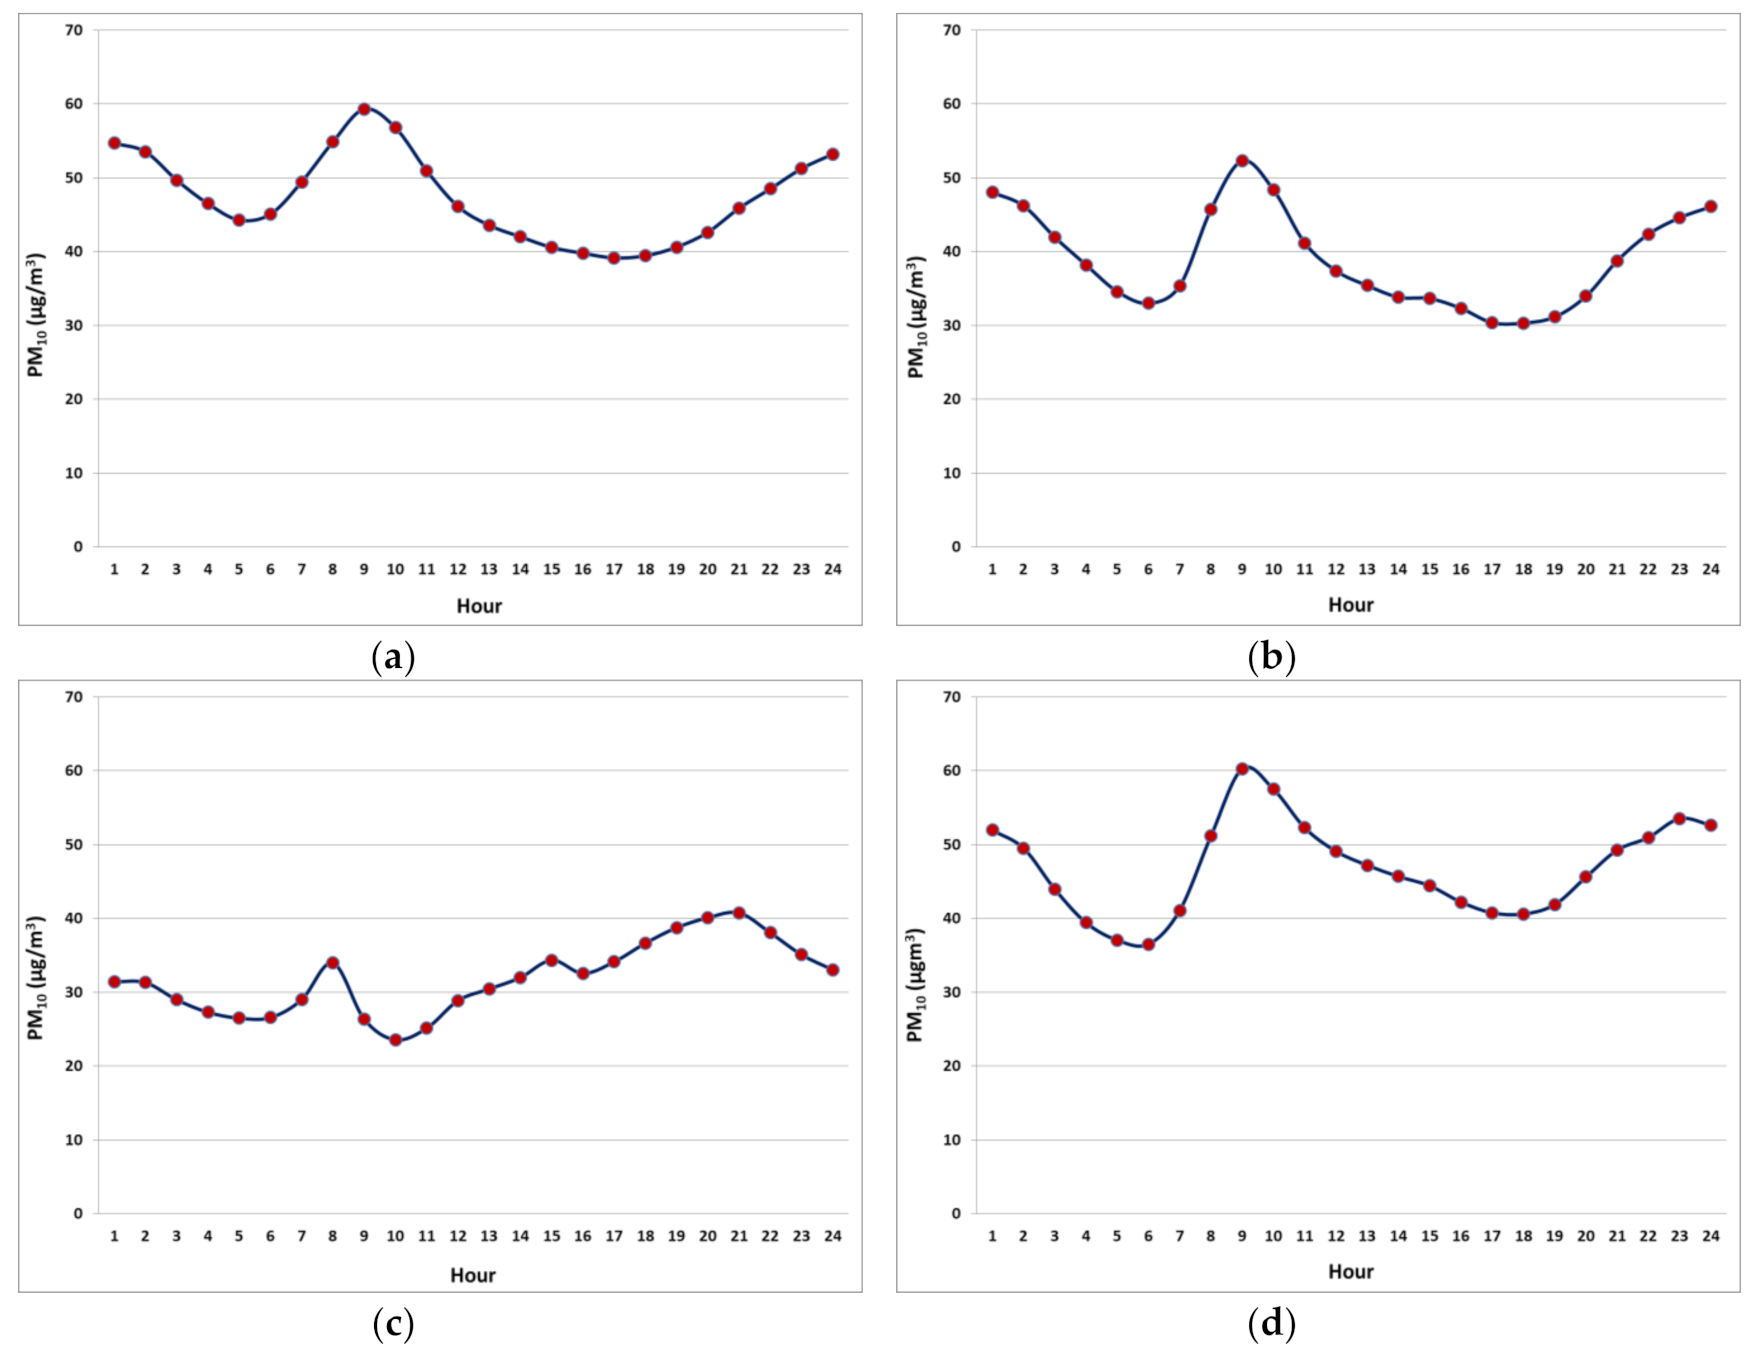
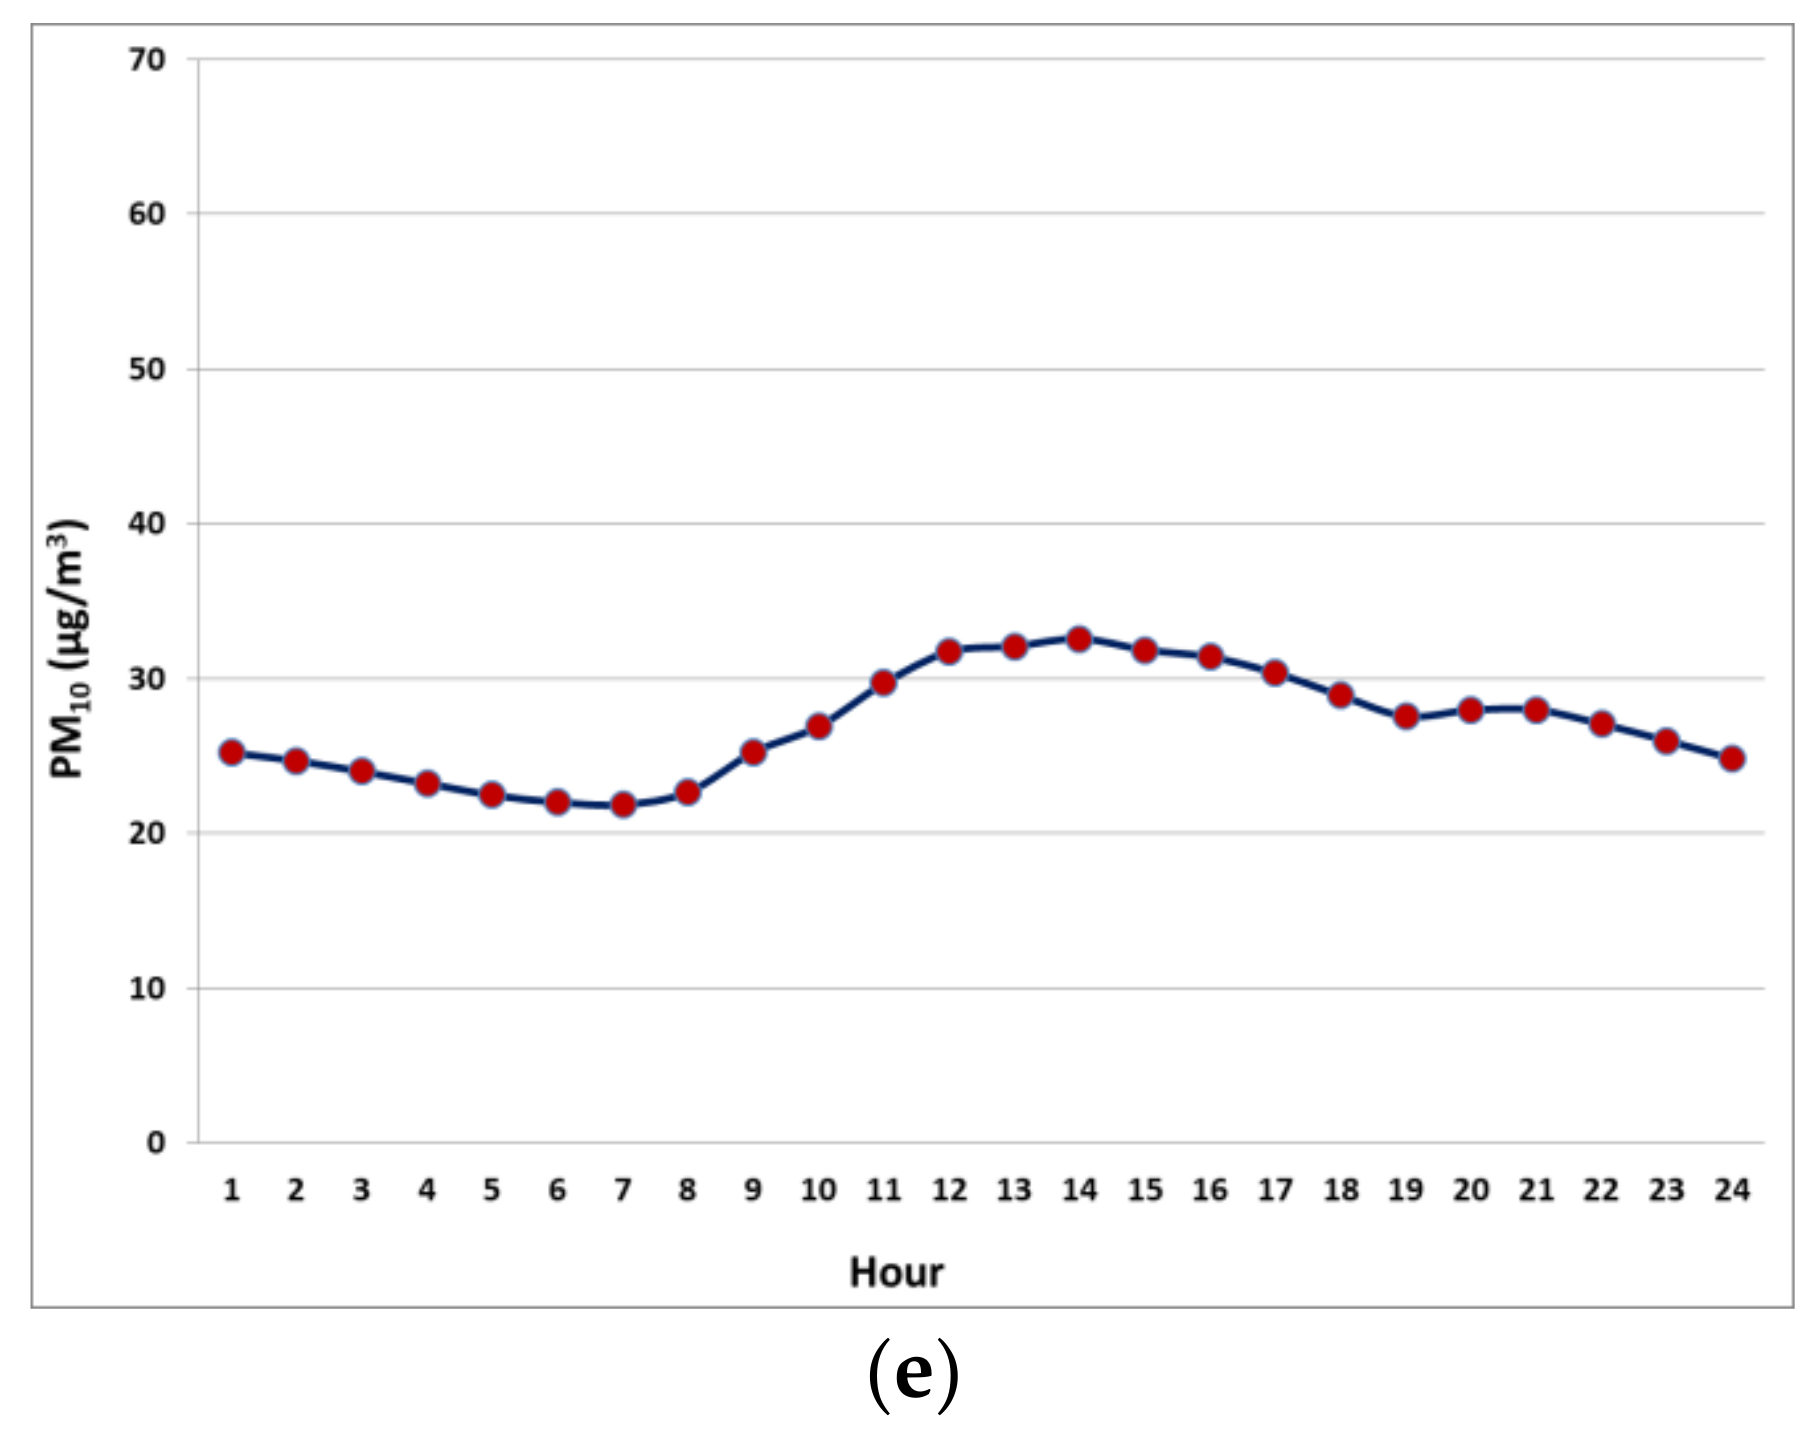
Figure 8 shows the intraday variation of PM
10 concentrations. As it can be observed, ARI, MAR and LYK monitoring stations within the GAA exhibit similar intraday variation shape. Between 08:00am and 10:00am there is a maximum and a second one late in the night hours. According to the opinion of the authors, the first maximum is due to the traffic and transportation in general where all the people move to their jobs. The second intraday maximum of PM
10 concentration is, most probably, due to heating when the residents are in their home and apartments. This intraday variation shape of the LYK monitoring station provide addition evidence that this station has be characterised as a UT station and not an SB station. For the other two stations (AGP and THR) the intraday variation is different. This may be due to the characterisation of these two stations as SB monitoring sites (see
Table 1) where there is a strong influence from neighbouring areas and, due to this, there is a delay in the appearance of a maximum during the day.

 ,
, 


