Urban Ecosystem Services Quantification through Remote Sensing Approach: A Systematic Review

 , ,
, ,  ,
,  and
and 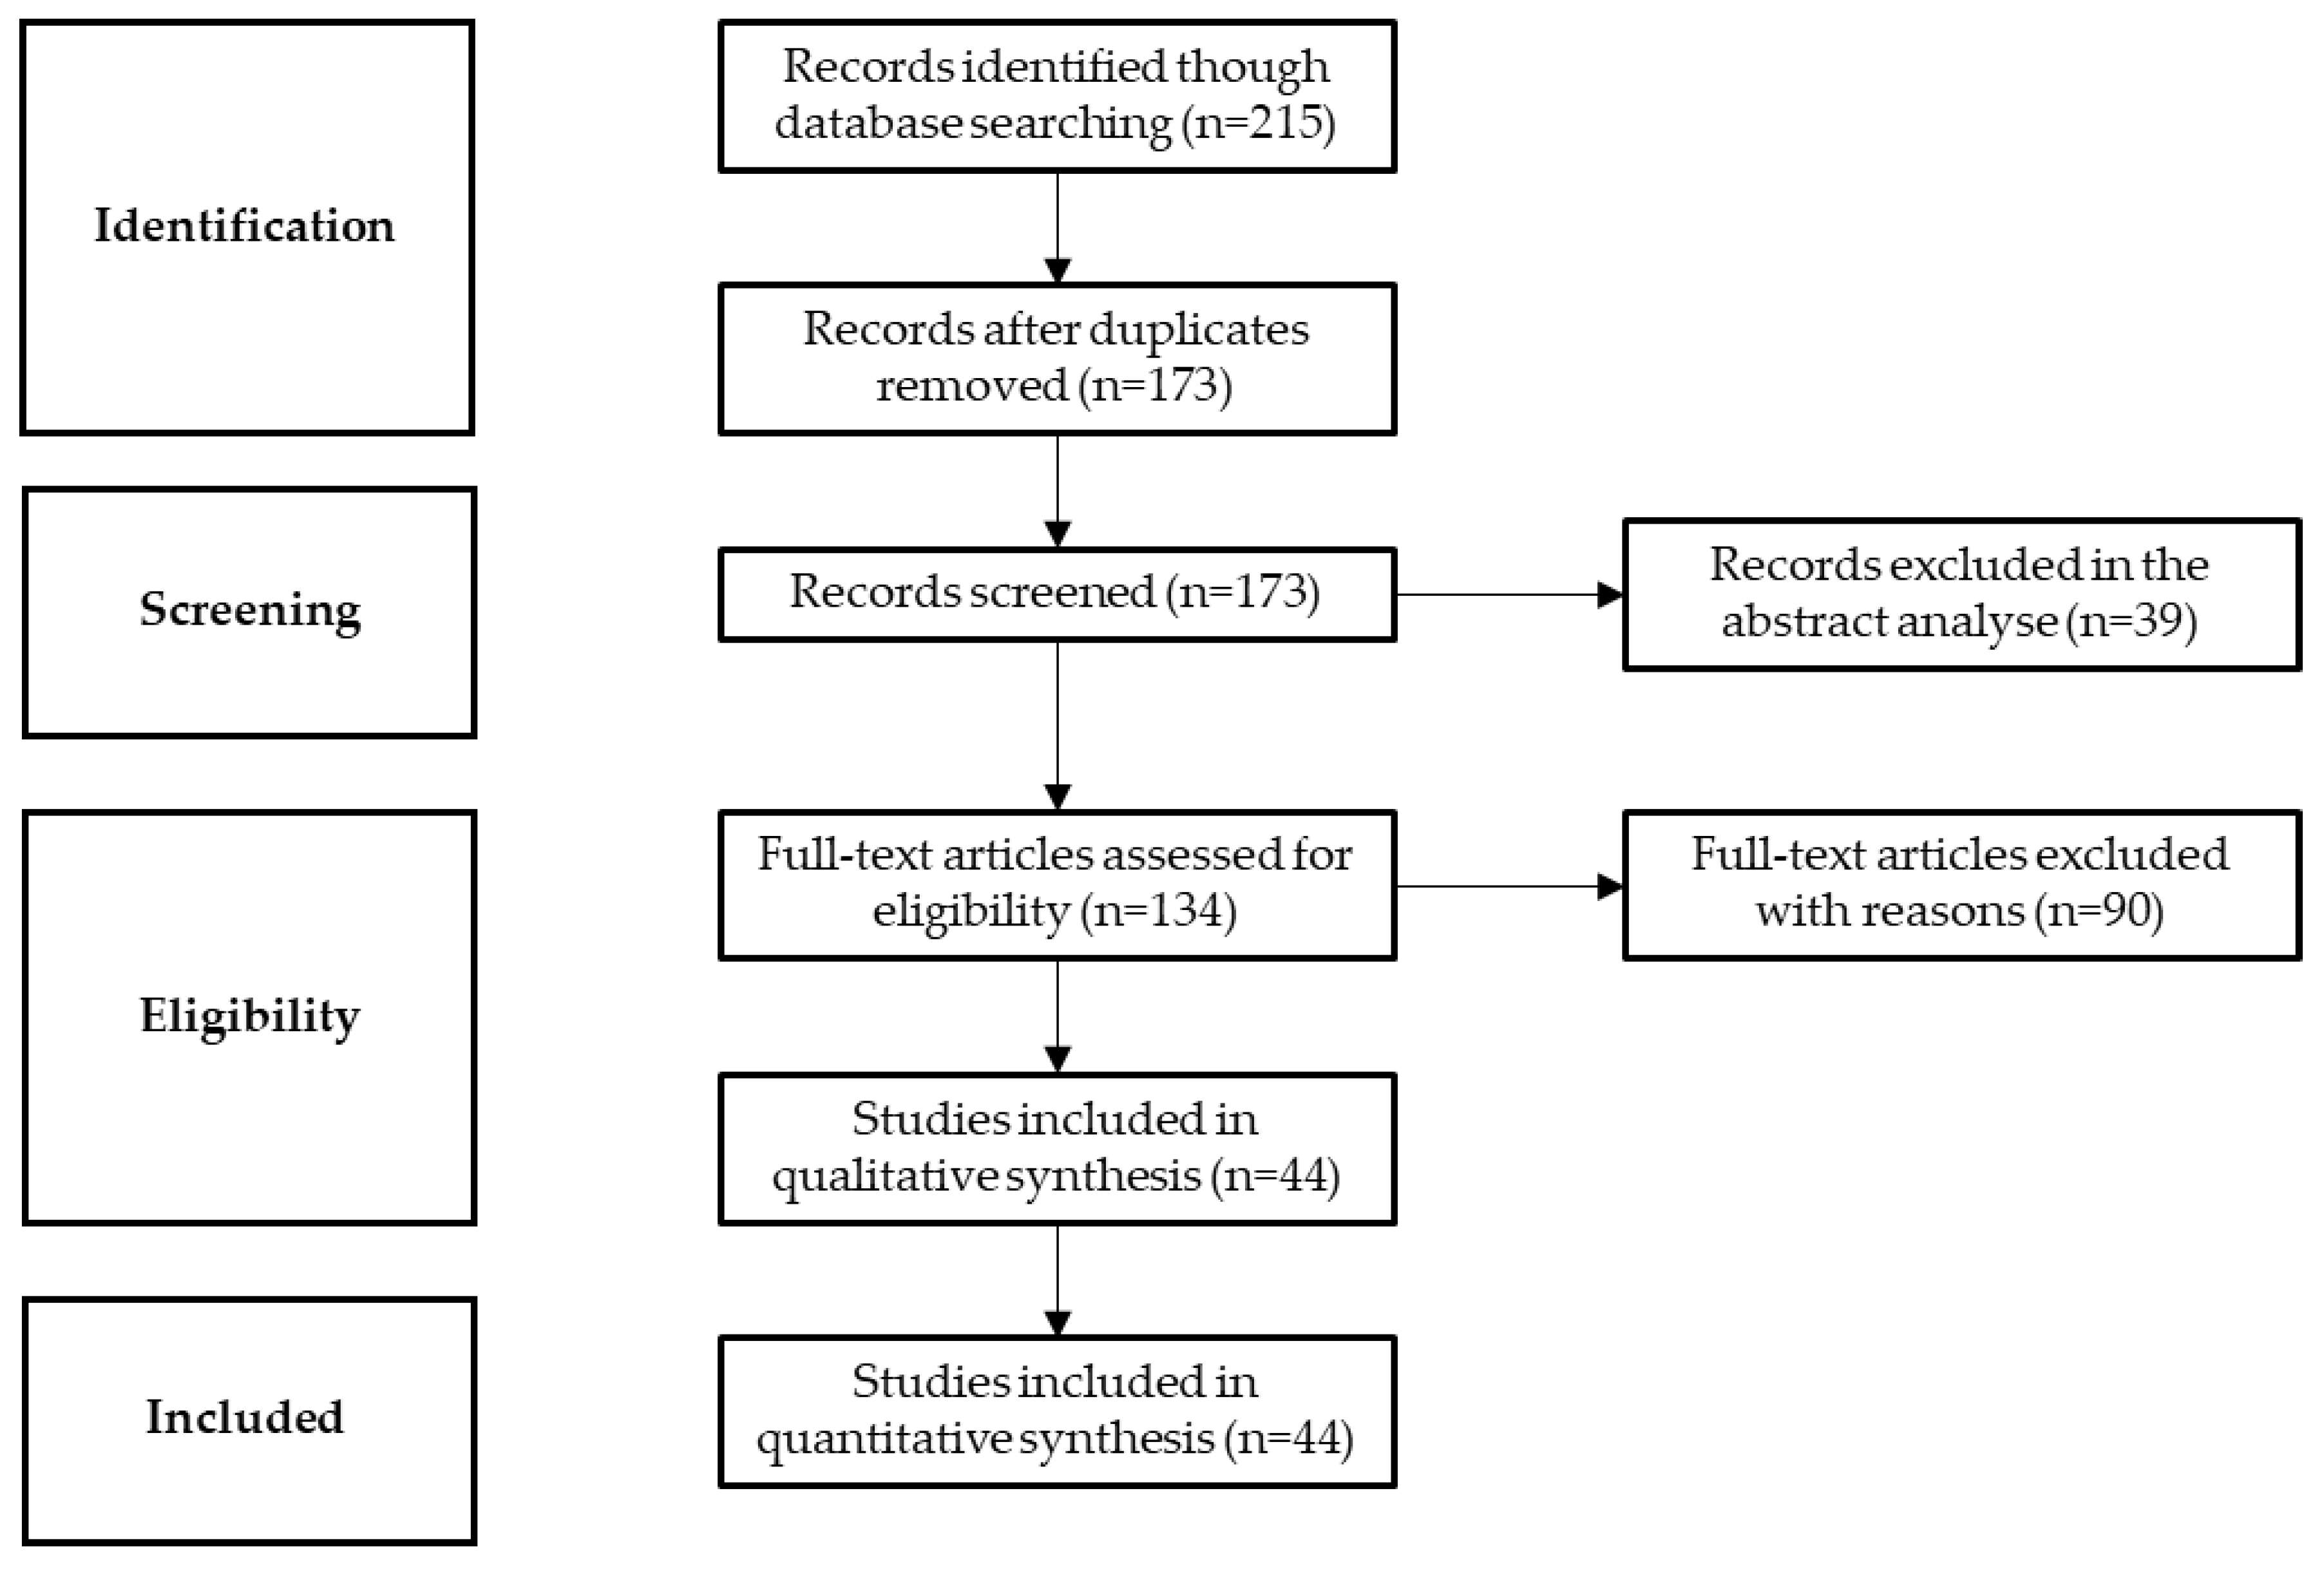
Abstract
1. Introduction
2. Materials and Methods
3. Results
4. Discussion
5. Conclusions
Author Contributions
Funding
Acknowledgments
Conflicts of Interest
References
- Costanza, R.; Arge, R.; Groot, R.D.; Farber, S.; Grasso, M.; Hannon, B.; Limburg, K.; Naeem, S.; O’Neil, R.V.; Paruelo, J.; et al. The Value of the World’s Ecosystem Services and Natural Capital. Nature 1997, 387, 253–260. [Google Scholar] [CrossRef]
- TEEB. TEEB Manual for Cities: Ecosystem Services in Urban Management; TEEB: Geneva, Switzerland, 2011. [Google Scholar]
- Costanza, R.; de Groot, R.; Braat, L.; Kubiszewski, I.; Fioramonti, L.; Sutton, P.; Farber, S.; Grasso, M. Twenty years of ecosystem services: How far have we come and how far do we still need to go? Ecosyst. Serv. 2017, 28, 1–16. [Google Scholar] [CrossRef]
- de Araujo Barbosa, C.C.; Atkinson, P.M.; Dearing, J.A. Extravagance in the commons: Resource exploitation and the frontiers of ecosystem service depletion in the Amazon estuary. Sci. Total Environ. 2016, 550, 6–16. [Google Scholar] [CrossRef]
- Burgess, N.D.; Darrah, S.; Knight, S.; Danks, F.S. Approaches to Mapping Ecosystem Services; UNEP-WCMC: Cambridge, UK, 2016; ISBN 9789280735840. [Google Scholar]
- Burkhard, B.; Maes, J.; Potschin-Young, M.; Santos-Martín, F.; Geneletti, D.; Stoev, P.; Kopperoinen, L.; Adamescu, C.; Adem Esmail, B.; Arany, I.; et al. Mapping and assessing ecosystem services in the EU—Lessons learned from the ESMERALDA approach of integration. One Ecosyst. 2018, 3, e29153. [Google Scholar] [CrossRef]
- Burkhard, B.; Kroll, F.; Nedkov, S.; Müller, F. Mapping ecosystem service supply, demand and budgets. Ecol. Indic. 2012, 21, 17–29. [Google Scholar] [CrossRef]
- Daily, G.C. Introduction: What are ecosystem services? In Nature’s Services: Societal Dependence On Natural Ecosystems; Daily, G.C., Ed.; Island Press: Washington, DC, USA, 1997; pp. 1–10. [Google Scholar]
- Haas, J.; Ban, Y. Sentinel-1A SAR and sentinel-2A MSI data fusion for urban ecosystem service mapping. Remote Sens. Appl. Soc. Environ. 2017, 8, 41–53. [Google Scholar] [CrossRef]
- Haase, D.; Larondelle, N.; Andersson, E.; Artmann, M.; Borgström, S.; Breuste, J.; Gomez-Baggethun, E.; Gren, Å.; Hamstead, Z.; Hansen, R.; et al. A quantitative review of urban ecosystem service assessments: Concepts, models, and implementation. Ambio 2014, 43, 413–433. [Google Scholar] [CrossRef] [PubMed]
- Locke, D.H.; McPhearson, T. Urban areas do provide ecosystem services. Front. Ecol. Environ. 2018, 16, 203–205. [Google Scholar] [CrossRef]
- McPhearson, T.; Andersson, E.; Elmqvist, T.; Frantzeskaki, N. Resilience of and through urban ecosystem services. Ecosyst. Serv. 2015, 12, 152–156. [Google Scholar] [CrossRef]
- Elmqvist, T.; Setälä, H.; Handel, S.N.; van der Ploeg, S.; Aronson, J.; Blignaut, J.N.; Gómez-Baggethun, E.; Nowak, D.J.; Kronenberg, J.; de Groot, R. Benefits of restoring ecosystem services in urban areas. Curr. Opin. Environ. Sustain. 2015, 14, 101–108. [Google Scholar] [CrossRef]
- Cord, A.F.; Brauman, K.A.; Chaplin-Kramer, R.; Huth, A.; Ziv, G.; Seppelt, R. Priorities to Advance Monitoring of Ecosystem Services Using Earth Observation. Trends Ecol. Evol. 2017, 32, 416–428. [Google Scholar] [CrossRef] [PubMed]
- Haas, J.; Ban, Y. Urban Land Cover and Ecosystem Service Changes Based on Landsat TM and Sentinel-2A Data. IEEE J. Sel. Top. Appl. Earth Obs. Remote Sens. 2018, 11, 1–13. [Google Scholar] [CrossRef]
- Kain, J.H.; Larondelle, N.; Haase, D.; Kaczorowska, A. Exploring local consequences of two land-use alternatives for the supply of urban ecosystem services in Stockholm year 2050. Ecol. Indic. 2016, 70, 615–629. [Google Scholar] [CrossRef]
- Nowak, D.J.; Hoehn, R.E.; Bodine, A.R.; Greenfield, E.J.; O’Neil-Dunne, J. Urban forest structure, ecosystem services and change in Syracuse, NY. Urban Ecosyst. 2013, 19, 1–23. [Google Scholar] [CrossRef]
- Luederitz, C.; Brink, E.; Gralla, F.; Hermelingmeier, V.; Meyer, M.; Niven, L.; Panzer, L.; Partelow, S.; Rau, A.L.; Sasaki, R.; et al. A review of urban ecosystem services: Six key challenges for future research. Ecosyst. Serv. 2015, 14, 98–112. [Google Scholar] [CrossRef]
- Kremer, P.; Hamstead, Z.; Haase, D.; McPhearson, T.; Frantzeskaki, N.; Andersson, E.; Kabisch, N.; Larondelle, N.; Rall, E.L.; Voigt, A.; et al. Key insights for the future of urban ecosystem services research. Ecol. Soc. 2016, 21. [Google Scholar] [CrossRef]
- Ayanu, Y.Z.; Conrad, C.; Nauss, T.; Wegmann, M.; Koellner, T. Quantifying and Mapping Ecosystem Services Supplies and Demands: A Review of Remote Sensing Applications. Environ. Sci. Technol. 2012, 46, 8529–8541. [Google Scholar] [CrossRef]
- Ramirez-Reyes, C.; Brauman, K.A.; Chaplin-Kramer, R.; Galford, G.L.; Adamo, S.B.; Anderson, C.B.; Anderson, C.; Allington, G.R.H.; Bagstad, K.J.; Coe, M.T.; et al. Reimagining the potential of Earth observations for ecosystem service assessments. Sci. Total Environ. 2019, 665, 1053–1063. [Google Scholar] [CrossRef] [PubMed]
- De Araujo Barbosa, C.C.; Atkinson, P.M.; Dearing, J.A. Remote sensing of ecosystem services: A systematic review. Ecol. Indic. 2015, 52, 430–443. [Google Scholar] [CrossRef]
- Ren, Z.; Pu, R.; Zheng, H.; Zhang, D.; He, X. Spatiotemporal analyses of urban vegetation structural attributes using multitemporal Landsat TM data and field measurements. Ann. For. Sci. 2017, 74, 1–14. [Google Scholar] [CrossRef]
- Dobbs, C.; Hernández-Moreno, Á.; Reyes-Paecke, S.; Miranda, M.D. Exploring temporal dynamics of urban ecosystem services in Latin America: The case of Bogota (Colombia) and Santiago (Chile). Ecol. Indic. 2018, 85, 1068–1080. [Google Scholar] [CrossRef]
- Paul, C.K.; Mascarenhas, A.C. Remote Sensing in Development. Science 1981, 214, 139–145. [Google Scholar] [CrossRef] [PubMed]
- Pettorelli, N.; Laurance, W.F.; O’Brien, T.G.; Wegmann, M.; Nagendra, H.; Turner, W. Satellite remote sensing for applied ecologists: Opportunities and challenges. J. Appl. Ecol. 2014, 51, 839–848. [Google Scholar] [CrossRef]
- Kwok, R. Ecology’s remote-sensing revolution. Nature 2018, 556, 137–138. [Google Scholar] [CrossRef] [PubMed]
- Strauss, M. Planet Earth to get a daily selfie. Science 2017, 355, 782–783. [Google Scholar] [CrossRef]
- Li, P.; Feng, Z.; Xiao, C. Acquisition probability differences in cloud coverage of the available Landsat observations over mainland Southeast Asia from 1986 to 2015. Int. J. Digit. Earth 2018, 11, 437–450. [Google Scholar] [CrossRef]
- Chang, J.; Qu, Z.; Xu, R.; Pan, K.; Xu, B.; Min, Y.; Ren, Y.; Yang, G.; Ge, Y. Assessing the ecosystem services provided by urban green spaces along urban center-edge gradients. Sci. Rep. 2017, 7, 1–9. [Google Scholar] [CrossRef]
- Zhao, C.; Sander, H.A. Assessing the sensitivity of urban ecosystem service maps to input spatial data resolution and method choice. Landsc. Urban Plan. 2018, 175, 11–22. [Google Scholar] [CrossRef]
- Kremer, P.; Hamstead, Z.A.; McPhearson, T. The value of urban ecosystem services in New York City: A spatially explicit multicriteria analysis of landscape scale valuation scenarios. Environ. Sci. Policy 2016, 62, 57–68. [Google Scholar] [CrossRef]
- McPhearson, T.; Kremer, P.; Hamstead, Z.A. Mapping ecosystem services in New York City: Applying a social-ecological approach in urban vacant land. Ecosyst. Serv. 2013, 5, 11–26. [Google Scholar] [CrossRef]
- Van der Biest, K.; Vrebos, D.; Staes, J.; Boerema, A.; Bodí, M.B.; Fransen, E.; Meire, P. Evaluation of the accuracy of land-use based ecosystem service assessments for different thematic resolutions. J. Environ. Manag. 2015, 156, 41–51. [Google Scholar] [CrossRef]
- Wang, J.; Zhou, W.; Qian, Y.; Li, W.; Han, L. Quantifying and characterizing the dynamics of urban greenspace at the patch level: A new approach using object-based image analysis. Remote Sens. Environ. 2018, 204, 94–108. [Google Scholar] [CrossRef]
- Wang, Y.; Li, X.; Zhang, Q.; Li, J.; Zhou, X. Projections of future land use changes: Multiple scenarios-based impacts analysis on ecosystem services for Wuhan city, China. Ecol. Indic. 2018, 94, 430–445. [Google Scholar] [CrossRef]
- Greene, C.S.; Millward, A.A. Getting closure: The role of urban forest canopy density in moderating summer surface temperatures in a large city. Urban Ecosyst. 2017, 20, 141–156. [Google Scholar] [CrossRef]
- Estoque, R.C.; Murayama, Y.; Myint, S.W. Effects of landscape composition and pattern on land surface temperature: An urban heat island study in the megacities of Southeast Asia. Sci. Total Environ. 2017, 577, 349–359. [Google Scholar] [CrossRef]
- de Almeida, C.A.; Coutinho, A.C.; Esquerdo, J.C.D.M.; Adami, M.; Venturieri, A.; Diniz, C.G.; Dessay, N.; Durieux, L.; Gomes, A.R. High spatial resolution land use and land cover mapping of the Brazilian Legal Amazon in 2008 using Landsat-5/TM and MODIS data. Acta Amaz. 2016, 46, 291–302. [Google Scholar] [CrossRef]
- Tyukavina, A.; Hansen, M.C.; Potapov, P.V.; Stehman, S.V.; Smith-Rodriguez, K.; Okpa, C.; Aguilar, R. Types and rates of forest disturbance in Brazilian Legal Amazon, 2000–2013. Sci. Adv. 2017, 3, 1–15. [Google Scholar] [CrossRef]
- Tavares, P.; Beltrão, N.; Guimarães, U.; Teodoro, A. Integration of Sentinel-1 and Sentinel-2 for Classification and LULC Mapping in the Urban Area of Belém, Eastern Brazilian Amazon. Sensors 2019, 19, 1140. [Google Scholar] [CrossRef] [PubMed]
- Whyte, A.; Ferentinos, K.P.; Petropoulos, G.P. A new synergistic approach for monitoring wetlands using Sentinels -1 and -2 data with object-based machine learning algorithms. Environ. Model. Softw. 2018, 104, 40–54. [Google Scholar] [CrossRef]
- Wang, X.; Zhang, F.; Ding, J. Evaluation of water quality based on a machine learning algorithm and water quality index for the Ebinur Lake Watershed, China. Sci. Rep. 2017, 7, 1–18. [Google Scholar] [CrossRef]
- Vafaei, S.; Soosani, J.; Adeli, K.; Fadaei, H.; Naghavi, H.; Pham, T.D.; Bui, D.T. Improving accuracy estimation of Forest Aboveground Biomass based on incorporation of ALOS-2 PALSAR-2 and Sentinel-2A imagery and machine learning: A case study of the Hyrcanian forest area (Iran). Remote Sens. 2018, 10, 172. [Google Scholar] [CrossRef]
- Cian, F.; Marconcini, M.; Ceccato, P.; Giupponi, C. Flood depth estimation by means of high-resolution SAR images and LiDAR data. Nat. Hazards Earth Syst. Sci. 2018, 18, 1–25. [Google Scholar] [CrossRef]
- Van Oudenhoven, A.P.E.; Martín-López, B.; Schröter, M.; de Groot, R. Advancing science on the multiple connections between biodiversity, ecosystems and people. Int. J. Biodivers. Sci. Ecosyst. Serv. Manag. 2018, 14, 127–131. [Google Scholar] [CrossRef]
- Duan, J.; Wang, Y.; Fan, C.; Xia, B.; de Groot, R. Perception of Urban Environmental Risks and the Effects of Urban Green Infrastructures (UGIs) on Human Well-being in Four Public Green Spaces of Guangzhou, China. Environ. Manag. 2018, 62, 500–517. [Google Scholar] [CrossRef] [PubMed]
- McPhearson, T.; Parnell, S.; Simon, D.; Gaffney, O.; Elmqvist, T.; Bai, X.; Roberts, D.; Revi, A. Scientists must have a say in the future of cities. Nature 2016, 538, 165–166. [Google Scholar] [CrossRef]
- Hölscher, K.; Frantzeskaki, N.; McPhearson, T.; Loorbach, D. Tales of transforming cities: Transformative climate governance capacities in New York City, U.S. and Rotterdam, Netherlands. J. Environ. Manag. 2019, 231, 843–857. [Google Scholar] [CrossRef] [PubMed]
- McPhearson, T.; Pickett, S.T.A.; Grimm, N.B.; Niemelä, J.; Alberti, M.; Elmqvist, T.; Weber, C.; Haase, D.; Breuste, J.; Qureshi, S. Advancing Urban Ecology toward a Science of Cities. Bioscience 2016, 66, 198–212. [Google Scholar] [CrossRef]
- McHale, M.R.; Pickett, S.T.A.; Barbosa, O.; Bunn, D.N.; Cadenasso, M.L.; Childers, D.L.; Gartin, M.; Hess, G.R.; Iwaniec, D.M.; McPhearson, T.; et al. The new global urban realm: Complex, connected, diffuse, and diverse social-ecological systems. Sustainability 2015, 7, 5211–5240. [Google Scholar] [CrossRef]
- Van Oudenhoven, A.P.E.; Aukes, E.; Bontje, L.E.; Vikolainen, V.; Van Bodegom, P.M.; Slinger, J.H. ‘Mind the Gap’ between ecosystem services classification and strategic decision making. Ecosyst. Serv. 2018, 33, 77–88. [Google Scholar] [CrossRef]
- Olander, L.; Polasky, S.; Kagan, J.S.; Johnston, R.J.; Wainger, L.; Saah, D.; Maguire, L.; Boyd, J.; Yoskowitz, D. So you want your research to be relevant? Building the bridge between ecosystem services research and practice. Ecosyst. Serv. 2017, 26, 170–182. [Google Scholar] [CrossRef]
- Bibri, E.S.; Krogstie, J. Smart sustainable cities of the future: An extensive interdisciplinary literature review. Sustain. Cities Soc. 2017, 31, 183–212. [Google Scholar] [CrossRef]
- Cortinovis, C.; Geneletti, D. Land Use Policy Ecosystem services in urban plans: What is there, and what is still needed for better decisions. Land Use Policy 2018, 70, 298–312. [Google Scholar] [CrossRef]
- Gómez-Baggethun, E.; Barton, D.N. Classifying and valuing ecosystem services for urban planning. Ecol. Econ. 2013, 86, 235–245. [Google Scholar] [CrossRef]
- Gaston, K.J.; Ávila-Jiménez, M.L.; Edmondson, J.L. Managing urban ecosystems for goods and services. J. Appl. Ecol. 2013, 50, 830–840. [Google Scholar] [CrossRef]
- Uman, L.S. Information management for the busy practitioner: Systematic reviews and meta-analyses. J. Am. Acad. Child Adolesc. Psychiatry 2011, 20, 57–59. [Google Scholar] [CrossRef]
- Moher, D.; Liberati, A.; Tetzlaff, J.; Altman, D. Preferred Reporting Items for Systematic Reviews and Meta-Analyses: The PRISMA Statement. Ann. Intern. Med. 2009, 6. [Google Scholar] [CrossRef]
- Viana, J.; Santos, J.V.; Neiva, R.M.; Souza, J.; Duarte, L.; Teodoro, A.C.; Freitas, A. Remote sensing in human health: A 10-year bibliometric analysis. Remote Sens. 2017, 9, 1225. [Google Scholar] [CrossRef]
- Ostoić, S.K.; van den Bosch, C.C.K. Exploring global scientific discourses on urban forestry. Urban For. Urban Green. 2015, 14, 129–138. [Google Scholar] [CrossRef]
- Nardi, P.; Di Matteo, G.; Palahi, M.; Mugnozza, G.S. Structure and Evolution of Mediterranean Forest Research: A Science Mapping Approach. PLoS ONE 2016, 11, e0155016. [Google Scholar] [CrossRef]
- Thorn, J.; Snaddon, J.; Waldron, A.; Kok, K.; Zhou, W.; Bhagwat, S.; Willis, K.; Petrokofsky, G. How effective are on-farm conservation land management strategies for preserving ecosystem services in developing countries? A systematic map protocol. Environ. Evid. 2015, 4, 1–12. [Google Scholar] [CrossRef]
- Booth, A.; Sutton, A.; Papaioannou, D. Systematic Approaches to a Successful Literature Review, 2nd ed.; SAGE Publications: Thousand Oaks, CA, USA, 2016; ISBN 978-1-4739-1245-8. [Google Scholar]
- Neuenschwander, N.; Wissen Hayek, U.; Grêt-Regamey, A. Integrating an urban green space typology into procedural 3D visualization for collaborative planning. Comput. Environ. Urban Syst. 2014, 48, 99–110. [Google Scholar] [CrossRef]
- Holt, A.R.; Mears, M.; Maltby, L.; Warren, P. Understanding spatial patterns in the production of multiple urban ecosystem services. Ecosyst. Serv. 2015, 16, 33–46. [Google Scholar] [CrossRef]
- Cai, Y.B.; Zhang, H.; Pan, W.B.; Chen, Y.H.; Wang, X.R. Land use pattern, socio-economic development, and assessment of their impacts on ecosystem service value: Study on natural wetlands distribution area (NWDA) in Fuzhou city, southeastern China. Environ. Monit. Assess. 2013, 185, 5111–5123. [Google Scholar] [CrossRef]
- Casado-Arzuaga, I.; Onaindia, M.; Madariaga, I.; Verburg, P.H. Mapping recreation and aesthetic value of ecosystems in the Bilbao Metropolitan Greenbelt (northern Spain) to support landscape planning. Landsc. Ecol. 2014, 29, 1393–1405. [Google Scholar] [CrossRef]
- De Mola, U.L.; Ladd, B.; Duarte, S.; Borchard, N.; La Rosa, R.A.; Zutta, B. On the use of hedonic price indices to understand ecosystem service provision from urban green space in five Latin American megacities. Forests 2017, 8, 478. [Google Scholar] [CrossRef]
- Wang, H.-F.; Qureshi, S.; Qureshi, B.A.; Qiu, J.-X.; Friedman, C.R.; Breuste, J.; Wang, X.-K. A multivariate analysis integrating ecological, socioeconomic and physical characteristics to investigate urban forest cover and plant diversity in Beijing, China. Ecol. Indic. 2016, 60, 921–929. [Google Scholar] [CrossRef]
- de la Barrera, F.; Rubio, P.; Banzhaf, E. The value of vegetation cover for ecosystem services in the suburban context. Urban For. Urban Green. 2016, 16, 110–122. [Google Scholar] [CrossRef]
- Richards, D.R.; Edwards, P.J. Quantifying street tree regulating ecosystem services using Google Street View. Ecol. Indic. 2017, 77, 31–40. [Google Scholar] [CrossRef]
- Lehmann, I.; Mathey, J.; Rößler, S.; Bräuer, A.; Goldberg, V. Urban vegetation structure types as a methodological approach for identifying ecosystem services—Application to the analysis of micro-climatic effects. Ecol. Indic. 2014, 42, 58–72. [Google Scholar] [CrossRef]
- Bottalico, F.; Travaglini, D.; Chirici, G.; Garfì, V.; Giannetti, F.; De Marco, A.; Fares, S.; Marchetti, M.; Nocentini, S.; Paoletti, E.; et al. A spatially-explicit method to assess the dry deposition of air pollution by urban forests in the city of Florence, Italy. Urban For. Urban Green. 2017, 27, 221–234. [Google Scholar] [CrossRef]
- Tigges, J.; Churkina, G.; Lakes, T. Modeling above-ground carbon storage: A remote sensing approach to derive individual tree species information in urban settings. Urban Ecosyst. 2017, 20, 97–111. [Google Scholar] [CrossRef]
- Grunwald, L.; Heusinger, J.; Weber, S. A GIS-based mapping methodology of urban green roof ecosystem services applied to a Central European city. Urban For. Urban Green. 2017, 22, 54–63. [Google Scholar] [CrossRef]
- Zhang, Y.; Murray, A.T.; Turner, B.L. Optimizing green space locations to reduce daytime and nighttime urban heat island effects in Phoenix, Arizona. Landsc. Urban Plan. 2017, 165, 162–171. [Google Scholar] [CrossRef]
- Kopecká, M.; Szatmári, D.; Rosina, K. Analysis of Urban Green Spaces Based on Sentinel-2A: Case Studies from Slovakia. Land 2017, 6, 25. [Google Scholar] [CrossRef]
- Lafortezza, R.; Giannico, V. Combining high-resolution images and LiDAR data to model ecosystem services perception in compact urban systems. Ecol. Indic. 2017, 87–98. [Google Scholar] [CrossRef]
- Calderón-Contreras, R.; Quiroz-Rosas, L.E. Analysing scale, quality and diversity of green infrastructure and the provision of Urban Ecosystem Services: A case from Mexico City. Ecosyst. Serv. 2017, 23, 127–137. [Google Scholar] [CrossRef]
- Haas, J.; Ban, Y.F. Mapping and monitoring urban ecosystem services using high-resolution satellite data. IEEE J. Sel. Top. Appl. Earth Obs. Remote Sens. 2017, 10, 669–680. [Google Scholar] [CrossRef]
- Liu, Y. Dynamic evaluation on ecosystem service values of urban rivers and lakes: A case study of Nanchang City, China. Aquat. Ecosyst. Heal. Manag. 2014, 17, 161–170. [Google Scholar] [CrossRef]
- Antognelli, S.; Vizzari, M. Landscape liveability spatial assessment integrating ecosystem and urban services with their perceived importance by stakeholders. Ecol. Indic. 2017, 72, 703–725. [Google Scholar] [CrossRef]
- Singh, K.K.; Bianchetti, R.A.; Chen, G.; Meentemeyer, R.K. Assessing effect of dominant land-cover types and pattern on urban forest biomass estimated using LiDAR metrics. Urban Ecosyst. 2017, 20, 265–275. [Google Scholar] [CrossRef]
- Peng, J.; Zhao, M.; Guo, X.; Pan, Y.; Liu, Y. Spatial-temporal dynamics and associated driving forces of urban ecological land: A case study in Shenzhen City, China. Habitat Int. 2017, 60, 81–90. [Google Scholar] [CrossRef]
- Richards, D.R.; Passy, P.; Oh, R.R.Y. Impacts of population density and wealth on the quantity and structure of urban green space in tropical Southeast Asia. Landsc. Urban Plan. 2017, 157, 553–560. [Google Scholar] [CrossRef]
- Van de Voorde, T. Spatially explicit urban green indicators for characterizing vegetation cover and public green space proximity: A case study on Brussels, Belgium. Int. J. Digit. Earth 2016, 10, 798–813. [Google Scholar] [CrossRef]
- Banzhaf, E.; Kollai, H. Monitoring the urban tree cover for urban ecosystem services—The case of Leipzig, Germany. Int. Arch. Photogramm. Remote Sens. Spat. Inf. Sci. ISPRS Arch. 2015, 40, 301–305. [Google Scholar] [CrossRef]
- Larondelle, N.; Haase, D.; Kabisch, N. Mapping the diversity of regulating ecosystem services in European cities. Glob. Environ. Chang. 2014, 26, 119–129. [Google Scholar] [CrossRef]
- Kim, G.; Miller, P.A.; Nowak, D.J. Assessing urban vacant land ecosystem services: Urban vacant land as green infrastructure in the City of Roanoke, Virginia. Urban For. Urban Green. 2015, 14, 519–526. [Google Scholar] [CrossRef]
- Behling, R.; Bochow, M.; Foerster, S.; Roessner, S.; Kaufmann, H. Automated GIS-based derivation of urban ecological indicators using hyperspectral remote sensing and height information. Ecol. Indic. 2015, 48, 218–234. [Google Scholar] [CrossRef]
- Goldenberg, R.; Kalantari, Z.; Cvetkovic, V.; Mörtberg, U.; Deal, B.; Destouni, G. Distinction, quantification and mapping of potential and realized supply-demand of flow-dependent ecosystem services. Sci. Total Environ. 2017, 593–594, 599–609. [Google Scholar] [CrossRef]
- Chen, A.; Yao, X.A.; Sun, R.; Chen, L. Effect of urban green patterns on surface urban cool islands and its seasonal variations. Urban For. Urban Green. 2014, 13, 646–654. [Google Scholar] [CrossRef]
- Fusaro, L.; Marando, F.; Sebastiani, A.; Capotorti, G.; Blasi, C.; Copiz, R.; Congedo, L.; Munafò, M.; Ciancarella, L.; Manes, F. Mapping and assessment of PM10 and O3 removal by woody vegetation at urban and regional level. Remote Sens. 2017, 9, 791. [Google Scholar] [CrossRef]
- Manes, F.; Marando, F.; Capotorti, G.; Blasi, C.; Salvatori, E.; Fusaro, L.; Ciancarella, L.; Mircea, M.; Marchetti, M.; Chirici, G.; et al. Regulating Ecosystem Services of forests in ten Italian Metropolitan Cities: Air quality improvement by PM10and O3removal. Ecol. Indic. 2016, 67, 425–440. [Google Scholar] [CrossRef]
- Manes, F.; Silli, V.; Salvatori, E.; Incerti, G.; Galante, G.; Fusaro, L.; Perrino, C. Urban ecosystem services: Tree diversity and stability of PM10 removal in the metropolitan area of Rome. Annali di Botanica 2014, 4, 19–26. [Google Scholar] [CrossRef]
- Manes, F.; Salvatori, E. Ecosystem services of urban trees: The case of rome. Agrochimica 2014, 58, 222–233. [Google Scholar] [CrossRef]
- Ala-Hulkko, T.; Kotavaara, O.; Alahuhta, J.; Helle, P.; Hjort, J. Introducing accessibility analysis in mapping cultural ecosystem services. Ecol. Indic. 2016, 66, 416–427. [Google Scholar] [CrossRef]
- Bai, X.; Dawson, R.J.; Ürge-Vorsatz, D.; Delgado, G.C.; Salisu Barau, A.; Dhakal, S.; Dodman, D.; Leonardsen, L.; Masson-Delmotte, V.; Roberts, D.C.; et al. Six research priorities for cities and climate change. Nature 2018, 555, 23–25. [Google Scholar] [CrossRef] [PubMed]
- Li, C.; Zhu, X.; Wei, Y.; Cao, S.; Guo, X.; Yu, X.; Chang, C. Estimating apple tree canopy chlorophyll content based on Sentinel-2A remote sensing imaging. Sci. Rep. 2018, 8, 1–10. [Google Scholar] [CrossRef]
- Poursanidis, D.; Chrysoulakis, N. Remote Sensing Applications: Society and Environment Remote Sensing, natural hazards and the contribution of ESA Sentinels missions. Remote Sens. Appl. Soc. Environ. 2017, 6, 25–38. [Google Scholar] [CrossRef]
- Li, J.; Roy, D.P. A Global Analysis of Sentinel-2A, Sentinel-2B and Landsat-8 Data Revisit Intervals and Implications for Terrestrial Monitoring. Remote Sens. 2017, 9, 902. [Google Scholar] [CrossRef]
- Popkin, G. US government considers charging for popular Earth-observing data. Nature 2018, 556, 417–418. [Google Scholar] [CrossRef]
- Reiche, J.; Lucas, R.; Mitchell, A.L.; Verbesselt, J.; Hoekman, D.H.; Haarpaintner, J.; Kellndorfer, J.M.; Rosenqvist, A.; Lehmann, E.A.; Woodcock, C.E.; et al. Combining satellite data for better tropical forest monitoring. Nat. Clim. Chang. 2016, 6, 120–122. [Google Scholar] [CrossRef]
- Joshi, N.; Baumann, M.; Ehammer, A.; Fensholt, R.; Grogan, K.; Hostert, P.; Jepsen, M.R.; Kuemmerle, T.; Meyfroidt, P.; Mitchard, E.T.A.; et al. A review of the application of optical and radar remote sensing data fusion to land use mapping and monitoring. Remote Sens. 2016, 8, 70. [Google Scholar] [CrossRef]
- Nery, T.; Sadler, R.; Solis-Aulestia, M.; White, B.; Polyakov, M.; Chalak, M. Comparing supervised algorithms in Land Use and Land Cover classification of a Landsat time-series. In Proceedings of the 2016 IEEE International Geoscience and Remote Sensing Symposium (IGARSS), Beijing, China, 10–15 July 2016; pp. 5165–5168. [Google Scholar]
- Thi, H.; Nguyen, T.; Doan, T.M.; Radeloff, V. Applying Random Forest Classification To Map Land Use/Land Cover Using Landsat 8 Oli. ISPRS Int. Arch. Photogramm. Remote Sens. 2018, XLII-3/W4, 363–367. [Google Scholar]
- Deus, D. Integration of ALOS PALSAR and Landsat Data for Land Cover and Forest Mapping in Northern Tanzania. Land 2016, 5, 43. [Google Scholar] [CrossRef]
- Maxwell, A.E.; Warner, T.A.; Fang, F. Implementation of machine-learning classification in remote sensing: An applied review. Int. J. Remote Sens. 2018, 39, 2784–2817. [Google Scholar] [CrossRef]
- Alonzo, M.; McFadden, J.P.; Nowak, D.J.; Roberts, D.A. Mapping urban forest structure and function using hyperspectral imagery and lidar data. Urban For. Urban Green. 2016, 17, 135–147. [Google Scholar] [CrossRef]
- Sasaki, T.; Imanishi, J.; Fukui, W.; Morimoto, Y. Fine-scale characterization of bird habitat using airborne LiDAR in an urban park in Japan. Urban For. Urban Green. 2016, 17, 16–22. [Google Scholar] [CrossRef]
- Alam, M.; Dupras, J.; Messier, C. A framework towards a composite indicator for urban ecosystem services. Ecol. Indic. 2016, 60, 38–44. [Google Scholar] [CrossRef]
- Baró, F.; Palomo, I.; Zulian, G.; Vizcaino, P.; Haase, D.; Gómez-Baggethun, E. Mapping ecosystem service capacity, flow and demand for landscape and urban planning: A case study in the Barcelona metropolitan region. Land Use Policy 2016, 57, 405–417. [Google Scholar] [CrossRef]


© 2019 by the authors. Licensee MDPI, Basel, Switzerland. This article is an open access article distributed under the terms and conditions of the Creative Commons Attribution (CC BY) license (http://creativecommons.org/licenses/by/4.0/).
Share and Cite
Tavares, P.A.; Beltrão, N.; Guimarães, U.S.; Teodoro, A.; Gonçalves, P. Urban Ecosystem Services Quantification through Remote Sensing Approach: A Systematic Review. Environments 2019, 6, 51. https://doi.org/10.3390/environments6050051
Tavares PA, Beltrão N, Guimarães US, Teodoro A, Gonçalves P. Urban Ecosystem Services Quantification through Remote Sensing Approach: A Systematic Review. Environments. 2019; 6(5):51. https://doi.org/10.3390/environments6050051
Chicago/Turabian StyleTavares, Paulo Amador, Norma Beltrão, Ulisses Silva Guimarães, Ana Teodoro, and Paulo Gonçalves. 2019. "Urban Ecosystem Services Quantification through Remote Sensing Approach: A Systematic Review" Environments 6, no. 5: 51. https://doi.org/10.3390/environments6050051
APA StyleTavares, P. A., Beltrão, N., Guimarães, U. S., Teodoro, A., & Gonçalves, P. (2019). Urban Ecosystem Services Quantification through Remote Sensing Approach: A Systematic Review. Environments, 6(5), 51. https://doi.org/10.3390/environments6050051