Article

The Possibility of Generating Electricity Using Small-Scale Wind Turbines and Solar Photovoltaic Systems for Households in Northern Cyprus: A Comparative Study

by
Youssef Kassem
1,2,*,
Raafat Al Zoubi
1 and
Hüseyin Gökçekuş
1
1
Department of Civil Engineering, Civil and Environmental Engineering Faculty, Near East University, 99138 Nicosia (via Mersin 10, Turkey), Cyprus
2
Department of Mechanical Engineering, Engineering Faculty, Near East University, 99138 Nicosia (via Mersin 10, Turkey), Cyprus
*
Author to whom correspondence should be addressed.
Environments 2019, 6(4), 47; https://doi.org/10.3390/environments6040047
Submission received: 7 March 2019 / Revised: 17 April 2019 / Accepted: 18 April 2019 / Published: 22 April 2019

Abstract

:
The increased energy demand and related environmental problems caused by burning fossil fuels have raised interest in alternative energy sources. This study investigated the wind characteristics and available wind energy for three urban regions in Northern Cyprus using the Weibull distribution function. The results illustrate that Gazimağusa is the most applicable location for harvesting the kinetic energy of the wind compared to Lefkoşa and Girne. Moreover, the solar potential at a specific location can be analyzed using a different simulation tool. In the present paper, the performance of a rooftop Photovoltaic (PV) system for household buildings in three selected is assessed. Three types of simulation software (PVGIS, PV*SOL, and PVWatts) are used to evaluate the performance of the 6.4 kWp grid-connected rooftop PV system. This study assessed the energy generation, performance ratio and capacity factor for this PV system. The results concluded that PVGIS is an easy, fast, and reliable software tool that can be used for the simulation of a solar PV system in the studied regions. Furthermore, an economic evaluation of renewable systems in the three urban regions is presented. As a result, a small-scale grid-connected solar/wind system that is able to generate electricity with an excellent percentage of clean energy was proposed and developed. The analysis indicates that the proposed PV projects showed significant potential in the studied locations. In addition, the proposed PV system is the most economical option for generating electricity compared to wind systems due to the low electricity prices and of the ability to recover the initial investment. Consequently, it is expected that the simulation results will help in demonstrating the advantages and challenges of installing grid-connected PV systems for households in Northern Cyprus in order to reduce the electricity consumption produced by fossil fuels.

1. Introduction

In Northern Cyprus, the electricity is currently produced using diesel generator power stations and PV power plant, which have been installed in Serhatköy with capacities of 212 MW and 1.27 MW, respectively [1,2]. Moreover, the growth of the population has led to an increase in energy demand, where nearly all of the energy production is currently dependent on fossil fuels. The increasing demand placed on conventional sources has encouraged the authors to investigate the field of renewable energy sources for generating electricity in the Northern part of Cyprus, especially wind and solar energy.
Renewable energy sources are considered by many as clean alternatives to fossil fuels that can provide sustainable energy solutions [3,4,5]. Renewable energies such as wind and solar energy are recognized as alternative resources for generating electricity in the future [6]. A key advantage of solar and wind energy is that they avoid carbon dioxide emissions [7]. Wind energy and sunlight can be converted directly into electricity using wind turbines and solar photovoltaic (PV) systems, respectively [8]. They are now used extensively for meeting the electricity demand in many countries such as India [9], Pakistan [10], Turkey [11] and Saudi Arabia [12].
Several researchers have studied the wind and solar potential of various locations around the world [2,13,14,15,16,17,18,19]. For instance, Alayat et al. [13] made techno-economic assessment of the wind power potential for eight locations, namely, Lefkoşa, Ercan, Girne, Güzelyurt, Gazimağusa, Dipkarpaz, YeniBoğaziçi, and Salamis, distributed over the Northern part of Cyprus. The results showed that small-scale wind turbine use could be suitable for generating electricity in the studied locations. Kassem et al. [2] evaluated the economic feasibility of 12 MW grid-connected wind farms and PV plants for producing electricity in Girne and Lefkoşa in Northern Cyprus. The authors concluded that PV plants are the most economical option compared to wind farms for generating electricity in the studied regions. Kassem et al. [14] analyzed the wind power potential in the Salamis region of Northern Cyprus. They found that high capacity wind turbines (MW) are not suitable for electricity production in the region based on the wind power density value. Solyali et al. [15] studied the wind power potential for the Selvili-Tepe location in Northern Cyprus. The authors found that the wind energy resources at this location are classified as marginal (wind power class is 2). Kassem and Gökçekuş [16] conducted a techno-economic assessment of a proposed 1MW grid-connected PV power plant in the town of Lefke. The analysis results showed that a PV plant could be used as a viable alternative for reducing the GHG emissions in Northern Cyprus and generating electricity from environmentally friendly sources. Azad et al. [17] investigated the wind energy assessment at different hub heights in desired locations using the Weibull distribution function. The results showed that the wind power sources in the site are categorized as poor. Albani and Ibrahim [18] analyzed the wind energy potential at three coastal locations in Malaysia. They concluded that the production of wind energy is only feasible and practical at certain locations in Malaysia. Mohammadi et al. [19] presented a techno-economic analysis of developing 5MW grid-connected PV power plants in Iran. The results indicated that the 1-axis tracking system is the most economical option compared to fixed tilt and 2-axis tracking systems. Huang et al. [20] estimated the solar radiation on building roofs in an urban area in China using three models. They found that the SHORTWAVE-C model can accurately estimate the solar radiation intensity in a complex urban environment under cloudy conditions, and the GPU acceleration method can reduce the computation time by up to 46%.
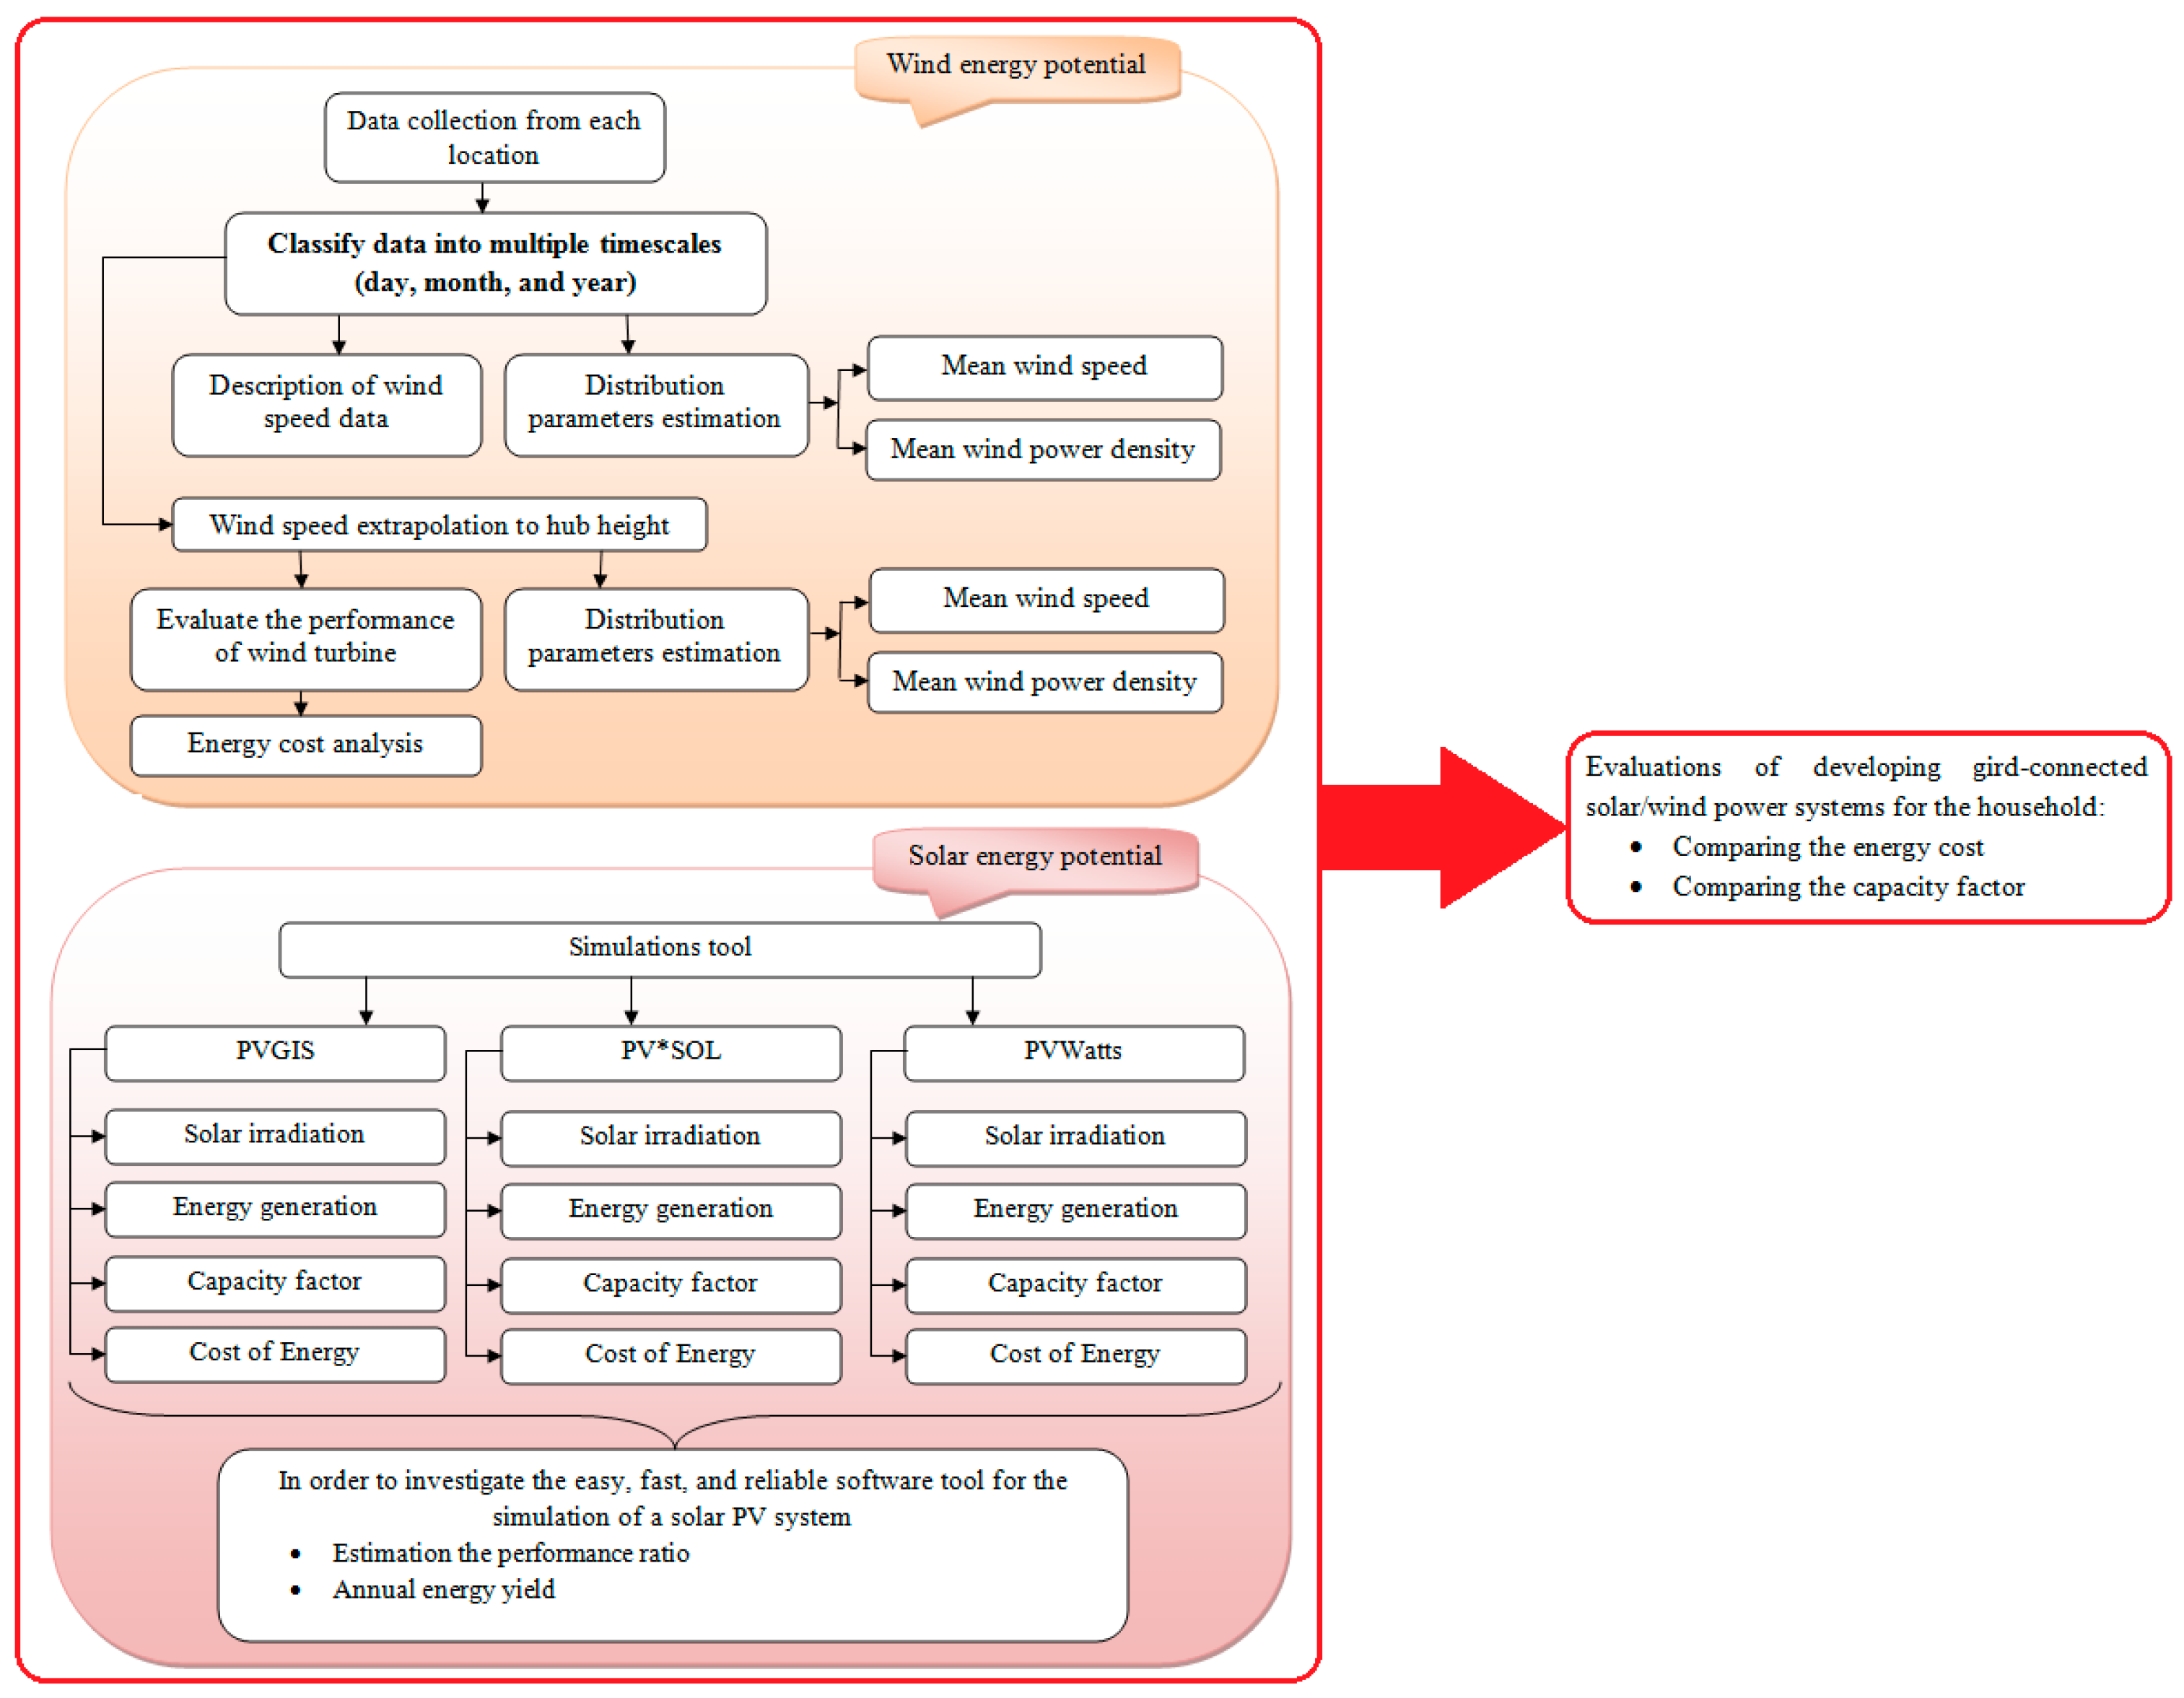
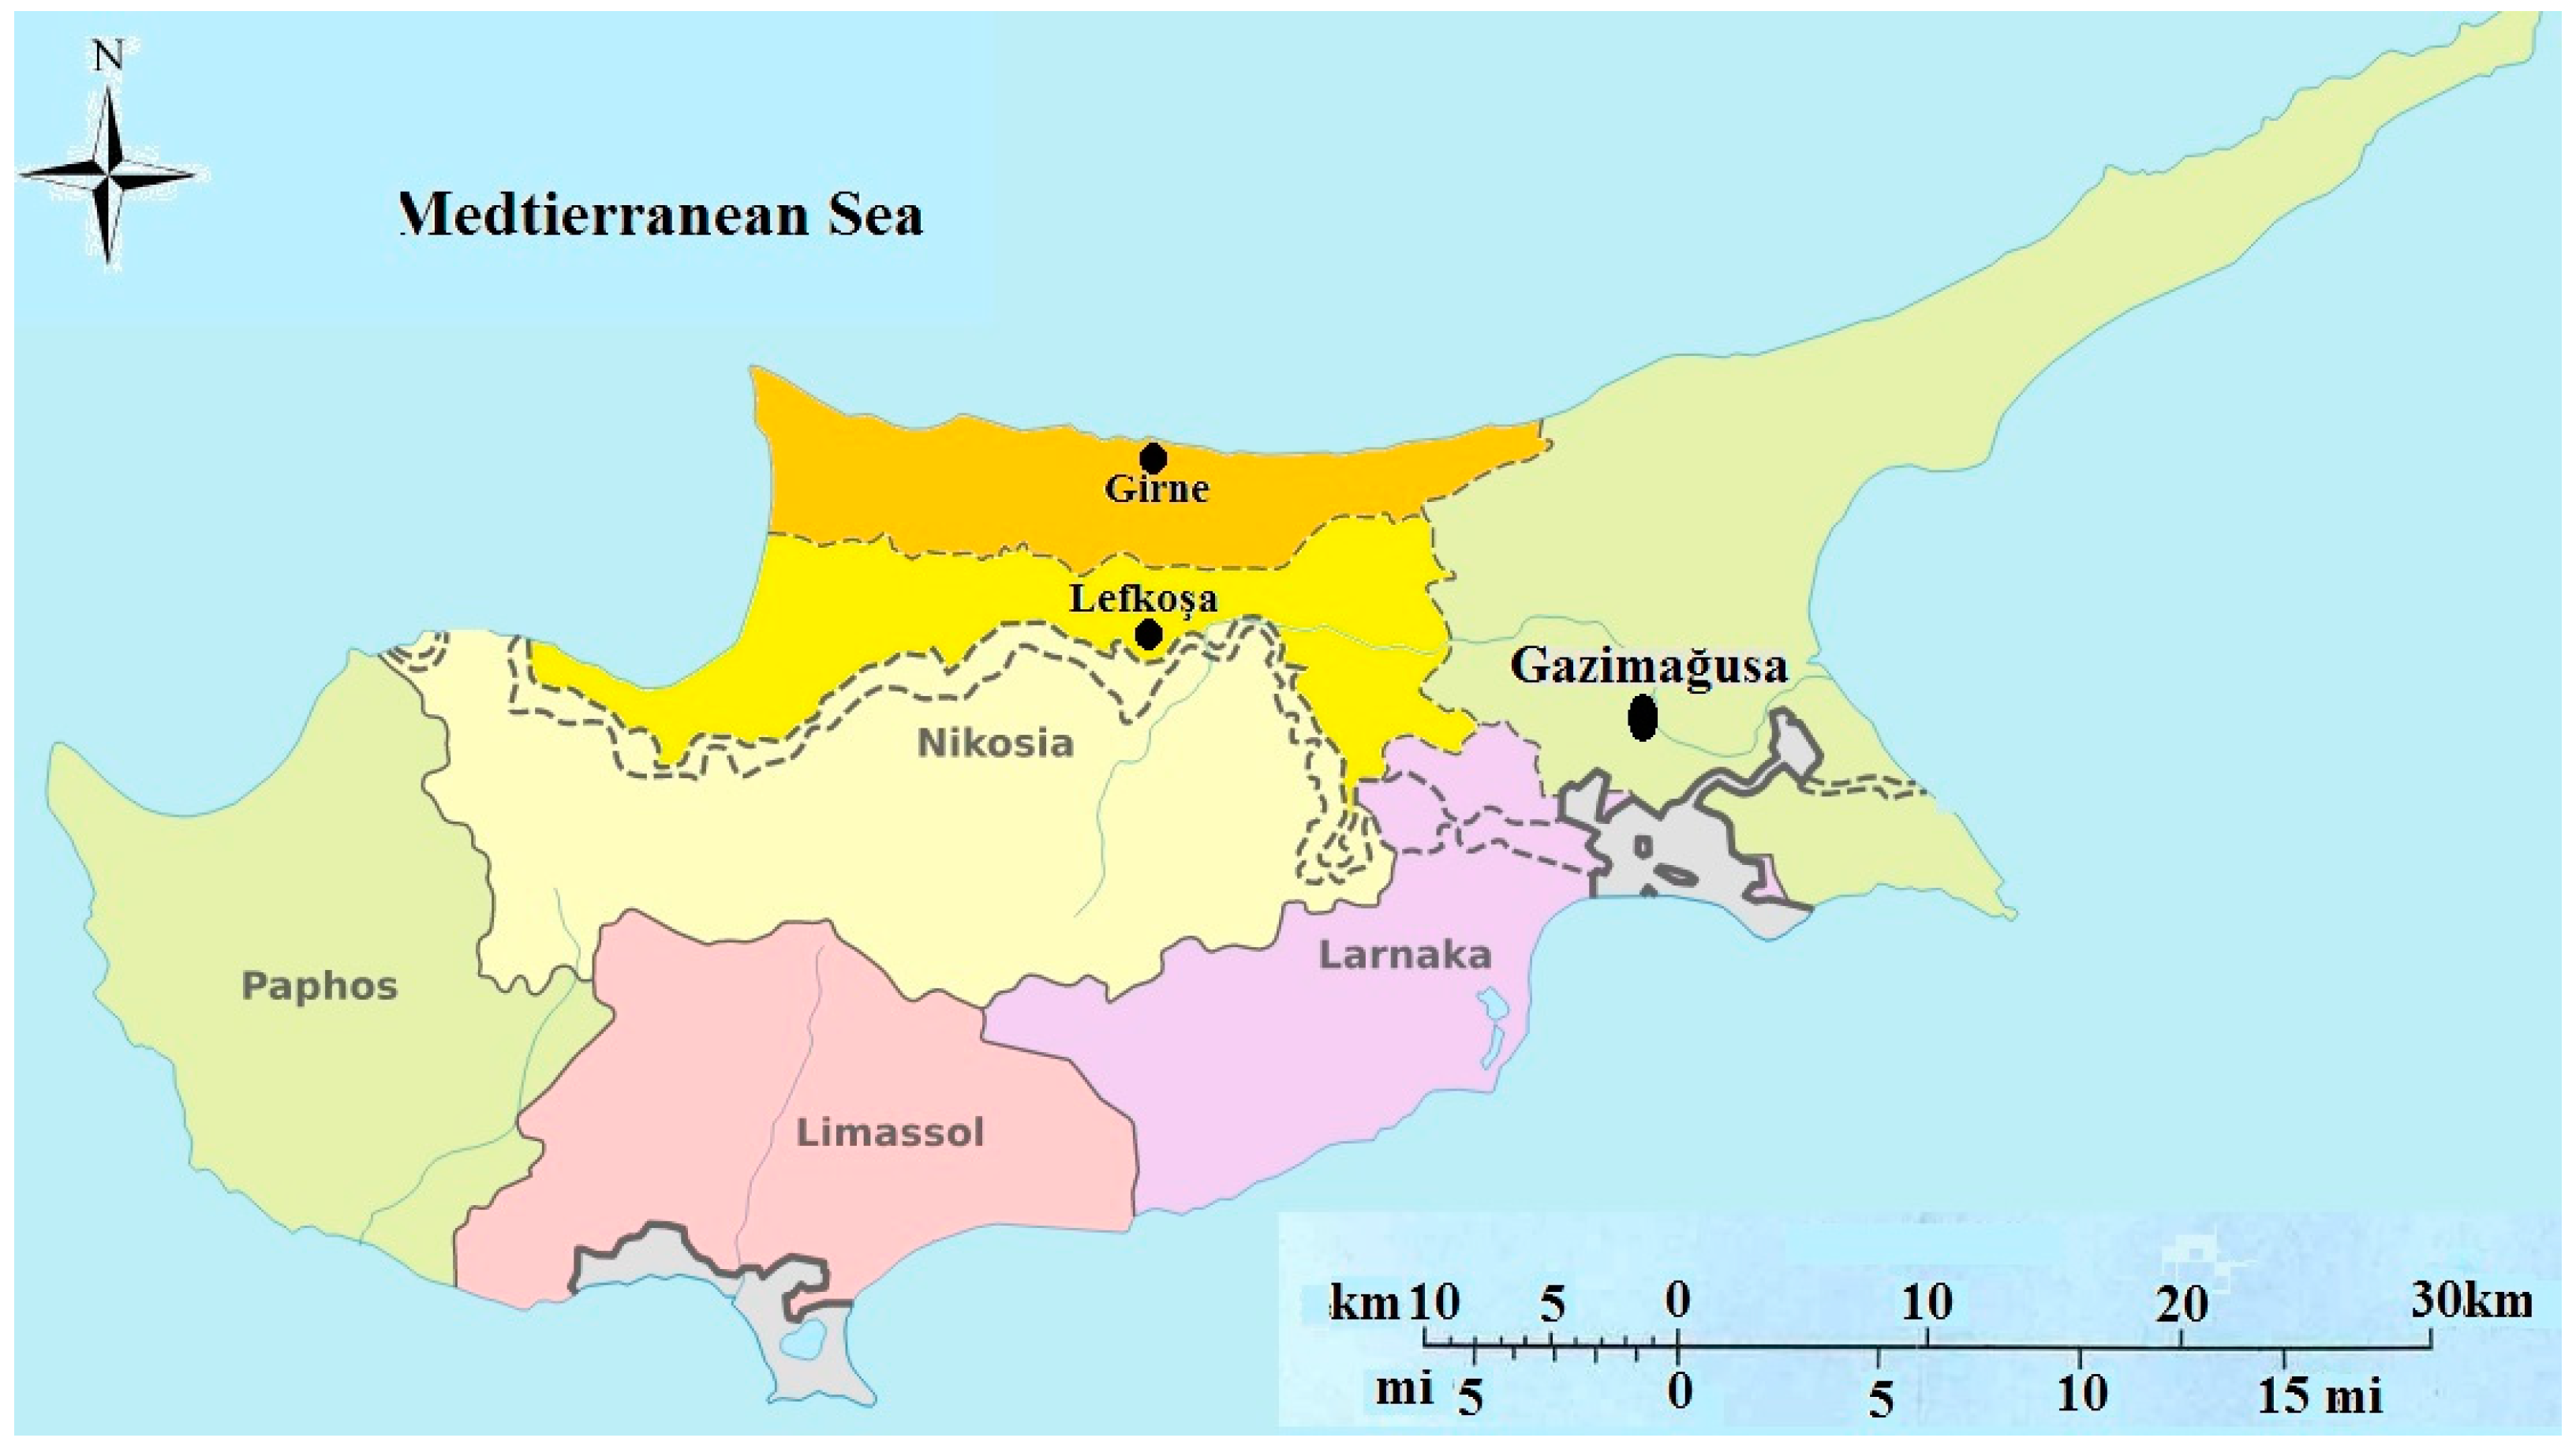
As a continuation of authors’ studies on renewable energy potential in Northern Cyprus, this paper aims to provide a better understanding of the relationship between renewable technologies (wind turbines and PV) and the cheapest energy cost at urban regions located in the Northern part of Cyprus. In this regard, the goals of the current study are divided into two parts. In the first part, the wind energy potential of the Northern part of the island based on three selected locations (Lefkoşa, Girne, and Gazimağusa) is analyzed using the Weibull distribution function. In addition, the maximum likelihood method is used to determine the Weibull parameters. Furthermore, an economic study of 12 wind turbine models in the selected regions using the method of the present value of costs is evaluated. In the second part, the paper aims to assess and characterize the solar potential in three urban regions (Lefkoşa, Girne, and Gazimağusa). Three kinds of simulation software, namely PVGIS, PV*SOL, and PVWatts, are used to evaluate the performance of a 6.4 kWp grid-connected rooftop PV system for the household. Moreover, this study compares the annual energy yield, performance ratio and energy yield of the PV system from various software. The overall objective of the study is to determine the best and cheapest renewable technologies in terms of PV systems and wind turbines that can be used to generate electricity at three different locations in Northern Cyprus.
The rest of the paper is structured as follows: Section 2 presents overall information about the collected wind data, wind data adjustment, and analysis procedure. Section 3 describes the wind speed characteristics at the studied locations and analyzes the wind power densities at different heights to evaluate the wind energy potential in detail. It also discusses the economic evaluation and the performance of small-scale vertical and horizontal axis wind turbines. Furthermore, the solar resource potential, energy generation and performance comparison between the three different simulations tools are presented in Section 3. Section 4 presents the discussions, and Section 5 provides significant conclusions.

2. Materials and Methods

This section is divided into two parts. In the first part, the statistical analysis of wind speed measured at a height of 10 m at three urban regions in Northern Cyprus is discussed. The Weibull distribution function is used to determine the wind power density at the studied regions. The power law method is utilized to estimate the wind speed at various hub heights. The annual energy outputs, capacity factors and electricity-generated cost were derived for small-scale wind turbines of various sizes and types. In the second part, the solar potential at a specific location is analyzed using a different simulations tool. Therefore, the performance of a rooftop grid-connected PV system for small household buildings in selected regions in the Northern part of Cyprus is assessed. Three kinds of simulation software (PVGIS, PV*SOl and PVWatts) are used to evaluate the performance of the 6.4 kWp grid-connected rooftop PV system. Additionally, the energy generation, performance ratio capacity factor for this PV system and energy cost are calculated. Figure 1 illustrates the procedure analysis of the current study.

2.1. Wind Data Measurement

In the investigation of the wind energy potential and characteristics, three studied locations; namely, Lefkoşa, Girne, and Gazimağusa in Northern Cyprus, hourly wind speed data was collected from the Meteorology Department located in Lefkoşa for various periods (2010–2016). The obtained wind data are of the surface type obtained at a height of 10 m. These have been extrapolated to various heights using the Weibull distribution technique and the locations’ wind shear exponents. The meteorological information and locations of the studied regions are given in Table 1 and Figure 2, respectively.

2.2. Wind Characteristics Model

Several methods are used for the assessment of wind resources for a specific site based on data measured by meteorological stations. Direct methods such as Weibull and Rayleigh and indirect methods like atmospheric boundary layer wind tunnel testing and numerical simulation with Computational Fluid Dynamics (CFD) are widely used for the assessment of wind resources for a specific region [20].
In general, estimating the wind speed in an urban environment is difficult due to the varying roughness, the drag exerted by surface-mounted obstacles on the flow and the presence of adjacent buildings [20]. Hence, it is conceivable that the lack of accurate approaches for the assessment of wind speed in urban areas is a major impediment to the successful development of micro-scale energy generation [21]. The most dependable method for wind assessment in the urban environment is to directly measure the wind speed in the region, ideally at the position and the height of the proposed wind turbine [20].
In the current study, two parameters Weibull distribution is utilized to evaluate the wind speed characteristics of the studied locations. When analyzing the wind energy potential of the interested region, a function, which gives the probability density ( f ( v ) ) and cumulative distribution ( F ( v ) ) functions for the Weibull distribution, is expressed in Equations (1) and (2) [22,23,24,25]:
f ( v ) = ( k c ) ( v c ) k 1 e ( v c ) k
F ( v ) = 1 e x p [ ( v c ) k ]
where c is the scale parameter in m/s and k is the shape factor of distribution.
Both equations depend on wind speed, scale parameter and shape factor. Determination of these parameters plays an important role when analyzing the wind characteristics. The maximum likelihood method (MLM) is used to estimate the parameters of the distribution function. This method evaluates the parameters of the distribution function in a time-series format. Generally, this method may require a higher number of iterations when compared to other methods. However, it is very popular among similar studies due to its simplicity. The equations that are used to determine the scale (c) and shape (k) parameters of the distribution are given as [25,26]:
k = ( 1 n v i k l n ( v i ) 1 n v i k 1 n l n ( v i ) n ) 1
c = ( 1 n 1 n v i k ) 1 / k
where n is used to represent the total number of data points in a particular period of time, and v i is the speed of the wind measured at the interval i.
In most cases, an accurate value of the surface roughness coefficient is not readily available or ascertained. Therefore, another approach is to use the Weibull probability function parameter values which are determined at the measured height and extrapolate them to the hub heights using the following expressions [27,28] as:
c ( z ) = c 0 ( z z 10 ) n
k ( z ) = k 0 [ 1 0.088 ln ( z 10 10 ) ] [ 1 0.088 ln ( z 10 10 ) ]
where c 0 and k 0 are the scale and shape factors, respectively, at the measurement height z 0 , while z is the hub height. The exponent n is defined as [27,28]:
n = [ 0.37 0.088 l n ( c 0 ) ] 1 0.088 ln ( z 10 )

2.3. Wind Power Density (WPD)

The wind energy potential at a specific region is evaluated by wind power density (WPD). The air density and wind speed are the major parameters that affect the value of WPD. The WPD can be calculated by measured values (Equation (8)) and PDF values (Equation (9)). It can be estimated as [29]
P A = 1 2 ρ v 3
P A = 1 2 ρ v 3 f ( v )
Moreover, for a period measurement, the average WPD can be determined using Equation (10) [30].
P ¯ A = 1 2 ρ v ¯ 3
where P is wind power density in W, A is swept area in m2, ρ is air density (ρ = 1.225 kg/m3), f ( v ) is the probability density function (PDF), P ¯ the mean wind power density in W and v ¯ is the mean wind speed in m/s.

2.4. Most Probable Wind Speed and Wind Speed Carrying Maximum Energy

The wind speeds that are most possible or probable ( v m p ) and carry the highest (maximum) energy ( v max E ) are necessary for approximating wind power. The two wind speeds are obtained from the scale and shapes factors, as expressed in Equations (11) and (12) [30].
v m p = c ( 1 1 k ) 1 / k
v max E = c ( 1 + 2 k ) 1 / k

2.5. Wind Speed Variation

In order to determine the energy produced by a wind turbine, the power law model is used to estimate the wind speed at different hub heights [30,31].
v v 10 = ( z z 10 ) α
where v is the wind speed at the wind turbine hub height z, v 10 is the wind speed at original height z 10 (original height is the measured height, which is 10 m height), and α is the surface roughness coefficient (Equation (14)) [30,31].
α = 0.37 0.088 l n ( v 10 ) 1 0.088 l n ( z 10 / 10 )

2.6. Wind Turbine Energy Output

The output power of any turbine can be determined power curve of turbine and wind speed of the specific locations [32]. The power curve of wind turbines can be approximated with a parabolic law as given by [32,33,34]
P ( v i ) = { P r v i 2 v c i 2 v r 2 v c i 2 v c i v i v r P r v r v i v c o 0 v i v c i   a n d   v i v c o
where v i is the vector of possible wind speed at a given site, P ( v i ) is the vector of corresponding power of the wind turbine (W), P r is the rated power of the turbine (W), v c i is the cut-in wind speed (m/s), v r is the rated wind speed (m/s) and v c o is the cut-off wind speed (m/s) of the wind turbine.
Suitable to simulate the power curve of a pitch-controlled wind turbine and to a lesser extent a stall- or a yaw-controlled wind turbine, which do not have a constant power range and thus neglects the power output exceeding P r .
The coefficient of performance ( C p ) can be calculated as [32]
C p = 2 P r ρ A v r 3 ,
The total energy generated ( E w t ) by the operation of the wind turbine over a period (t) can be determined as [32]
E w t = i = 1 n P ( v i ) × t ,
Lastly, the capacity factor (CF) of a wind turbine can be estimated as [32]
C F = E w t P r . t ,

2.7. Economic Analysis

The capital cost of the project, cost of operation and maintenance system and the economic design life of the turbine are the main factors that govern the wind power costs for the specific region [35,36]. The present value of costs (PVC) method is widely used to determine the wind energy cost [37]. It can be expressed as
P V C = [ I + C o m r ( 1 + i r i ) × [ 1 ( 1 + i 1 + r ) n ] S ( 1 + i 1 + r ) n ]
where r is the discount rate, i is the inflation rate, n is the machine life as designed by the manufacturer, C o m r is the cost of operation and maintenance, I is the investment summation of turbine price and other initial costs, including provisions for civil work, land, infrastructure, installation and grid integration and S is the scrap value of the turbine price and civil work.
The electricity generated cost per kWh (EGC) can be estimated as [37]:
U C E = P V C t × P r × C F

2.8. PV System Description

A residential building with a small space available on the rooftop area (roughly 70 m2) is used in this study. Table 2 shows the description of the 6.4 kWp rooftop system used. The proposed PV panel for the 6.4 kWp system is composed of Mono-crystalline cell material. The system is of a fixed stand type and can sufficiently power a household comprised of a small family. The components of the grid-connected solar PV plants are
  • Solar module: the present solar module manufacturing industries produce different types of solar panels categorized based on the materials used.
  • Inverters: inverters are chosen based on the rating of the solar power system.
  • Mountings: include structures on which PV panels, inverters, and other accessories are placed. The mounting of PV panels is a major consideration; it is important to ensure that they are mounted at optimal angles according to the site conditions.
  • Grid connection: includes a sub-station and its components like transformers, net metering systems, protection systems, DC/AC inverter, DC/AC breakers fuses.
  • DC/AC cables: cables are required for connecting panels, inverter and to the grid.

2.9. Solar PV Simulation Software

In this study, the solar resource potentials for the selected towns in Northern Cyprus are taken from the radiation databases available from various software. Table 3 shows the various system software used for assessing the performance analysis of the rooftop solar PV systems.

3. Results

3.1. Wind Speed Characteristics at 10 m Height

Variations of the average monthly wind speeds for each region during the investigation period (2010–2016) are illustrated in Figure 3. In addition, monthly wind speeds for the entire measurement period are shown in Figure 3. It is found that Gazimağusa has the highest wind speed values compared to other regions. The mean monthly wind speeds for Gazimağusa range from 3.7 m/s to 7.2 m/s and the general trend is that the mean wind speed decreases from March to August and then starts to increase afterward for the rest of the year. Furthermore, it is observed that the lowest wind speeds for Lefkoşa are around 1.5 m/s in November and highest values appear in June with 3.5 m/s. The monthly wind speed values illustrate that the minimum and maximum average wind speeds vary between approximately 1.5 m/s and 3.4 m/s for Girne.
Moreover, the mean hourly wind speeds that vary within a 24-h period in the selected regions in Northern Cyprus, are shown in Figure 4. It is evident from the charts in Figure 4 that similar patterns within the 24-h period are observed during the investigation period. The hourly average wind speeds slowly decrease early in the mornings and then start to increase until they reach a peak. After the highest values of the period, wind speeds are observed to decrease in Lefkoşa and Girne, but not in Gazimağusa. The average wind speed in the Gazimağusa region decreases from 1 a.m. to 8 a.m. and shows a sharp increase afterward, where it reaches its maximum value at around 1 p.m. The wind speeds decrease after 1 p.m. in Famagusta until 8 p.m. and the mean values show a marginal increase through the night. Overall, it can be determined from the data in Figure 3 that the coastal areas record maximum average wind speeds late in the afternoon and the minimum value occurs between 4 a.m. and 6 a.m. In contrast, the maximum wind speeds were observed at 2 p.m. and the minimum speeds were between 3 a.m. and 4 a.m. in Lefkoşa, which is the capital city of the Northern part of Cyprus and has the highest building density.
As can be seen from Figure 3 and Figure 4, the characteristics of the mean wind speed vi may be somewhat different from year to year. It is generally believed that in order to obtain a quantitative, representative and persuasive interpretation of wind characteristics, longer periods of wind data are highly preferable.
Unfortunately, on most occasions, long period wind measurements are often unavailable [38]. Therefore, this study introduces the term relative error (ξ) to account for any possible bias originating from insufficient wind data [39]. The relative error (ξ) for each year is calculated through Equation (21) and plotted in Figure 5.
ξ = v i v ¯ v × 100 %
where vi denotes the annual mean wind speed of the concerned year and v ¯ is the mean wind speed during the whole period from 2010 to 2016. Figure 4 shows that during the seven-year period, the maximum relative error occurs in the year 2013 (6.18%) for Gazimağusa. For Lefkoşa and Girne, the maximum relative errors are found to be, 6.55% (2013) and 5.95% (2013), respectively.

3.2. Wind Speed Frequency Distribution at 10 m Height

Table 4 illustrates the shape (k) and scale (c) values evaluated at each location for the entire wind data obtained for the seven-year period between 2010 and 2016. Additionally, Figure 6 presents the yearly variations of the shape and scale parameters for the seven-year period at the three studied locations. It can be noted that the calculated yearly k parameter does not show significant differences throughout the years for all measurement locations. However, the c parameter shows profound changes during the measurement period. Moreover, the annual wind speed frequency distribution data for each region are presented in Figure 7 for the period 2010 to 2016.

3.3. Wind Speed and Wind Power Density at Various Heights

The optimum wind speed for a typical wind turbine should be equal to or higher than 6.7 m/s. At the same time, it is important to note that wind speeds higher than 11 m/s can be dangerous; therefore, it is not safe to invest in a wind turbine in regions that have a wind speed of more than 11 m/s wind speed during the year [31]. The roughness coefficient is expressed by the exponent α, which is associated with the characteristics of the land surface and its value varies between 0.05 and 0.5 [25,31]. The surface roughness values (α) determined by using Equation (14) for the different locations are given in Table 5.
In this paper, annual mean wind speeds are estimated for different heights of 30, 50, 80, and 90 m by using the roughness coefficients listed in Table 3. The wind speed increases as one moves higher above the ground and this variation is called the wind shear profile. Figure 8 presents the wind shear profiles in the three different regions that are included in this study.
Data collected from each region at a height of 10 m have been extrapolated to the various heights, as shown in Table 6. Among the regions investigated in this study, the maximum estimated power density became prominent in the Gazimağusa region, where the highest density is 288.96 W/m2 at a height of 90 m (Table 6). According to the results of the current study and the mean power density ranges found in the literature [40], all of the locations chosen for investigation indicate poor wind energy potential. Therefore, high capacity wind turbines (MWs) are not feasible to be investigated in these areas. Nevertheless, small-scale wind turbines can be used to gather wind energy potential in these regions.

3.4. Economic Analysis of Wind Potential

In the wind turbine industry, the wind turbine is classified into two categories, which are horizontal and vertical axis wind turbines [41]. Horizontal axis wind turbines are the most common turbines used today [42]. The selection of wind turbine is a function of the wind power density of the region and class. It is essential that the wind resources are accurately modelled for site evaluation and sizing of the wind turbine. The amount of electricity that can be produced from the wind turbine depends on the wind speed of the specific region. Therefore, the wind speed measurements of the studied region and the power curve of the selected wind turbine are the most important factors for choosing the best wind turbine for the specific region. The selected wind turbines have been chosen after an overall comparison between different types of wind turbines. The specification of the selected wind turbines is tabulated in Table 7.
In this work, the capacity factor and generated electricity of different types of wind turbine systems that could be placed on the roof of a reference building with different heights are studied.
Table 8 presents the results of the capacity factor (CF) and annual generated electricity (GE) of 12 wind turbine models for all selected locations. It is observed that the values of CF of the wind systems in Gazimağusa are the highest compared to other locations and range from 19.25% to 56.31%, which depends on the type of wind turbine. Additionally, it is observed that the CF values of Alize, Iskra, Eurowind 1 and Eurowind 2 at all locations are very low, which indicates that these models are not suitable for generating electricity for all studied locations.
Moreover, the cost of unit energy per kWh (UCE) based on the PVC method for the wind turbine systems in thestudied locations is presented in Table 8. It is observed that the AWT(2)2000 model has lower values for electricity cost compared to other models. In addition, it is observed that Gazimağusa has the lowest values for electricity cost compared to other regions. Furthermore, the wind system of Gazimağusa is a more economical option for generating electricity because it has higher capacity factor values as well as lower UCE values.

3.5. Solar Energy

3.5.1. Solar Resource Potential in Three Studied Cities

In general, solar potentials will vary from location to location based on weather conditions. For this study, the solar resource potentials for the selected locations are taken from the radiation databases available from the PVGIS and National Renewable Energy Laboratory (NREL). For the PV plant modeling in the PVGIS simulation tool, the solar radiation considered is sourced from the PVGIS-SARAH database. Figure 9, Figure 10 and Figure 11 show a comparison of the solar irradiation potential using three different simulation tools for the selected regions. Considering the PVGIS Simulation, the maximum solar irradiation is recorded in July and the minimum value of solar irradiation is obtained in January, as shown in Figure 9. Furthermore, the maximum monthly solar radiation using PV*SOL is obtained in June (224 kWh/m2). The maximum and minimum global irradiation using PVWatts are found in June (201.36 kWh/m2) and in the December (26.25 kWh/m2), respectively (Figure 9).
Based on Figure 10, the solar irradiation at Girne varies from 26.24 to 233 kWh/m2. In addition, the maximum and minimum solar irradiation using PVGIS are recorded in July and January, respectively. It is also found that the minimum value of solar irradiation is achieved in December, while the maximum is recorded in June using the PV*SOL and PVWatts simulation tools.
Considering the PVGIS simulation tool, the lowest and highest solar irradiation values for Gazimağusa are achieved in July and January with values of 123 kWh/m2 and 232 kWh/m2, respectively, as shown in Figure 11. Additionally, considering the PV*SOL and PVWatts simulation tools, the solar irradiation values are within the range of 72–224 kWh/m2 using PV*SOL and 26.28–201.33 kWh/m2 using PVWatts.

3.5.2. Variation of Solar Energy Generation

Variations in annual energy generation are observed from the simulated studies conducted using three different software, namely PVGIS, PV*SOL and PVWatts. The proposed PV rooftop system for the household as per the simulated studies was done using various simulation tools in urban regions in order to reduce the amount of electricity generated using diesel generators and to compare the cost of electricity generation based on solar energy with wind and fossil fuels.
A residential building with a small space available on the rooftop area (roughly 70 m2) is used in this study. This paper proposes a 6.4 kW solar PV rooftop system for the three urban regions in Northern Cyprus.
The monthly variations in energy production and energy consumption using the simulation tools are shown in Figure 12, Figure 13 and Figure 14. Based on the PVGIS simulation results, it is found that the maximum and minimum energy production values are obtained in July and January, respectively for all selected regions. The annual energy production is found to be 10708 kWh for Lefkoşa, 10631 kWh for Girne and 10,936 kWh for Gazimağusa. The specific energy production values for Lefkoşa, Girne, and Gazimağusa are found to be 1673.125 kWh/kWp, 1661.094 kWh/kWp and 1708.75 kWh/kWp, respectively.
Considering the PV*SOL and PVWatts Simulation, the maximum energy production at the selected regions is achieved in June followed by July. The minimum potential is observed in the month of December. The annual energy production using PV*SOL is found to be 8040 kWh for Lefkoşa, 6003 kWh for Girne and 5986 kWh for Gazimağusa. In addition, the specific energy production values for Lefkoşa, Girne and Gazimağusa are found to be 1256.25 kWh/kWp, 937.96 kWh/kWp and 935.31 kWh/kWp, respectively. Moreover, considering the PVWatts results, the annual energy production values are found to be 3861.812 kWh for Lefkoşa, 3795 kWh for Girne and 3864.375 kWh for Gazimağusa. Additionally, the specific energy production values for Lefkoşa, Girne, and Gazimağusa are found to be 603.41 kWh/kWp, 592.97 kWh/kWp and 603.81 kWh/kWp, respectively.

3.5.3. Performance Comparison

Based on PV*SOL, the annual energy consumption of the household is calculated as 3500 kWh. Based on the simulation result, PV supplies 1378 kWh (39.37%) and the remaining 2122 kWh (60.63%) is covered from the grid, as shown in Table 9. Moreover, Tab1e 9 shows a performance comparison of the 6.4 kWp rooftop PV system at Lefkoşa using three simulation software (PVGIS, PV*SOL, and PVWatts). The PVGIS software gives the highest annual energy output compared to PV*SOL and PVWatts. In terms of maximum energy output, PVGIS shows that it is in the month of July while PV*SOL and PVWatts show maximum energy output in June. The capacity factor and performance ratio obtained by PVGIS are significantly higher than PV*SOL and PVWatts.

4. Discussion

With rapid growth in populations, energy consumption is expected to increase in the future. Moreover, the increased energy demand and environmental problems caused by burning fossil fuels have raised interest in alternative energy sources, particularly in urban environments. The aim of this study is to investigate the wind and solar potential at three urban regions in the Northern part of Cyprus.
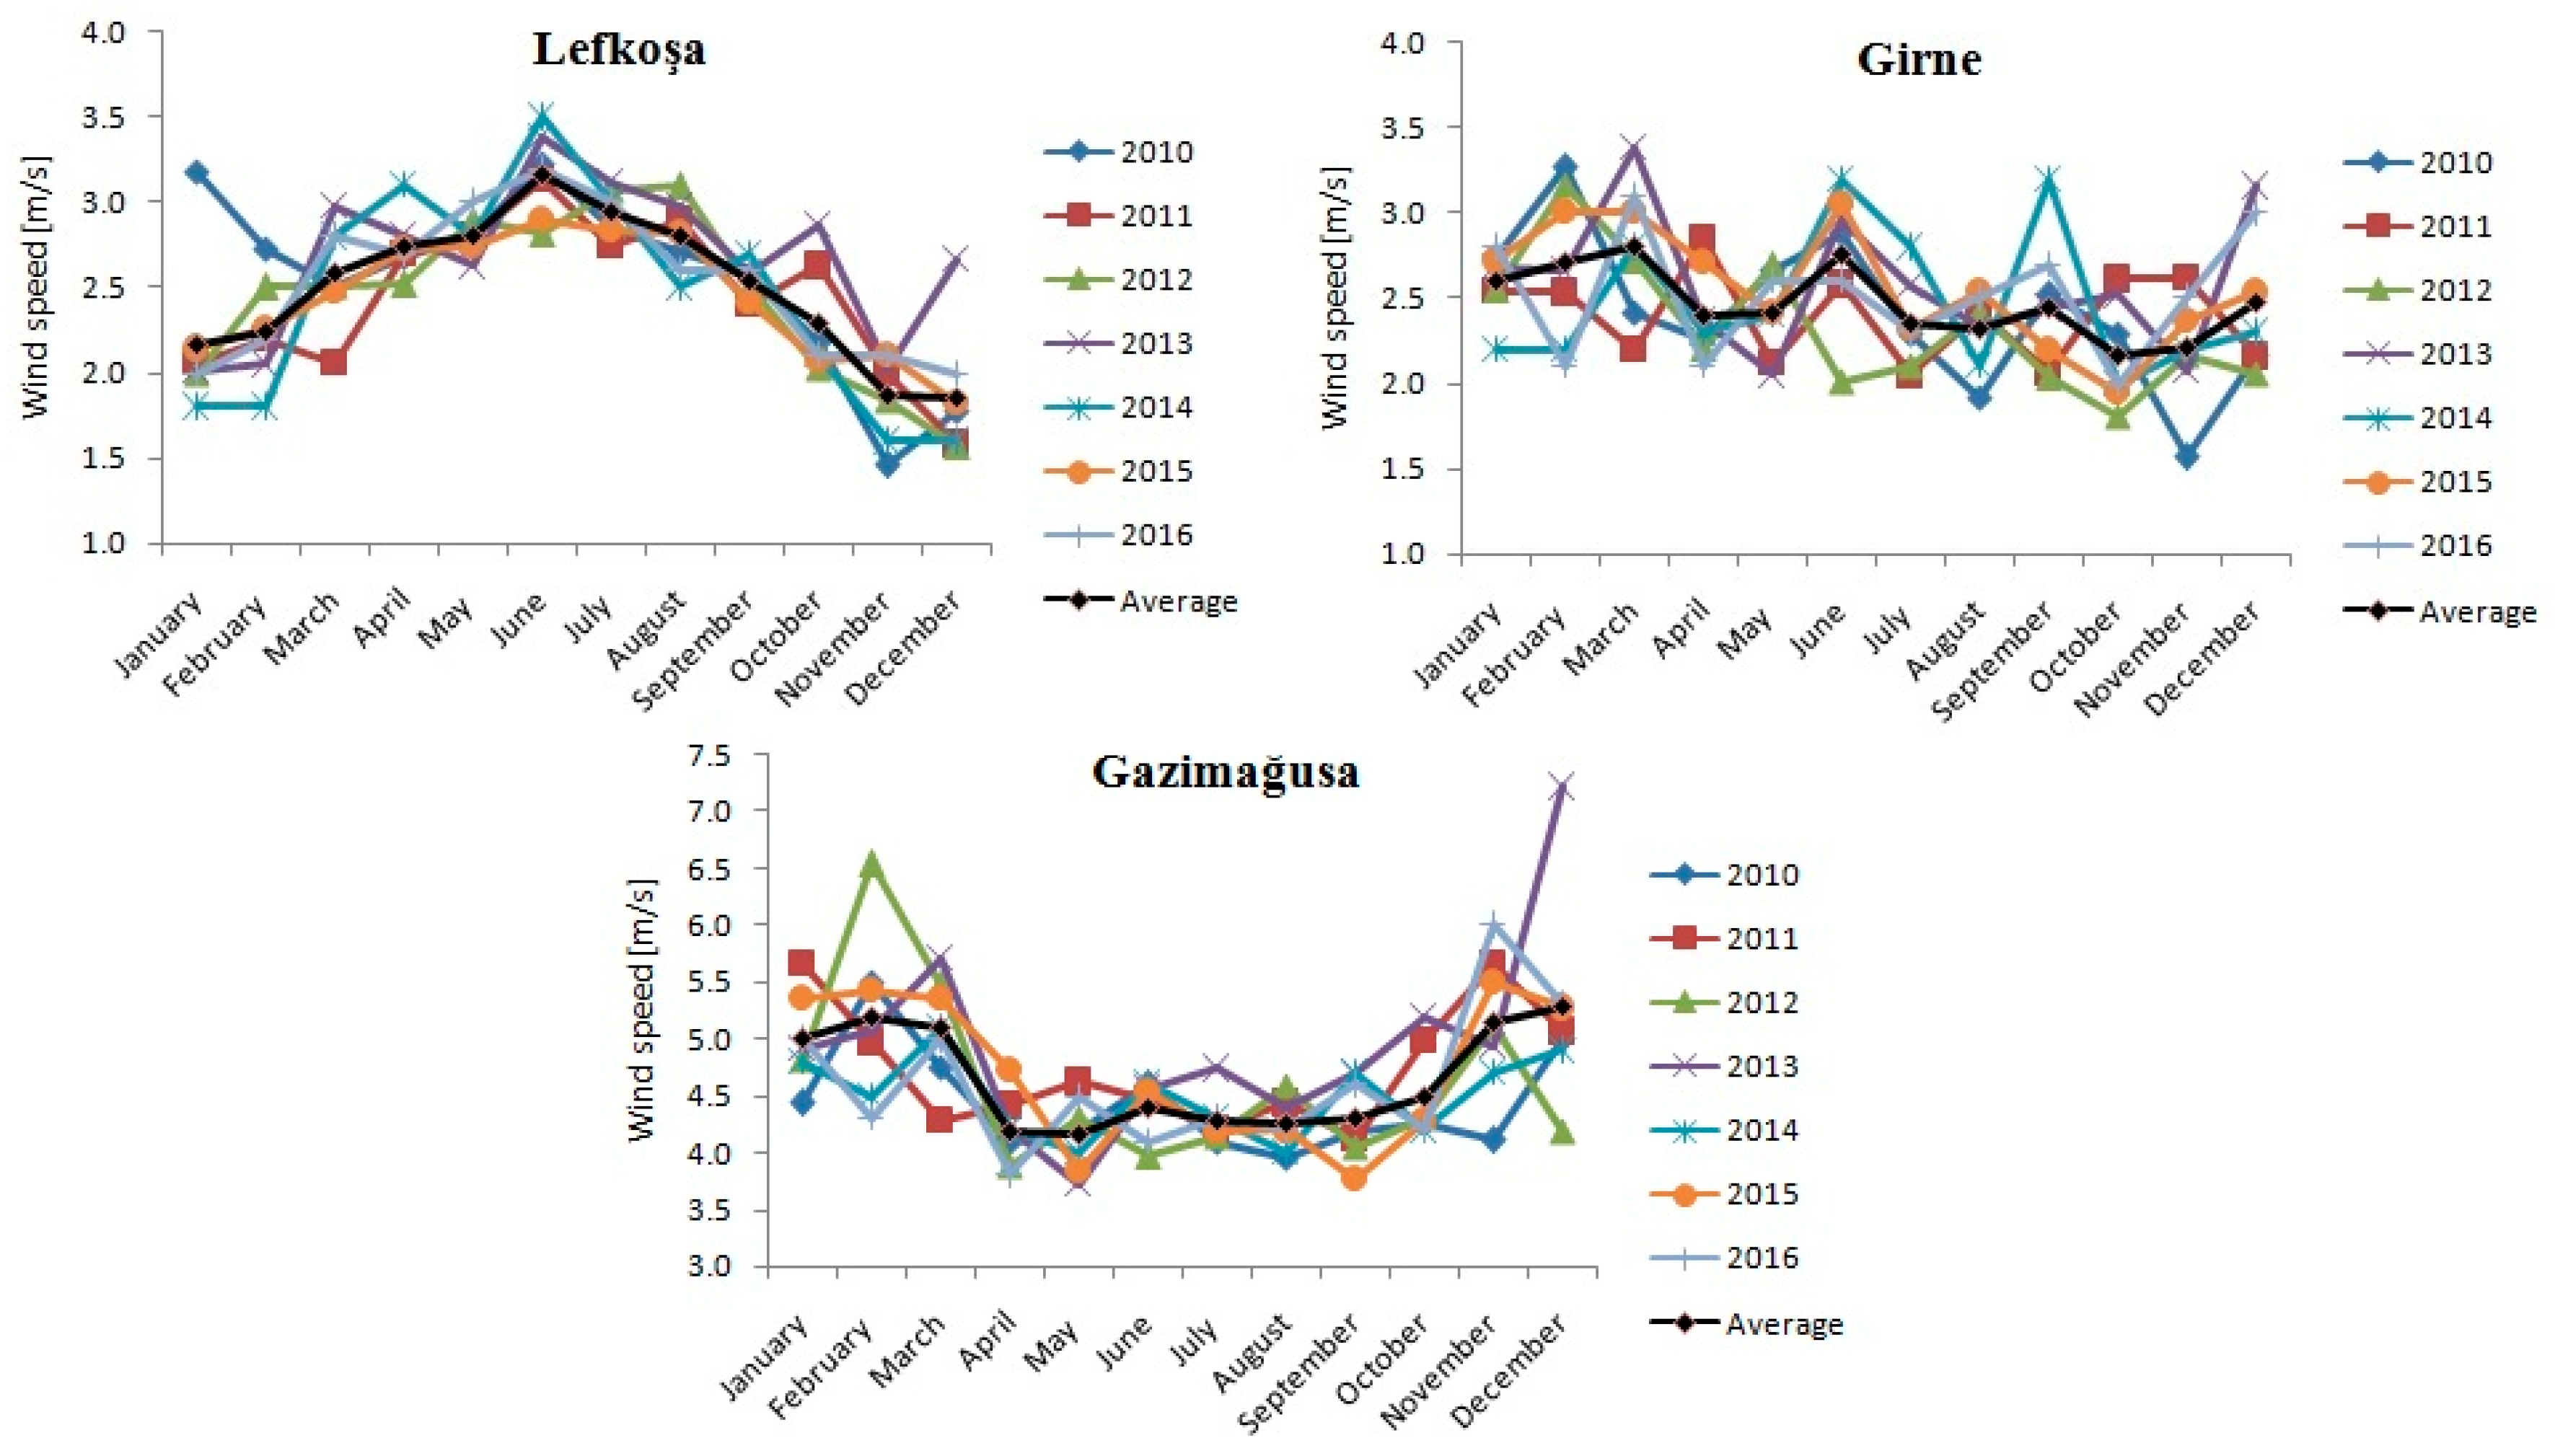
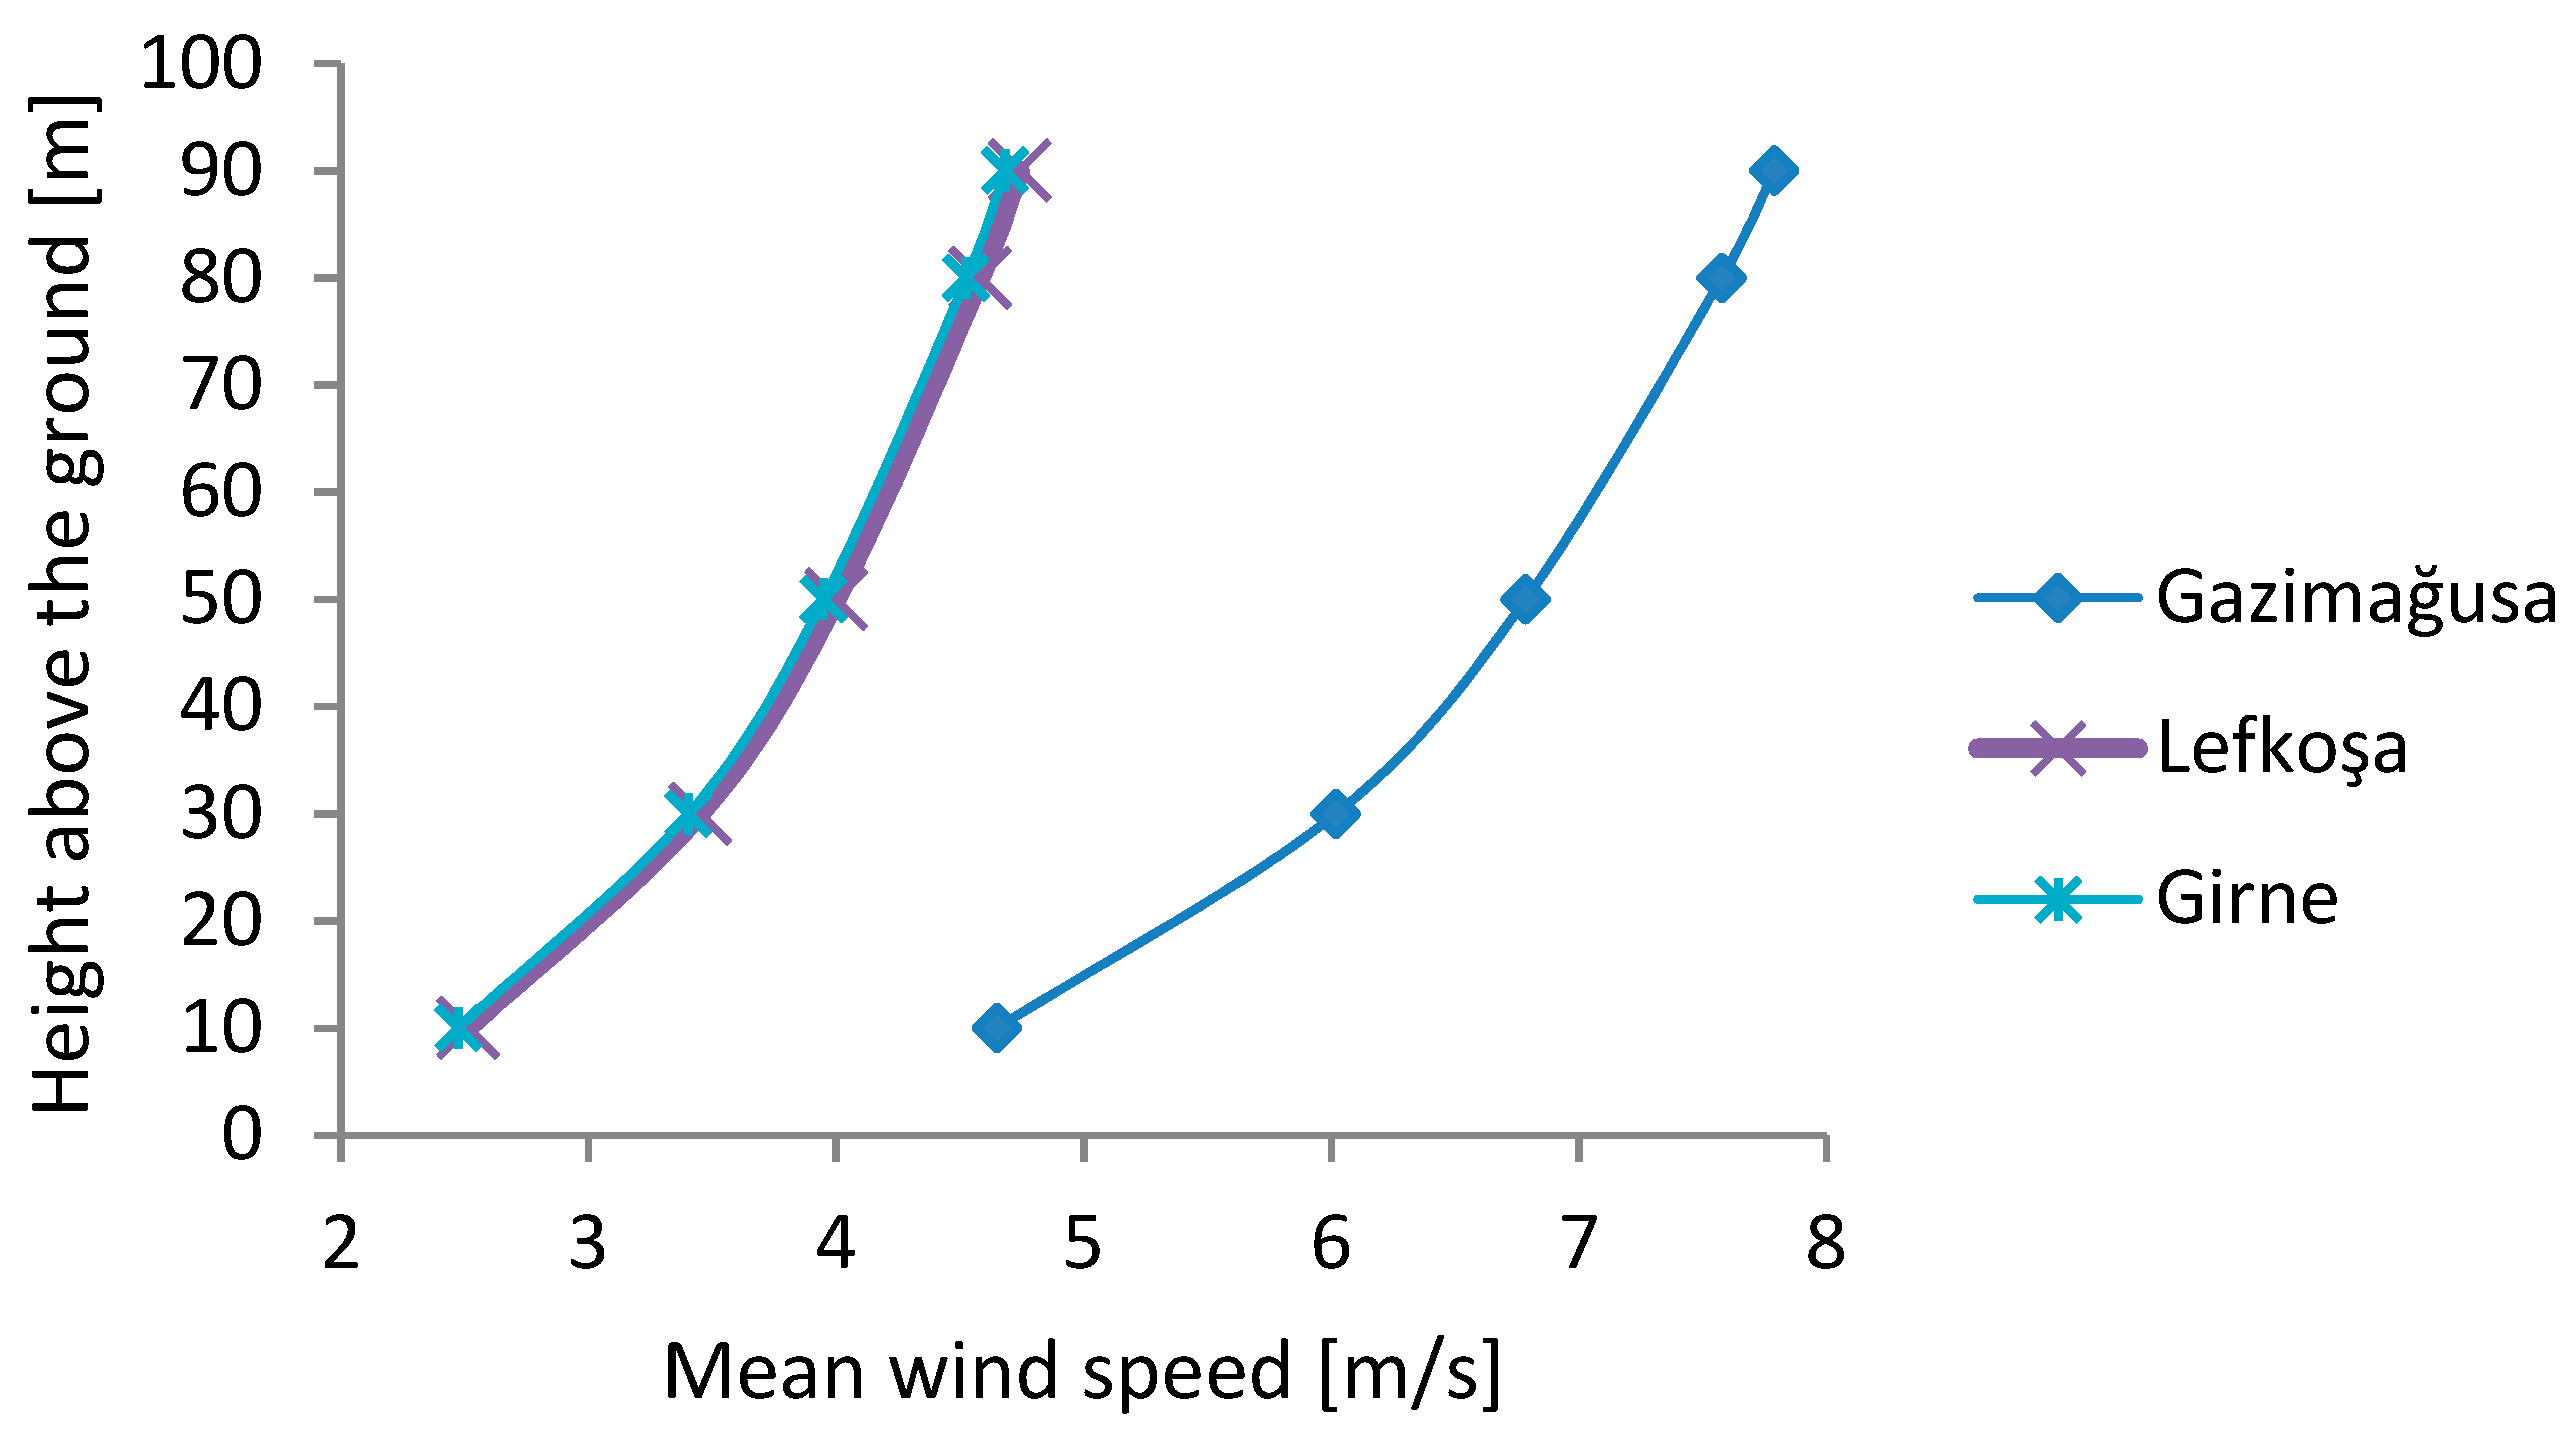
The results of the collected wind speed data and the analysis show that the annual actual wind speeds at the selected regions are 2.47 for Girne, 2.50 m/s for Lefkoşa and 4.65 m/s for Gazimağusa (Figure 3). Thus, according to the results obtained at a height of 10 m, Gazimağusa has higher wind speeds compared to the other regions (Lefkoşa and Girne), which is confirmed by [43]. Based on the wind power density classes, the evaluation of the wind resource available in the three selected locations as class 1 wind power sites indicates their suitability for small-scale wind turbines (Table 6). From the perspective of the costs of generating electricity, the AWT(2)2000 model has lower values of electricity cost compared to the other models. Additionally, the wind system for Gazimağusa is a more economical option for generating electricity because it has higher capacity factor values as well as lower energy cost per kWh values.
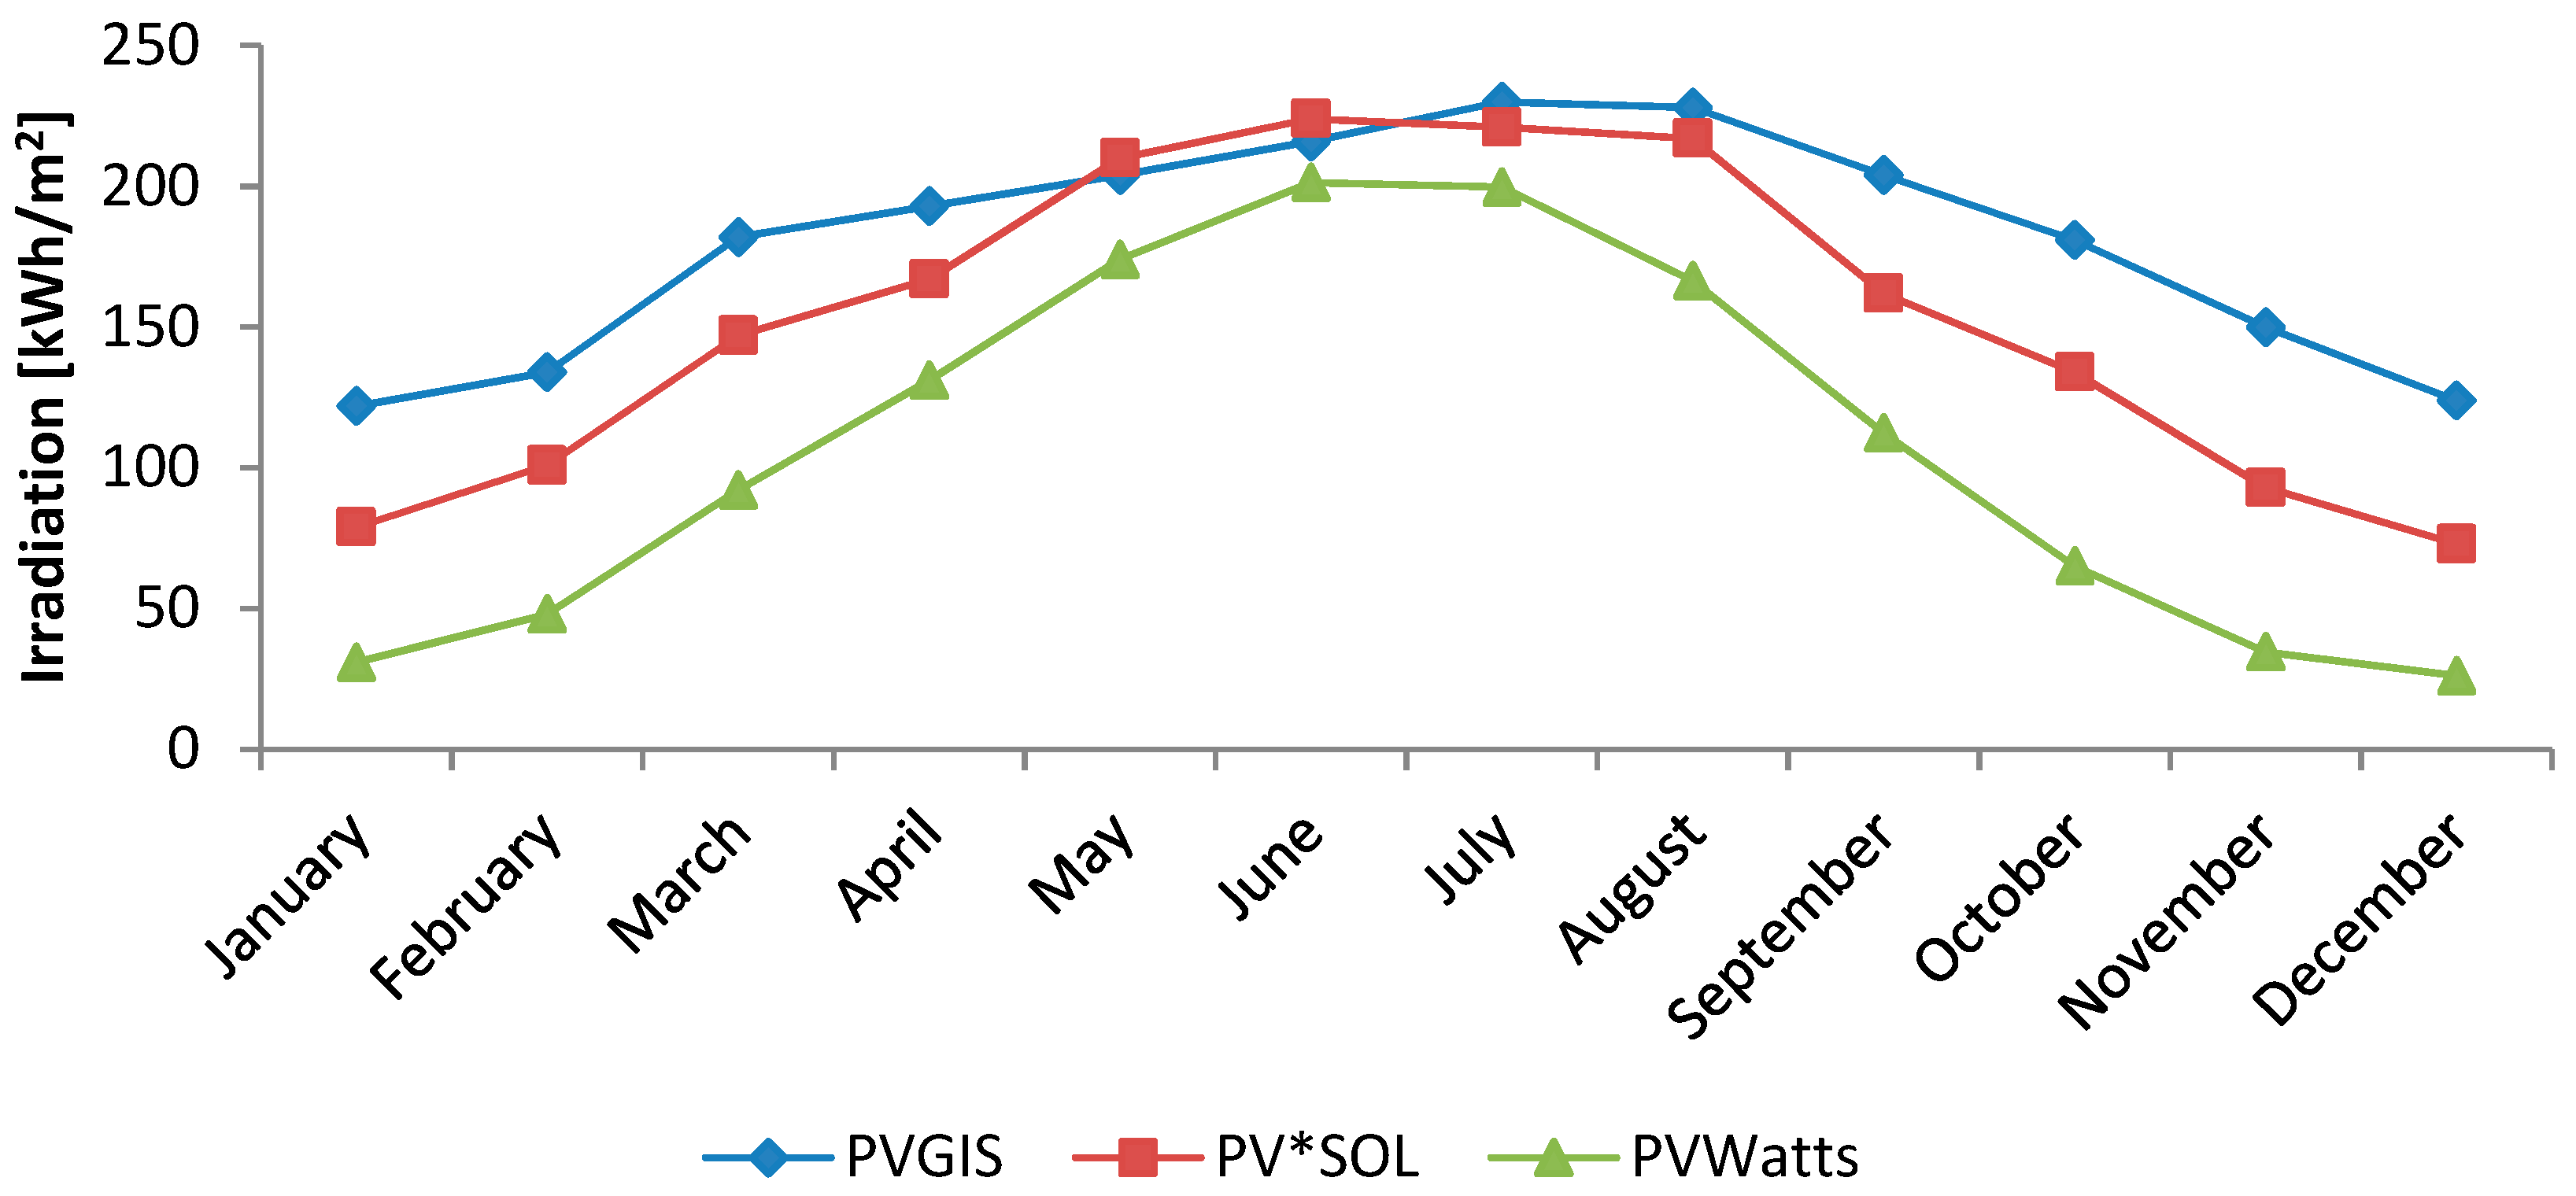
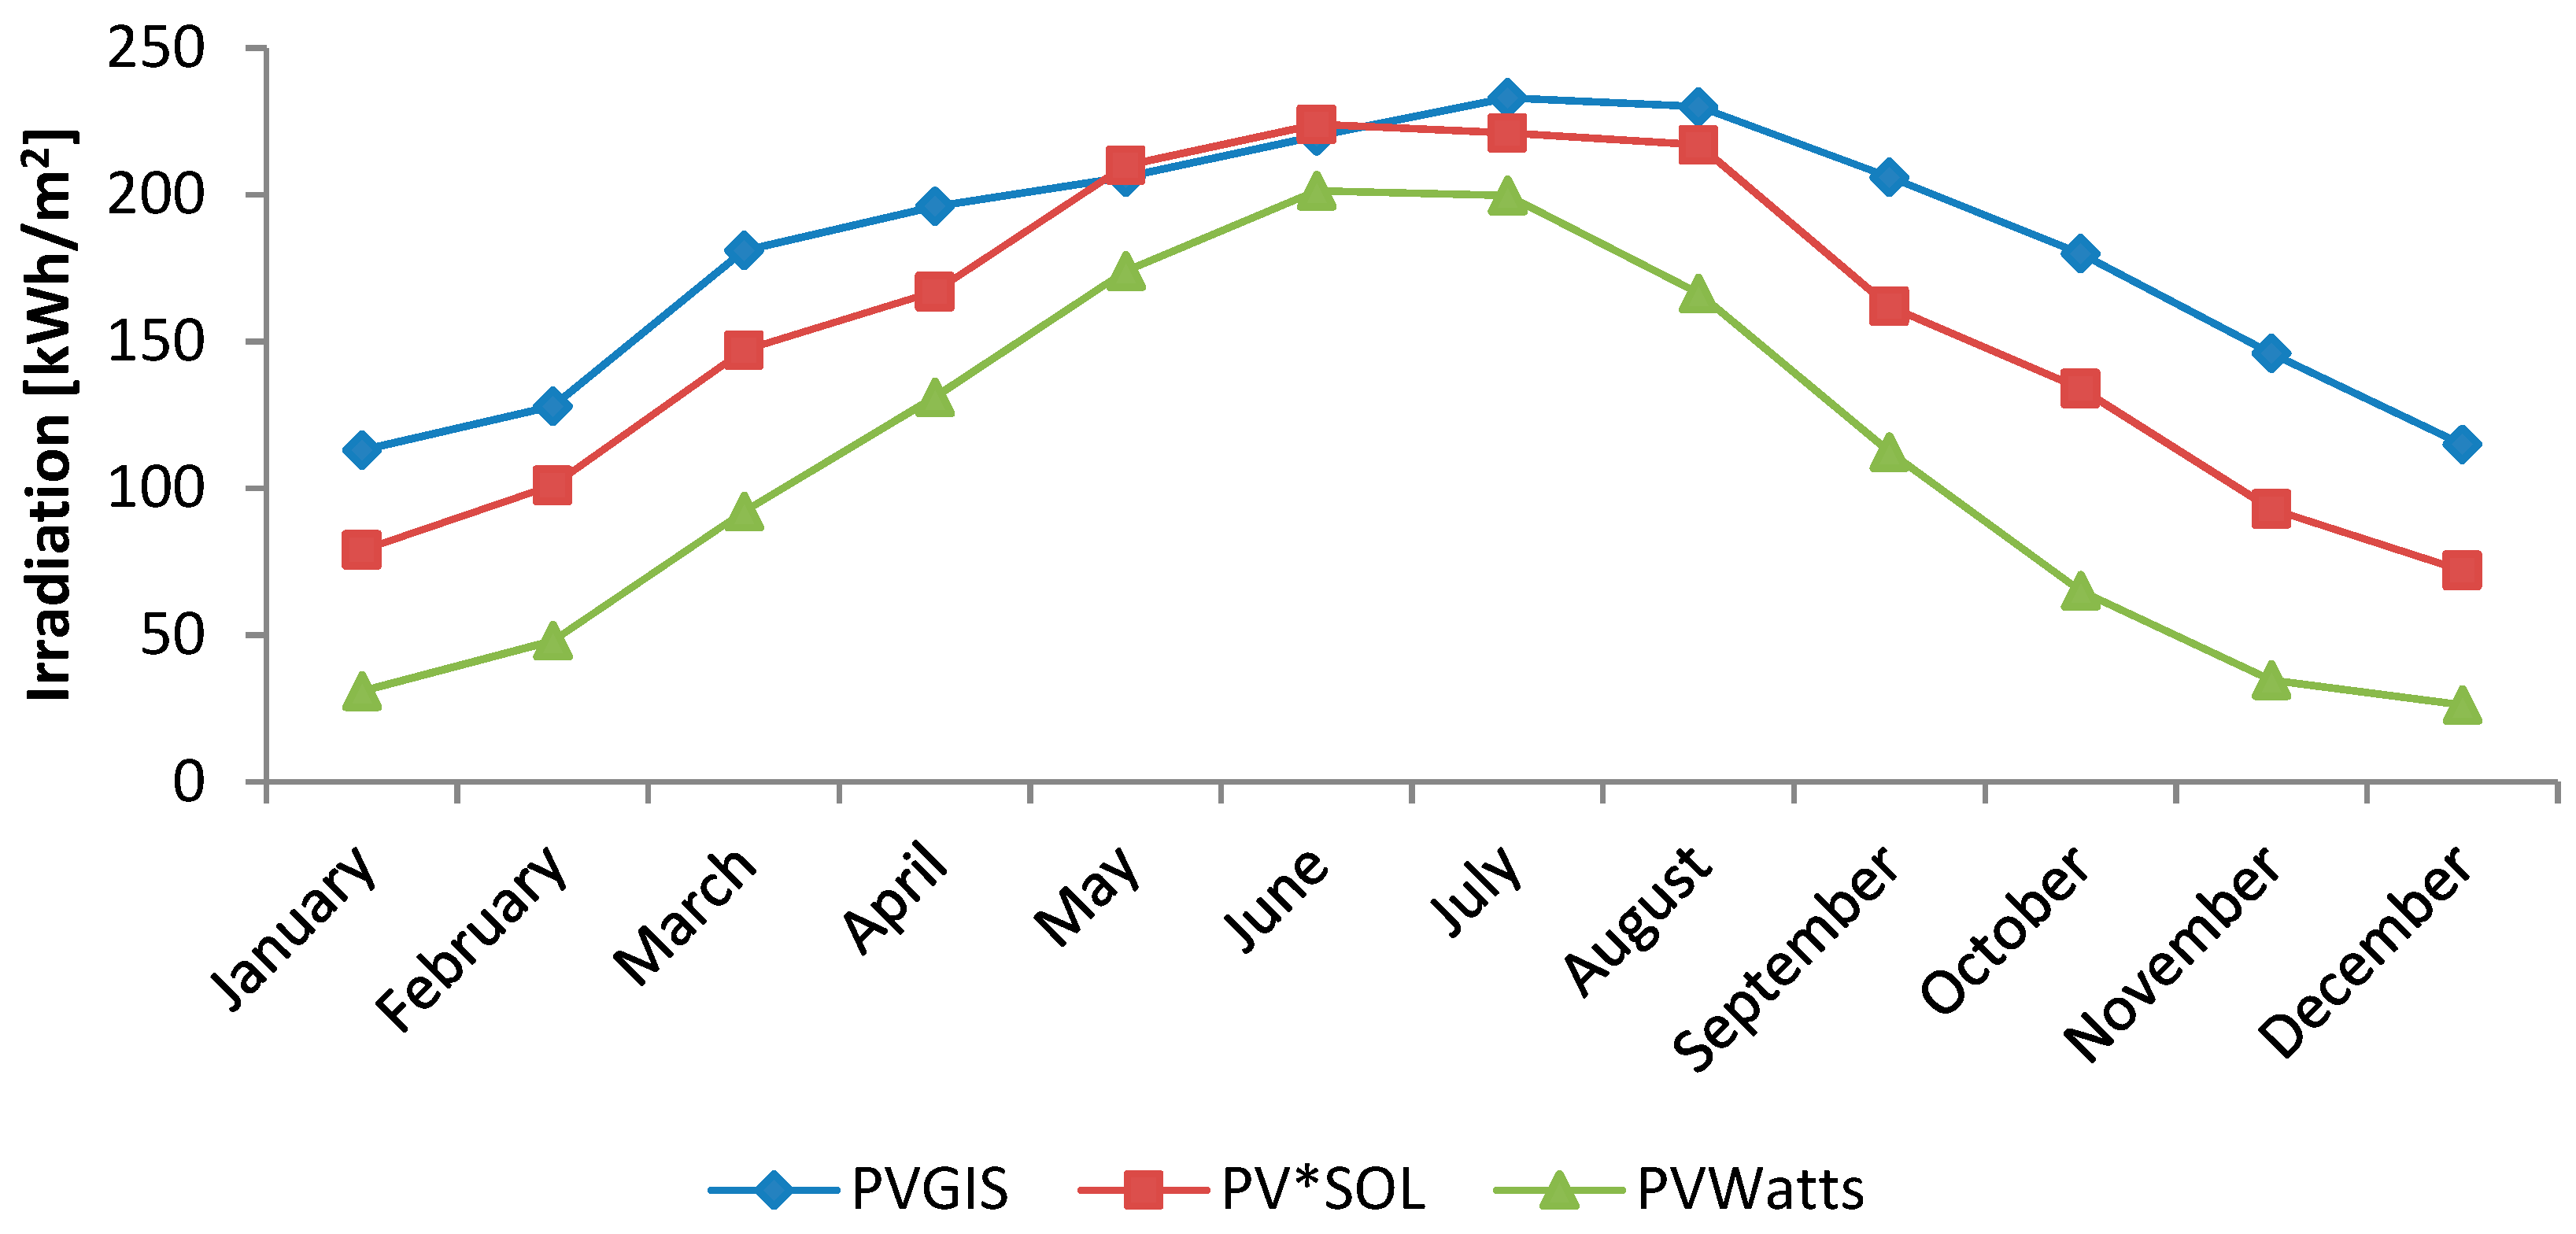
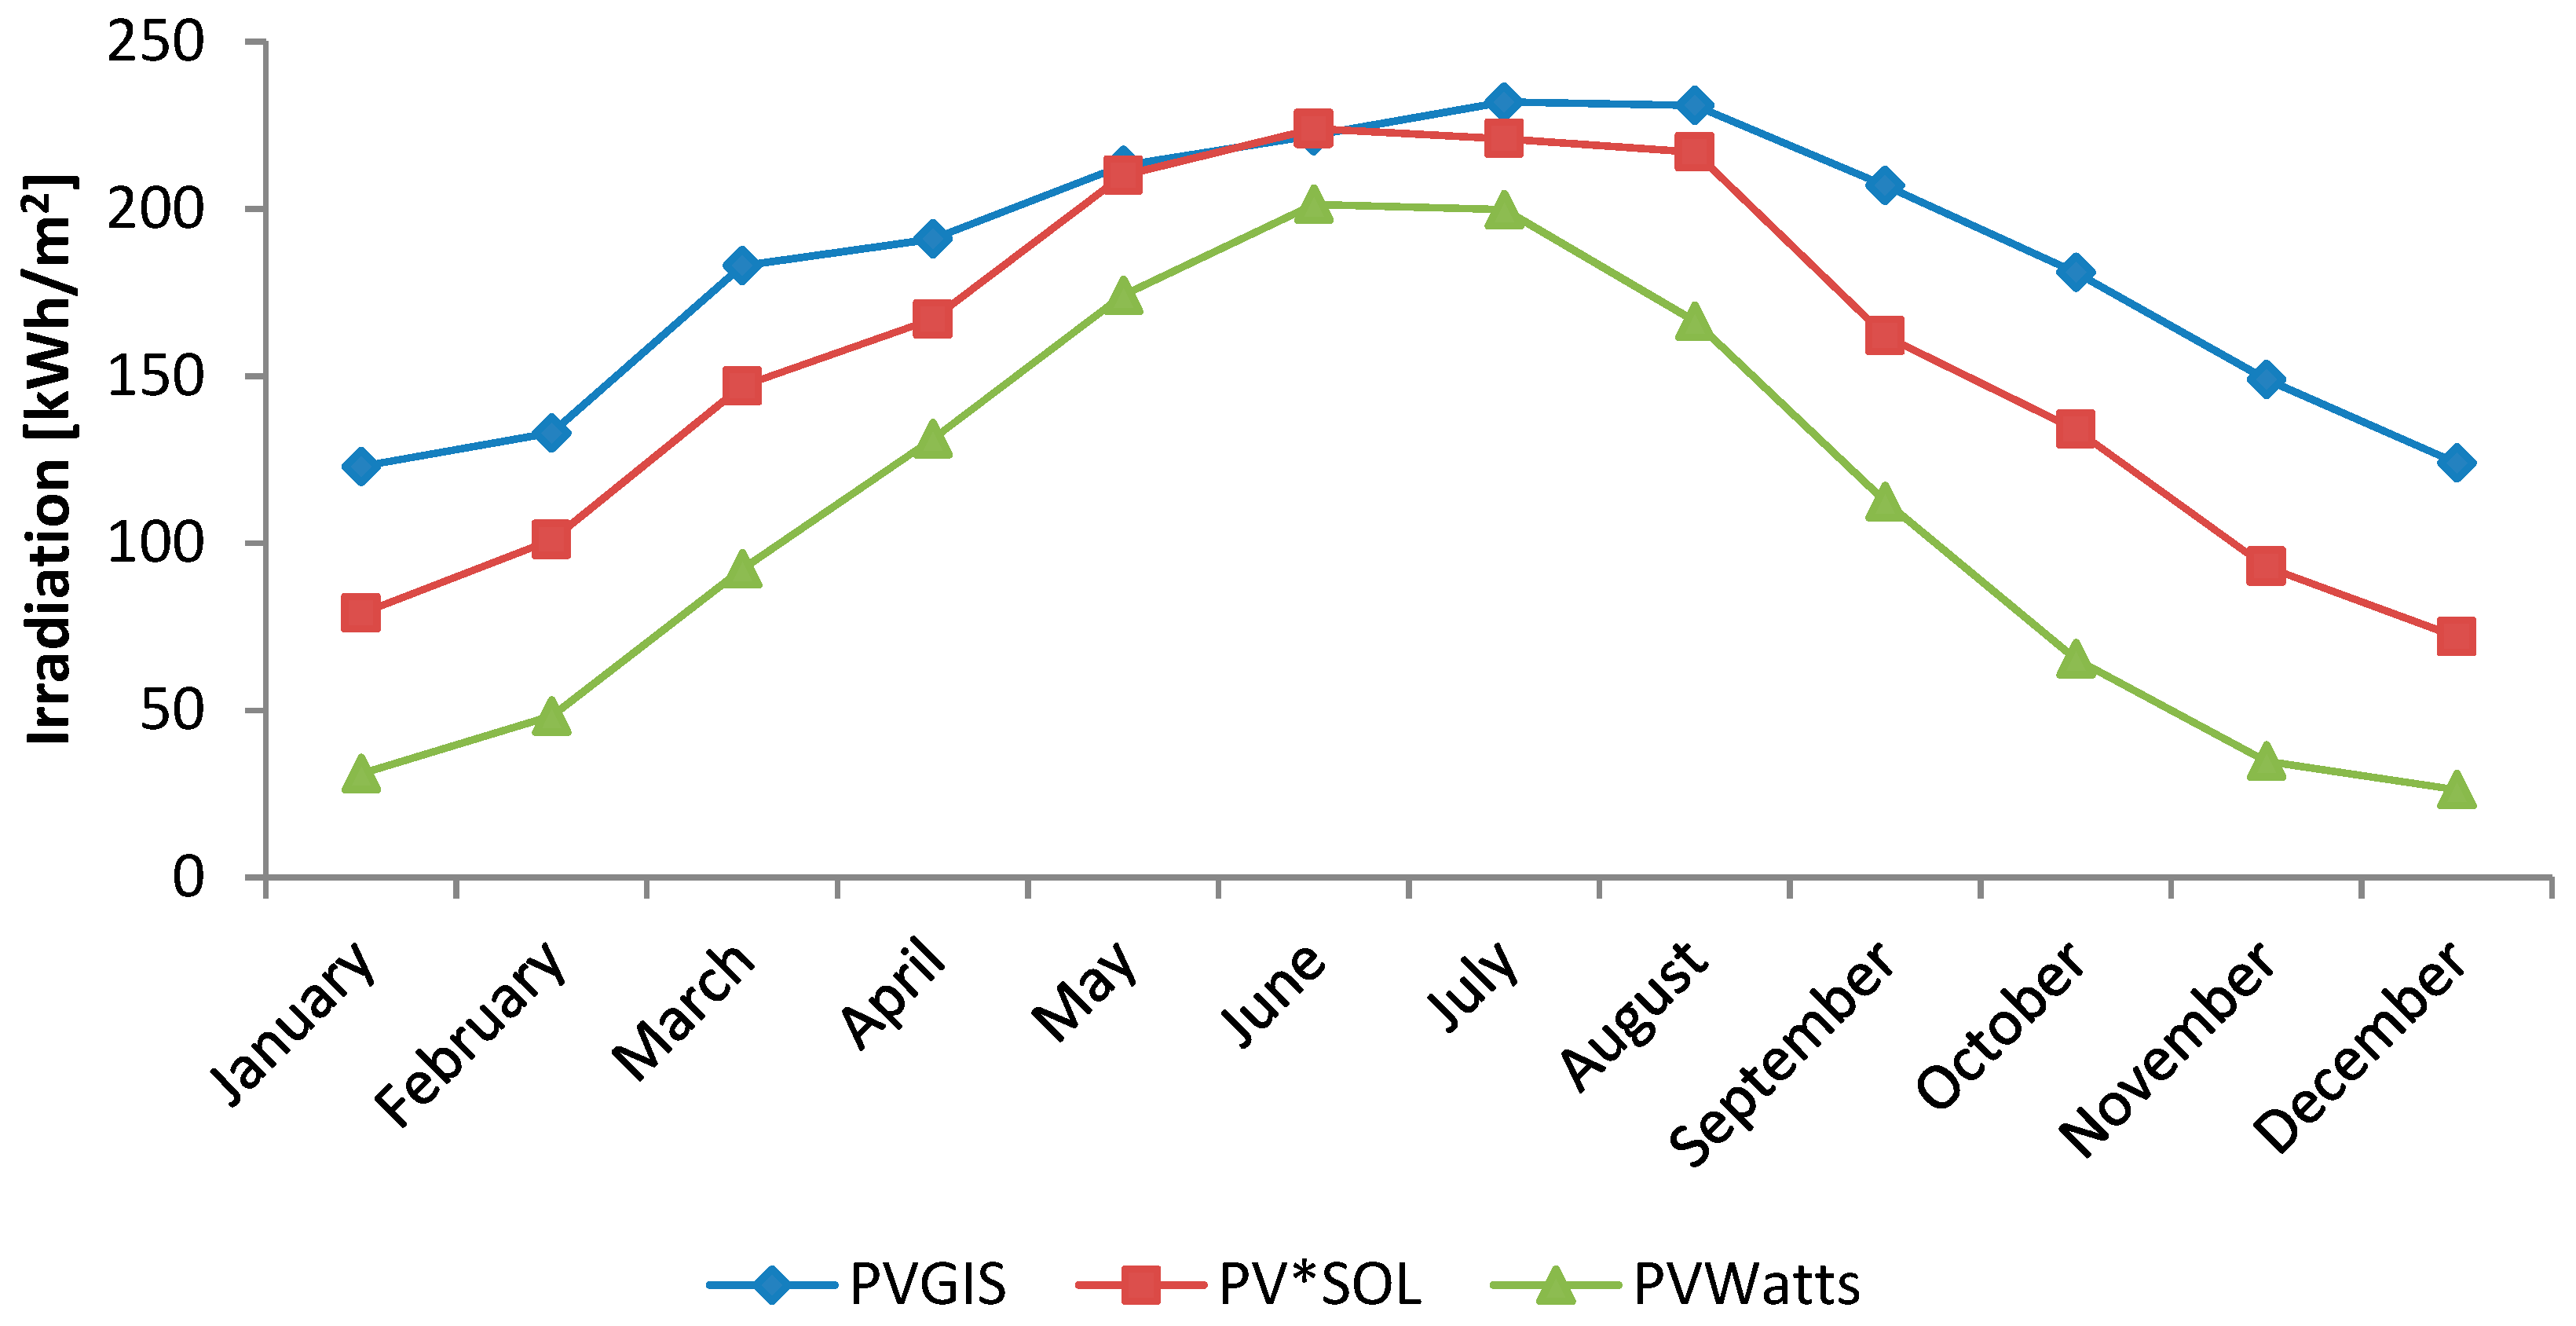
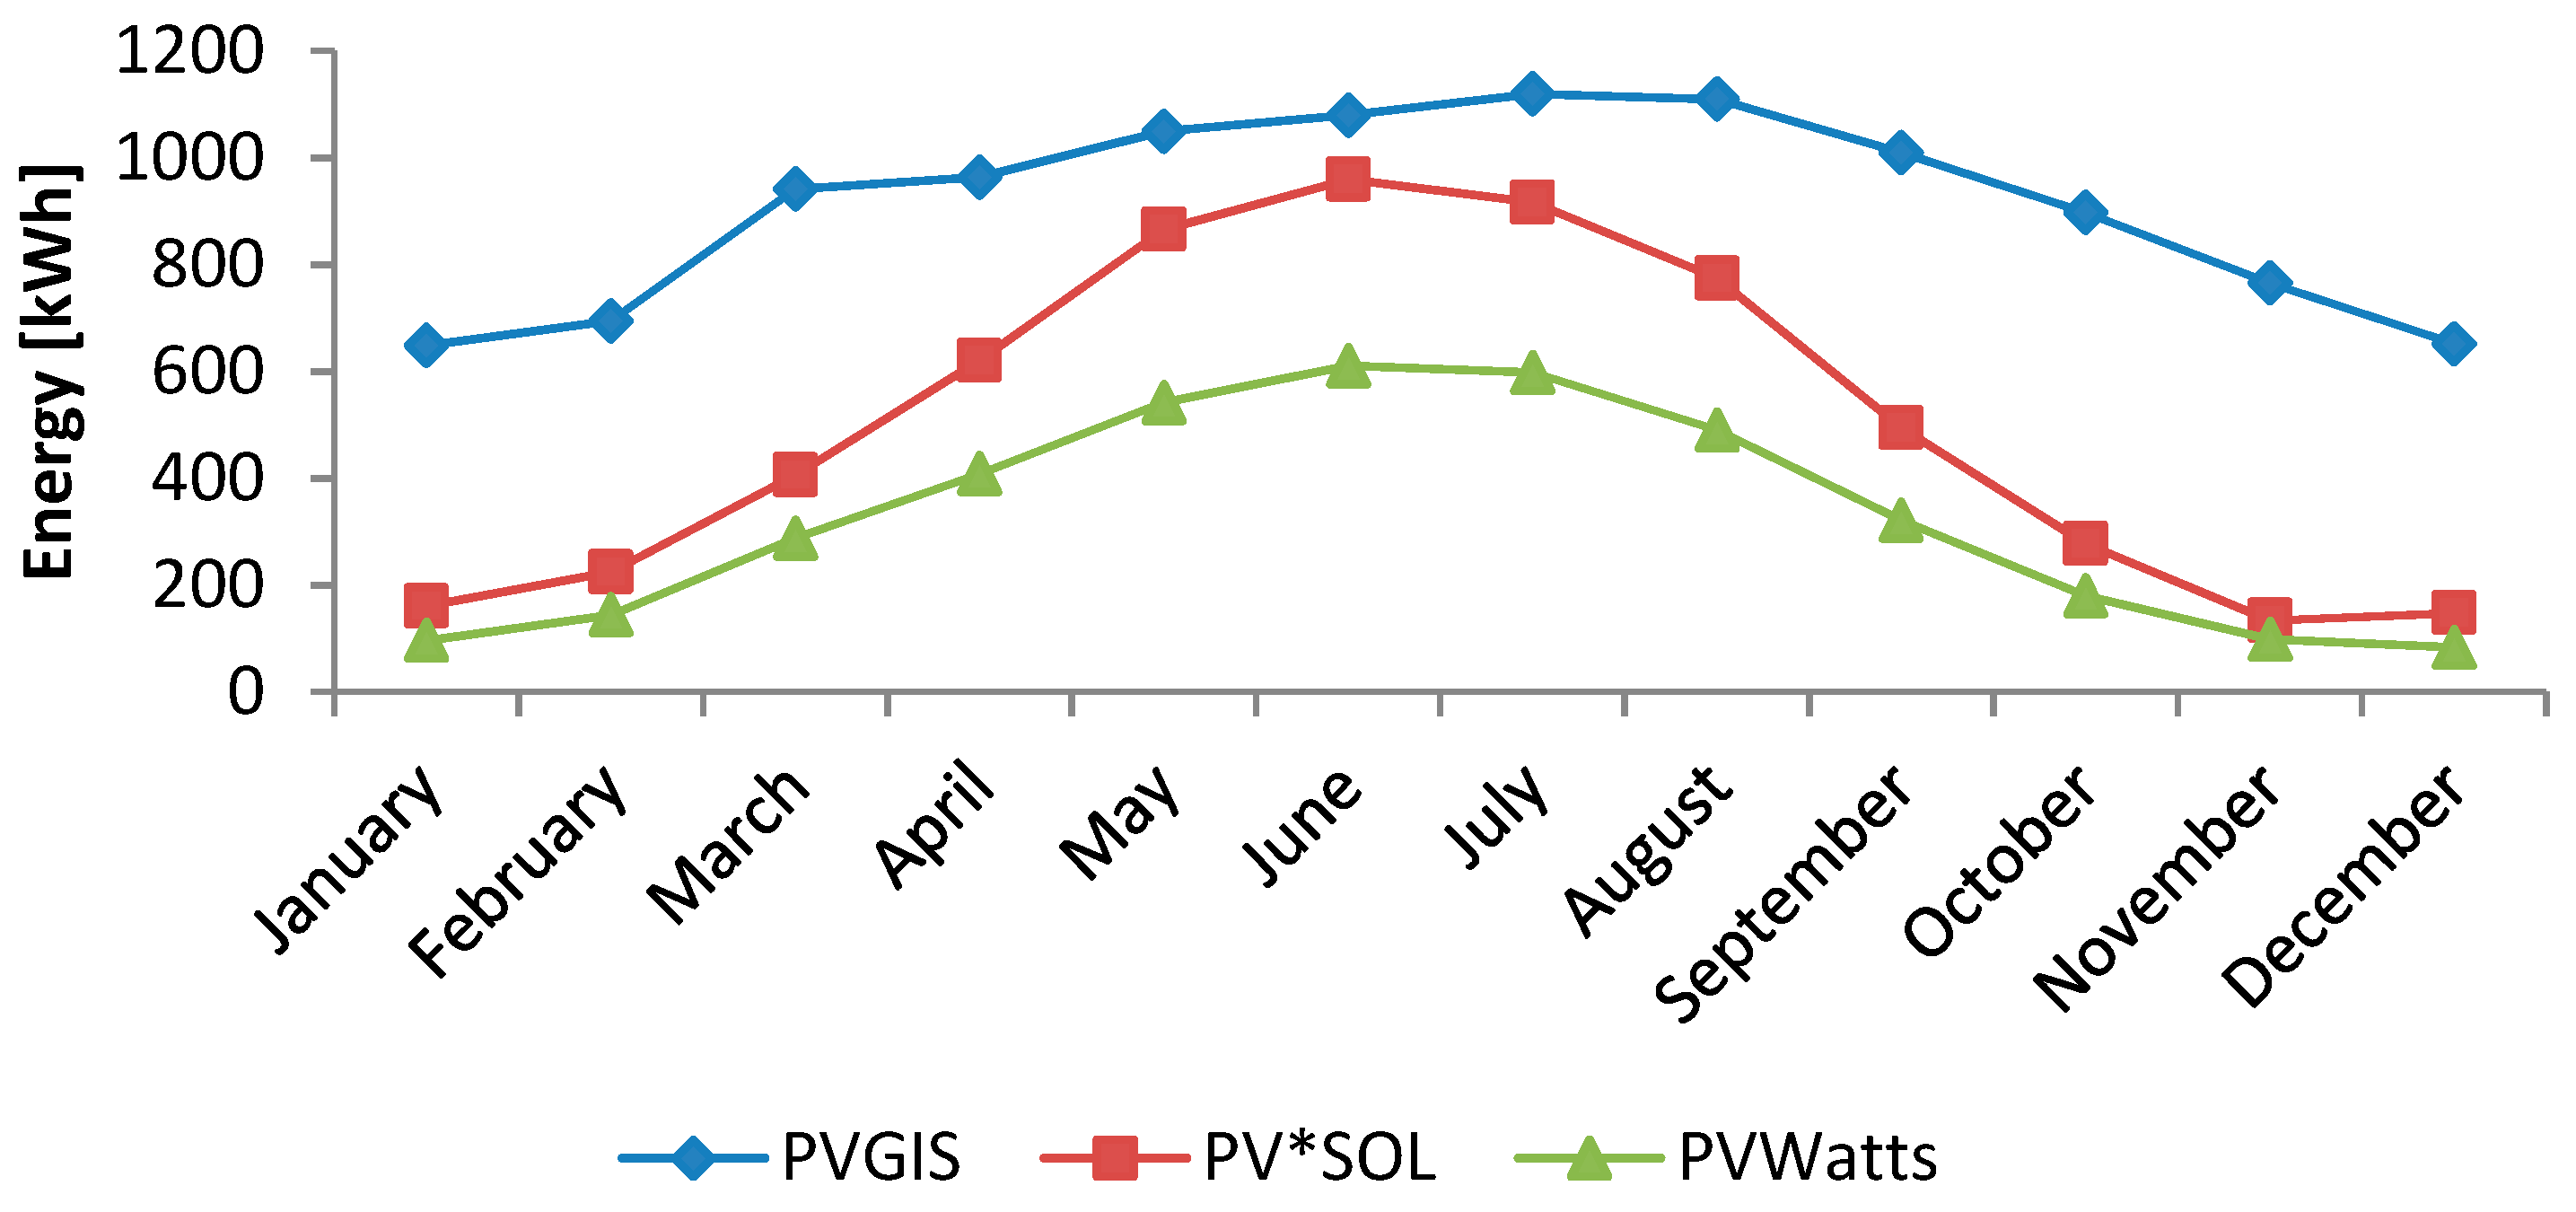
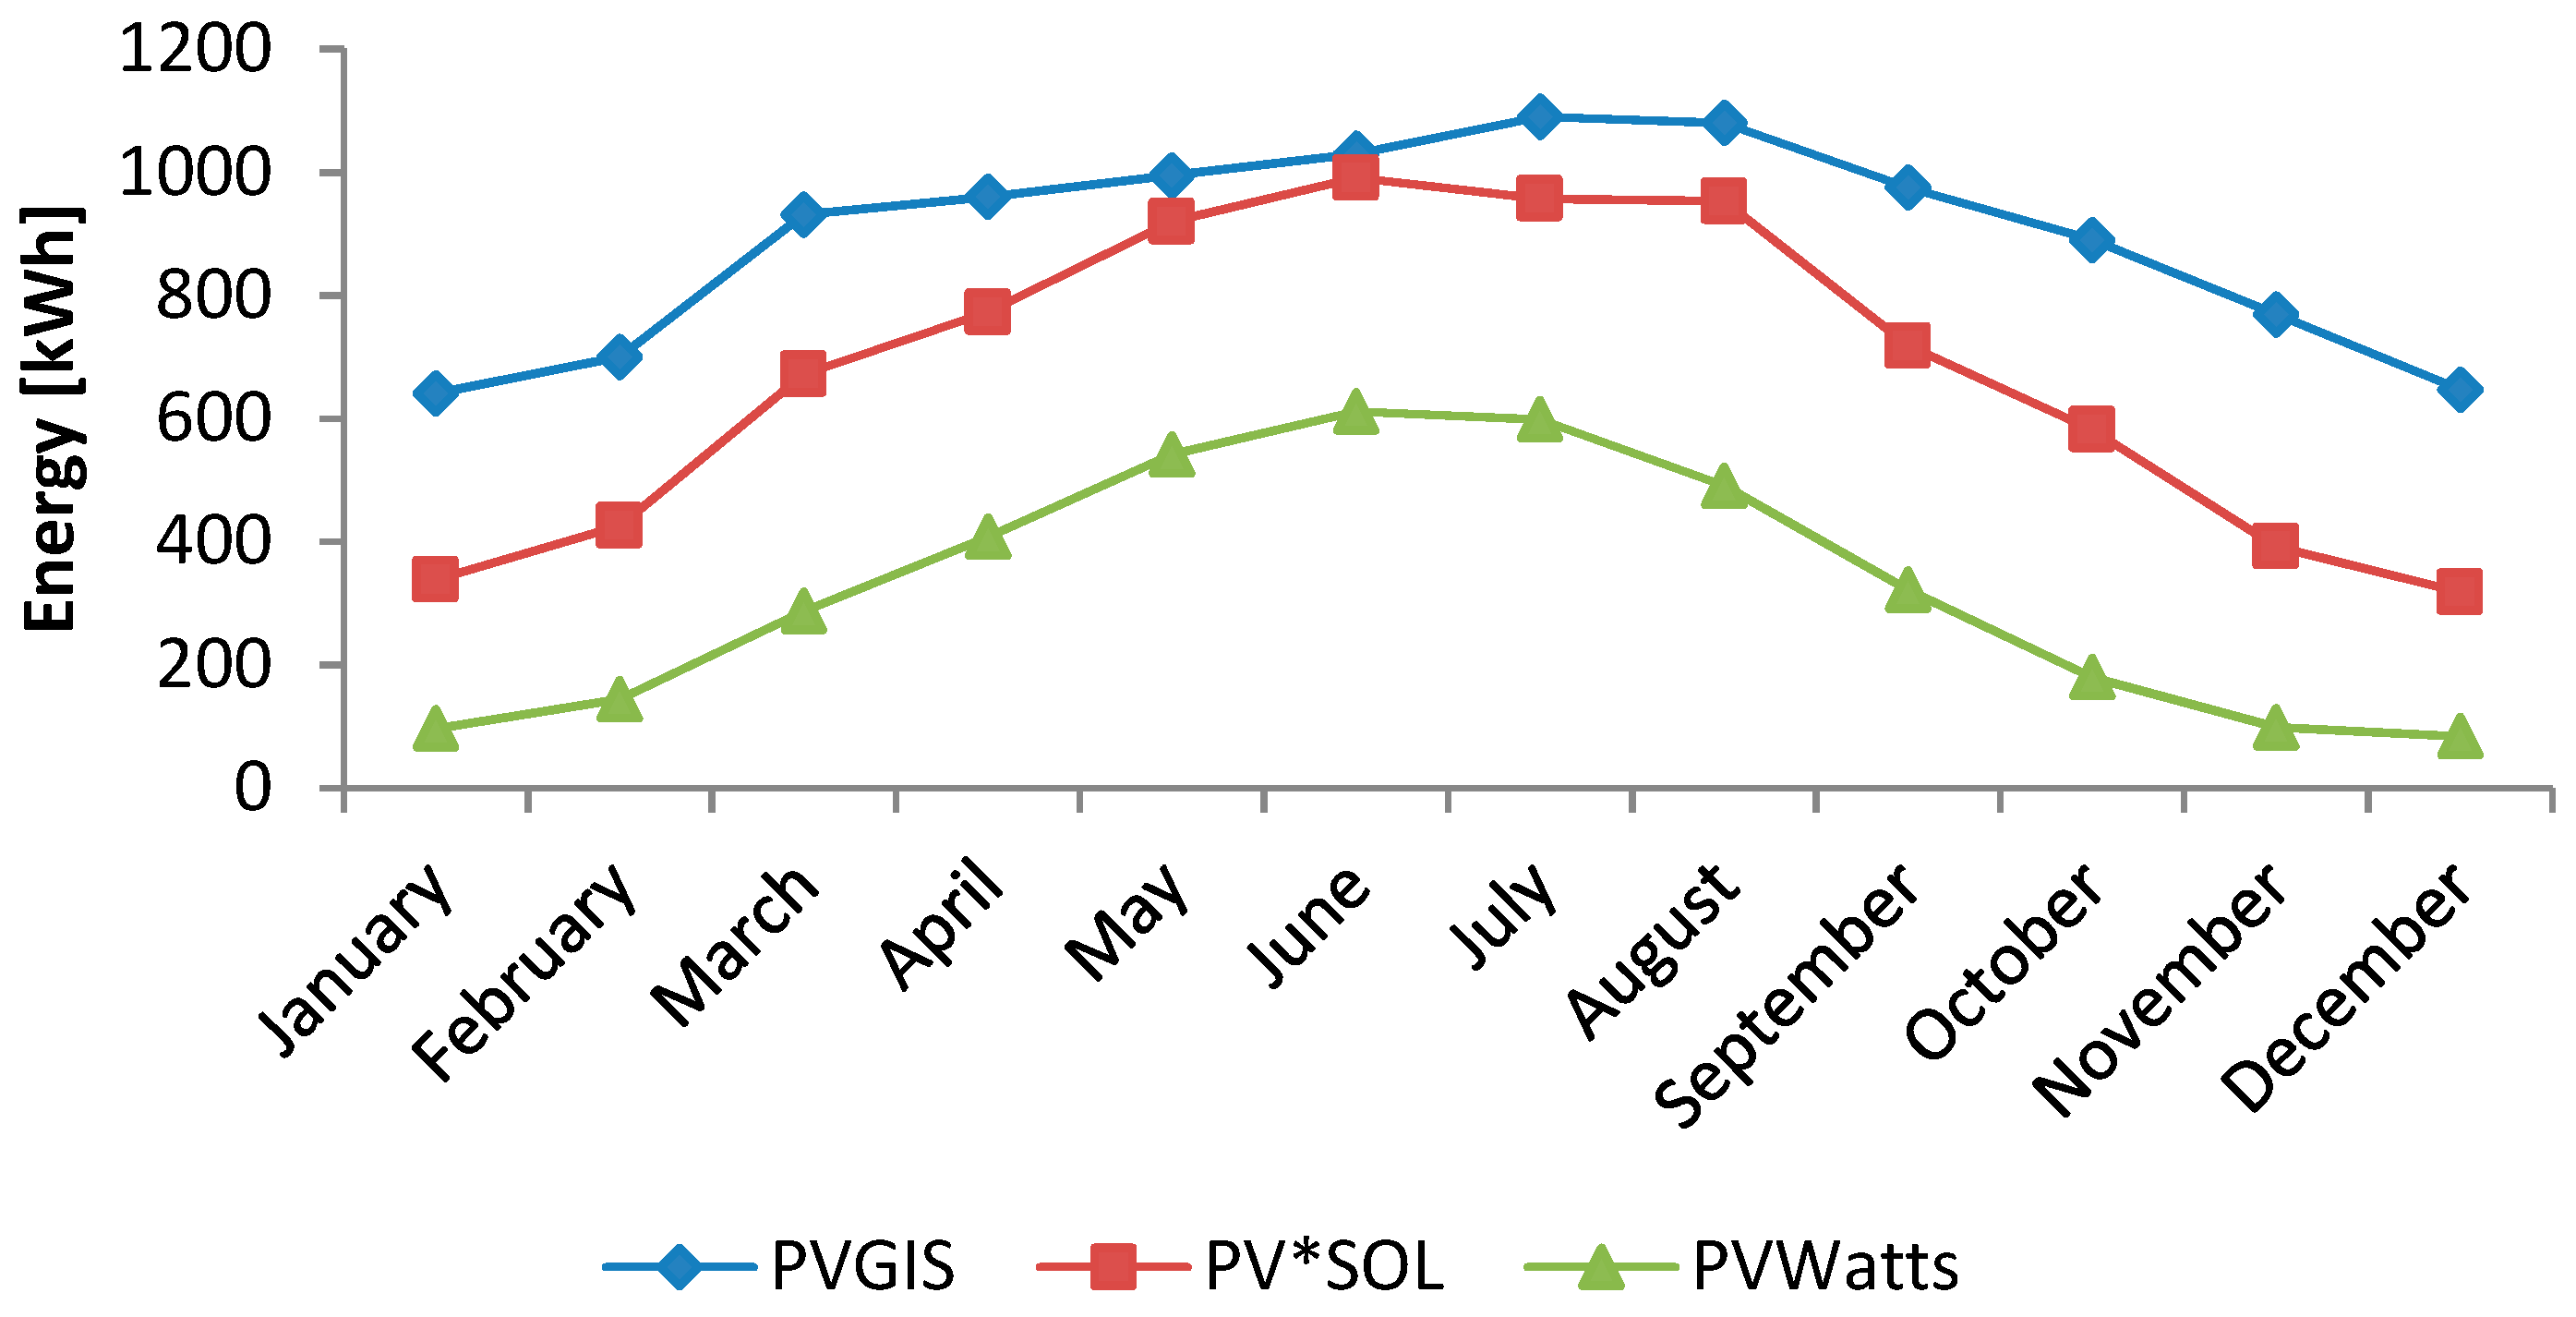
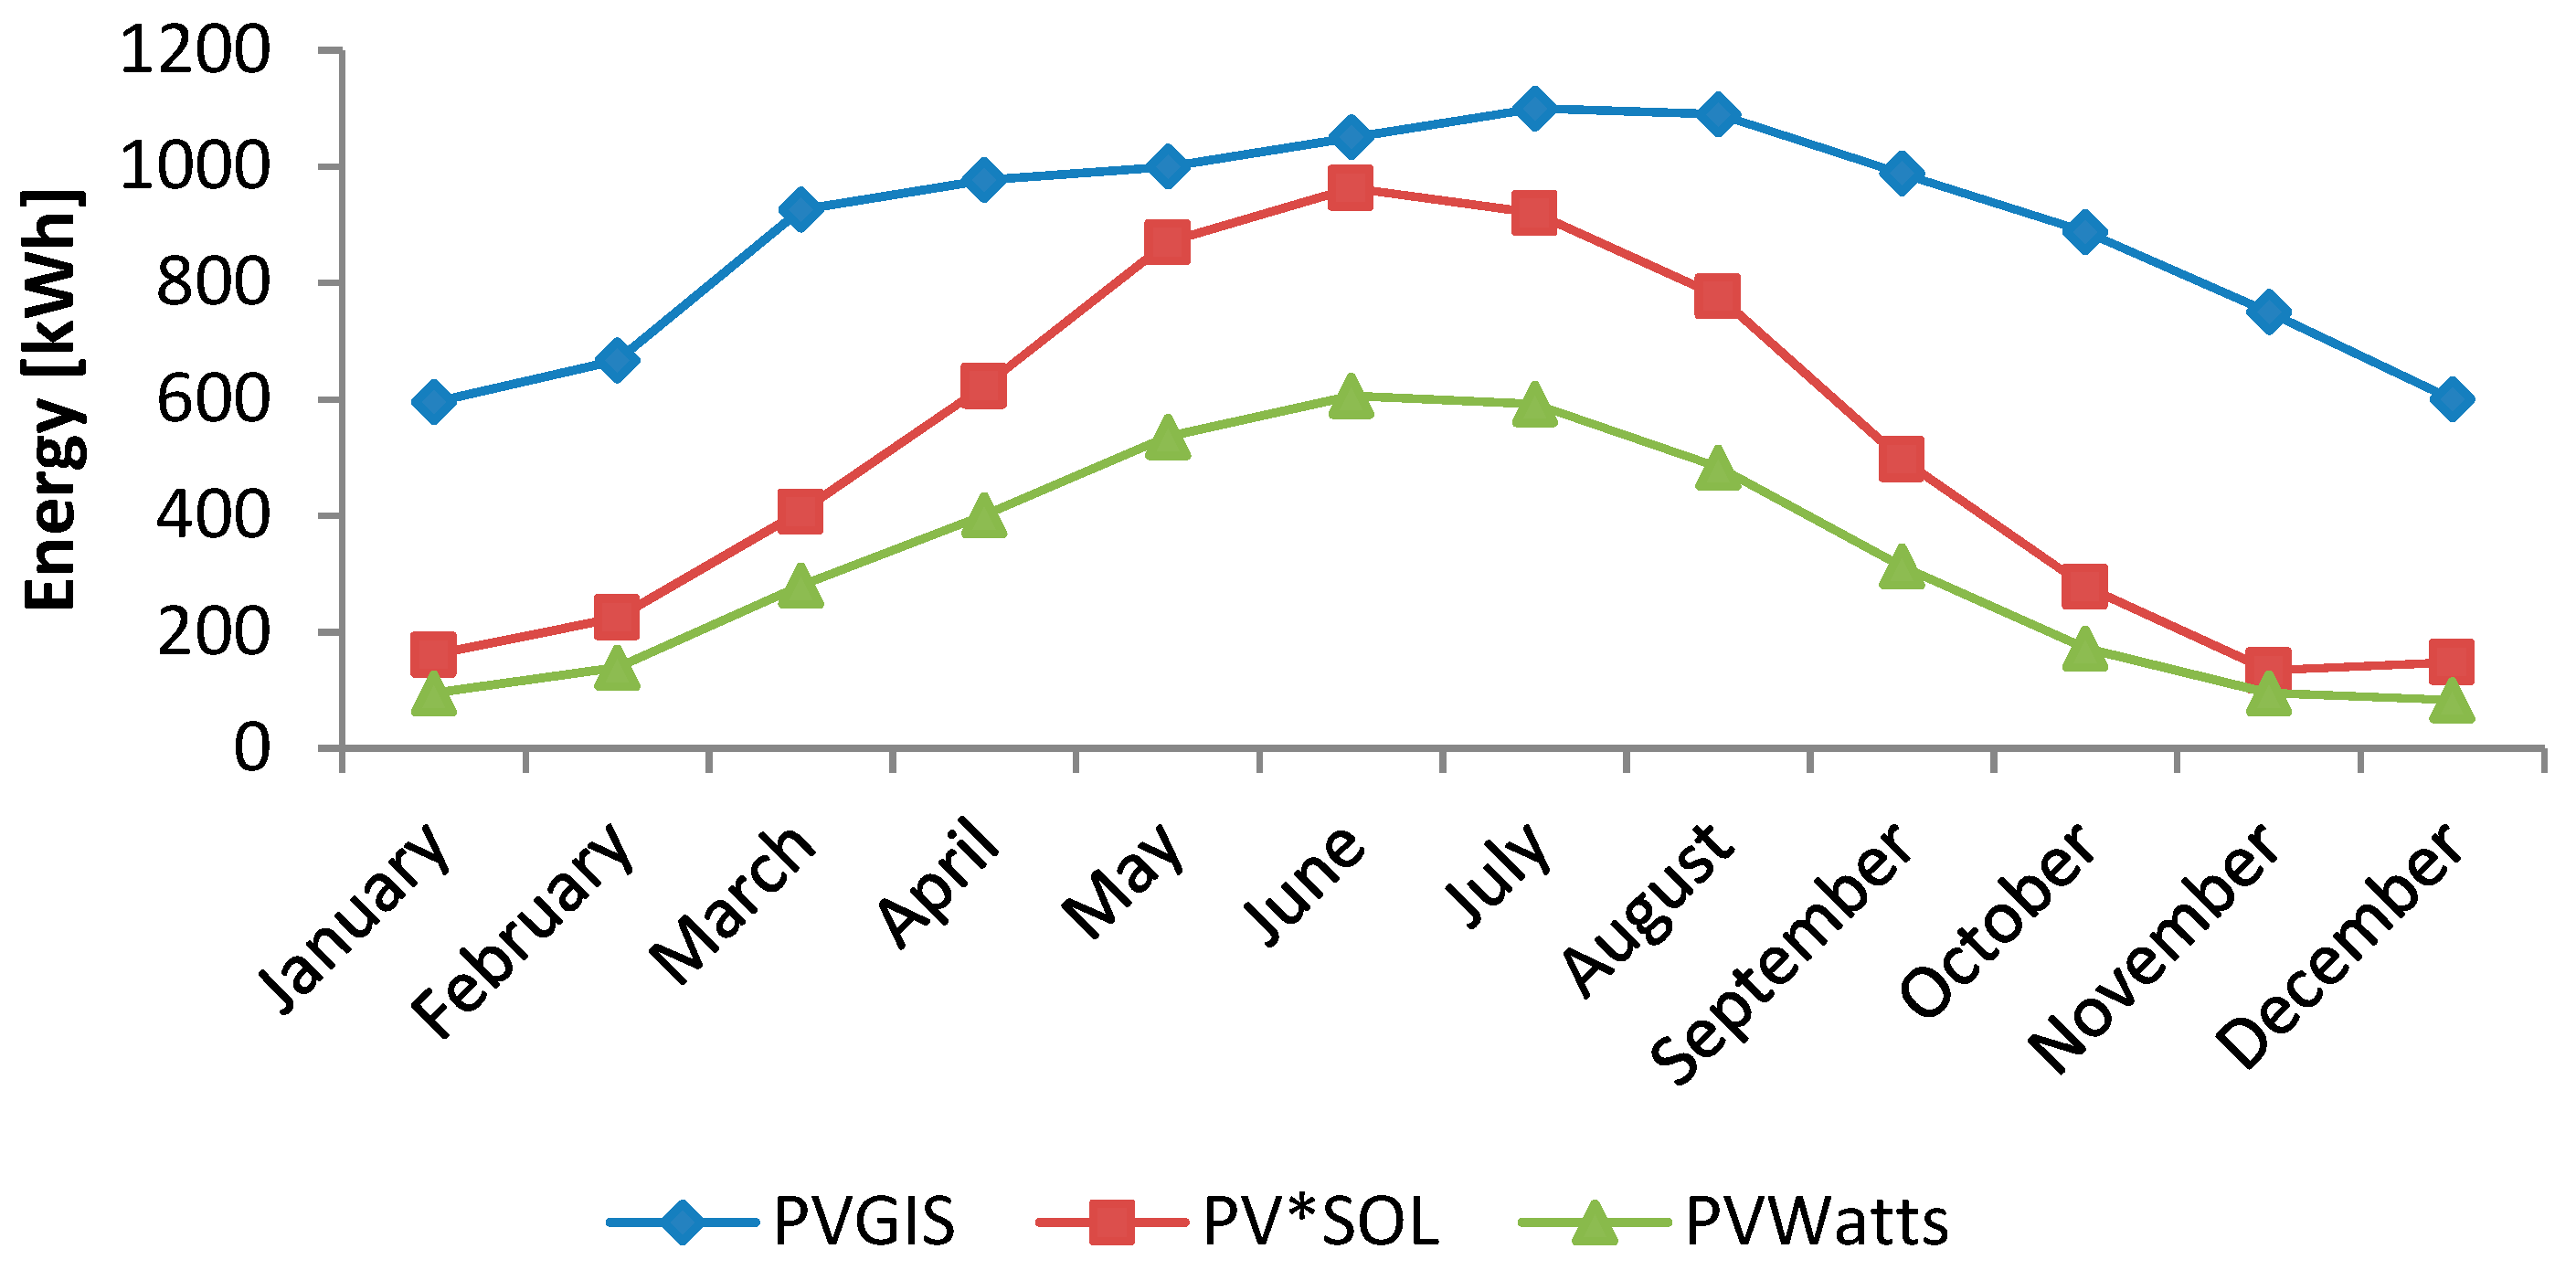
Furthermore, the solar rooftop PV system is an attractive alternate electricity source for households. In addition, the potential of a solar PV at a given site can be evaluated through software simulation tools [44]. The performance ratio of PVGIS is the highest compared to PV*SOL and PVWatts; our results are thus in good agreement with those found by [44]. Based on the analysis, the maximum and minimum annual energy yields are estimated to be 1708.75 kWh/kWp for Gazimağusa and 1661.09 kWh/kWp for Girne. It is shown that the grid-connected system installations are technically viable energy solutions for the selected area.
Out of three simulation software tools, PVGIS is found to be the most widely used and most effective tool because of its ability to carry out multiple analyses, which makes it easier and faster to evaluate different system configurations. In fact, according to Ref. [45], the performance ratio of the Serhatköy PV Power Plant, which is located in the Northern part of Cyprus, is about 73.7%. Based on the results in Table 9, only PVGIS has a performance ration value close to that of Serhatköy. Therefore, PVGIS can be considered as a reliable software tool for the simulation of a solar PV system.
Moreover, the authors performed an economic evaluation of developing gird-connected solar/wind power systems for the urban regions. It is found that the relevant authorities are not willing to invest in this type of technology due to high electricity prices and the poor recovery of initial investment. This type of technology is also not suitable for use in Lefkoşa and Girne due to the low capacity factor. In addition, it is observed that PV systems are the most economical option for generating electricity in comparison to producing electricity by wind turbines because of the lower value of the cost of energy per kWh.
According to Kibris Türk Elektrik Kurumu (2018) [46], the diesel electricity cost is about 0.15$/kWh (0–250 kWh) and 0.17$/kWh (250–500 kWh). The current results show that these systems are the most economical option for generating electricity in comparison to producing electricity by diesel generators because of the lower value of the cost of energy per kWh. The results show that using a solar system for producing electricity in Northern Cyprus could reduce the electricity costs by an average of 70% compared to diesel electricity costs. Moreover, the net fuel savings provided by electricity-generation system with solar systems are nearly three times greater than those obtained with wind systems.

5. Conclusions and Future Works

Urban wind and solar energy consist of the utilization of wind and solar energy technology in applications in urban and suburban built environments. In this assessment, 2010–2016 wind speed data for three urban regions in Northern Cyprus have been used to investigate the potential for generating electricity from wind energy. The Weibull distribution function was used to analyze the wind speed characteristics in the selected regions. The Power law method was used to estimate the wind speeds at various hub heights. A techno-economic assessment was made for the generation of electricity using 12 wind turbines with various characteristics and types in all the studied regions. Moreover, this paper analyzed the solar energy potential based on three simulation tools. The performance of a grid-connected rooftop solar photovoltaic system in terms of energy generation, performance ratio and capacity factor has been analyzed. The main outcomes of the study are:
  • All the considered regions have annual mean wind speeds above 2 m/s, and the wind power densities range between 11.72 W/m2 and 68.49 W/m2 at a height of 10 m. The wind power analysis shows that Gazimağusa is the best location for harvesting wind energy.
  • AWT(2)2000 model with a power rating of 4 kW has the lowest energy production cost among the considered wind turbine technologies.
  • Vertical axis wind turbines have significant potential to generate electricity for the urban environment.
  • Among the simulation software studied, PVGIS has been demonstrated to be an easy, fast, and reliable software tool for the simulation of solar PV systems in the studied towns.
  • In comparison with solar and wind systems, PV systems are the best option for producing electricity in the studied regions.
  • It is concluded that the PV system project is the most economical option for generating electricity in the studied locations compared with the wind system due to the low electricity prices and recovery of initial investment.
  • Based on the overall performance of the rooftop solar PV power plant, it is evident that solar PV power is a feasible solution for supplying power and reducing the large volume of CO2 emissions emitted into the atmosphere.
Generally, solar radiation can be considered constant in a wide area, but wind is a local resource, and it must be studied in the exact location. The prediction of wind speed in the built environment is difficult due to the varying roughness and the drag exerted by surface-mounted obstacles on the flow, which reduce the wind speed close to the ground. Therefore, it is conceivable that there is a lack of accurate approaches for the assessment of wind speed in urban areas. An interesting area for future study is Computational Fluid Dynamics (CFD), which can be used to predict the wind speed in urban environments (selected regions) for conventional buildings. In addition, the evaluation of potential locations for the installation of small-scale wind turbines in urban areas can be investigated using CFD.

Author Contributions

R.A.Z. and Y.K. analyzed the data. Y.K. and H.G. wrote the paper.

Funding

This research received no external funding.

Acknowledgments

The authors would like to thank the Faculty of Civil and Environmental Engineering especially the Civil Engineering Department at Near East University for their support and encouragement.

Conflicts of Interest

The authors declare no conflict of interest.

References

  1. Yenen, M.; Fahrioglu, M. Wind and solar energy assessment of Northern Cyprus. In Proceedings of the 12th International Conference on Environment and Electrical Engineering, Wroclaw, Poland, 5–8 May 2013. [Google Scholar]
  2. Kassem, Y.; Gökçekuş, H.; Çamur, H. Economic assessment of renewable power generation based on wind speed and solar radiation in urban regions. Global J. Environ. Sci. Manag. 2018, 4, 465–482. [Google Scholar]
  3. Ishaq, H.; Dincer, I.; Naterer, G. Development and assessment of a solar, wind and hydrogen hybrid trigeneration system. Int. J. Hydrogen Energy 2018, 43, 23148–23160. [Google Scholar] [CrossRef]
  4. Woldeyohannes, A.D.; Woldemichael, D.E.; Baheta, A.T. Sustainable renewable energy resources utilization in rural areas. Renew. Sustain. Energy Rev. 2016, 66, 1–9. [Google Scholar] [CrossRef]
  5. Owusu, P.A.; Asumadu-Sarkodie, S. A review of renewable energy sources, sustainability issues and climate change mitigation. Cogent. Eng. 2016, 3, 1167990. [Google Scholar] [CrossRef]
  6. Razmjoo, A.; Qolipour, M.; Shirmohammadi, R.; Heibati, S.M.; Faraji, I. Techno-economic evaluation of standalone hybrid solar-wind systems for small residential districts in the central desert of Iran. Environ. Prog. Sustain. Energy 2017, 36, 1194–1207. [Google Scholar] [CrossRef]
  7. Best, R.; Burke, P.J. Adoption of solar and wind energy: The roles of carbon pricing and aggregate policy support. Energy Policy 2018, 118, 404–417. [Google Scholar] [CrossRef]
  8. Chang, B.; Starcher, K. Evaluation of wind and solar energy investments in Texas. Renew. Energy 2019, 132, 1348–1359. [Google Scholar] [CrossRef]
  9. Khare, V.; Nema, S.; Baredar, P. Status of solar wind renewable energy in India. Renew. Sustain. Energy Rev. 2013, 27, 1–10. [Google Scholar] [CrossRef]
  10. Kamran, M. Current status and future success of renewable energy in Pakistan. Renew. Sustain. Energy Rev. 2018, 82, 609–617. [Google Scholar] [CrossRef]
  11. Kaplan, Y.A. Overview of wind energy in the world and assessment of current wind energy policies in Turkey. Renew. Sustain. Energy Rev. 2015, 43, 562–568. [Google Scholar] [CrossRef]
  12. Düştegör, D.; Sultana, N.; Felemban, N.; Qahtani, D.A. A smarter electricity grid for the Eastern Province of Saudi Arabia: Perceptions and policy implications. Util. Policy 2018, 50, 26–39. [Google Scholar] [CrossRef]
  13. Alayat, M.; Kassem, Y.; Çamur, H. Assessment of Wind Energy Potential as a Power Generation Source: A Case Study of Eight Selected Locations in Northern Cyprus. Energies 2018, 11, 2697. [Google Scholar] [CrossRef]
  14. Kassem, Y.; Gökçekuş, H.; Çamur, H. Effects of climate characteristics on wind power potential and economic evaluation in Salamis region, Northern Cyprus. Int. J. Appl. Environ. Sci. 2018, 13, 287–307. [Google Scholar]
  15. Solyali, D.; Altunç, M.; Tolun, S.; Aslan, Z. Wind resource assessment of Northern Cyprus. Renew. Sustain. Energy Rev. 2016, 55, 180–187. [Google Scholar] [CrossRef]
  16. Kassem, Y.; Gökçekuş, H. GHG emissions and energy performance of 1MWp grid-connected solar PV plant at Lefke in Northern Cyprus: A case study. Disaster Sci. Eng. 2018, 4, 90–98. [Google Scholar]
  17. Azad, A.; Rasul, M.; Yusaf, T. Statistical Diagnosis of the Best Weibull Methods for Wind Power Assessment for Agricultural Applications. Energies 2014, 7, 3056–3085. [Google Scholar] [CrossRef]
  18. Albani, A.; Ibrahim, M. Wind Energy Potential and Power Law Indexes Assessment for Selected Near-Coastal Sites in Malaysia. Energies 2017, 10, 307. [Google Scholar] [CrossRef]
  19. Mohammadi, K.; Naderi, M.; Saghafifar, M. Economic feasibility of developing grid-connected photovoltaic plants in the southern coast of Iran. Energy 2018, 156, 17–31. [Google Scholar] [CrossRef]
  20. Stathopoulos, T.; Alrawashdeh, H.; Al-Quraan, A.; Blocken, B.; Dilimulati, A.; Paraschivoiu, M.; Pilay, P. Urban wind energy: Some views on potential and challenges. J. Wind Eng. Ind. Aerod. 2018, 179, 146–157. [Google Scholar] [CrossRef]
  21. Ishugah, T.; Li, Y.; Wang, R.; Kiplagat, J. Advances in wind energy resource exploitation in urban environment: A review. Renew. Sustain. Energy Rev. 2014, 37, 613–626. [Google Scholar] [CrossRef]
  22. Dahmouni, A.; Ben Salah, M.; Askri, F.; Kerkeni, C.; Ben Nasrallah, S. Assessment of wind energy potential and optimal electricity generation in Borj-Cedria, Tunisia. Renew. Sustain. Energy Rev. 2011, 15, 815–820. [Google Scholar] [CrossRef]
  23. Kamau, J.; Kinyua, R.; Gathua, J. 6 years of wind data for Marsabit, Kenya average over 14 m/s at 100 m hub height; An analysis of the wind energy potential. Renew. Energy 2010, 35, 1298–1302. [Google Scholar] [CrossRef]
  24. Kaplan, Y.A. Determination of the best Weibull methods for wind power assessment in the southern area of Turkey. IET Renew. Power Gener. 2017, 11, 175–182. [Google Scholar] [CrossRef]
  25. Ahmed, A.S. Wind energy characteristics and wind park installation in Shark El-Ouinat, Egypt. Renew. Sustain. Energy Rev. 2018, 82, 734–742. [Google Scholar] [CrossRef]
  26. Chaurasiya, P.K.; Ahmed, S.; Warudkar, V. Study of different parameters estimation methods of Weibull distribution to determine wind power density using ground based Doppler SODAR instrument. Alex. Eng. J. 2018, 57, 2299–2311. [Google Scholar] [CrossRef]
  27. Soulouknga, M.; Doka, S.N.; Revanna, N.; Djongyang, N.; Kofane, T.C. Analysis of wind speed data and wind energy potential in Faya-Largeau, Chad, using Weibull distribution. Renew. Energy 2018, 121, 1–8. [Google Scholar] [CrossRef]
  28. Belabes, B.; Youcefi, A.; Guerri, O.; Djamai, M.; Kaabeche, A. Evaluation of wind energy potential and estimation of cost using wind energy turbines for electricity generation in north of Algeria. Renew. Sustain. Energy Rev. 2015, 51, 1245–1255. [Google Scholar] [CrossRef]
  29. Mohammadi, K.; Mostafaeipour, A. Using different methods for comprehensive study of wind turbine utilization in Zarrineh, Iran. Energy Convers. Manag. 2013, 65, 463–470. [Google Scholar] [CrossRef]
  30. Irwanto, M.; Gomesh, N.; Mamat, M.; Yusoff, Y. Assessment of wind power generation potential in Perlis, Malaysia. Renew. Sustain. Energy Rev. 2014, 38, 296–308. [Google Scholar] [CrossRef]
  31. Mostafaeipour, A. Feasibility study of harnessing wind energy for turbine installation in province of Yazd in Iran. Renew. Sustain. Energy Rev. 2010, 14, 93–111. [Google Scholar] [CrossRef]
  32. Ayodele, T.R.; Jimoh, A.A.; Munda, J.L.; Agee, J.T. Viability and economic analysis of wind energy resource for power generation in Johannesburg, South Africa. Int. J. Sustain. Energy 2013, 33, 284–303. [Google Scholar] [CrossRef]
  33. Pallabazzer, R. Parametric analysis of wind siting efficiency. J. Wind Eng. Ind. Aerod. 2003, 91, 1329–1352. [Google Scholar] [CrossRef]
  34. Ammari, H.D.; Al-Rwashdeh, S.S.; Al-Najideen, M.I. Evaluation of wind energy potential and electricity generation at five locations in Jordan. Sustain. Cities Soc. 2015, 15, 135–143. [Google Scholar] [CrossRef]
  35. Gökçek, M.; Genç, M.S. Evaluation of electricity generation and energy cost of wind energy conversion systems (WECSs) in Central Turkey. Appl. Energy 2009, 86, 2731–2739. [Google Scholar] [CrossRef]
  36. Gölçek, M.; Erdem, H.H.; Bayülken, A. A Techno-Economical Evaluation for Installation of Suitable Wind Energy Plants in Western Marmara, Turkey. Energy Explor. Exploit. 2007, 25, 407–427. [Google Scholar] [CrossRef]
  37. Adaramola, M.; Paul, S.; Oyedepo, S. Assessment of electricity generation and energy cost of wind energy conversion systems in north-central Nigeria. Energy Convers. Manag. 2011, 52, 3363–3368. [Google Scholar] [CrossRef]
  38. Lun, I.Y.; Lam, J.C. A study of Weibull parameters using long-term wind observations. Renew. Energy 2000, 20, 145–153. [Google Scholar] [CrossRef]
  39. Shu, Z.; Li, Q.; Chan, P. Statistical analysis of wind characteristics and wind energy potential in Hong Kong. Energy Convers. Manag. 2015, 101, 644–657. [Google Scholar] [CrossRef]
  40. Bilir, L.; İmir, M.; Devrim, Y.; Albostan, A. An investigation on wind energy potential and small-scale wind turbine performance at İncek area—Ankara, Turkey. Energy Convers. Manag. 2015, 103, 910–923. [Google Scholar] [CrossRef]
  41. Paraschivoiu, I. Wind Turbine Design: With Emphasis on Darrieus Concept. 2009. Available online: http://ethicaljournalisminitiative.org/wind-turbine-design-with-emphasis-on-darrieus-concept.pdf (accessed on 7 March 2019).
  42. Wang, B.; Cot, L.; Adolphe, L.; Geoffroy, S. Estimation of wind energy of a building with canopy roof. Sustain. Cities Soc. 2017, 35, 402–416. [Google Scholar] [CrossRef]
  43. Maxoulis, C.N.; Kalogirou, S.A. Cyprus energy policy: The road to the 2006 world renewable energy congress trophy. Renew. Energy 2008, 33, 355–365. [Google Scholar] [CrossRef]
  44. Dondariya, C.; Porwal, D.; Awasthi, A.; Shukla, A.K.; Sudhakar, K.; Murali Manohar, S.R.; Bhimte, A. Performance simulation of grid-connected rooftop solar PV system for small households: A case study of Ujjain, India. Energy Rep. 2018, 4, 546–553. [Google Scholar] [CrossRef]
  45. Erciyas, O. Sustainability Assessment of Photovoltaic Power Plants in North Cyprus. Master Thesis, Eastern Mediterranean University, Famagusta, Turkey, 2014. [Google Scholar]
  46. Kibris Türk Elektrik Kurumu. Available online: https://www.kibtek.com/tarifeler/ (accessed on 5 October 2018).
Figure 1. Flowchart of analysis procedure of the present study.
Environments 06 00047 g001
Figure 2. Locations of selected regions in the Northern part of Cyprus.
Environments 06 00047 g002
Figure 3. Monthly variation of the mean wind speed at a 10 m height.
Environments 06 00047 g003
Figure 4. Hourly variation of the mean wind speed at a 10 m height.
Environments 06 00047 g004
Figure 5. The relative error of annual wind speed data.
Environments 06 00047 g005
Figure 6. Yearly variation of shape and scale parameters for the areas at 10 m height (k: solid line; c: dashed line).
Environments 06 00047 g006
Figure 7. Wind speed probability frequency for the whole (2010–2016) at 10 m height.
Environments 06 00047 g007
Figure 8. Vertical wind shear profile at six studied locations.
Environments 06 00047 g008
Figure 9. Monthly variation of solar irradiation for Lefkoşa.
Environments 06 00047 g009
Figure 10. Monthly variation of solar irradiation for Girne.
Environments 06 00047 g010
Figure 11. Monthly variation of solar irradiation for Gazimağusa.
Environments 06 00047 g011
Figure 12. Monthly variation of energy generation for Lefkoşa.
Environments 06 00047 g012
Figure 13. Monthly variation of energy generation for Girne.
Environments 06 00047 g013
Figure 14. Monthly variation of energy generation for Gazimağusa.
Environments 06 00047 g014
Table 1. Coordinated and period data for the selected regions.
LocationCoordinatesArea [m2]Altitude [m]Period
Latitude [°N]Longitude [°E]
Lefkoşa35°10′12.9″33°21′31.32″5021462010–2016
Girne35°20′0.6″33°18′51.156″69072010–2016
Gazimağusa35°7′15.9924″33°56′15.1116″99772010–2016
Table 2. Description of a 6.4 kWp rooftop system.
Installed Power6.4 kWp
Installation typeRoof Parallel
Type of modulesMono Crystalline, Efficiency 14.9%
No. of Module (320 Wp)20 (1-Soltec Inc, 1-STH 320)
Mounting systemFixed mounting, free standing
Azimuth/slopFrom PVGIS software
Load Profile2-Person household with 2-children
Availability95%
Albedo20%
Area5.1 m2
Table 3. Software used in the current study.
SoftwareSoftware SpecificationsInputs Required
PVGISAn open source research tool for performance assessment of PV technology in geographical regions and as a support system for policymaking in the European UnionTotal irradiance, Monthly values of atmospheric conditions, and the mounting position.
PV*SOLUsed for Planning and Simulation of a site-specific solar PV system.Location coordinates, meteorological data, system and auxiliary devices requirements.
PVWattsAn open source research tool for performance assessment of PV technology in geographical regions and designed by the National Renewable Energy Laboratory (NREL) allowing a user to perform a simulation with geographical data of the locationLocation, system, and auxiliary devices requirements.
Table 4. Weibull parameters for each region (2010–2016) at a height of 10 m.
RegionParametersMean [m/s]vmp
[m/s]
vmaxE
[m/s]
WPD [W/m2]Kolmogorov-Smirnov Test
Kc [m/s]
Lefkoşa2.802.882.562.493.4915.050.851
Girne4.122.762.502.583.0411.720.395
Gazimağusa5.935.024.654.875.2768.490.059
Table 5. Roughness values for different sites.
LocationsRoughness Value (α)
Gazimağusa0.235
Lefkoşa0.289
Girne0.290
Table 6. The annual wind power density at various heights.
Height [m]RegionVariable
Mean [m/s]WPD [W/m2]Wind Power Class
30Gazimağusa6.02133.50poor
Lefkoşa3.4525.20
Girne3.4024.17
50Gazimağusa6.78191.30
Lefkoşa4.0039.23
Girne3.9537.72
80Gazimağusa7.58266.37
Lefkoşa4.5858.95
Girne4.5356.79
90Gazimağusa7.79288.96
Lefkoşa4.7697.62
Girne4.6977.32
Table 7. Characteristics of the selected wind turbine.
Technical DataAircon10WRE.060Eurowind 1Passaat
Type of wind turbineHAWTVAWTVAWTHAWT
Rated output capacity [kW]9.8≈10610.81.4
Cut-in wind speed2.5232.5
Rated wind speed [m/s]11141216
Cut-out wind speed [m/s]32None28–32-
Height of the mast [m]12/18/24/30Site-dependentSite-dependent12–24
Rotor diameter [m]7.13.36.63.12
Technical dataEurowind 2MontanaAlizeWS-12
Type of wind turbineVAWTHAWTHAWTVAWT
Rated output capacity [kW]55.6108
Cut-in wind speed32.532
Rated wind speed [m/s]12171220
Cut-out wind speed [m/s]28–32NoneNoneNone
Height [m]Site-dependent1818–36Site-dependent
Rotor diameter [m]4.25572
Technical dataIskraWRE.030TH RijswijkAWT(2)2000
Type of wind turbineHAWTVAWTHAWTVAWT
Rated output capacity [kW]5354
Cut-in wind speed322.752
Rated wind speed [m/s]111410.512
Cut-out wind speed [m/s]60None>10.5None
Height [m]12–30Site-dependent6–18Site-dependent
Rotor diameter [m]5.43.252.56
Table 8. Capacity factor and Generated electricity of wind turbine system at 18 m hub-height.
LocationTypeModelTime Generated [h]GE [kWh]CF [%]UCE [$/kWh]
LefkoşaHAWTAircon101126.3324.420.9051
Passaat111.7311.221.9699
Montana116.119.912.2301
Alize80.310.3956.7336
Iskra80.190.4747.0679
TH Rijswijk912.1326.950.8203
VAWTWRE.0601422.1126.320.8400
Eurowind 180.340.3956.7336
Eurowind 280.160.3956.7336
WS-121414.2912.761.7325
WRE.0301411.0526.320.8400
AWT(2)20001420.2136.090.6125
GirneHAWTAircon101029.3129.910.7391
Passaat101.9213.741.6086
Montana106.8012.141.8211
Alize61.712.867.7408
Iskra61.033.446.4220
TH Rijswijk914.8533.000.6698
VAWTWRE.0601631.7933.110.6676
Eurowind 161.852.867.7408
Eurowind 260.862.867.7408
WS-121620.5516.051.3770
WRE.0301615.8933.110.6676
AWT(2)20001629.0645.410.4868
GazimağusaHAWTAircon1024120.0351.030.4332
Passaat247.8823.450.9427
Montana2427.8420.711.0673
Alize2460.1125.040.8826
Iskra2436.2230.190.7323
TH Rijswijk2467.5756.310.3926
VAWTWRE.0602457.1639.700.5569
Eurowind 12459.9323.120.9560
Eurowind 22427.7523.120.9560
WS-122436.9519.251.1485
WRE.0302428.5839.700.5569
AWT(2)20002452.2654.440.4060
Table 9. Capacity factor and Generated electricity of wind turbine system.
LocationPerformance ParameterPVGISPV*SOLPVWatts
LefkoşaAnnual PV energy [kWh]10,708.008040.003861.81
Yearly in plane irradiation [KWh/m2]216818281282.48
Specific annual yield [kWh/kWp]1673.131256.25603.41
Own energy consumption [kWh]1378.001378.001378.00
Energy feed-in grid [kWh]9330.006662.002483.81
Own power consumption [%]12.8717.1435.68
thereof grid feed-in [%]87.1382.8664.32
Total energy consumption [kWh]3500.003500.003500.00
Covered by PV [kWh]1378.001378.001378.00
Covered by PV [%]39.3739.3739.37
Covered by grid [kWh]2122.002122.002122.00
Covered by grid [%]60.6360.6360.63
Capacity factor [%]19.114.346.89
Performance ratio [%]76.5868.1946.69
Cost of Energy [$/kWh]0.01980.02640.0549
GirneAnnual PV energy [kWh]10,631.006003.003795.00
Yearly in plane irradiation [KWh/m2]215418271282.48
Specific annual yield [kWh/kWp]1661.09937.97592.97
Own energy consumption [kWh]1222.001222.001222.00
Energy feed-in grid [kWh]9409.004781.002573.00
Own power consumption [%]11.4920.3632.20
thereof grid feed-in [%]88.5179.6467.80
Total energy consumption [kWh]3500.003500.003500.00
Covered by PV [kWh]1222.001222.001222.00
Covered by PV [%]34.9134.9134.91
Covered by grid [kWh]2278.002278.002278.00
Covered by grid [%]65.0965.0965.09
Capacity factor [%]18.9610.716.77
Performance ratio [%]76.5250.9445.88
Cost of Energy [$/kWh]0.01990.03530.0559
GazimağusaAnnual PV energy [kWh]10,936.005986.003864.37
Yearly in plane irradiation [KWh/m2]218918271283.48
Specific annual yield [kWh/kWp]1708.75935.31603.81
Own energy consumption [kWh]1213.001213.001213.00
Energy feed-in grid [kWh]9723.004773.002651.37
Own power consumption [%]11.0920.2631.39
thereof grid feed-in [%]88.9179.7468.61
Total energy consumption [kWh]3500.003500.003500.00
Covered by PV [kWh]1213.001213.001213.00
Covered by PV [%]34.6634.6634.66
Covered by grid [kWh]2287.002287.002287.00
Covered by grid [%]65.3465.3465.34
Capacity factor [%]19.5110.686.89
Performance ratio [%]77.4650.846.68
Cost of Energy [$/kWh]0.01940.03550.0549

