Article

Water Quality Assessment of Surface and Groundwater Sources Using a Water Quality Index Method: A Case Study of a Peri-Urban Town in Southwest, Nigeria

1
Department of chemistry, Osun State College of Education, Ila-Orangun, Osun State 234101, Nigeria
2
Department of Science Technology, Federal Polytechnic, Ado-Ekiti 360231, Nigeria
3
Department of Biology, Osun State College of Education, Ila Orangun, Osun State 234101, Nigeria
4
Department of Hydrology and Water Resources, University of Venda, Thohoyandou 0950, South Africa
*
Author to whom correspondence should be addressed.
Environments 2019, 6(2), 23; https://doi.org/10.3390/environments6020023
Submission received: 28 December 2018 / Revised: 11 February 2019 / Accepted: 19 February 2019 / Published: 22 February 2019

Abstract

:
Sustainable access to safe drinking water remains a global problem as more people in the world still consume water from unimproved sources. This study was carried out to evaluate the quality of 12 different water sources and 2 treated water used by a peri-urban town in the Southwest region of Nigeria to assess their suitability for drinking and domestic use. Water quality parameters studied include pH, temperature, acidity, total alkalinity, chloride content and total CO2. A Flame Atomic Absorption spectrophotometer was used to determine the concentrations of Ca, Mg, Cu, Cr, and Pb in the water samples. The total coliform was determined using the most probable number technique while a qualitative method was used to detect the presence of faecal coliform and E. coli in the water samples. All the physicochemical water quality parameters complied with regulatory standards. Similarly, most of the heavy metals also complied except for some sites. Faecal coliform and E. coli tested positive for all the samples except one of the tap water sample. Majority of the water samples (86%) were rated as excellent based on the physicochemical parameters. One sample each was rated as having poor and good water quality, respectively. All the samples tested positive for faecal coliform bacteria and E. coli except one (treated water). It is recommended that Microbial water quality parameters be included in all Water Quality Index (WQI) analyses in order to give the true status of the quality of a water resource.

1. Introduction

The consumption of water from surface and groundwater sources without any form of treatment is widely reported in the literature [1,2,3,4,5,6,7]. Groundwater is often the first alternative choice of many consumers due to its perceived cleanness and safeness. However, many studies have shown that groundwater can appear clean but houses a wide variety of pathogenic organisms. The safety of groundwater (shallow and deep groundwater sources) depends on a number of factors amongst which are (I) the geology of the area (II) human activities/land use activities of the area (III) environmental and meteorological conditions of the area. Groundwater with high fluoride, arsenic, mercury and cyanide levels have been reported globally [8,9,10,11,12,13,14]. There is an urgent need for the constant monitoring of groundwater as a major component of Water Resource Management [15,16,17].
Surface water sources in pristine environments are always of better quality when compared to those prone to anthropogenic influences. Surface waters are the best sinks for several point and non-point sources of pollution such as wastewater from agricultural and industrial processes, storm runoff amongst others [7,18].
The consumption of clean and safe drinking water has been linked to positive health outcomes and vice versa. Continuous and sustainable access to potable water supply remains a major challenge to millions of people around the world. This problem is exacerbated in rural areas of most developing countries due to the lack of water supply infrastructure or the inadequate supply of potable water [1,3]. In the absence of sustainable access to potable water, people are left with no choice than to seek for alternative sources of water which are often groundwater sources through shallow or deep wells and boreholes or the abstraction of water from rivers and lakes [1,3,19,20].
Previous studies have reported several outbreaks of water-borne diseases due to the consumption of contaminated surface and groundwater [15,19]. Hence, the consumption of untreated and inadequately treated water remains a major disease burden to public health. Most studies performed on the quality of surface and groundwater fail to present the results in the simplest form possible to policymakers and concerned citizens about the state of their water resources [21,22,23]. This problem is overcome if the results are reported using the Water quality index (WQI). Thus, complex water quality parameters investigated on water resources can be combined in a simple mathematical equation to generate results which are easy to understand by policymakers who may not be water specialists [24]. WQI thus transforms a large number of water quality data into a single number. It aids the understanding of water quality issues by integrating complex data and generating a score that describes water quality status [25,26,27].
Therefore, WQI is employed to understand the overall water quality status of water resources, be they surface or groundwater. Although there are some limitations associated with WQI because basic microbial parameters are often not included [26,27,28], it still remains an indispensable tool to understand the water quality status of drinking water based on their physicochemical parameters. Several methods have been reported for the estimation of water quality index. A few authors have, however, reported the incorporation of E. coli and other faecal indicator organisms into the water quality index to accommodate the microbiological parameters, but this is not the norm [21,29].
To this end, this study was carried out to assess the quality of various water sources used by residents of Olorunsogo Local Government area of Oyo State, Nigeria. Most of these water sources have not been characterized before now. The water quality status of the water resources in the study area, as determined by the WQI, is also presented.
The study area is located in the Olorunsogo Local Government of the Oyo State Nigeria, with geographical coordinates 8.7525096° N and 4.1349309° E. The area is characterized by a low level of environmental sanitation with several pit toilets, poor housing plans, lack of potable water and improper solid waste and wastewater management. It has a population of 81,000 as of 2006. The rainy season is usually from April–October while the dry season is from November to March.

2. Materials and Methods

2.1. Sampling

A total of 28 samples were collected in the dry season from ground and surface water sources within and around the study area. Sterile polyethylene bottles were used to collect 14 samples for microbiological analysis, while samples for the other parameters of interest were collected using a pre-cleaned polyethylene bottle. The surface water (SW) sources were designated SW1–SW7. SW1 and SW3 represent treated (potable) water supplied by the Local government while the groundwater (GW) sources were designated GW1–GW7, respectively. The samples were transported on ice to the laboratory for further analysis. Field measurement of pH and temperature were performed using a multimeter (CRISON MM 40, Barcelona, Spain). Microbiological samples were analysed immediately when they arrived at the laboratory within six hours of collection.

2.2. Physicochemical Measurement

The measurements of pH and temperature were done on the field using a multimeter (CRISON MM 40, Barcelona, Spain). The concentrations of heavy metals were measured using the Buck Scientific Flame Atomic Absorption Spectrophotometer (Scientific 200A model) at the International Institute of Tropical Agriculture (IITA), Ibadan, Oyo State, Nigeria. Physicochemical parameters such as the total alkalinity, acidity, total CO2 and chloride levels were determined in the laboratory following standard methods recommended by APHA [30]

2.3. Water Quality Index (WQI) Determination

An effective monitoring tool that provides useful information of water from various sources is the water quality index which often incorporates several water quality parameters to describe the state of the water resources and its potential application for drinking purposes. Several authors have reported variable weights assigned to a particular water quality parameter (Table 1). The choice of the weight is usually due to the perceived risk that a specific parameter is likely to have. A maximum number of 5 is usually assigned to water quality parameters with the highest perceived risk in drinking water while 1 was assigned to the least perceived water quality risk parameter. The values reported for chloride ranges between 1–5. Chloride has a low health risk in drinking water with a World Health Organization (WHO) permissible limit of 250 mg/L [31]. The major concern of Cl is that it affects the taste of drinking water when present in relatively high concentrations. There is, however, a consensus on pH as most authors have assigned the weight of 4 to it.
In this study, seven parameters were used to estimate the WQI of surface and groundwater in the study area. Parameters that are important in water quality assessment such as Cr and Mn were assigned 5 while those like chloride which play insignificant roles in the assessment of water quality were assigned 1 (Table 2). Others were assigned values between 1–5 based on their relevance in water quality assessment [32,33,34,35].
The relative weight of the parameters was computed using the relationship in Equation (1) below:
W i = w i i n w i
Wi represents the relative weight of the parameter, wi is the weight of each parameter and n is the total number of parameters. The calculated relative weight (Wi) values of each parameter are given in Table 2. For each of the parameters, a quality rating scale (qi) was determined using the relationship in Equation (2) below:
q i = C i   × 100 S i
where qi is the quality rating and Ci the concentration (mg/L) of each chemical parameter in each water sample. Si is the WHO [31] drinking water standard for each of the parameter.
The sub-index and WQI were computed using the relationship in Equations (3) and (4), respectively
S I i = W i × q i
W Q I = S I i
where SIi is the sub-index of the ith parameter and qi is the rating based on the concentration of the ith parameter. Table 3 shows the range of the water quality index specified for drinking water.

2.4. Microbiological Analyses

2.4.1. Enumeration of Total Bacteria Count

The total coliform in the water samples was determined using the Most Probable Number (MPN) technique as described in Packiyam et al. [37].

2.4.2. Identification of Faecal Coliform and E. coli in Water Samples

This was performed using the preventive and confirmatory tests as reported by Packiyam et al. [37].

Presumptive Test

The procedure used was to process 5 aliquots of sample water for 3 dilutions. Fifteen tubes were used for the presumptive test. A 10 mL double strength lactose broth was put in 5 test tubes and 10 mL single strength lactose broth were put in 10 test tubes. An inverted Durham tube was put in each test tube making sure that the Durham tubes are full of liquid with no air bubbles. The test tubes were separated into three sets—5 containing double strength lactose broth, 5 containing single strength lactose broth and another 5 containing single strength lactose broth. All tubes were sterilized by autoclaving at 120 °C for 15 min. Using a sterile pipette, 10 mL of sample water was dispensed into each of the 5 tubes containing double strength lactose broth. Similarly, 1 mL of sample water was added to each of the 5 tubes containing 10 mL of single strength lactose broth and 0.1 mL of sample water into each of the other sets of 5 test tubes with a single strength lactose broth. All tubes were incubated at 37 °C for 24 h. Positive results, indicated by a colour change of the lactose broth and gas production in the Durham tubes, were recorded. Negative tubes were further incubated for another 24 h. The pattern of positive results was compared with the appropriate most probable number table (McGrady Table).

Confirmatory Test

In the confirmation test, test tubes of brilliant green lactose bile broth (BGLB broth) and E. coli broth (EC broth) (44653 Sigma-Aldrich, Johannesburg, South Africa) containing inverted Durham tubes were prepared and sterilised. The number of each of the BGLB broth and EC broth tubes corresponded to the number of positives in the presumptive test. Using a sterile wire loop, inocula were transferred from positive tubes in the presumptive test into each of the BGLB broth and EC broth tubes. The loop was sterilized between successive transfers by heating it in a flame until red hot and allowed to cool before use. The tubes were carefully labelled and incubated for 48 h at 37 °C for the BGLB broth and 24 h at 44 °C for the E. coli medium. The elevated incubation temperature for the EC broth encourages the growth of faecal coliforms while suppressing the non-faecal coliforms. Positive BGLB tubes confirm the presence of faecal coliforms as it distinguishes between this group and the general coliforms. Inocula from positive EC broth tubes were streaked on Eosin Methylene Blue agar plates and incubated for 24 h at 35 °C. The resulting dark centred, metallic sheen colonies suspected to be E. coli were streaked on nutrient agar slants and incubated for 24 h at 35 °C. Gram staining was performed and cultures appearing as Gram-negative, bacilli were subjected to the IMViC tests.

3. Results

The total coliform determined for tap water in the study area (SW1&SW3), surface water (SW2, SW4–SW7) and groundwater (GW1–GW7) are presented in Figure 1. In most cases, the surface water had a higher bacteria count than groundwater. Table 4 shows that faecal coliform and E. coli were present in most of the samples except for one of the tap water samples (S3).
Table 5 showed the water quality status of each of the water sources. Most of the water sources were rated excellent based on the chemical water quality parameters only.
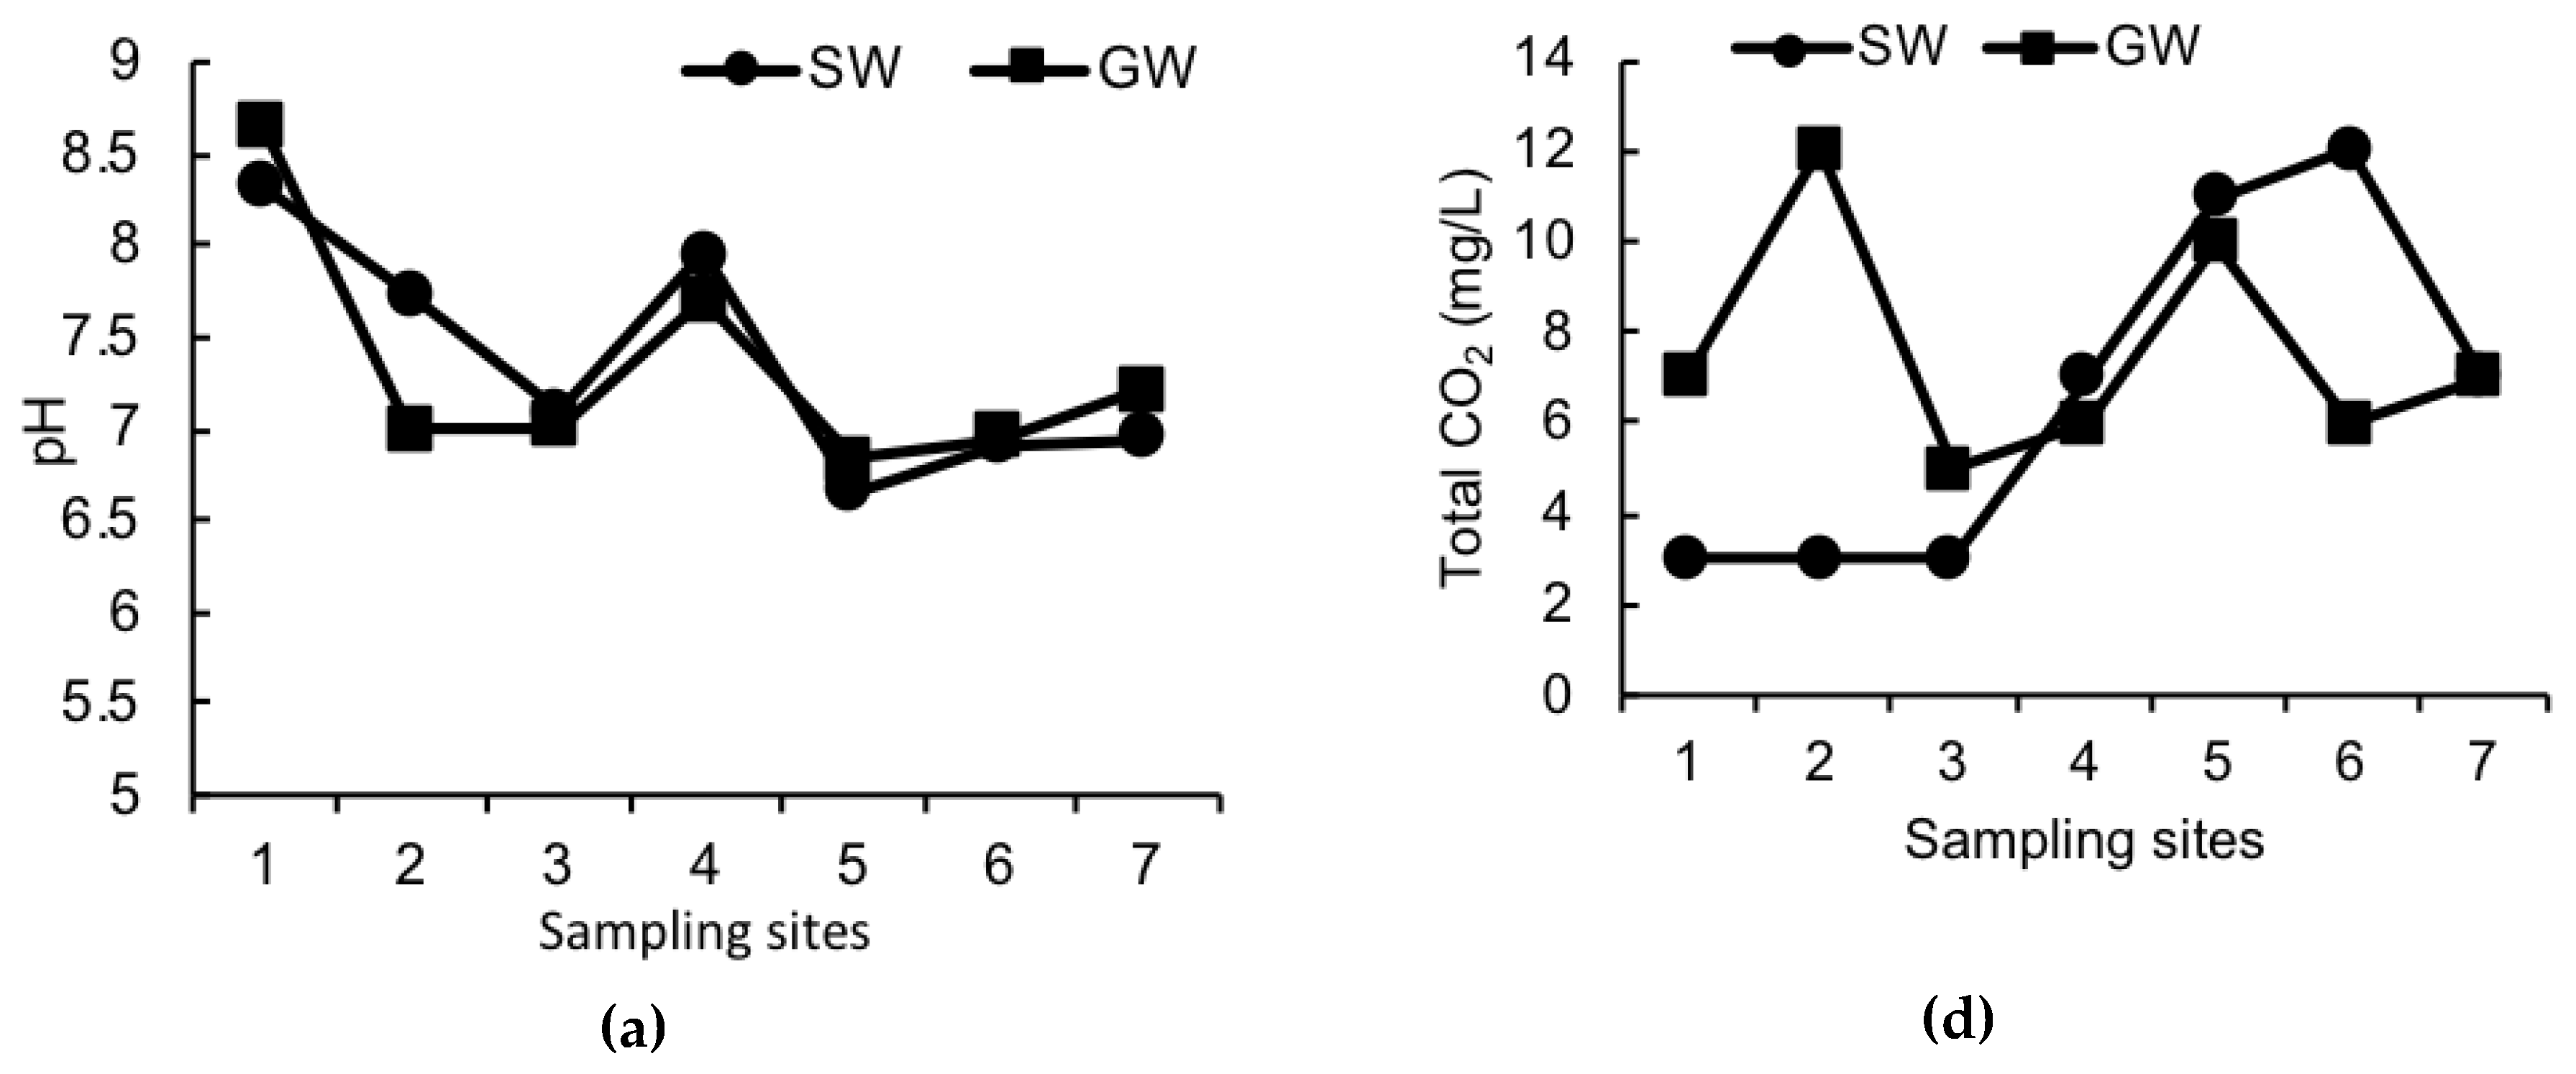
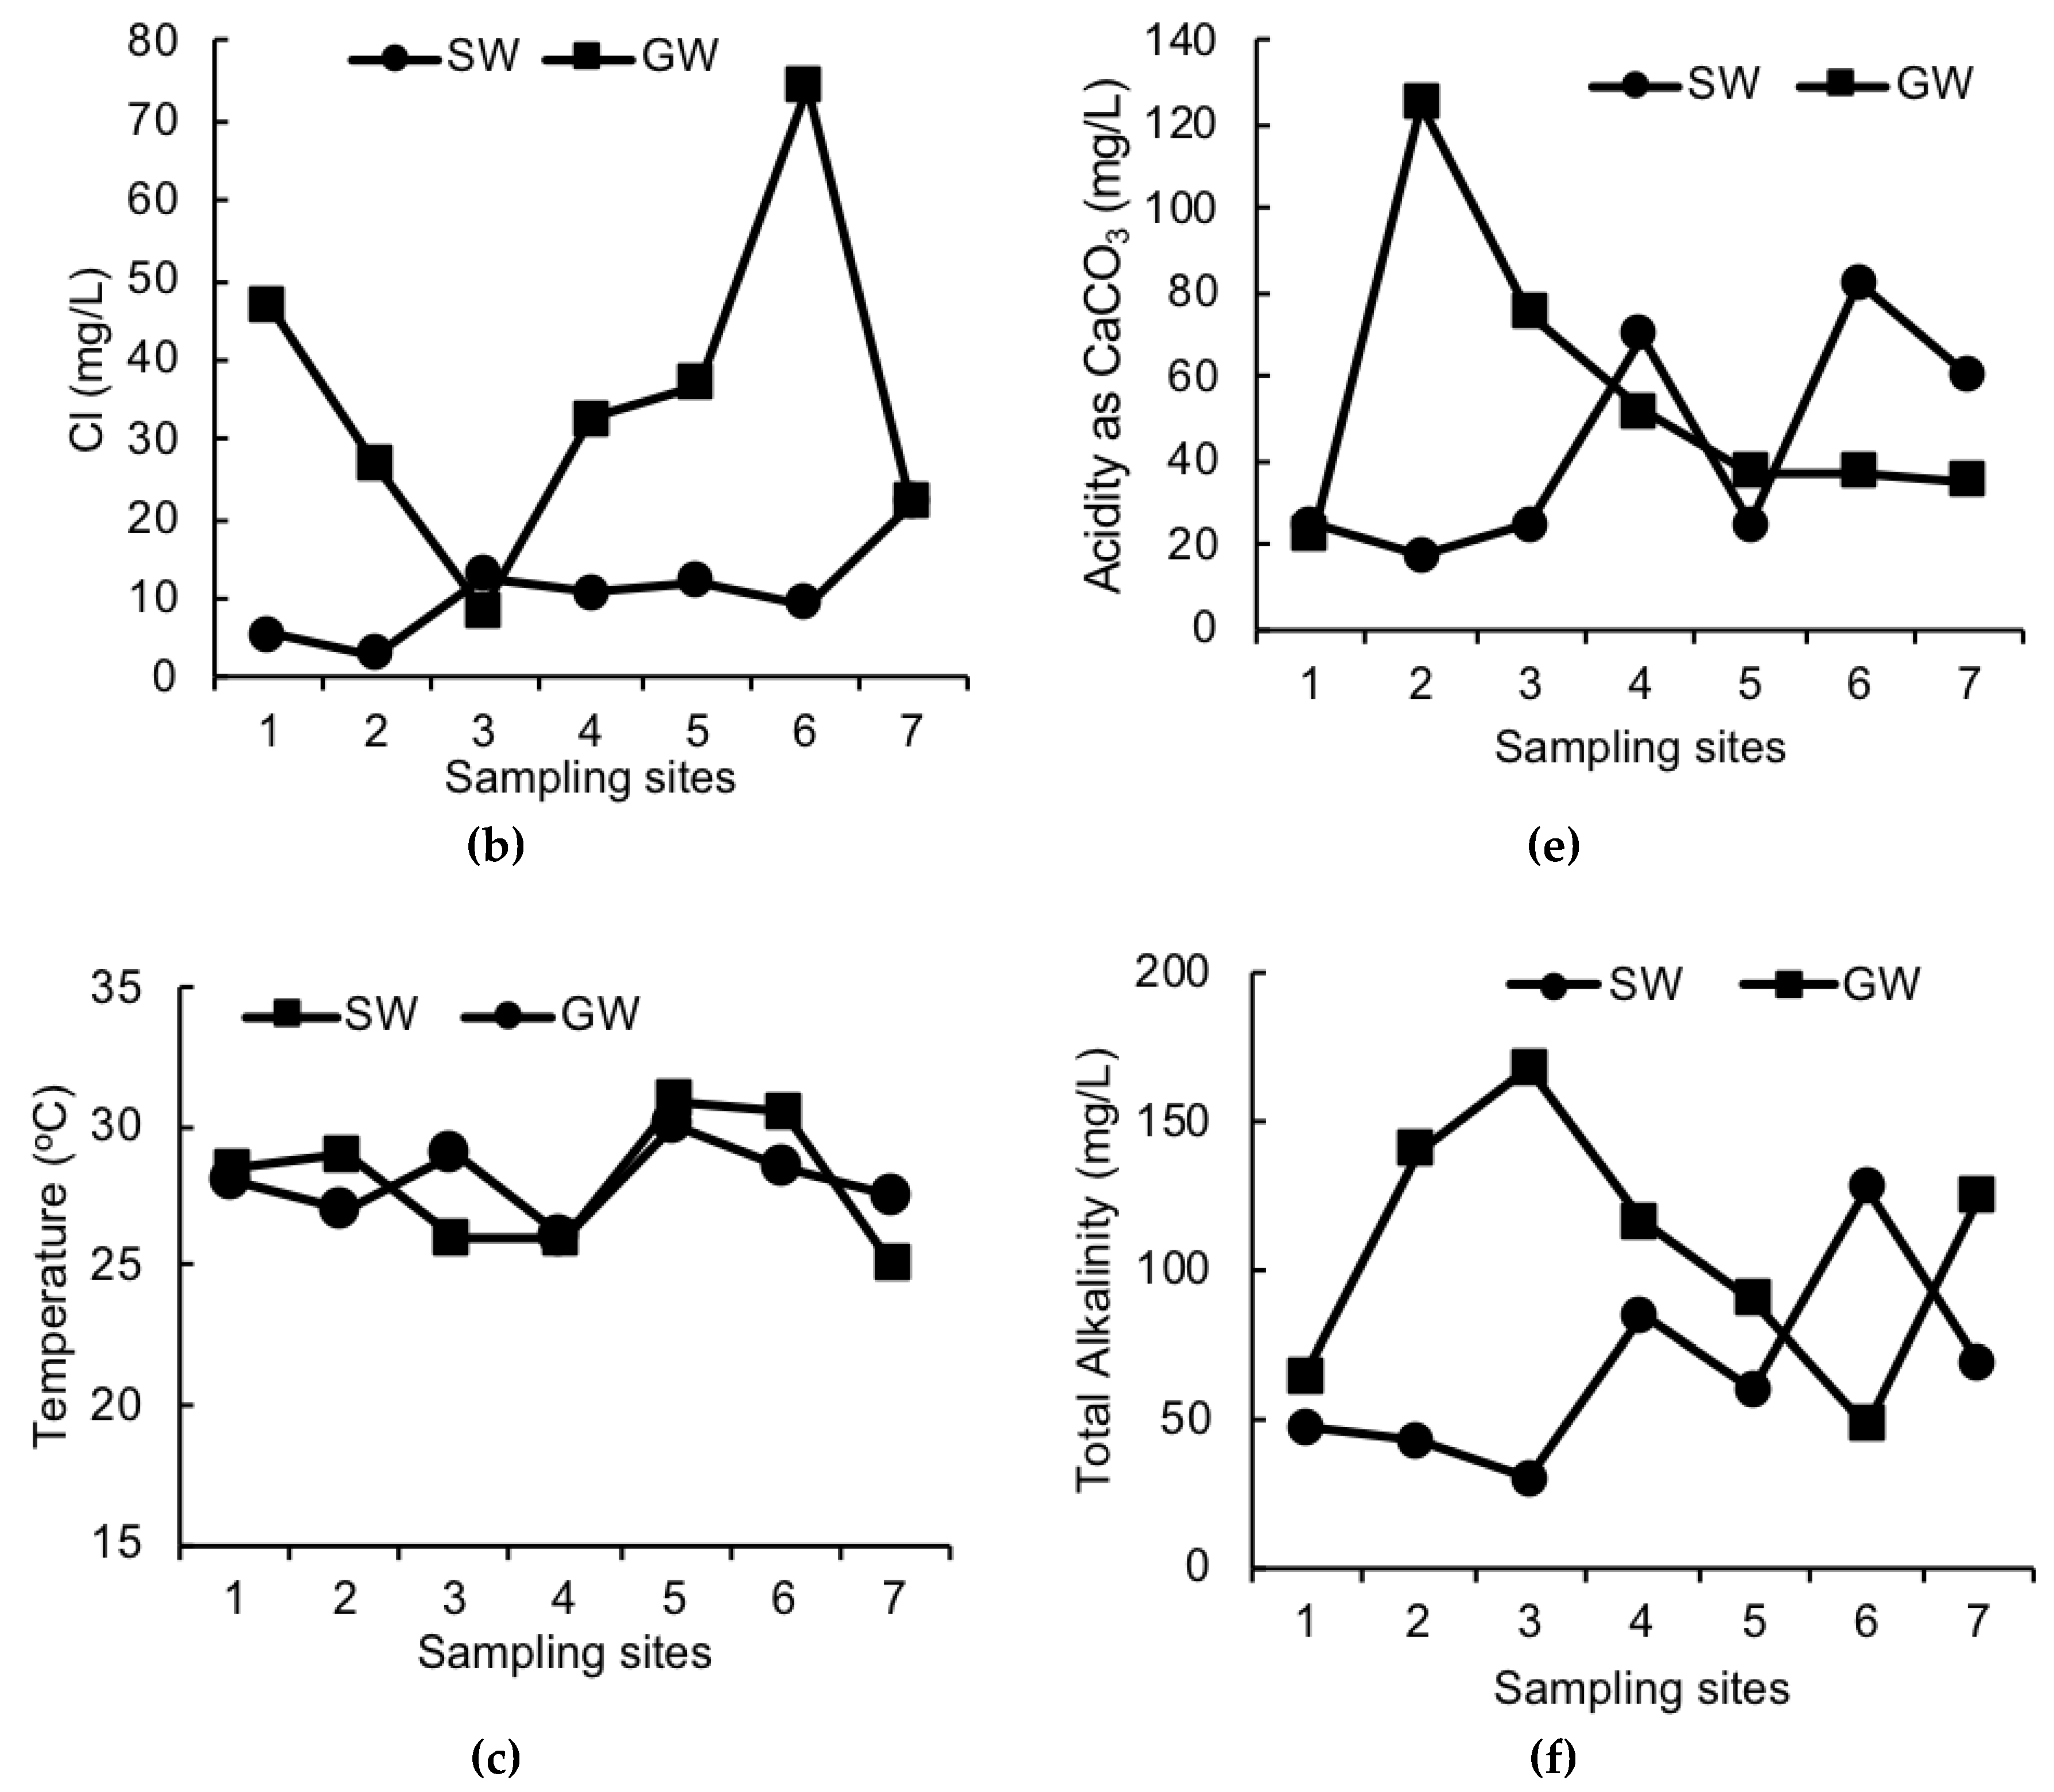
The various results obtained for the physicochemical analysis of the water samples from the various sites are presented in Figure 2. The pH ranged between 6.66–8.33 and 6.83–8.65 for both surface and groundwater, respectively. Higher levels of chloride were determined in groundwater (8.51–74.46 mg/L) than surface water (2.84–21.98 mg/L). The temperature ranged between 25–31 for all the water sources. The total CO2 values were in the range of 3–11.99 mg/L and 4.99–11.99 mg/L for surface and groundwater, respectively. Higher levels of acidity as CaCO3 were recorded for groundwater (22.5–125 mg/L) than for surface water (17.5–82.5 mg/L). The total alkalinity varied between 30–128 mg/L and 48–168 mg/L for surface and groundwater, respectively.
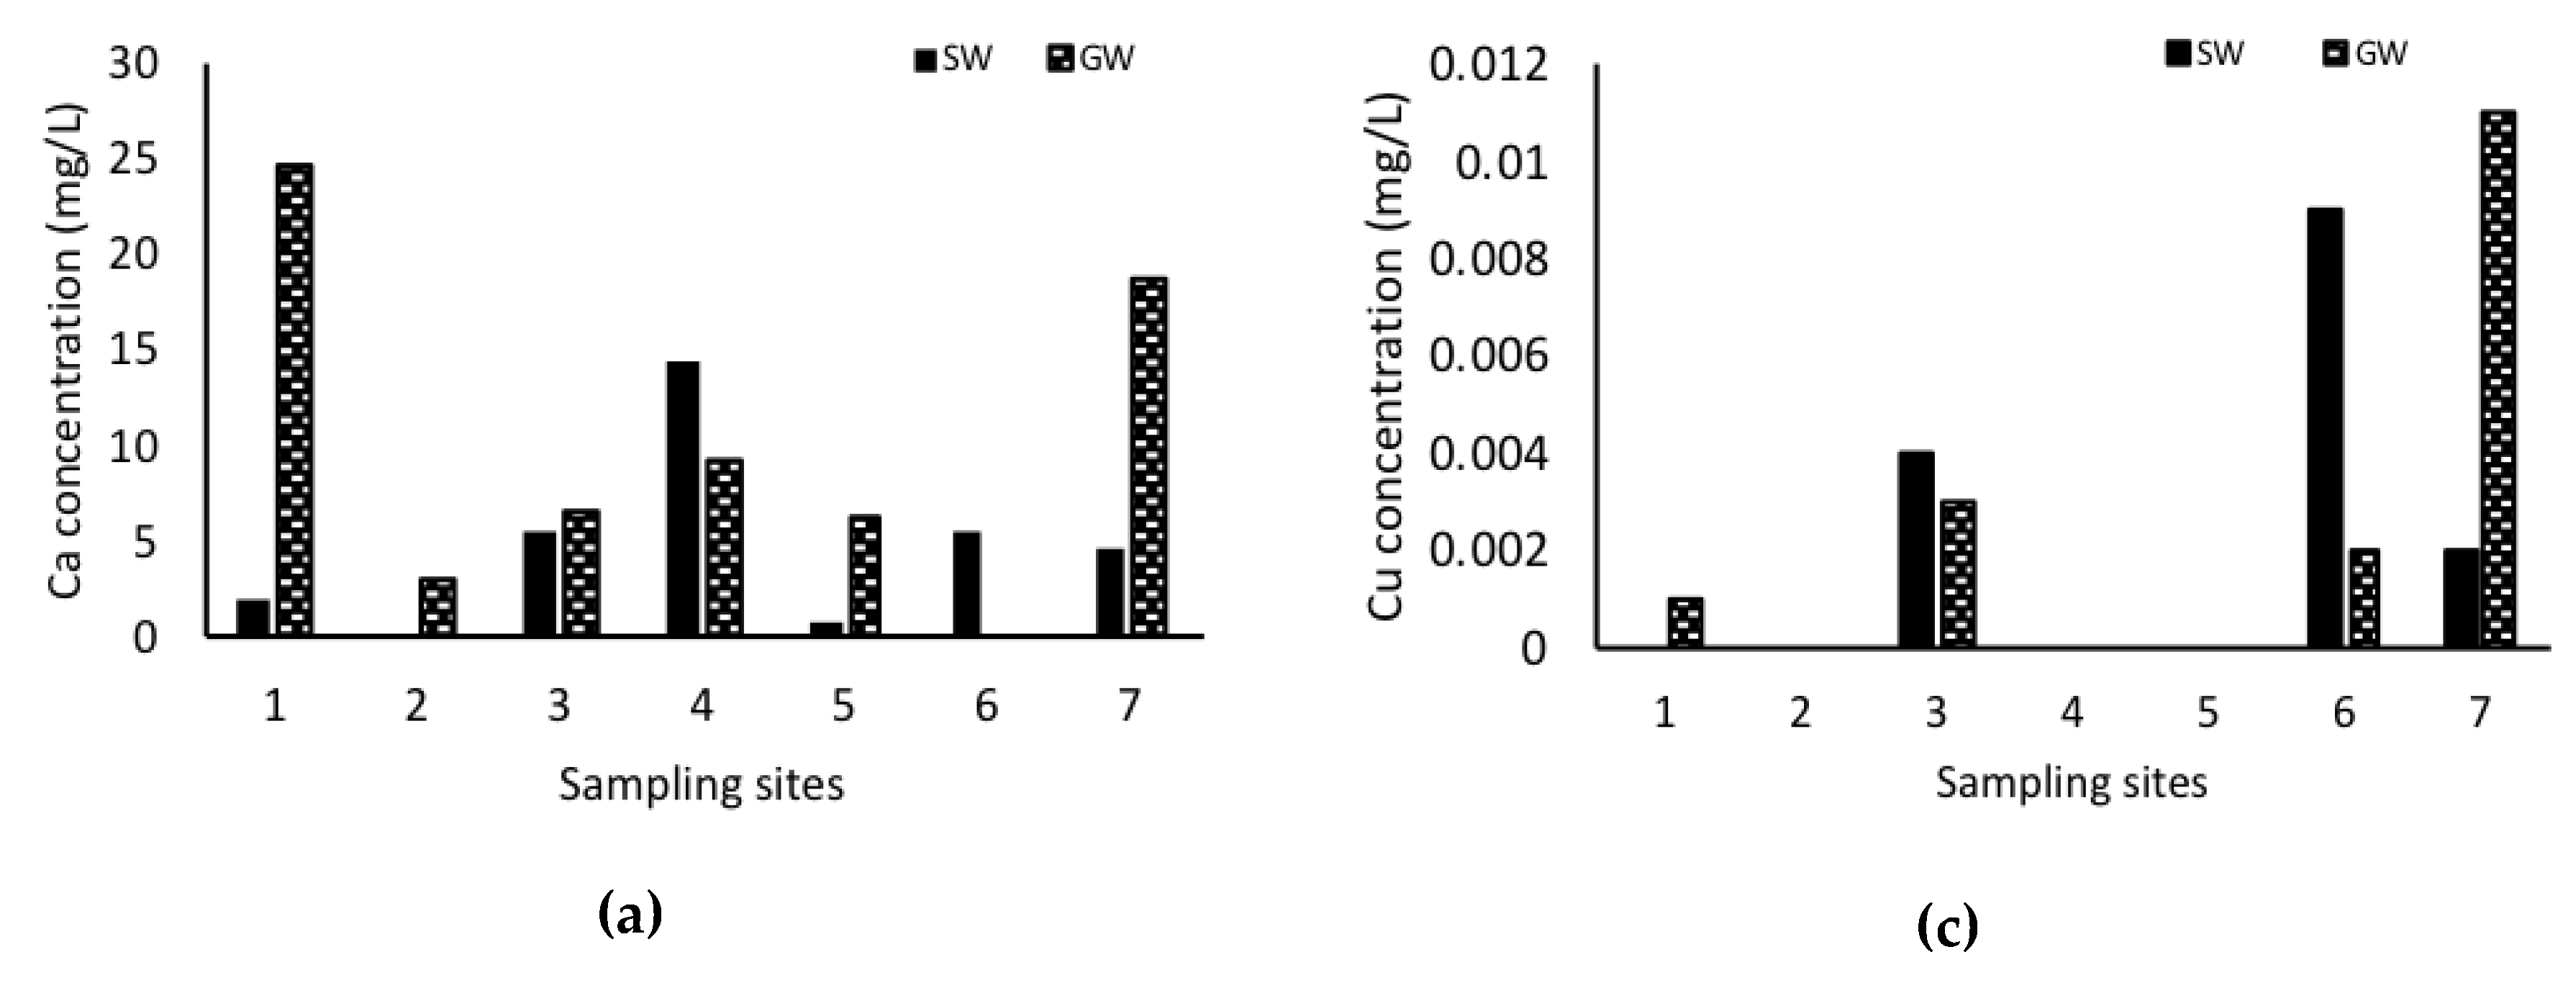
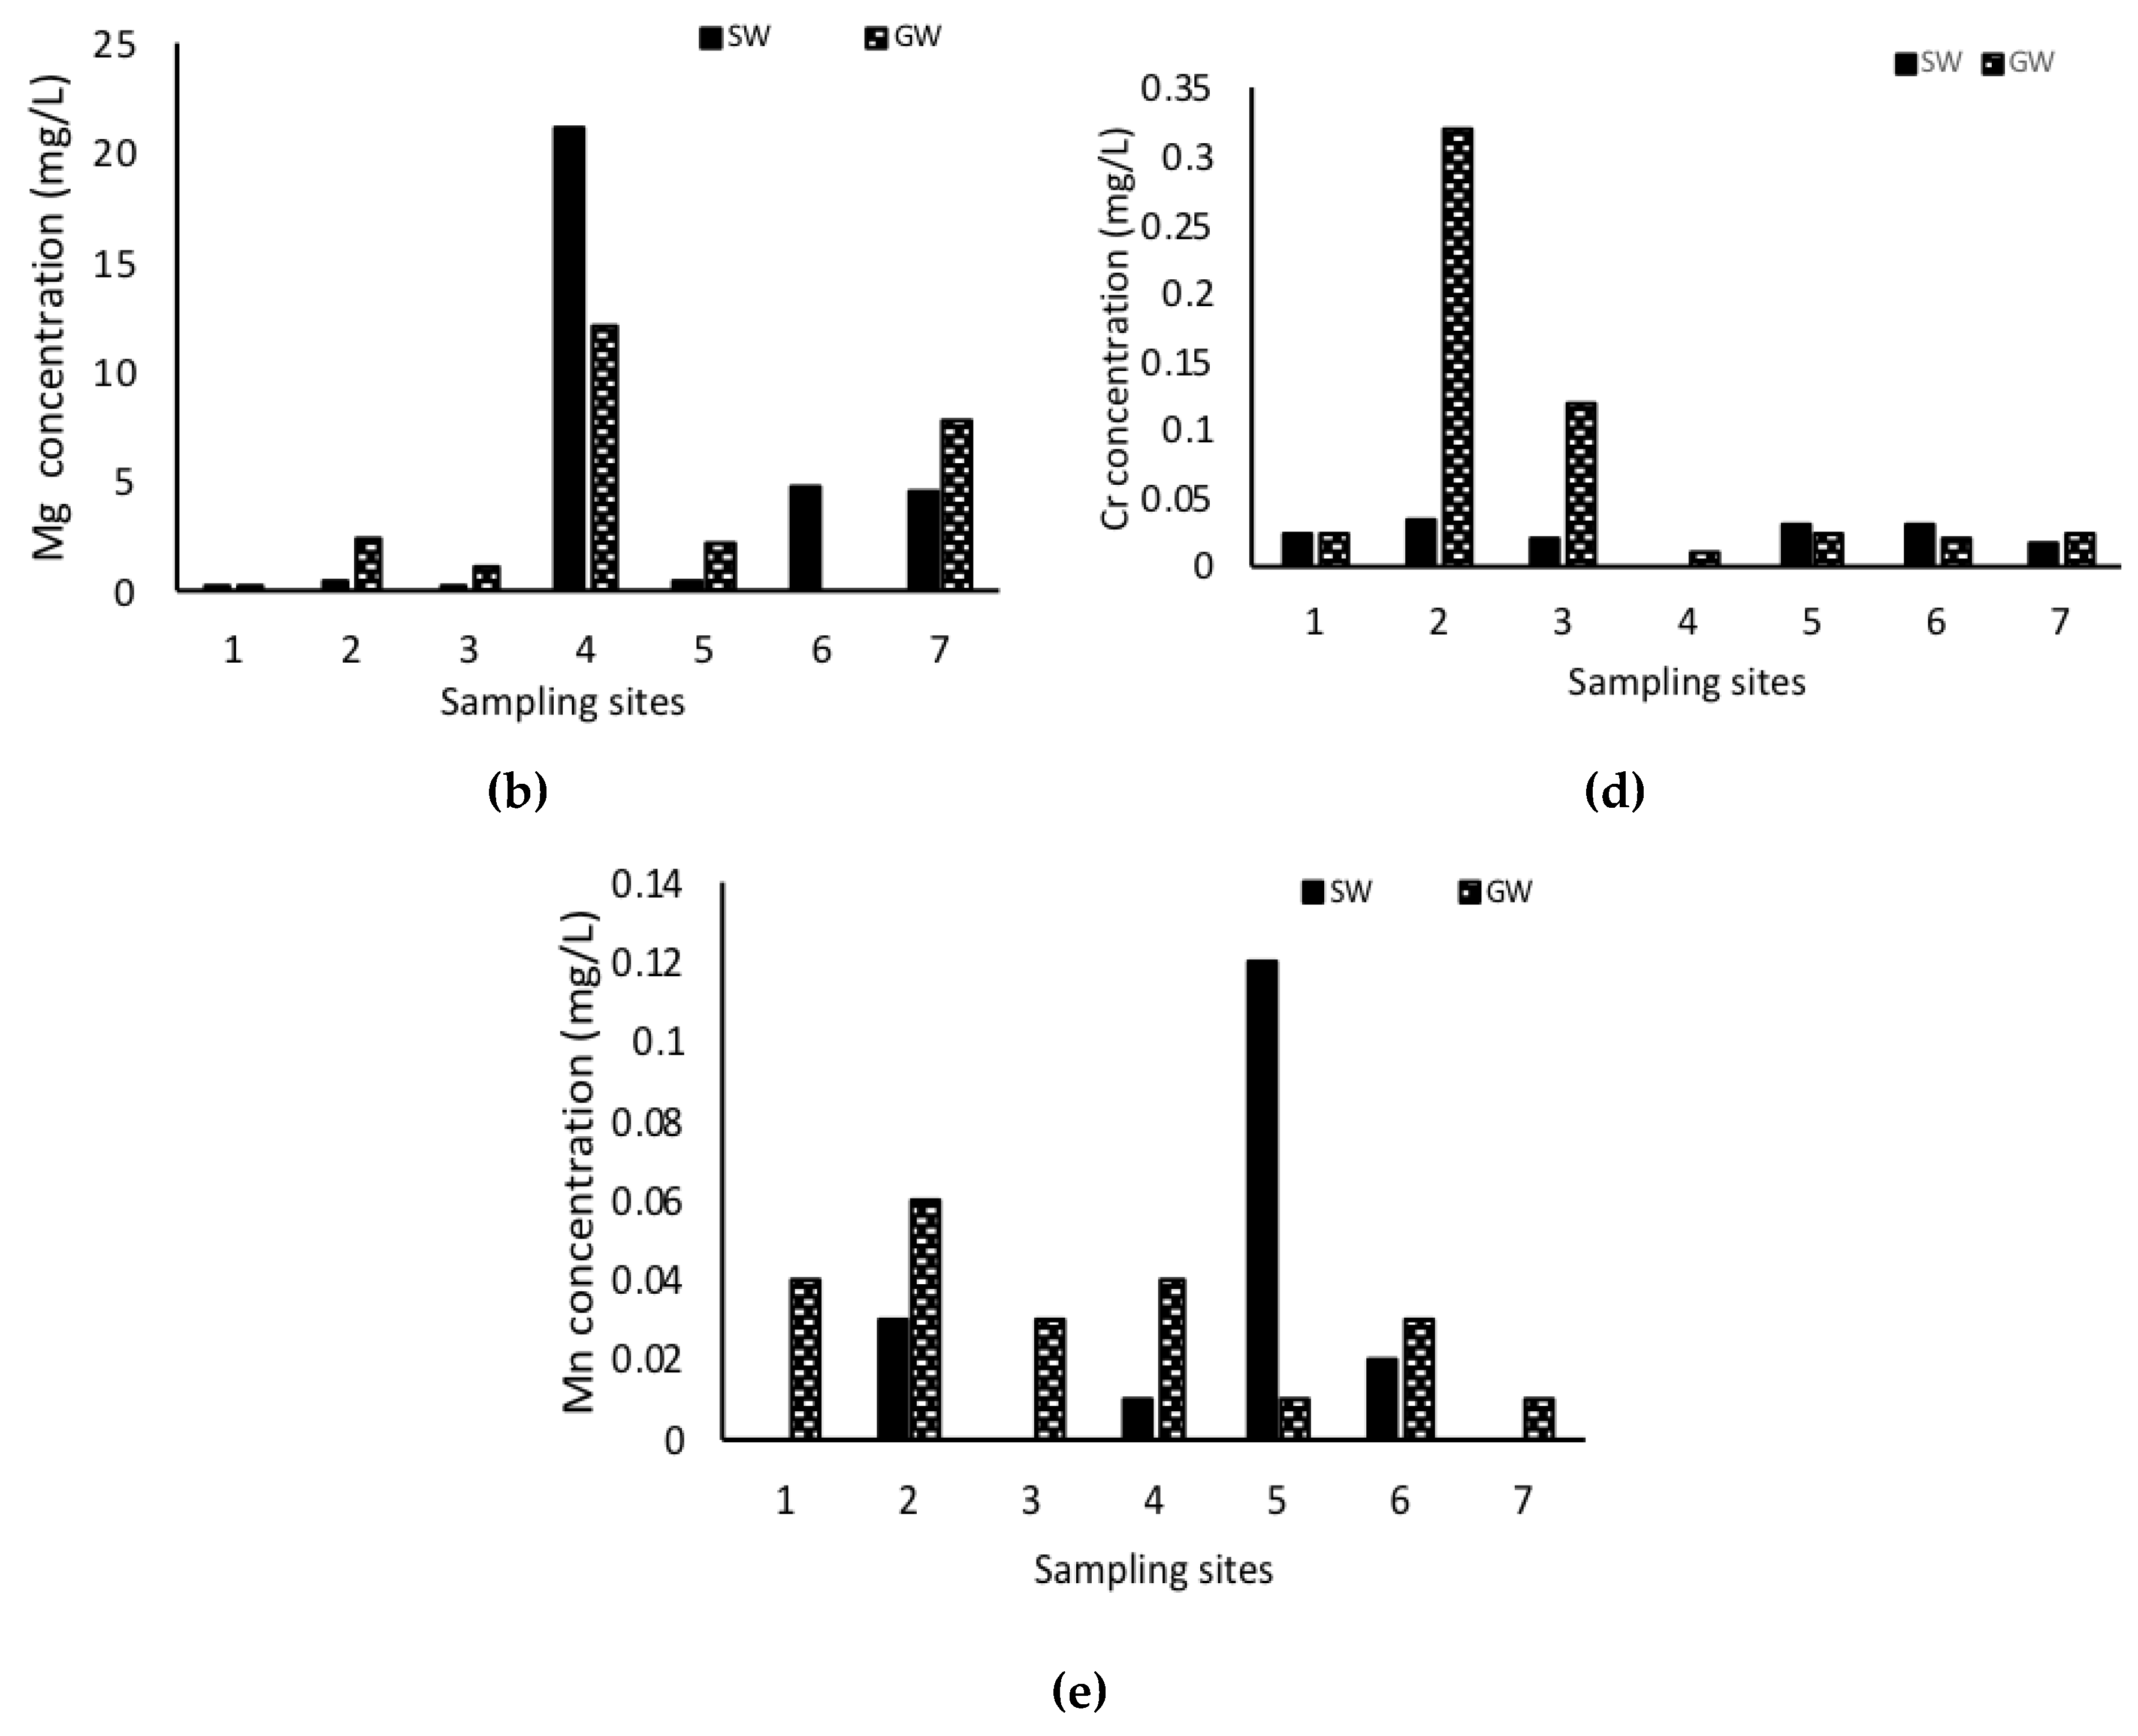
The concentration of Pb in the surface water sources were below the detection limit (bdl). However, for the groundwater samples, Pb ranged from bdl-0.03 mg/L. Ca varied between 0.19–14.47 mg/L and bdl-24.49 mg/L in surface and groundwater, respectively (Figure 3). Similarly, the Mg values ranged from 0.28–21.20 mg/L and bdl-12.06 mg/L in surface and groundwater. Low levels of copper were determined in both types of water with the highest value of 0.01 mg/L. Higher levels of Cr were determined in groundwater samples (0.01–0.32 mg/L) than in surface water samples (bdl-0.03 mg/L). Moderate levels of Mn were determined in both water types, ranging from bdl to 0.12 mg/L.

4. Discussion

Results from the microbiological analysis of the various water samples indicate the presence of bacteria in all the samples except for the control sample (de-ionized water) and one of the tap waters supplied to the community. Although the presence of E. coli in the treated water is unexpected, several reports in the literature have shown that inadequate treatment of potable water exists in developing countries [1,19]. The reason for this can be partly due to the lack of the adequate dosage of water disinfectants (such as chlorine tablet or chlorine gas) or the failure of the water treatment process in the facility. The presence of faecal coliform and E. coli in all the water sources except in tap water indicate that they are not fit for human consumption without prior adequate treatment. Several health risks have been associated with the consumption of faecal contaminated water and this problem is exacerbated in children under the age of 5 and immuno-compromised adults [1,3,5]. Waterborne diseases such as cholera and diarrhoea, dysentery, hepatitis A, typhoid, and polio amongst others are the leading causes of underage death [5,38,39].
All the physicochemical parameters that were investigated complied with the WHO [40] drinking water standards. Although the WHO guideline did not have values for some of the parameters studied like the total CO2 and temperature. All the metals investigated complied with the regulatory guideline except for groundwater samples GW2 and GW3 which had concentrations of Cr higher than the regulatory standard of WHO (0.05 mg/L). The levels of Ca, Mg, and Cu in both SW and GW complied with the WHO standards for all the sites. Pb was not determined in the surface and tap water samples under the experiment condition. The permissible limit of 0.01 mg/L was only exceeded at GW2. Sampling site GW2 tends to have higher levels of heavy metals compared to other sites. This could possibly be due to land excavation and mining activities around this site.
The WQI based on the physicochemical parameters ranked most of the water as excellent water except for GW2 and GW3, which were ranked poor and good water, respectively. This implies that the use of other sources of water for domestic and irrigational purposes should pose no health risk to the consumers. However, the results from the microbial analysis showed that only SW3, which is tap water, did not test positive for faecal coliform and E. coli, hence, it has excellent quality. This further strengthens the argument that microbial parameters should be included in water quality indices. Presenting the WQI with only the chemical parameters—as this is the case in most scholarly publications—can be misleading and can defeat the aim of using the water quality index in order to provide a comprehensive status of the water quality of water sources to policymakers and concerned citizens.
Similar findings have been reported in several parts of the world with most chemical parameters complying with the parameters, but not with the microbial parameters in both surface and ground water [1,3,5]. It is recommended that WQI based on the microbial water quality parameter should be developed and tested because the microbial contamination of drinking water is the most critical parameter in many places of the world which poses the highest health risk to the public.

5. Conclusions

All of the water samples tested positive for faecal indicator organisms and E. coli except one of the tap water (SW3). Most of the physicochemical water quality parameters complied with the WHO regulatory standard for drinking water. Based on the physicochemical results, 86% of the samples is regarded as excellent water. The inclusion of microbiological parameter data to WQI revealed that only 7% of the samples analysed can be regarded as excellent water. Therefore, the inclusion of microbiological water quality parameter is paramount to have a comprehensive unbiased form of data.

Author Contributions

S.O.O. conducted the study, S.O.O., N.O.O., B.A. and J.N.E. conceptualize the manuscript and contributed immensely to the writing of the draft and final manuscript.

Funding

This research received no external funding.

Conflicts of Interest

The authors declare no conflict of interest.

References

  1. Edokpayi, J.N.; Rogawski, E.T.; Kahler, D.M.; Hill, C.L.; Reynolds, C.; Nyathi, E.; Smith, J.A.; Odiyo, J.O.; Samie, A.; Bessong, P.; et al. Challenges to Sustainable Safe Drinking Water: A Case Study of Water Quality and Use across Seasons in Rural Communities in Limpopo Province, South Africa. Water 2018, 10, 159. [Google Scholar] [CrossRef]
  2. Hunter, P.R.; MacDonald, A.M.; Carter, R.C. Water Supply and Health. PLoS Med. 2010, 7, e1000361. [Google Scholar] [CrossRef]
  3. Edokpayi, J.N.; Odiyo, J.O.; Popoola, E.O.; Msagati, T.M. Evaluation of Microbiological and Physicochemical Parameters of Alternative Source of Drinking Water: A Case Study of Nzhelele River, South Africa. Open Microbiol. J. 2018, 12, 18. [Google Scholar] [CrossRef]
  4. Ding, Z.; Zhai, Y.; Wu, C.; Wu, H.; Lu, Q.; Lin, J.; He, F. Infectious diarrheal disease caused by contaminated well water in Chinese schools: A systematic review and meta-analysis. J. Epidemiol. 2017, 27, 274–281. [Google Scholar] [CrossRef]
  5. Diouf, K.; Tabatabai, P.; Rudolph, J.; Marx, M. Diarrhoea prevalence in children under five years of age in rural Burundi: An assessment of social and behavioural factors at the household level. Glob. Health Action 2014, 7, 24895. [Google Scholar] [CrossRef]
  6. Edokpayi, J.N.; Enitan, A.M.; Mutileni, N.; Odiyo, J.O. Evaluation of water quality and human risk assessment due to heavy metals in groundwater around Muledane area of Vhembe District, Limpopo Province, South Africa. Chem. Cent. J. 2018, 12, 2. [Google Scholar] [CrossRef]
  7. Edokpayi, J.N.; Odiyo, J.O.; Durowoju, O.S. Impact of wastewater on surface water quality in developing countries: A case study of South Africa. In Water Quality, Chapter: 18; Hlanganani, T., Ed.; IntechOpen: London, UK, 2017; pp. 401–416. [Google Scholar] [CrossRef]
  8. Odiyo, J.O.; Makungo, R. Chemical and Microbial Quality of Groundwater in Siloam Village, Implications to Human Health and Sources of Contamination. Int. J. Environ. Res. Public Health 2018, 15, 317. [Google Scholar] [CrossRef]
  9. Durowoju, O.S.; Odiyo, J.O.; Ekosse, G.E. Horizontal variation in trace elements and soil characteristics at Siloam and Tshipise geothermal springs, Limpopo Province, South Africa. Water SA 2016, 42, 694–702. [Google Scholar] [CrossRef]
  10. Raessler, M. The Arsenic Contamination of Drinking and Groundwaters in Bangladesh: Featuring Biogeochemical Aspects and Implications on Public Health. Arch. Environ. Contam. Toxicol. 2018, 75, 1–7. [Google Scholar] [CrossRef]
  11. Bai, L.; Wang, Y.; Guo, Y.; Zhou, Y.; Liu, L.; Yan, Z.; Li, F.; Xie, X. Health Risk Assessment Research on Heavy Metals Ingestion Through Groundwater Drinking Pathway for the Residents in Baotou, China. J. Environ. Health 2016, 78, 84–90. [Google Scholar]
  12. Quintana, G.C.; Mirlean, N. Groundwater Contamination by Mercury from the Aforetime Carroting Practice. Bull. Environ. Contam. Toxicol. 2018, 100, 839–842. [Google Scholar] [CrossRef]
  13. Navarro, A.; Font, X.; Viladevall, M. Groundwater Contamination by Uranium and Mercury at the Ridaura Aquifer (Girona, NE Spain). Toxics 2016, 4, 16. [Google Scholar] [CrossRef]
  14. An, X.; Cheng, Y.; Huang, M.; Sun, Y.; Wang, H.; Chen, X.; Wang, J.; Li, D.; Li, C. Treating organic cyanide-containing groundwater by immobilization of a nitrile-degrading bacterium with a biofilm-forming bacterium using fluidized bed reactors. Environ. Pollut. 2018, 237, 908–916. [Google Scholar] [CrossRef]
  15. Hynds, P.D.; Thomas, M.K.; Pintar, K.D.M. Contamination of Groundwater Systems in the US and Canada by Enteric Pathogens, 1990–2013: A Review and Pooled-Analysis. PLoS ONE 2014, 9, 93301. [Google Scholar] [CrossRef]
  16. Wallender, E.K.; Ailes, E.C.; Yoder, J.S.; Roberts, V.A.; Brunkard, J.M. Contributing factors to disease outbreaks associated with untreated groundwater. Groundwater 2014, 52, 886–897. [Google Scholar] [CrossRef]
  17. Hynds, P.D.; Misstear, B.D.; Gill, L.W. Development of a microbial contamination susceptibility model for private domestic groundwater sources. Water Resour. Res. 2012, 48. [Google Scholar] [CrossRef]
  18. Odiyo, J.O.; Chimuka, L.; Mamali, M.A.; Fatoki, O.S. Trophic status of Vondo and Albasini Dams; impacts on aquatic ecosystems and drinking water. Int. J. Environ. Sci. Technol. 2012, 9, 203–211. [Google Scholar] [CrossRef]
  19. Bessong, P.O.; Odiyo, J.O.; Musekene, J.N.; Tessema, A. Spatial Distribution of Diarrhoea and Microbial Quality of Domestic Water during an Outbreak of Diarrhoea in the Tshikuwi Community in Venda, South Africa. J. Health Popul. Nutr. 2009, 27, 652–659. [Google Scholar] [CrossRef]
  20. Obi, C.L.; Potgieter, N.; Bessong, P.O.; Matsaung, G. Assessment of the microbial quality of river water sources in rural Venda communities in South Africa. Water SA 2002, 28, 287–292. [Google Scholar] [CrossRef]
  21. Wanda, E.M.; Mamba, B.B.; Msagati, T.A. Determination of the water quality index ratings of water in the Mpumalanga and North West provinces, South Africa. Phys. Chem. Earth 2015, 92, 70–79. [Google Scholar] [CrossRef]
  22. Timmerman, J.G.; Beinat, E.; Termeer, K.; Cofino, W. Analyzing the data-rich but-information-poor syndrome in Dutch water management in historical perspective. Environ. Manag. 2010, 45, 1231–1242. [Google Scholar] [CrossRef]
  23. Boyacioglu, H. Development of a water quality index based on a European classification scheme. Water SA 2007, 33, 101–106. [Google Scholar] [CrossRef]
  24. Singaraja, C. Relevance of water quality index for groundwater quality evaluation: Thoothukudi District, Tamil Nadu, India. Appl. Water Sci. 2014, 7, 2157–2173. [Google Scholar] [CrossRef]
  25. Reza, R.; Singh, G. Heavy metal contamination and its indexing approach for river water. Int. J. Environ. Sci. Technol. 2010, 7, 785–792. [Google Scholar] [CrossRef]
  26. Rabeiy, R.E. Assessment and modeling of groundwater quality using WQI and GIS in Upper Egypt area. Environ. Sci. Pollut. Res. 2017. [Google Scholar] [CrossRef]
  27. Ramya Priya, R.; Elango, L. Evaluation of geogenic and anthropogenic impacts on spatio-temporal variation in quality of surface water and groundwater along Cauvery River, India. Environ. Earth Sci. 2018, 77. [Google Scholar] [CrossRef]
  28. Wu, Z.; Wang, X.; Chen, Y.; Cai, Y.; Deng, J. Assessing river water quality using water quality index in Lake Taihu Basin, China. Sci. Total Environ. 2018, 612, 914–922. [Google Scholar] [CrossRef]
  29. Sutadian, A.D.; Muttil, N.; Yilmaz, A.G.; Perera, B.J.C. Development of a water quality index for rivers in West Java Province, Indonesia. Ecol. Indic. 2018, 85, 966–982. [Google Scholar] [CrossRef]
  30. APHA (American Public Health Association). Standard Methods for Examination of Water and Waste Water, 19th ed.; American Public Health Association: Washington, DC, USA, 1995; p. 1467. [Google Scholar]
  31. WHO. Guidelines for Drinking Water Quality: Training Pack; WHO: Geneva, Switzerland, 2011. [Google Scholar]
  32. Rao, G.S.; Nageswararao, G. Assessment of Groundwater quality using Water Quality Index. Arch. Environ. Sci. 2013, 7, 1–5. [Google Scholar]
  33. Sharma, P.; Meher, P.K.; Kumar, A.; Gautam, Y.P.; Mishra, K.P. Changes in water quality index of Ganges river at different locations in Allahabad. Sustain. Water Quak. Ecol. 2014, 3–4, 67–76. [Google Scholar] [CrossRef]
  34. Kawo, N.S.; Karuppannan, S. Groundwater quality assessment using water quality index and GIS technique in Modjo River Basin, central Ethiopia. J. Afr. Earth Sci. 2018, 147, 300–311. [Google Scholar] [CrossRef]
  35. Chourasia, L.P. Assessment of Groundwater Quality Using Water Quality Index in and Around Korba City, Chhattisgarh, India. Am. J. Softw. Eng. Appl. 2018, 7, 15–21. [Google Scholar] [CrossRef]
  36. Singh, S.; Hussian, A. Water quality index development for groundwater quality assessment of Greater Noida sub-basin, Uttar Pradesh, India. Cogent. Eng. 2016, 3, 1177155. [Google Scholar] [CrossRef]
  37. Packiyam, R.; Subha Pachaiyappan, S.; Narayanan, U. Effect of Storage Containers on Coliforms in Household Drinking Water. Int. J. Curr. Microbiol. Appl. Sci. 2016, 5, 461–477. [Google Scholar] [CrossRef]
  38. Ezeh, O.K.; Agho, K.E.; Dibley, M.J.; Hall, J.; Page, A.N. The Impact of Water and Sanitation on Childhood Mortality in Nigeria: Evidence from Demographic and Health Surveys, 2003–2013. Int. J. Environ. Res. Public Health 2014, 11, 9256–9272. [Google Scholar] [CrossRef]
  39. Allam, R.R.; Uthappa, C.K.; Nalini, C.; Udaragudi, P.R.; Tadi, G.P.; Murhekar, M.V. An Outbreak of Cholera due to Contaminated Water, Medak District, Andhra Pradesh, India, 2013. Indian J. Community Med. Off. Publ. Indian Assoc. Prev. Soc. Med. 2015, 40, 283–285. [Google Scholar]
  40. World Health Organization (WHO). Guidelines for Drinking-Water Quality, 4th ed.; WHO: Geneva, Switzerland, 2011. [Google Scholar]
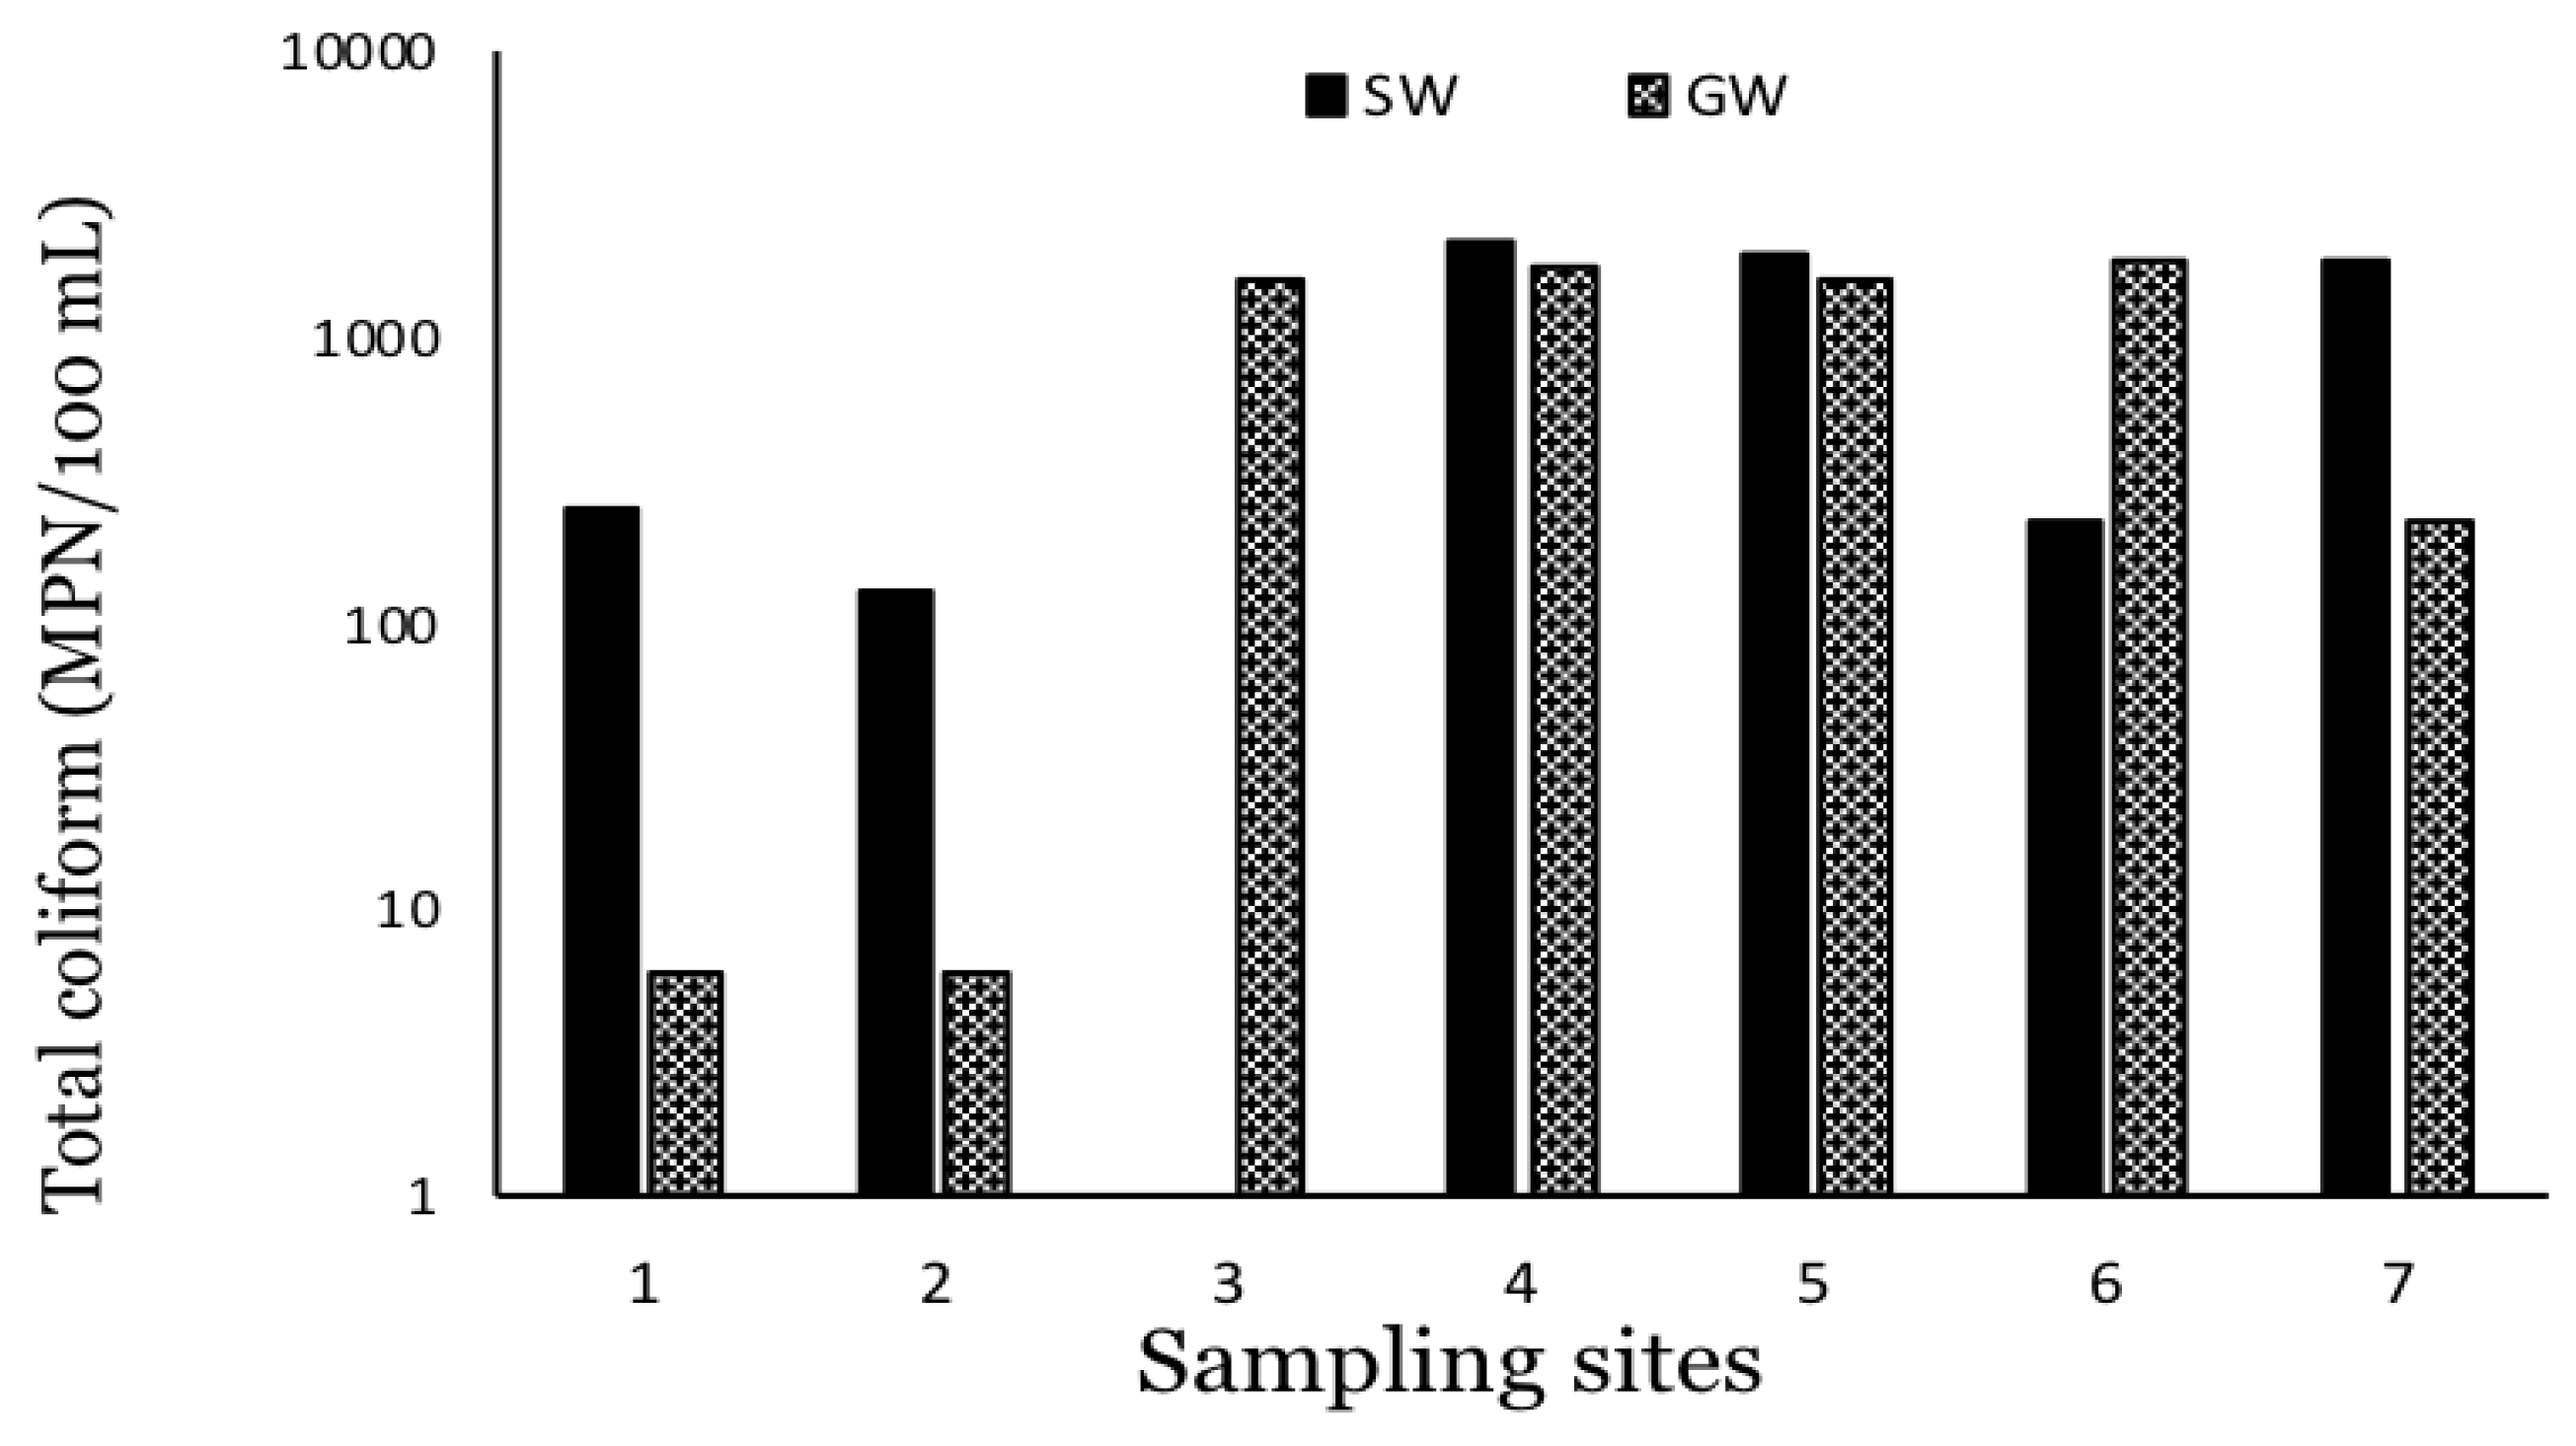
Figure 1. The total coliform determination of the water sources.
Environments 06 00023 g001
Figure 2. The pH (a), chloride concentration (b), temperature (c), total CO2 (d), acidity (e) and total alkalinity (f), of the samples from the various sampling sites.
Environments 06 00023 g002aEnvironments 06 00023 g002b
Figure 3. The levels of Ca (a), Mg (b), Cu (c), Cr (d) and Mn (e) determined in the ground water (GW) and surface water (SW) sources in the study area. Empty bars represent the results that were below the detection limit.
Environments 06 00023 g003aEnvironments 06 00023 g003b
Table 1. The assigned reported weight for water quality parameters in this study.
ParametersAssigned Weight
pH444ND4
Ca22232
Mg22232
MnNDNDND55
Cl331.051
CrNDNDND55
CuNDNDNDND4
ReferenceRao and Nageswararao [32]Shamar et al [33]Kawo and Karuppannan [34]Chourasia [35]This study
Where ND is a parameter that was not determined in a particular study.
Table 2. The relative weight of chemical parameters.
ParameterWHO Standard [31]Weight (wi)Relative Weight (Wi)
pH6–8.540.1739
Ca2+7520.0870
Mn2+0.450.2174
Mg2+5020.0870
Cu2+240.1739
Cr0.0550.2174
Cl25010.0435
w i = 23 W i = 1
Table 3. The water quality classification based on the water quality index (WQI) value Singh and Hussian [36].
WQI RangeWater Quality
<50Excellent water
50–100Good water
100–200Poor water
200–300Very poor water
>300Water unsuitable for drinking purpose
Table 4. The faecal coliform and E. coli detection in the Samples.
Sample CodeSW1SW2SW3SW4SW5SW6SW7GW1GW2GW3GW4GW5GW6GW7Control
Faecal coliform++-+++++++++++-
E. coli++-+++++++++++-
Where SW represent surface water sources with the exception of SW1&SW3 which represents tap water. GW represent groundwater sources and “+” indicate the presence of faecal coliform and E. coli while “-“: the absence of both organisms.
Table 5. The details of the water quality status of each water source.
Sampling Site W Q I = S I i Water Quality
SW127.44Excellent water
SW230.96Excellent water
SW325.28Excellent water
SW422.36Excellent water
SW533.59Excellent water
SW629.58Excellent water
SW723.34Excellent water
GW133.56Excellent water
GW2157.94Poor water
GW369.29Good water
GW426.43Excellent water
GW526.26Excellent water
GW626.73Excellent water
GW729.99Excellent water