1. Introduction
Recently, Hybrid Renewable Energy Systems (HRES) have gained reputable popularity, and garnered momentum among research studies for modelling, simulation, and optimization. This is a system which combines two or more renewable and/or non-renewable energy sources. The main drivers of a HRES are costs associated with conventional/traditional energy systems, reduction of emissions, negative impact on health and environment and optimization of systems [
1,
2]. The current global deviation from fossilized remains of dead plants and animals (which are considered non-renewable resources) formed over extensive heat and pressure formation on the earth over millions of years [
3] to renewable resources has further enhanced research in this area. The use of fossil fuel is widespread in South Africa, for electrification, cooking, daily living and practical uses and its emission of toxic gases into the atmosphere accounts for global warming issues and challenges. The key contributing factor of the HRES is deviation from overexertion of fossil fuel sources and its negative impact to the environment, in relation to the financial costs, commitments and access associated with it. The burden of costs of installation of large energy plants and equipment is reduced (which is often borne by the government on a macro level) and passed on to a lower-cost alternative solutions using renewable resources [
4]. The overall system reliability and performance levels is higher for areas with an abundance of solar irradiation, HRES and resources [
5].
The HRES also have the potential for energy balancing of systems, stability, and reliability for areas with little or no access to electricity, with the design and modelling of the HRES unique to each case study. Ongoing research and investigation persists in improving its efficiency, performance, and integration with renewable energy sources such as solar, wind and other renewable energy technologies. However, the design is usually aimed at solving an optimization problem. An exact one-size-fits-all solution is not realistic, due to the number of dynamic variables, complexities, and non-linearity in performance of systems. Therefore, the defining terms for optimal solution in a case study vary as a function of energy balance and management, support of existing infrastructure, optimal sizing of system and component parts, control strategies, and so on as stipulated by location and researcher [
3,
6,
7]. The process of achieving optimal conditions, through operation and component part selection, can be determined through multiple techniques. There is a numerical algorithm-based technique for unit sizing and cost analysis, an algorithm-based energy technique to size the photovoltaic (PV) elements, a software modelling technique, a linear programming technique, a probability technique, an iterative technique, analytical model, dynamic technique, and multi-objective genetic algorithm technique, etc. [
2,
4,
8,
9,
10,
11].
In the development of the HRES using wind and solar PV, the state of design, operation, control requirement, performance analysis of demonstration systems and development of efficient power converters was examined, and it was observed that the total life costs were significantly reduced. The combination of energy sources proved to be a more reliable source of electricity supply and this reduced the battery bank and diesel requirements all together [
10]. In another study of the HRES, the design process was leveraged using different component parts for minimizing lifecycle costs, and a criteria selection was determined to produce a combination of trade-off between reliability, costs, and minimum use of diesel generator sets [
6,
7,
8,
12,
13,
14,
15,
16]. The optimal combination point was determined at a unit cost of Rs. 6.5/kWh for the case area where the micro-wind-hydro system was found to be the optimal combination for electricity. This maintains a 100% renewable energy source while eliminating the diesel generator [
17].
The feasibility analysis of a wind-hydrogen system for Grimsey Island to generate electricity for the location is examined for optimal system solution in another three scenarios: design analysis of wind-diesel, wind-diesel-hydrogen and wind-hydrogen systems. The overall result suggests the order of installation of scenarios in succession from a wind-diesel system, to a wind-hydrogen-diesel system and then a wind-hydrogen system, with that hierarchy [
18,
19]. It is observed that in a 20-year period, the system running costs were significantly reduced, although not without substantial investments at the onset. From a practicality standpoint, the wind-hydrogen-diesel system had the lowest operational cost from the configuration design of the three scenarios [
20]; also, speculation on changes in oil price and costs of renewable technology is cited as a major determinant for the future direction of renewables systems, progressively or otherwise. The roadmap of the study highlights the practical application of the system to real-life situations, with the result of achieving 100% renewable electricity less likely, for now, due to other contending factors examined simultaneously within the system design. In multiple studies of the techno-economic feasibility of hybrid systems, optimizations techniques and modelling, the most viable option is predetermined by examining and evaluating the potential of available energy sources to location. The specific details of the results are not mentioned here but overall the result indicates strong potential for renewable energy production especially—from solar energy for electrification to wind power for hydrogen production [
21,
22,
23,
24,
25].
The slow adoption of the HRES has been attributed to its high costs [
26]; it is essential to select the appropriate system size in a techno-economic analysis to determine the costs associated with this.
Though the HRES is considered a more sustainable option to fossil fuel resources as it has less negative environmental impact and greater reductions of global warming. The HRES is also considered very challenging in its design, especially for PV, wind, diesel generators and energy storage systems due to many variable factors and much uncertainty [
11,
27]. The renewable resources are argued to be unpredictable in some areas in relation to its intensity and energy-generating component, such as sunshine and wind speed and wind direction; the major concern lies within its ability to satisfy demand which is often cushioned with energy storage units as backup.
Despite the measures taken to ensure accuracy, this unpredictability makes it necessary to run a feasibility and performance design for each case area. In the optimization of PV/Wind/Diesel Generator and energy storage units, the first step was a design to optimize all the component parts to achieve minimum costs while satisfying energy demand [
11]; it manages the customer demand side response for energy demand effectively and efficiently, as it often requires an estimation of the HRES when compared to the standalone traditional energy systems to further ensure its cost effectiveness. This is the case for Barwani, India where the stability and cost effectiveness of the PV/Wind/Biomass hybrid solution was achieved through a practical application of system where the control strategy, techno-economic analysis and social effects were considered [
28].
In the optimization of PV-biomass-diesel and grid base hybrid energy systems for rural electrification using HOMER Pro Software tool developed by the National Renewable Energy Laboratory (NREL), Golden, CO, USA, this study examined the economic impact of a decentralized renewable energy base system with no grid extension for Jhawani village, Tezpur area, India. The design was optimized by configuring different load profiles, costs of energy at different peak loads, energy demand profile and grid availability [
29,
30]. The electricity costs depend on load factor, which has an inverse relationship between peak load/energy demand and cost of electricity generation. The comparison between grid extension and off-grid is a matter of economic perspective in decision-making. Overall, the hybrid energy system is a feasible reliable source, and the result shows the optimal scenario to be the biomass gasification system rather than a photovoltaic system. There is also an emphasis on the unforeseen challenges that may arise from practical application of proposed configurations. An analyzed performance rate of off-grid wind-PV-diesel-battery hybrid energy system was feasible for remote areas of Selangor, Malaysia. The system design considers a load size profile of 33 kWh/day and peak load of 3.9 kW, net present economic costs, available energy sources and size, and CO
2 emissions. The net present costs and CO
2 emission can be reduced by 29.65% and 16 tons per year in comparison to the conventional power plants; it can be applicable to areas with similar climatic conditions. It is environmentally and economically feasible in the long-run to replace the conventional plants with the renewable plants [
31].
2. Materials and Methods
The central energy source for this study is Solar PV, though there are different factors which determine the PV outcome such as solar irradiance level, intensity, optimization of PV, energy load, design spacing of PV cells, tilt, angle, etc. These factors must be considered as PV efficiency decreases with an increase in cell temperature and solar irradiance and areas of concentration [
18]. Detailed analysis and test conditions of various PV arrays was not considered in this study; a generic flat panel PV is used as configured within the HOMER Pro software (Version 3.11.1) developed by NREL, Golden, CO, USA. The functional operation can be further analyzed in a comparative assessment of the performance levels of solar PVs and other resources in a standalone system, for grid connection and HRES. The PV system as a standalone is time sensitive and seasonal unit which yields considerable output when the solar irradiance is highly intense and reliable, depending on the design of PV array. When the PV standalone system is compared with a stand-alone biomass energy system, the biomass system has a higher efficiency and lower costs in rural areas while the PV system decreases in its performance output with a significant difference in its levelized cost of energy (LCOE) for certain areas [
18,
32].
In the PV system for a grid-connected system, it reduces its dependence on a diesel generator and utilizes the power generated by saving energy in a storage unit. PV/diesel generator/battery is considered more economical more beneficial for electrification as seen in a study of northern Nigeria, [
31] but this is not the case for Gwakani village.
The provision of electricity and energy by the South African government prioritizes by demographics, geographical regions and areas of higher economic value which perpetuates trade, commerce, and industry [
33]. With the growing population of South Africa and interconnectedness of the global community at large, this makes the demand for electrification imminent. This is not only a major concern for cities and urban areas but also rural, local communities and small villages in South Africa which require energy resources and electrification for daily living. In a forecast projection of electrification for South Africa from 2014 to 2050 [
34], the supply and demand pattern from electrification and the driving forces are unique and particular to South Africa, part of which remains socio-cultural and socio-political. Despite the challenges, local communities are continuously embracing technological advancements and seeking alternative solutions. This is predominantly evident with the various users of HRES at household level [
35]. This framework designs the optimal functional and cost-beneficial system model for Gwakwani village, by estimating the energy demand and time constraints for optimality, costs incurred and overall benefits. The use of renewable resources, though beneficial in the long run, usually require an investigation into the framework for design and establishment. It is important to understand HRES scenario dynamics, reliability, expected outcomes, possibilities, and potential before fully investing into HRES. The flexibility it offers ensures for easier calibration of the system.
2.1. Data Collection
The collection of data is derived from primary and secondary sources—literature reviews and demographical distribution the case study. Data for renewable energy sources are retrieved from NASA, 2017 accessed within the NREL Database System in real time.
Gwakwani is a small rural village in the northern part of the Limpopo province in South Africa located on latitude 22°34.3′ S and longitude 30°48.2′ E. There are between 70 and 100 people living in the village and this is projected to decrease gradually due to socio-economic strain, and challenges with electricity and telecommunications as people migrate to urban settlements where their needs are met. There is very little information about this rural village; however, the relevant data collected via literature indicates the demand need for electrification to the village, particularly for sustenance. The data collection of solar energy availability potential energy requirement and cost assumptions were determined [
36,
37,
38].
2.1.1. Solar Radiation
Solar radiation data for specific location can be extracted by different means; for example, solar radiation can be obtained from metrological stations that are distributed across the country in question or it can also be extracted by transporting the latitude and longitude figures of the region into the NASA (2017) portal found on the website. The same steps are applied for calculating the PV watts as provided by the NREL, the U.S. Department of Energy, 2017 and the South African Weather Service, 2017. Solar radiation for the region of study are obtained from South Africa Meteorological Organization, 2010 [
39,
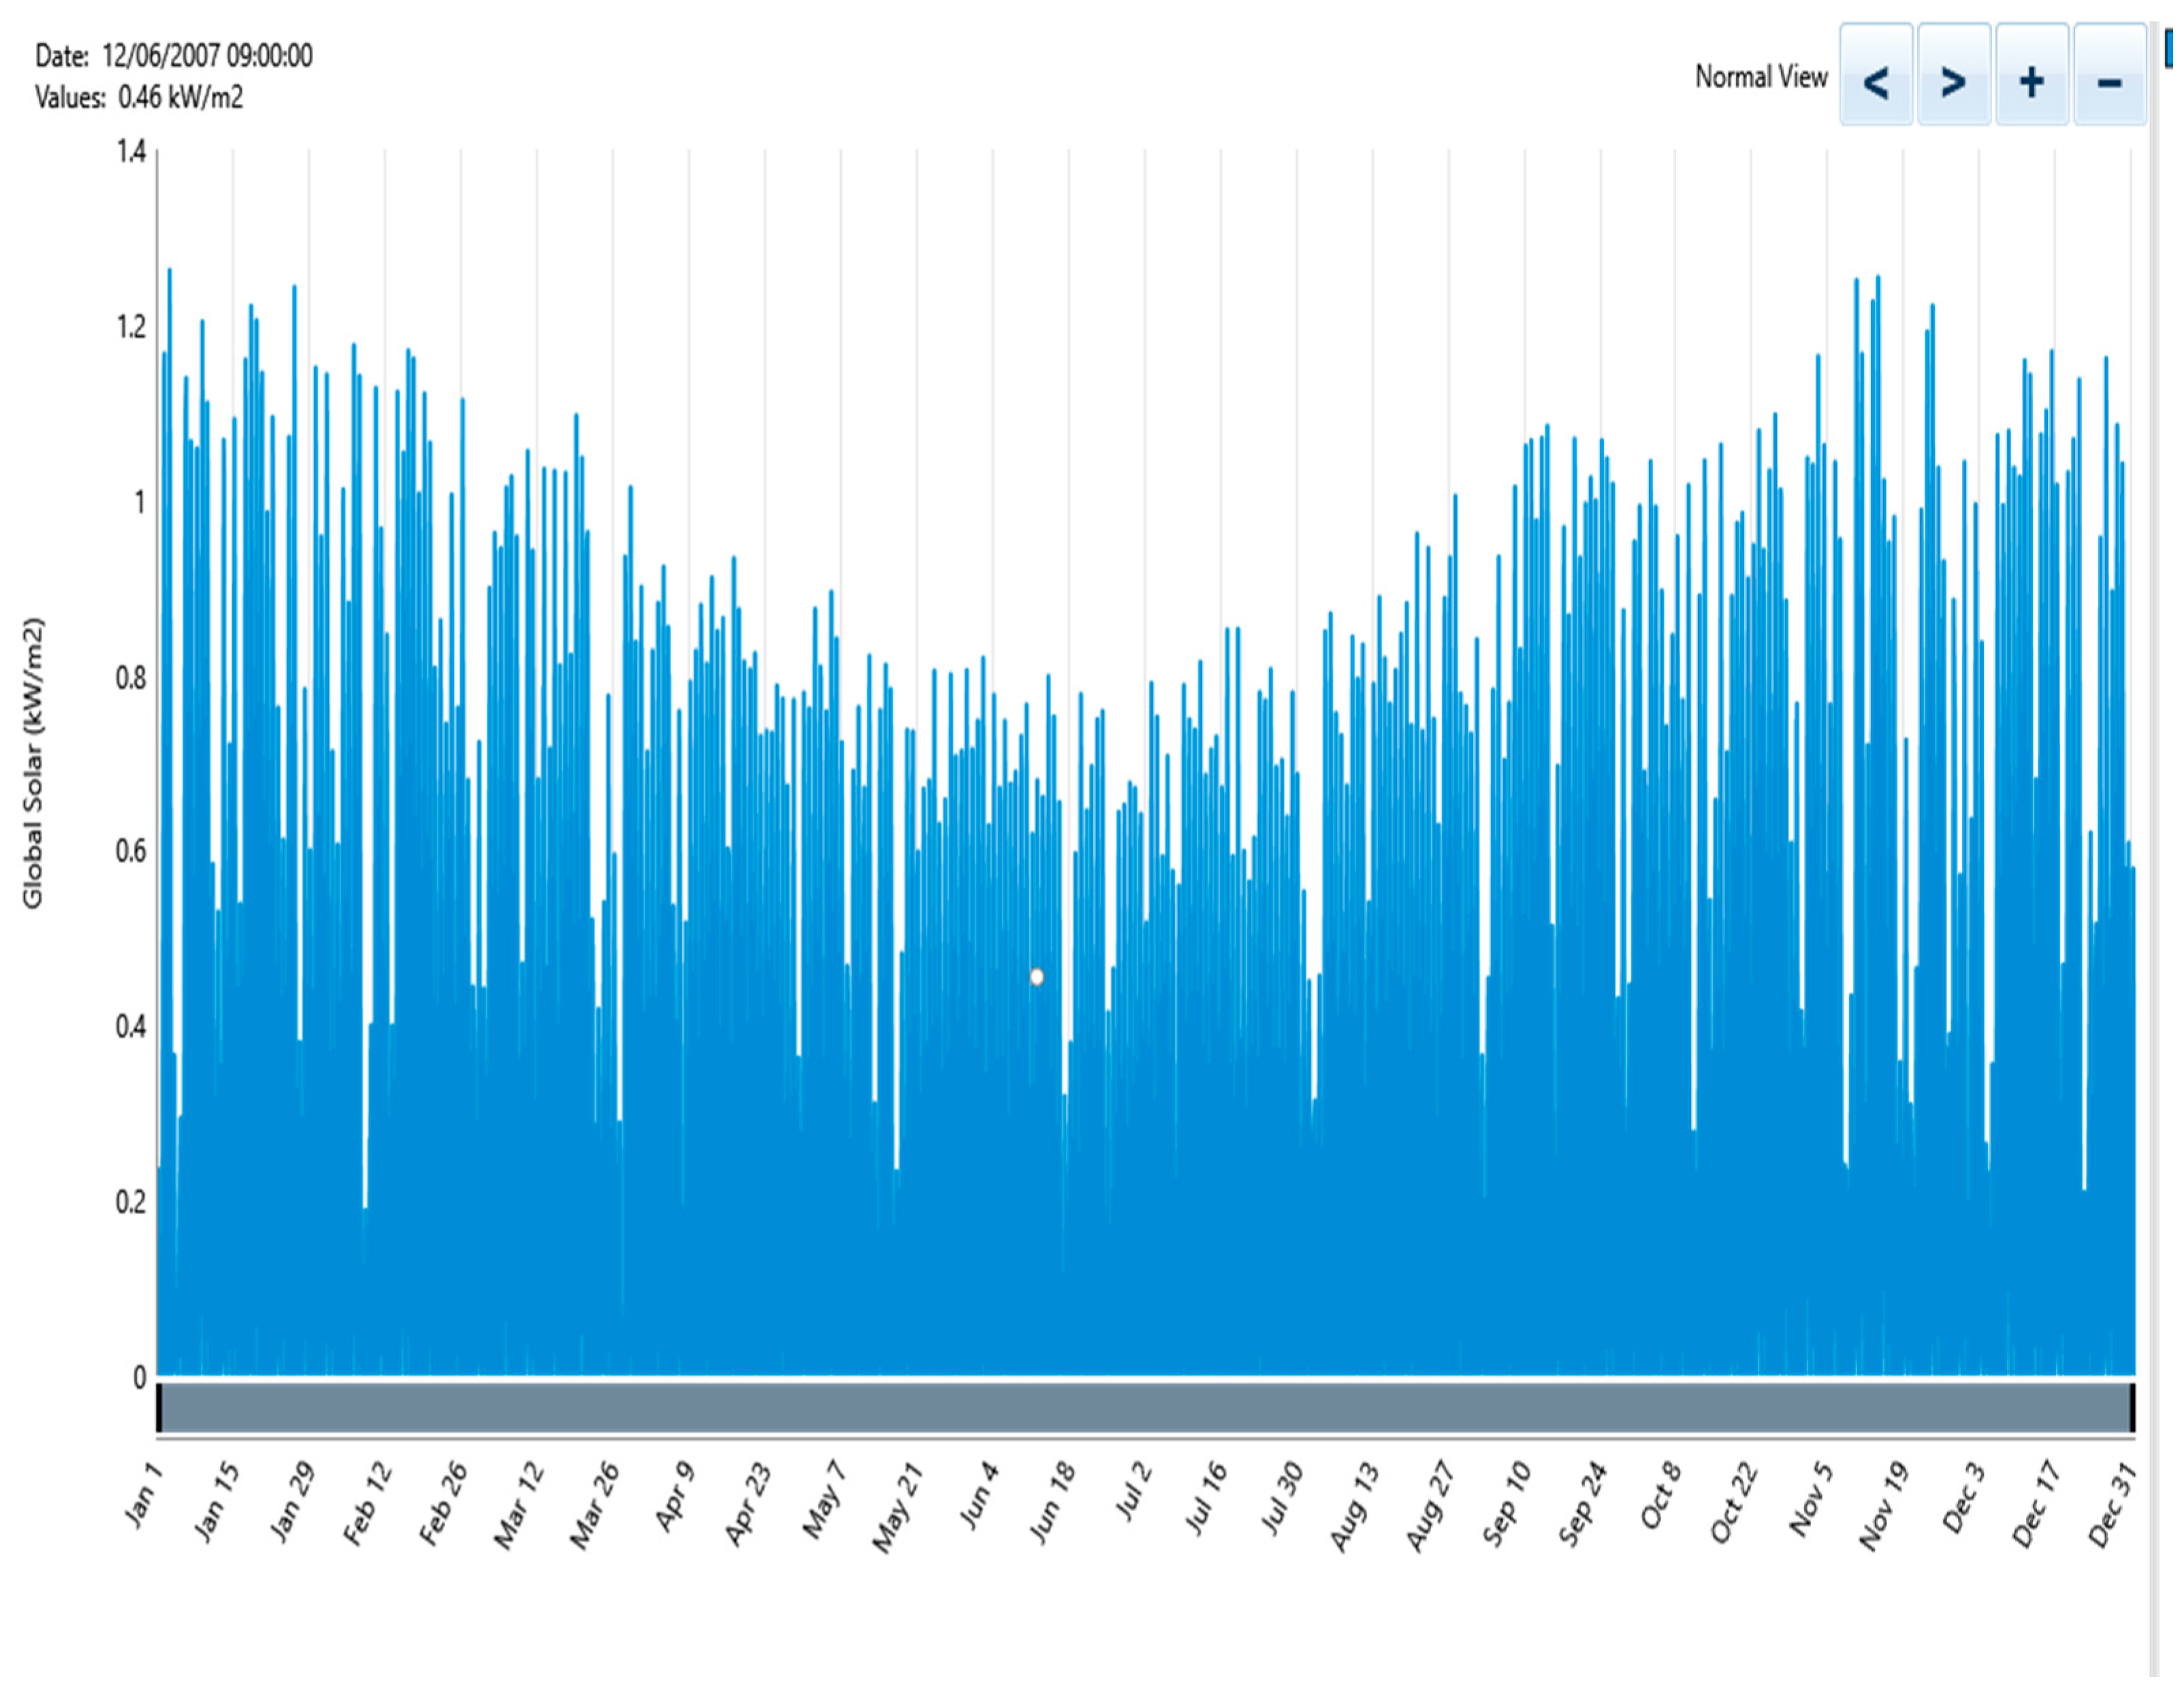
40]. The global solar radiation data for Gwakwani is shown in
Figure 1 which highlights the pattern by hour of the day and day of the year. It shows January to March and September to December as the peak months for solar radiation while from April to August exhibits the lowest solar radiation [
41,
42,
43].
There are between 70 and 100 people living in this village with no electricity and a very simple lifestyle. This village has few activities that require electricity beyond a few hours of lighting for houses (preferably during night time hours), mobile phone charging and water pumping for water production.
Figure 2 below is a background into the simple lifestyle in Gwakwani area.
The village is assumed to have on average 17 houses. The size of houses are unknown, therefore simple arithmetic assumptions are made to enable the demand estimation. It is assumed that this village runs community-based living and the rules of engagement within a community apply and are imposed. The local type of employment is predominantly simple agriculture which requires minimal irrigation and animal husbandry. The electrical demand will be required for lighting, mobile phone charging and water pumping. One mobile cell phone is assumed for each household, and one lamp per household is assumed for electricity supply. One water pumping device is assumed for the entire village and this is run for 3 h.
Table 1 below will summarize the energy demand during the day based on the above appliances and their time of operation.
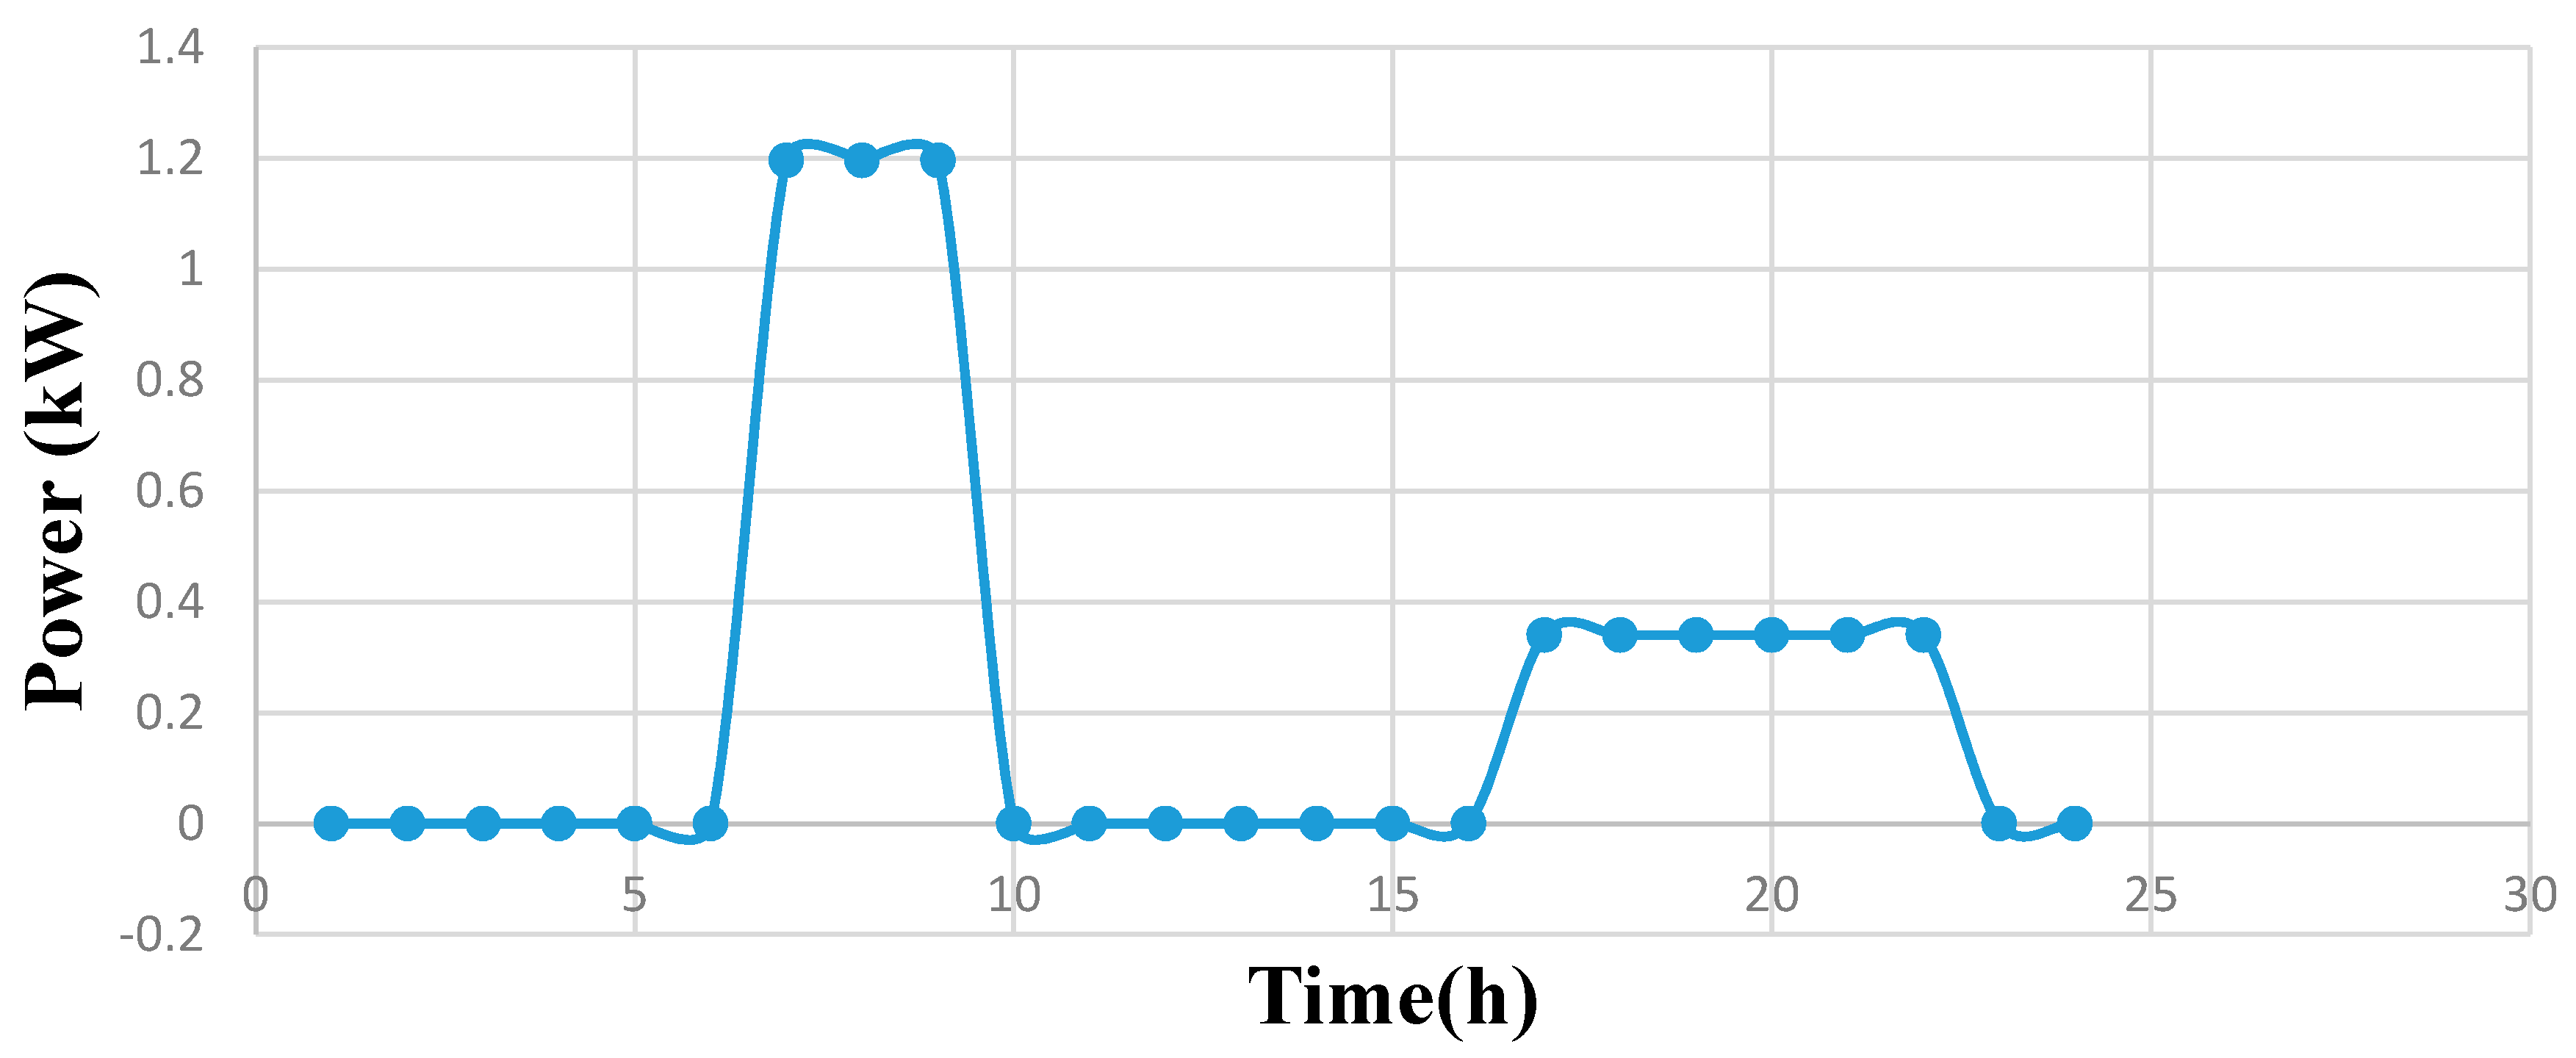
The hourly demand of the village is shown in
Figure 3 below. As it is presented, the electricity required will be operational during two periods of the day—morning and evening time. Adding more appliances such as a television set as a communal social gathering for the village is a plausible option due to the surplus power generated.
2.1.2. Energy Demand
In the Morning between the hours of 7 a.m. and 10 a.m. (3 h) the total demand is 4863 W/h/day and in the Evening the total demand is 1700 W/h/day (as shown in
Table 1 above).
The average energy consumption is 1.2 kW. This is required for Mobile Charging and Water Pumping; while in the Evening between the 17:00 and 21:00 (4 h), the average energy consumption is 0.35 kW (this is required for Lighting purposes).
2.1.3. System Components and Cost Assumptions
In this paper, two different scenarios of operations will be applied to cover the electricity demand of this village. These scenarios are built based on three main points which are: (i) Reduce the system cost to the lowest possible value—the priority of the production will be given to renewable energy sources to decrease the system cost (ii) and reduce the emissions—considering the environmental impact on life and welfare; (iii) and providing electricity to consumers efficiently without interruptions. Based on these aforementioned conditions, two systems are suggested which are:
Photovoltaic system plus diesel generator for the time shortages and night time (for daily usage).
Photovoltaics system plus battery storage to store the excess energy produced via PV system and meet any deficiency periods and during the night (for daily usage).
2.2. Simulation
HOMER energy software from NREL is applied for the system simulation. The software can be used for different energy management scenarios such as off-grid, on-grid, and mini-grid systems. The main points of the paper can be investigated running this software as it assesses the system based on a techno-economic view. In this paper, three different systems are designed using the main energy source (PV) and applied in a scenario to verify the best optimal solution for the village in a cheaper sustainable way [
23].
In the first scenario the PV system with battery to store excess energy is used to meet any demand shortages. Four PV sizes are tested, and the optimal sizing is selected and compared with the second scenario.
In the second scenario the PV system and diesel generator is added. The shortages during operation are matched using a diesel generator. The same four PV sizes used in the first scenario are applied and tested here and the optimal sizing is also selected and compared with the first scenario.
In the third scenario, the PV system and both the diesel generator and battery storage unit are added, and four PV sizes are tested. The load following dispatch strategy ensures that the generator produces only enough power to meet the load as the optimal system is more efficient in renewable powered systems which exceeds the load. HOMER automatically turns the generator off, if the load is supplied by other renewable sources [
10,
16,
37].
Finally, a comparison between the optimal solutions in the first, second and third scenarios have been presented. The criteria established between those two scenarios are: (a) the system cost; (b) the renewable energy penetration; and (c) the demand satisfaction. The figures below show the three model scenarios.
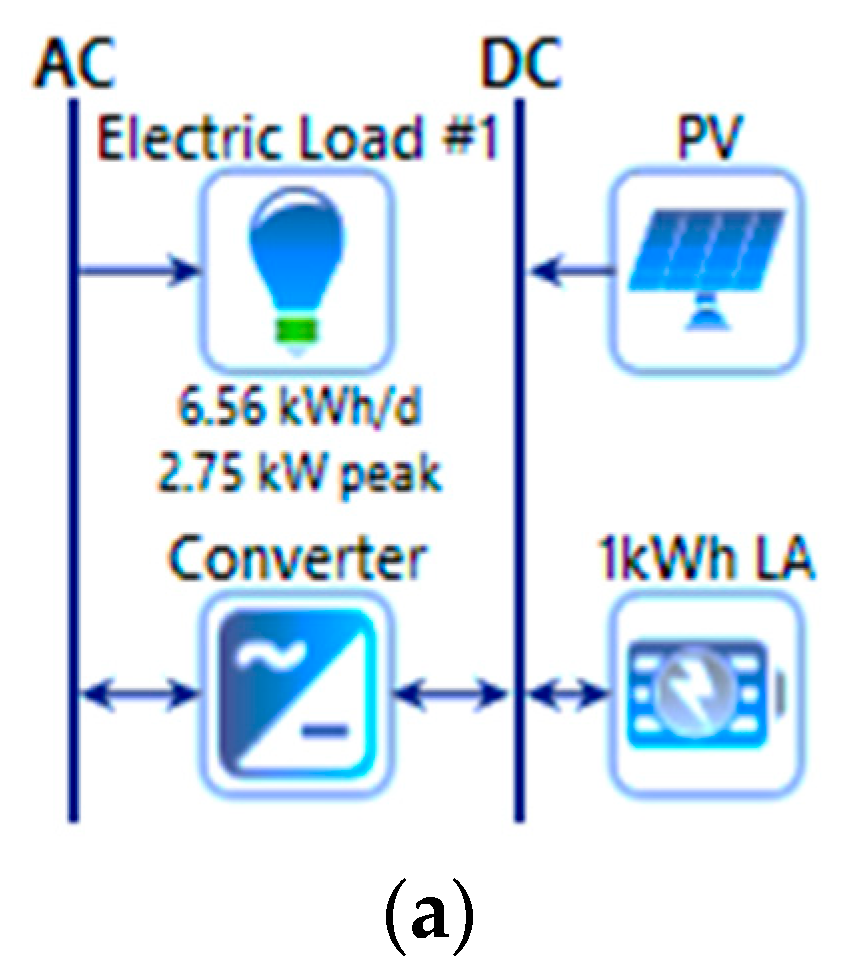
(a) Photovoltaics System plus Battery Storage
This scenario consists of PV system and battery storage without any conventional electricity sources such as a diesel generator. Different sizes of PV system are tested and the optimal solution selected to compare with other scenarios. The PV will satisfy different purposes at the same time to satisfy the demand and to charge the battery for Evening time or periods with shortage of PV power. In this scenario the total energy supply to village is supplied via PV system either directly from the PV to the load or indirectly from the battery to the load. Technical and economical details of all components including battery and PV inverter are presented in
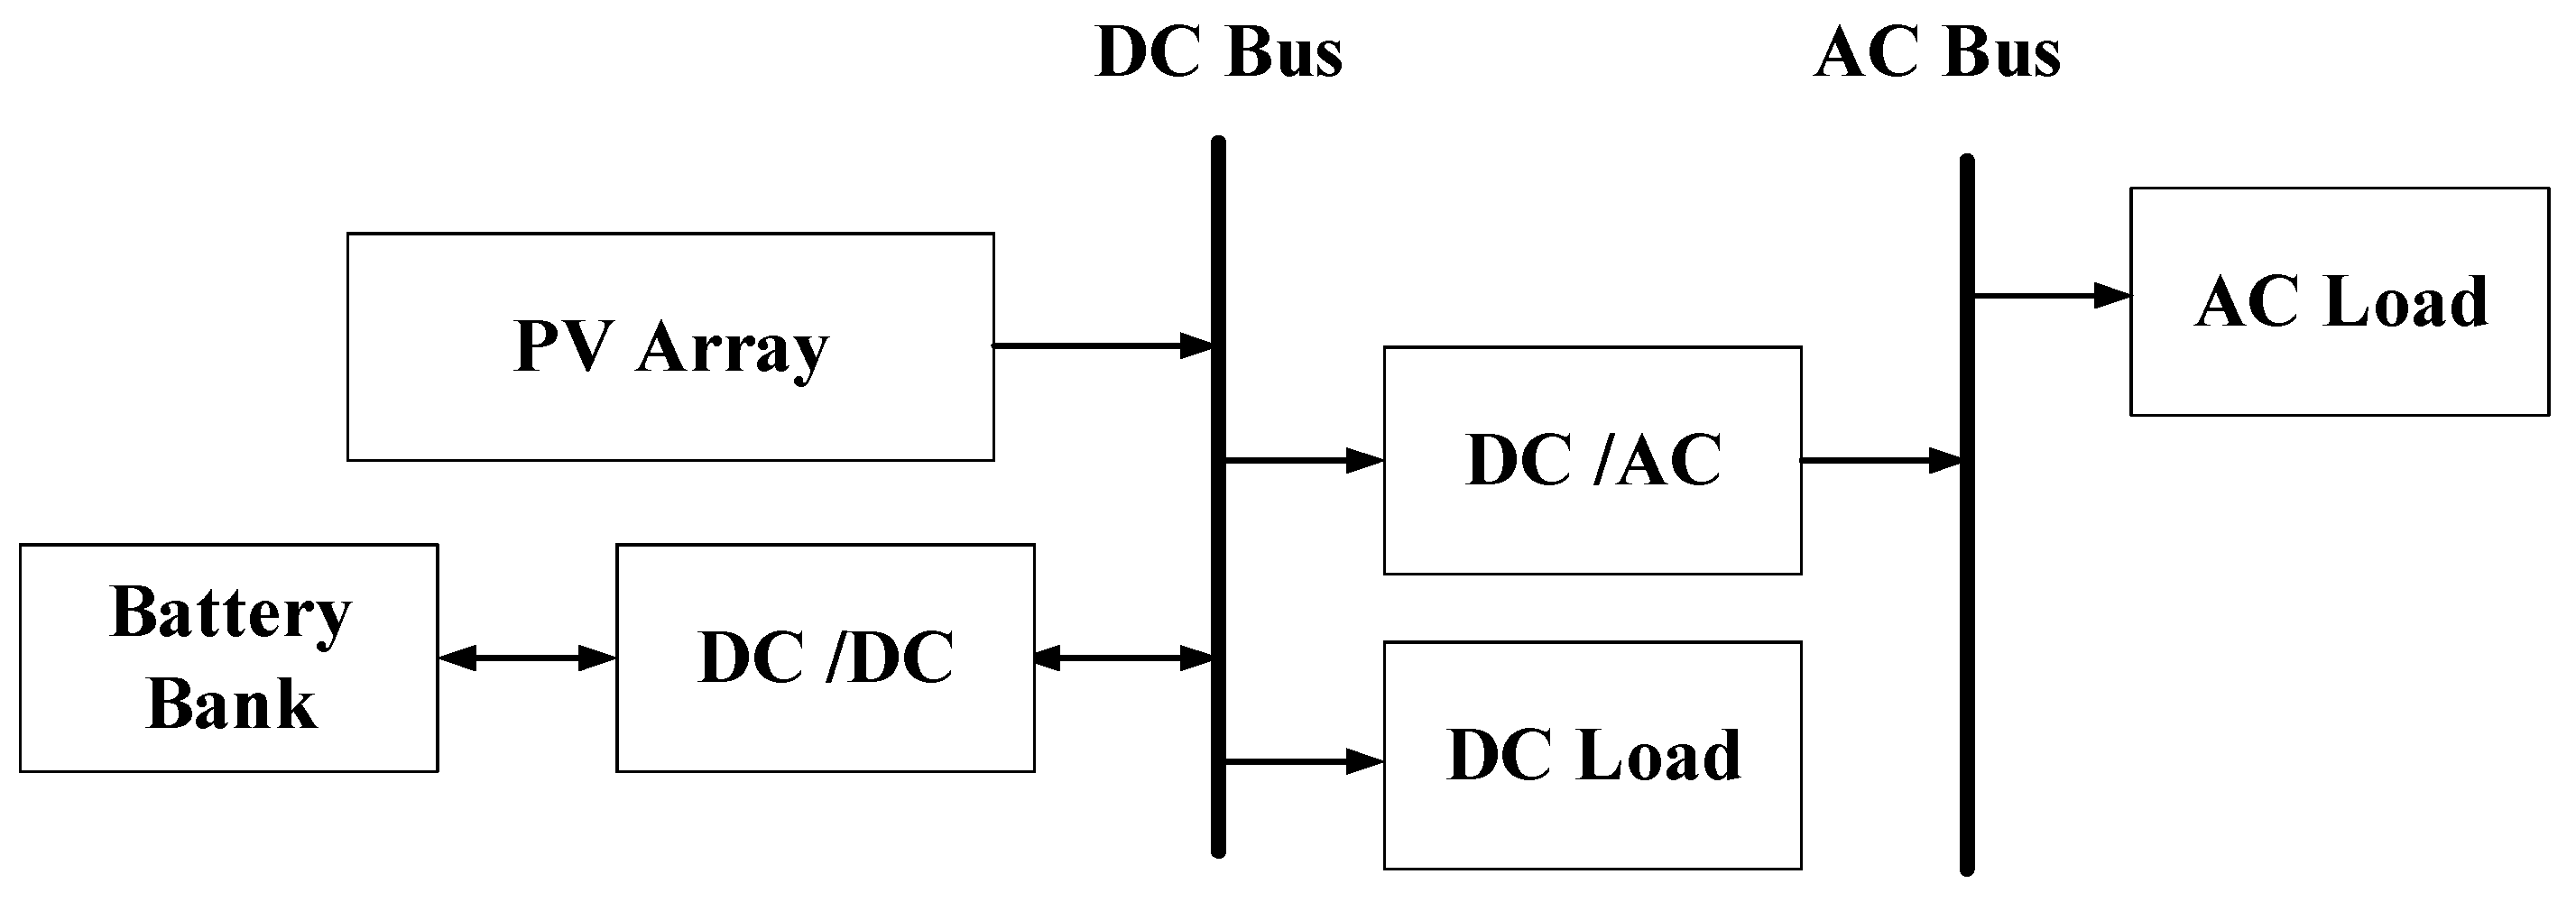
Table 2 below. This scenario has two advantages in comparison with the previous scenario, which are environmental friendliness and being totally self-dependent since there is no need to travel long distances to buy diesel fuel. The autonomous hybrid PV/battery power system considered is a combination of a PV array, battery bank, direct current DC/DC and alternating current AC/DC converter, DC/AC inverter, DC, and AC load as shown in
Figure 4.
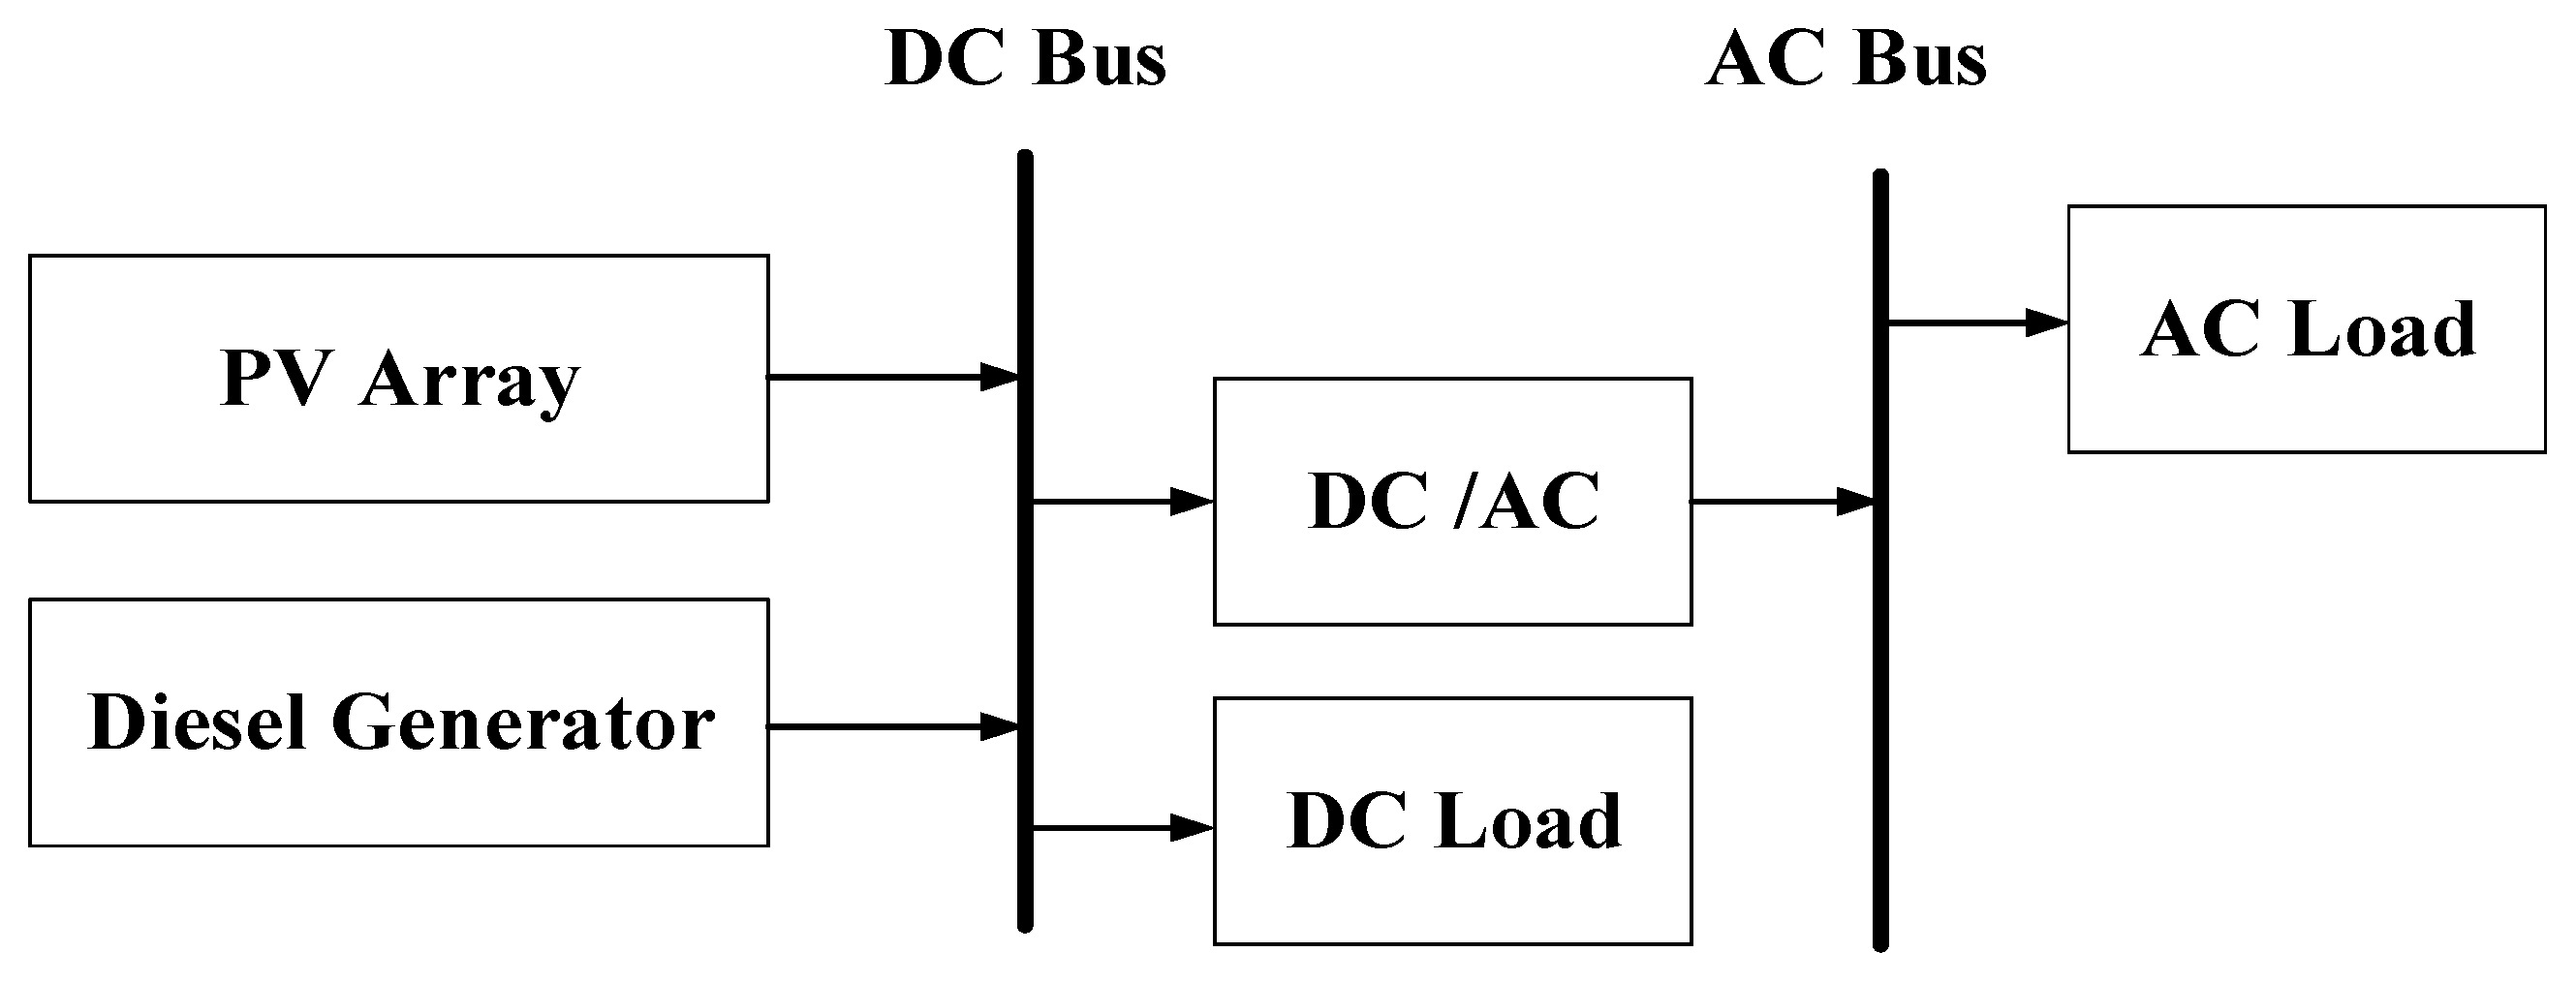
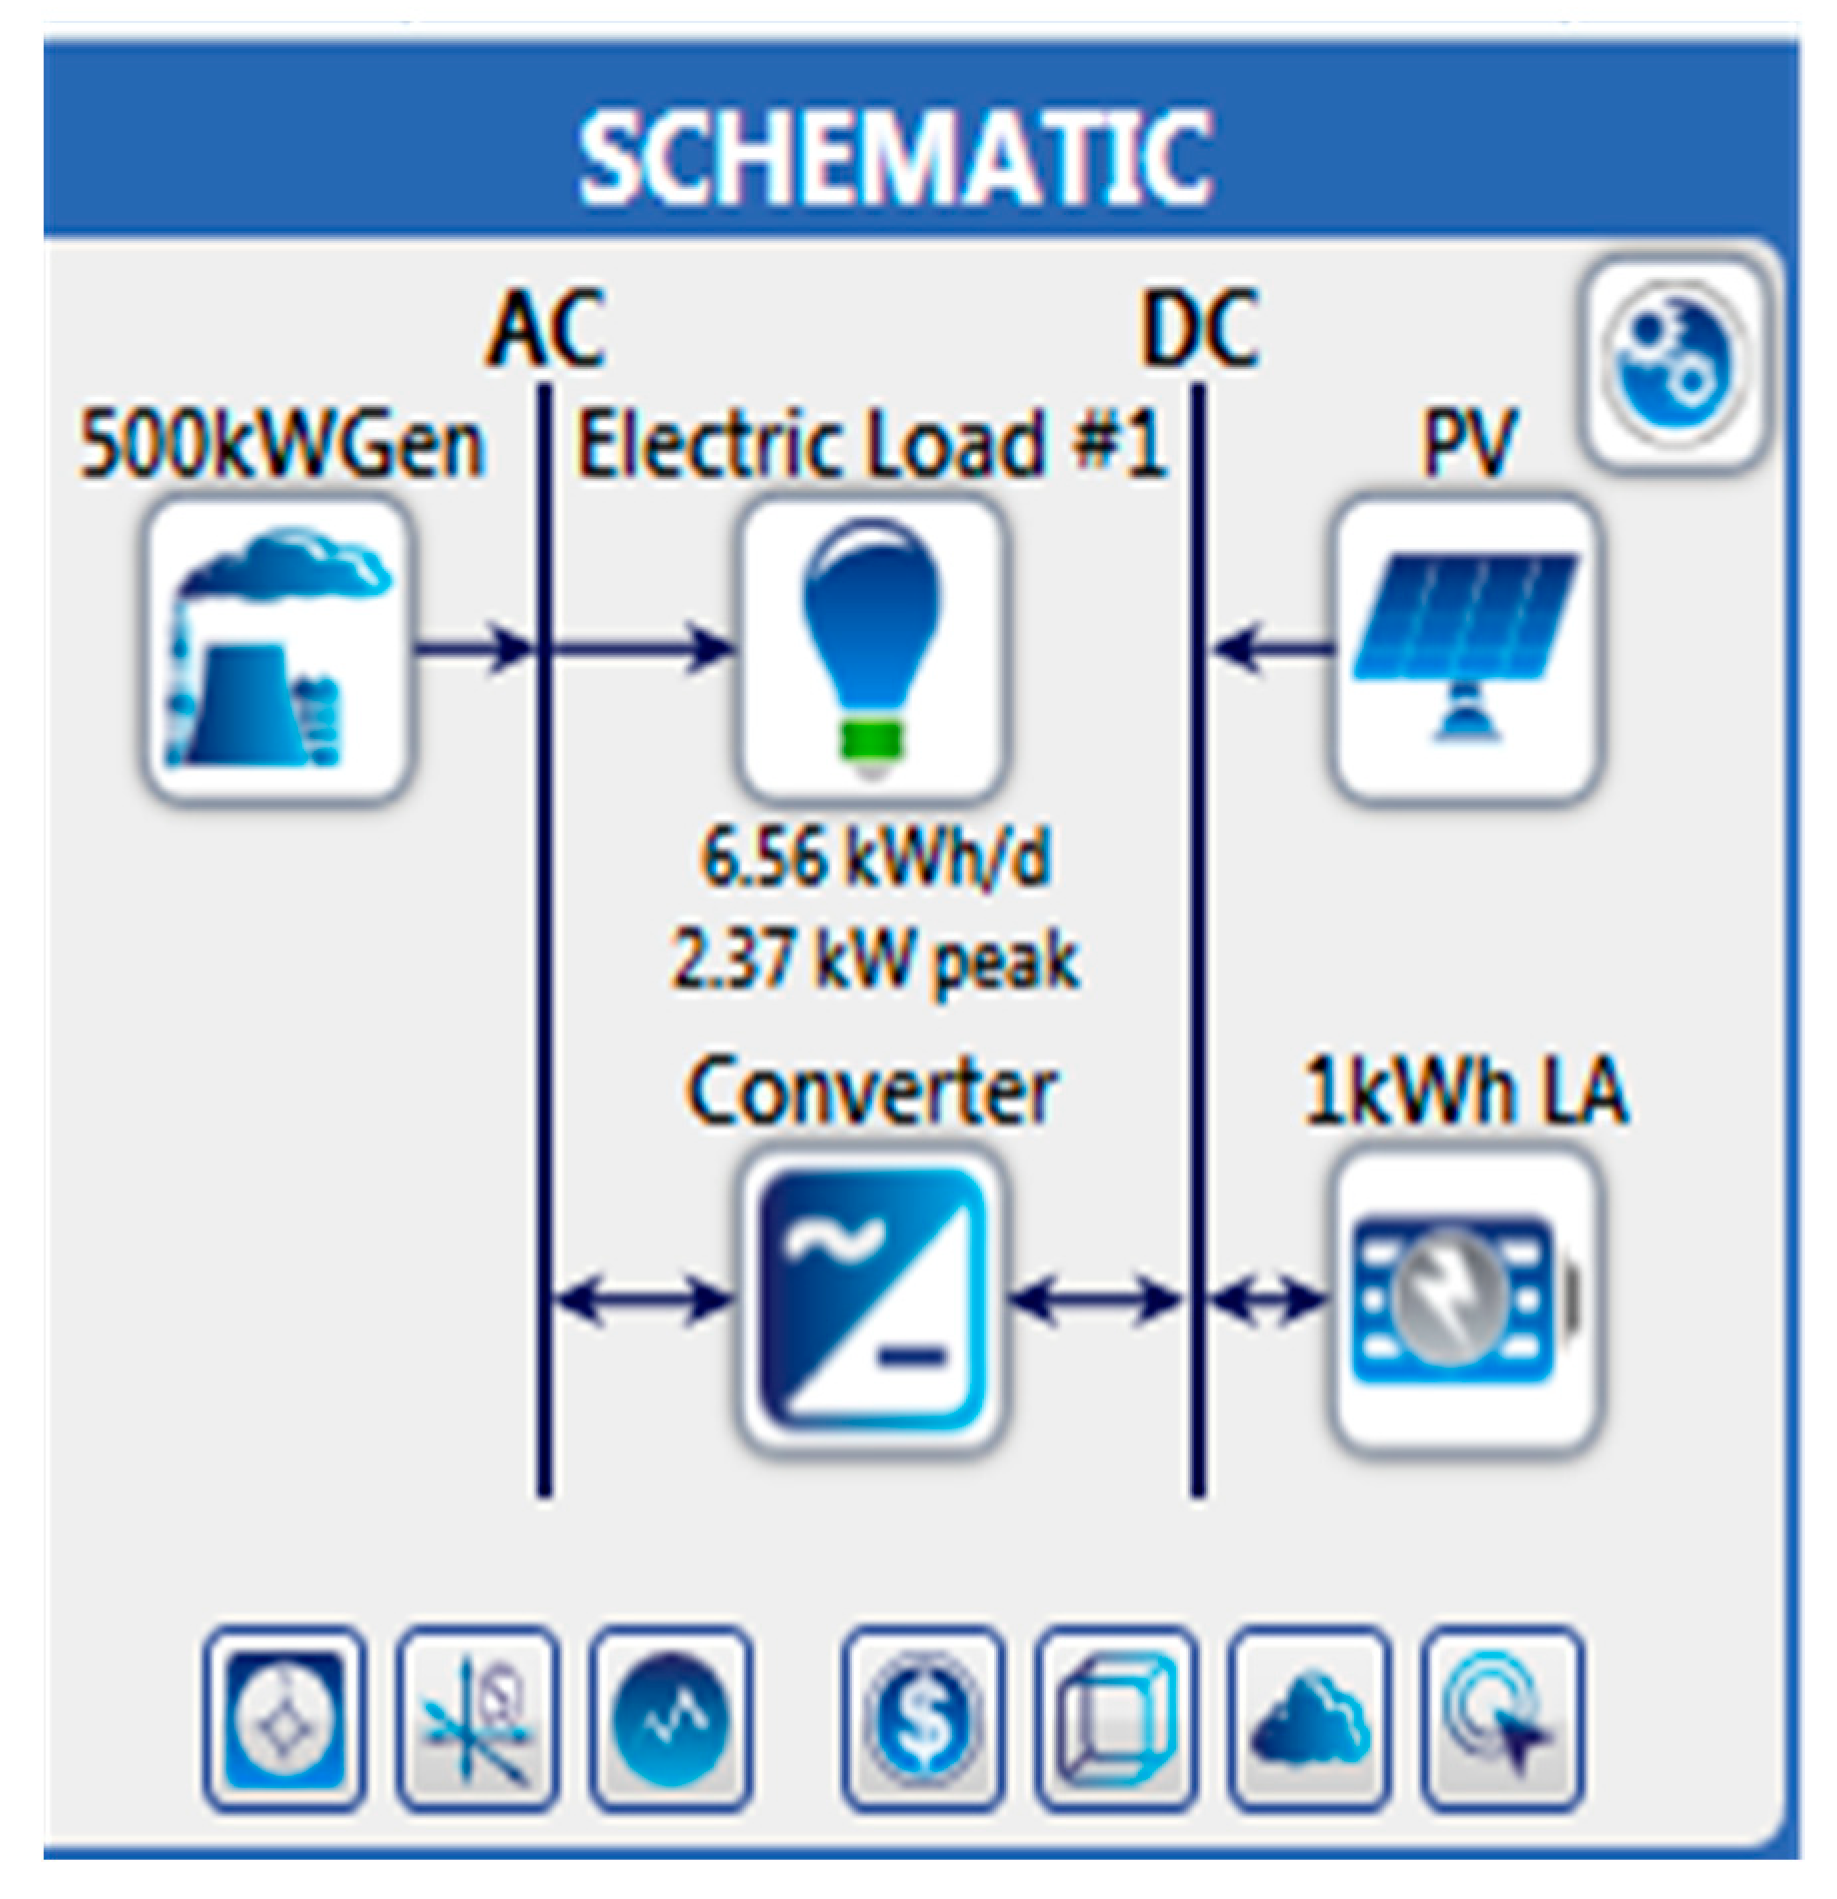
(b) Photovoltaic System plus Diesel Generator
This scenario consists of a photovoltaic system plus diesel generator, with different PV system sizes tested. These sizes are 1 kW, 0.8 kW, 0.6 kW and 0.4 kW. Then the optimal PV size is compared with the optimal PV size of other scenarios. The PV system supplies the demand during the daytime and any other surplus power is wasted because of the absence of energy storage. Any deficiency in meeting the demand leads to the diesel generator being run, even during the daytime. In this case, the diesel generator has the potential to meet the total demand load due to full rate operation of diesel generator while all PV power production is curtailed or dissipates. Technical and economical details of diesel generator and PV are presented in
Table 2 below. The autonomous hybrid PV/diesel power system considered is a combination of a PV array, diesel generator, direct current DC/DC and alternating current AC/DC converter, DC/AC inverter, DC, AC load as shown in
Figure 5.
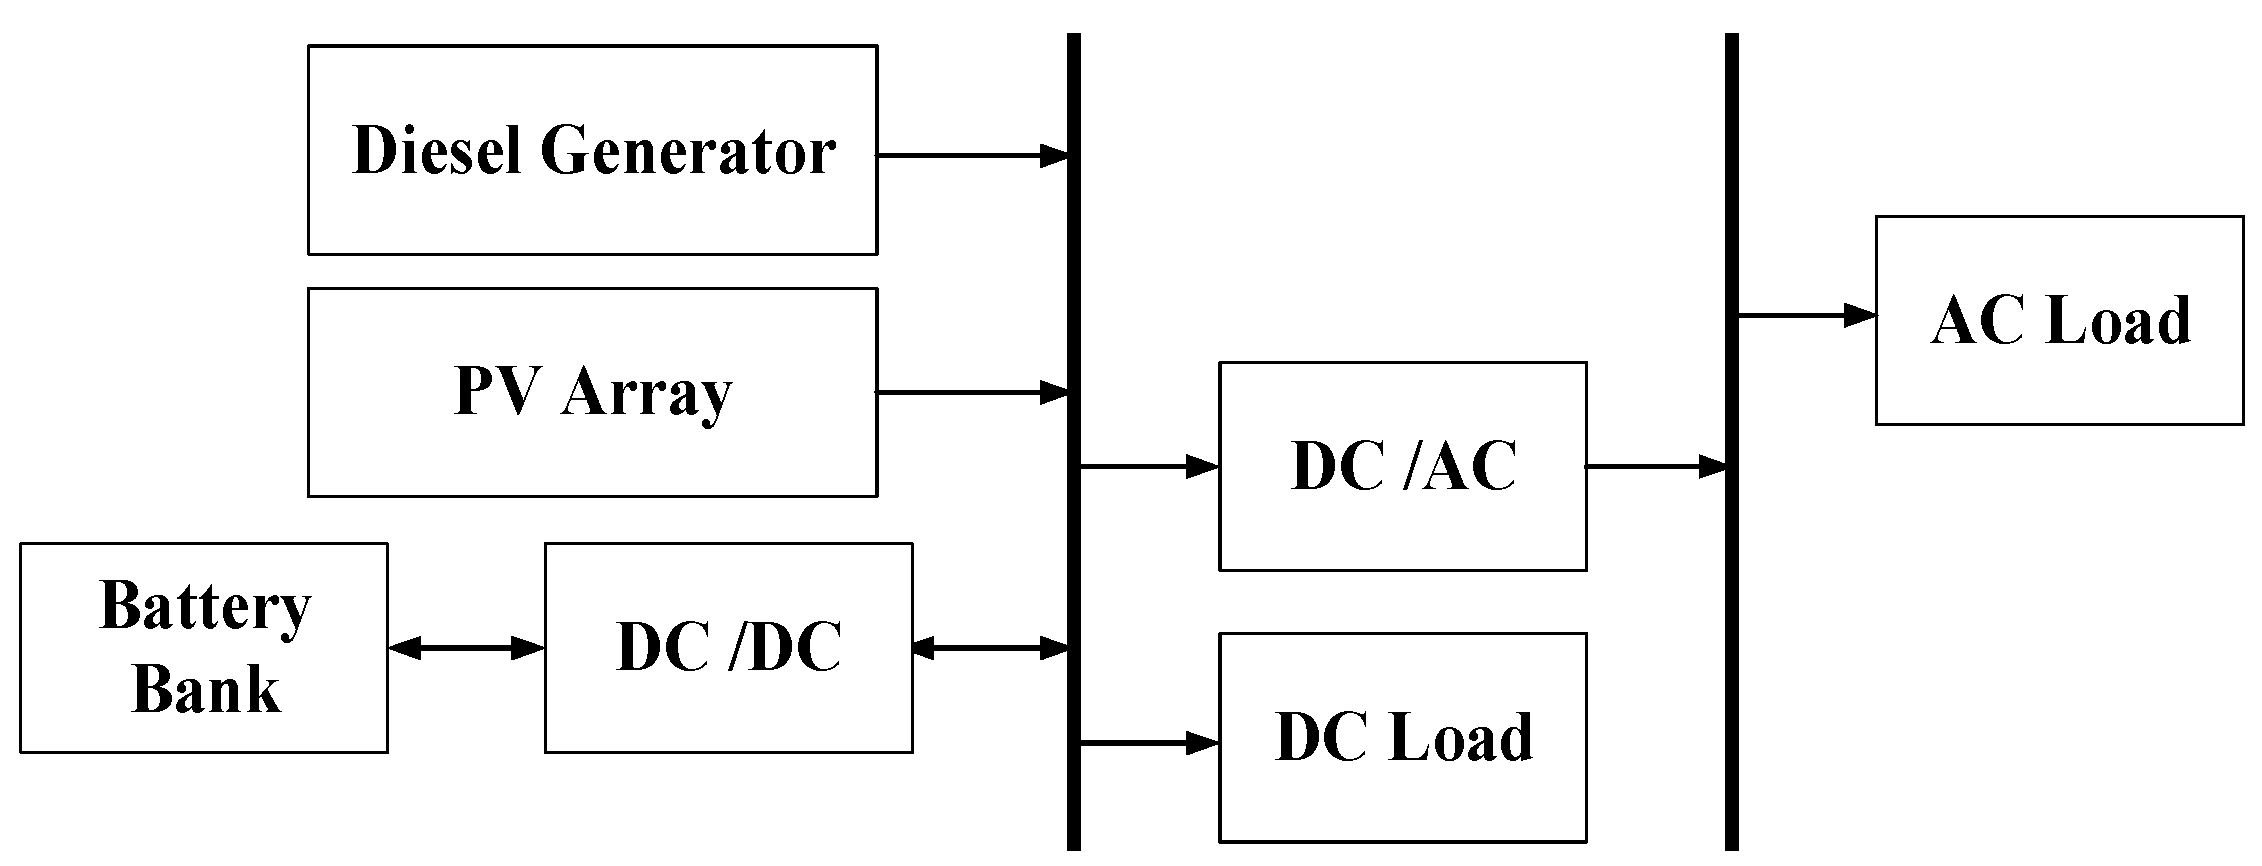
(c) Photovoltaics system, Diesel Generator plus Battery Storage
This scenario consists of photovoltaic system plus diesel generator and battery storage unit. The autonomous hybrid PV/diesel power system considered is a combination of a PV array, diesel generator, battery storage unit, direct current DC/DC and alternating current AC/DC converter, DC/AC inverter, DC, and AC load as shown in
Figure 6. This scenario consists of a photovoltaic system plus diesel generator and battery storage which analyzes the different PV system sizes of 1 kW, 0.8 kW, 0.6 kW and 0.4 kW. The Load Following (LF) dispatch strategy is used as this enables the production of only enough power to meet the primary demand load of (6663 Wh/day) while the generator is in operation. The lower priority objectives such as storage bank and serving the deferrable load are left to the renewable power sources [
12,
16,
17]. The deficiency in meeting the demand load activates the diesel generator which runs continuously until the storage unit is full (which usually requires an increase in storage unit size).
2.3. System Components
1- PV Module
In HOMER, the PV panels generate DC electricity in direct proportion to the solar radiation, independent of its temperature and voltage to which it is exposed. The output power of PV can be computed using the equation below.
where
the peak output power of PV system is
,
is the PV panels derating factor
,
is the solar radiation incident on the PV system in the current hour
, and
is the incident radiation under standard conditions
.
2- Diesel Generators
Diesel generators are used to meet the peak demand, mainly when there is no output power from the PV system. It is important to note that the Gwakwani residents usually travel long distances of approximately 5 miles to buy fuel which leads to an increase in the fuel price above the normal rates. As of 2017, the fuel price in South Africa is fixed at around 1
$/L. So, the price of 1.75
$/L is considered to cover the transportation cost. Capital cost, maintenance cost and replacement cost are presented in
Table 2.
3- Battery
In this study, the lead acid battery model is utilized, which provides good features combined with low cost. The lifetime and efficiency of the battery are set as five years and 85%, respectively. More details are presented in
Table 2.
4- Inverter
A converter purpose is to convert the dc power obtained from PV panel to ac power. Usually, a converter is rated based on the power of PV system selected and the typical convertor efficiency of 85%. Technical and economical details of the converter are given in
Table 2.
Since the objective aim for PV-Battery (in Scenario 1) is to satisfy the demand load regardless of the source, the PV simultaneously operates two goals: meeting the demand and charging the battery for later use. Due to the absence of a diesel generator, the PV system is running most of time except for three plausible periods: (i) when there is no demand load in the Afternoon (between the hours of 11:00 and 16:00); (ii) When there is not enough solar radiation (which can potentially occur between March to September and (iii) when there is not enough storage space within the battery size capacity. In second scenario, if the PV system cannot meet the demand, the diesel generator should be operated. Once the diesel generator is running, there is no need to operate the PV system at the same time since the power will be dissipated. The diesel generator is running at full capacity at any time and its capacity is sized according to the demand which can easily meet the demand without PV system production. Stop running the PV system when the production cannot meet the demand due to two main points: the absence of the storage system in this scenario and reduce the PV cost and increase the system lifetime.
The characteristics of the component parts for the hybrid systems are summarized in Table below:
2.4. Net Present Cost of the System and CO2 Emission Cost
The net present value can be calculate using Equation (2) below.
where
Total annualized cost;
Capital recovery cost;
Project lifetime;
Interest rate.
The total CO
2 emissions from hybrid system can be computed using Equation (3) below.
where
Total amount of carbon dioxide;
Fuel quantity;
Fuel heating value;
Carbon emission factor (ton carbon/TJ);
Oxidized carbon fraction; Another point that should be taken into account is that every 3.667 g of
contains 1 g of carbon.
4. Results
4.1. PV System with Battery for Energy Storage
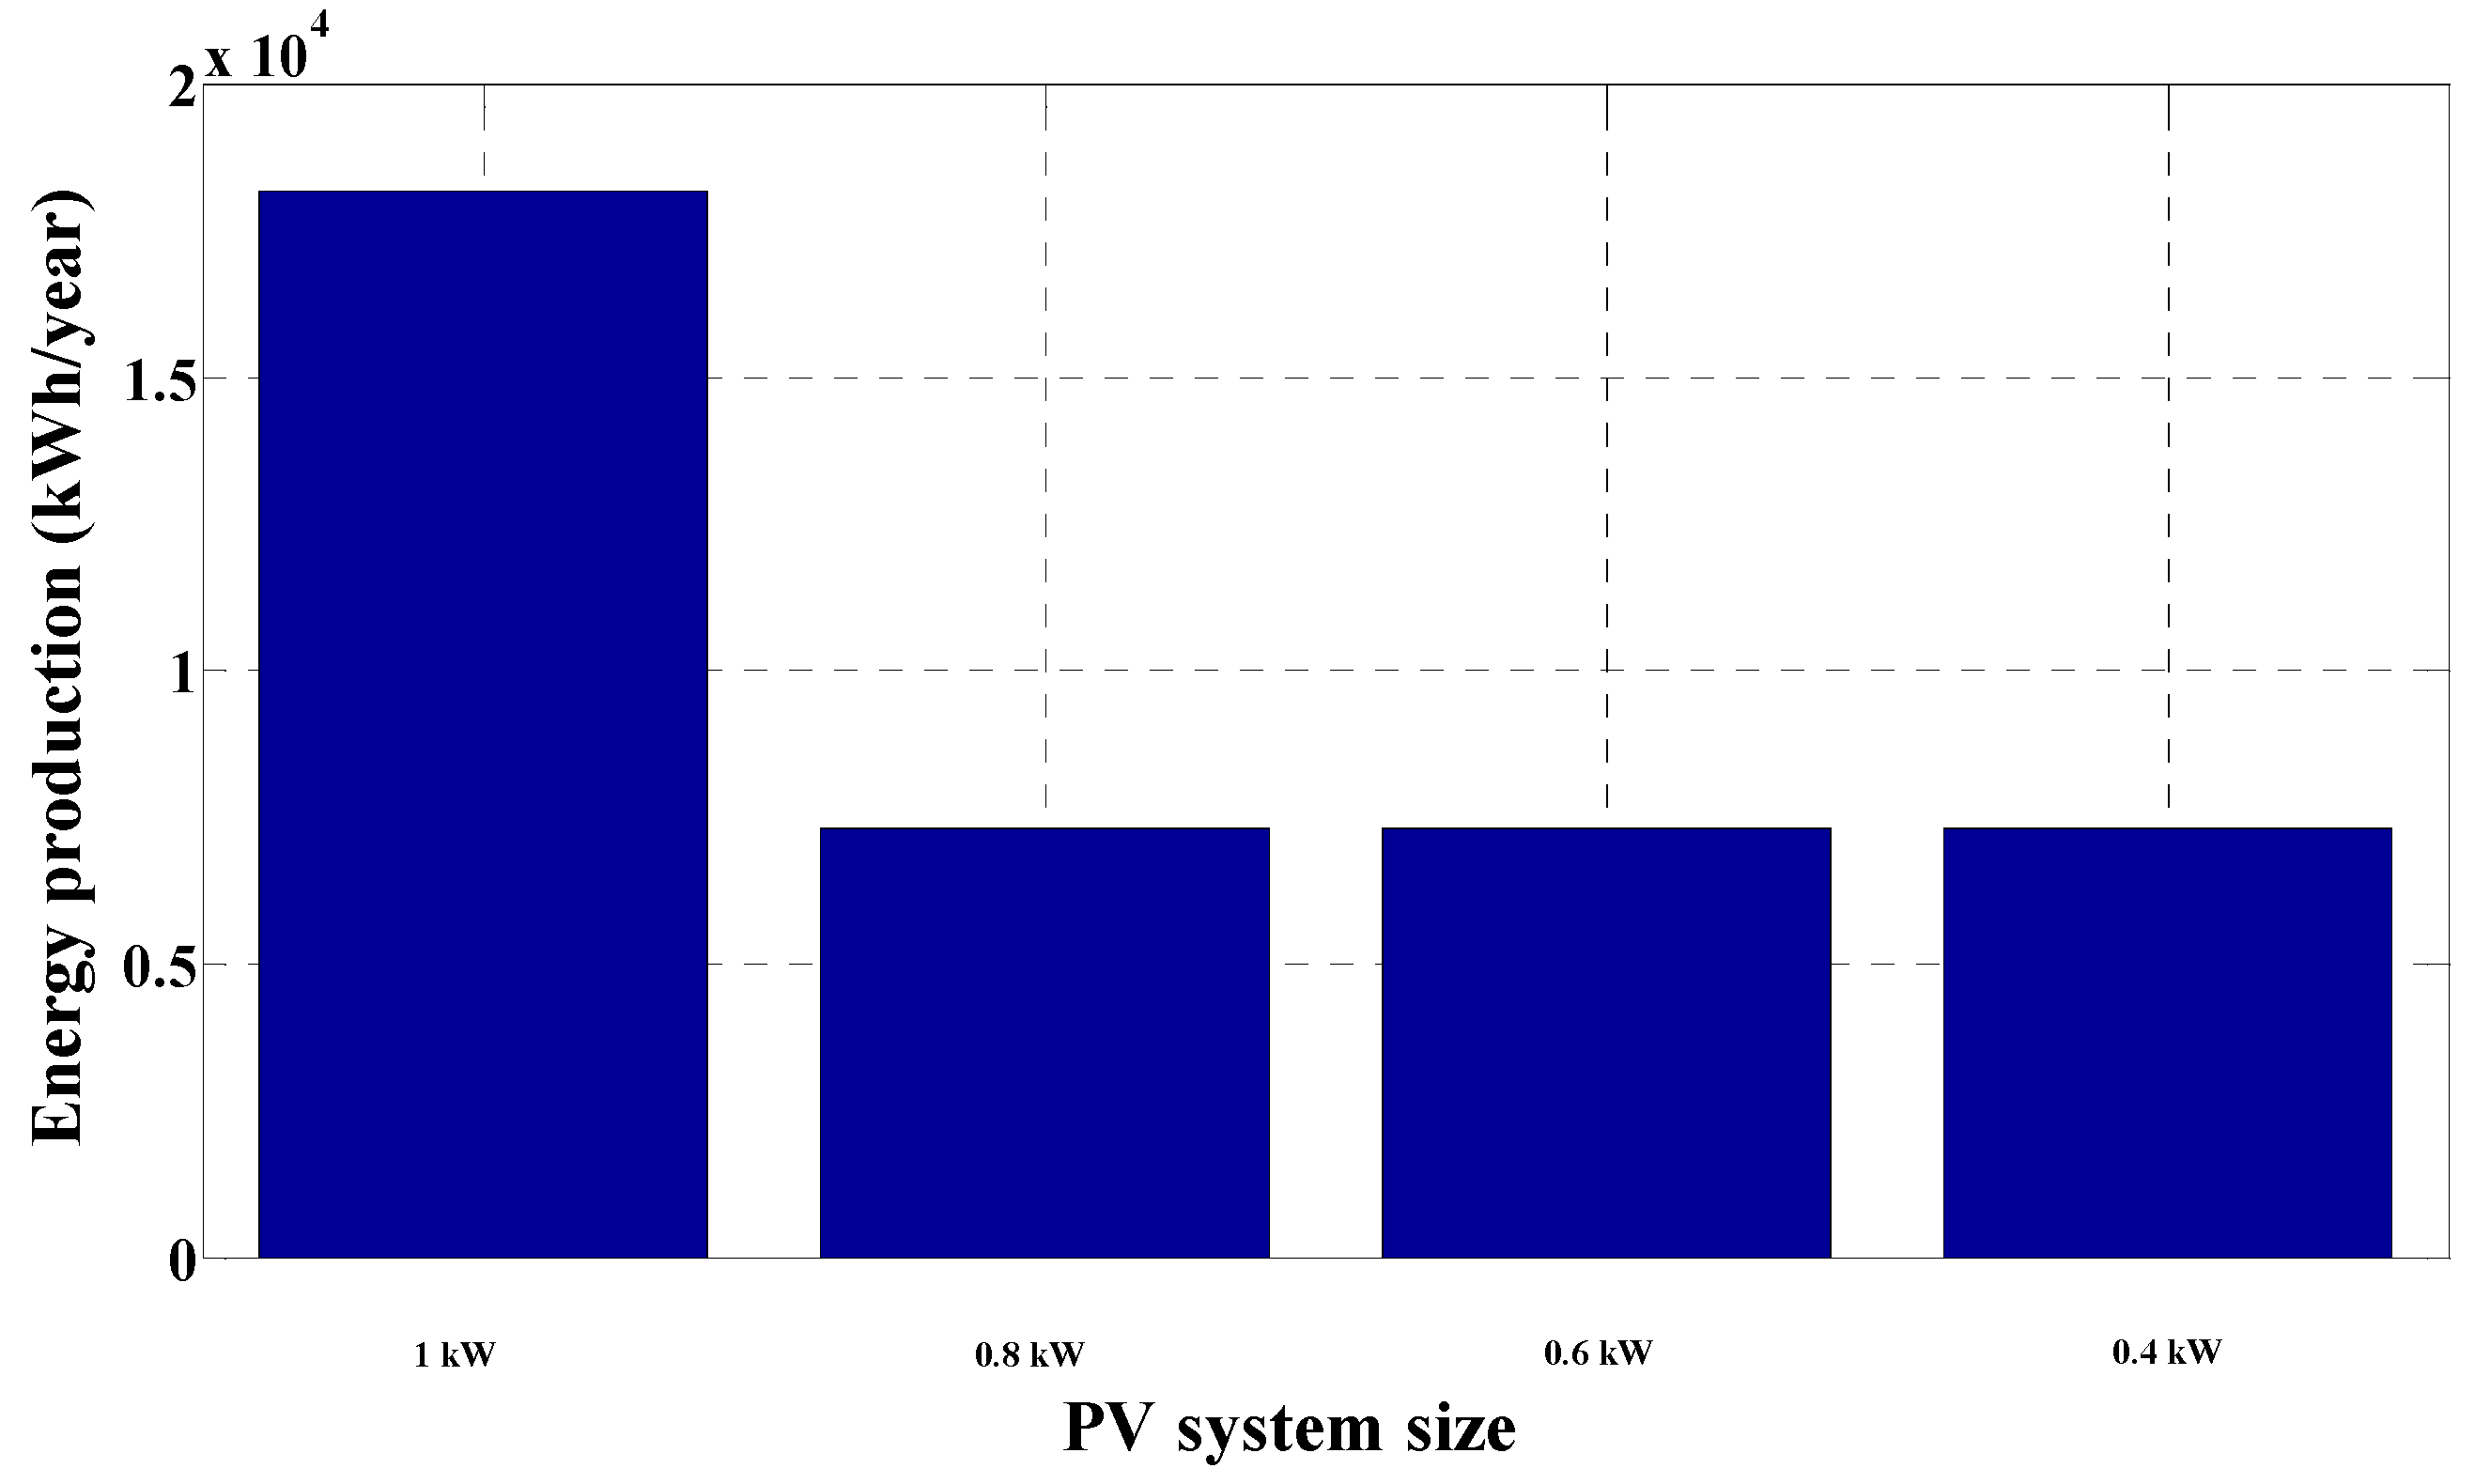
Four different sizes of system have been applied and the result has been analyzed for every size. These sizes are 1 kW, 0.8 kW, 0.6 kW and 0.4 kW. The total amount of energy production during the year of each system size is shown in
Figure 10 below. The demand load for the Gwakwani village is 6563 W/h/day (see
Table 1). The PV is designed based on the demand load and the daily solar irradiation in
Figure 1. The use of PV size 0.6 kW meets the demand load, as well as the other PV sizes 0.8 kW and 1 kW. However, the increase in PV sizes consequently leads to an increase in its economic costs.
The cost difference between these scenarios mainly comes from the number and the O&M of the batteries in each scenario. For example, in the first scenario the 1 kW PV size activates the battery string at 18 cell while the 0.4 kW PV activates the battery string at 19 cell. In addition, due to the small size of the PV system in 0.4 kW and 0.6 kW, the battery will take more time to fully charge, which will lead to more operation and maintenance (O&M) cost. Degradation is the main issue of the battery and has a direct relation to the period of operation. The operation and maintenance cost were $2327, $2327, $2327, and $2456 for the 1 kW, 0.8 kW, 0.6 kW, and 0.4 kW respectively.
The O&M cost of the PV system also has an inverse relationship with the PV system size even though the operation costs per year (4388 h/year) for all sizes is the same. This possibility is because small sizes require more on-off connection to battery since it takes more time to fill the charge of battery. This interpretation shows the difference between lifetime throughput of the battery in each scenario since the large size has longer lifetime (11,234 kWh) compared with 11,666 kWh in 0.4 kW size. The rest of the calculations, such as the unmet demand, energy price and total system cost per size, are presented in
Table 4.
The results reveal that changing the PV size does not strongly affect the main function of the system since the unmet demand remains the same during the other three sizes. The unmet demand is equal only for one day demand during the year. With regard to the system component part, a decrease in the system size led to an increase in cost and a corresponding increase in the system’s battery size—which is required to meet any shortages due to the reduced PV size. Based on the calculation above, first size (1 kW) can be considered to be economically efficient to meet the demand in the village even though more surplus energy will be wasted due to the small size of battery. Alternatively, the next step would be to increase the size of battery but increasing the battery size will further increase the system costs as well.
Another option to combat this conundrum would be to introduce other household appliances to maximize the surplus energy for demand-side response by adding television and radio sets, etc. The highest energy price costs come from the energy storage cost. For example, in 1 kW, the levelized cost of energy produced via PV system is 0.134 $/kWh whereas the storage wear cost is 0.419 $/kWh. The rest comes from the annualized cost of other components.
4.2. PV System with Diesel Generators and without Battery
In this scenario the battery storage is replaced by diesel generator to meet the demand during the PV shortage times. The same PV system sizes are used as with the first scenario. These were tested, and two main points are observed even before the operation stage: the increase in CO2 emissions due to the fossil fuel usage and the amount of renewable energy wasted is higher than the last scenario—because of the lack of energy storage equipment. It is important to note that the Gwakwani residents usually travel long distances of approximately 5 miles to buy fuel which leads to an increase in the fuel price above the normal rates. As of 2017, the fuel price in South Africa is fixed at around 1 $/L. Therefore, the price could be considered 1.75 $/L to cover the transportation cost.
In
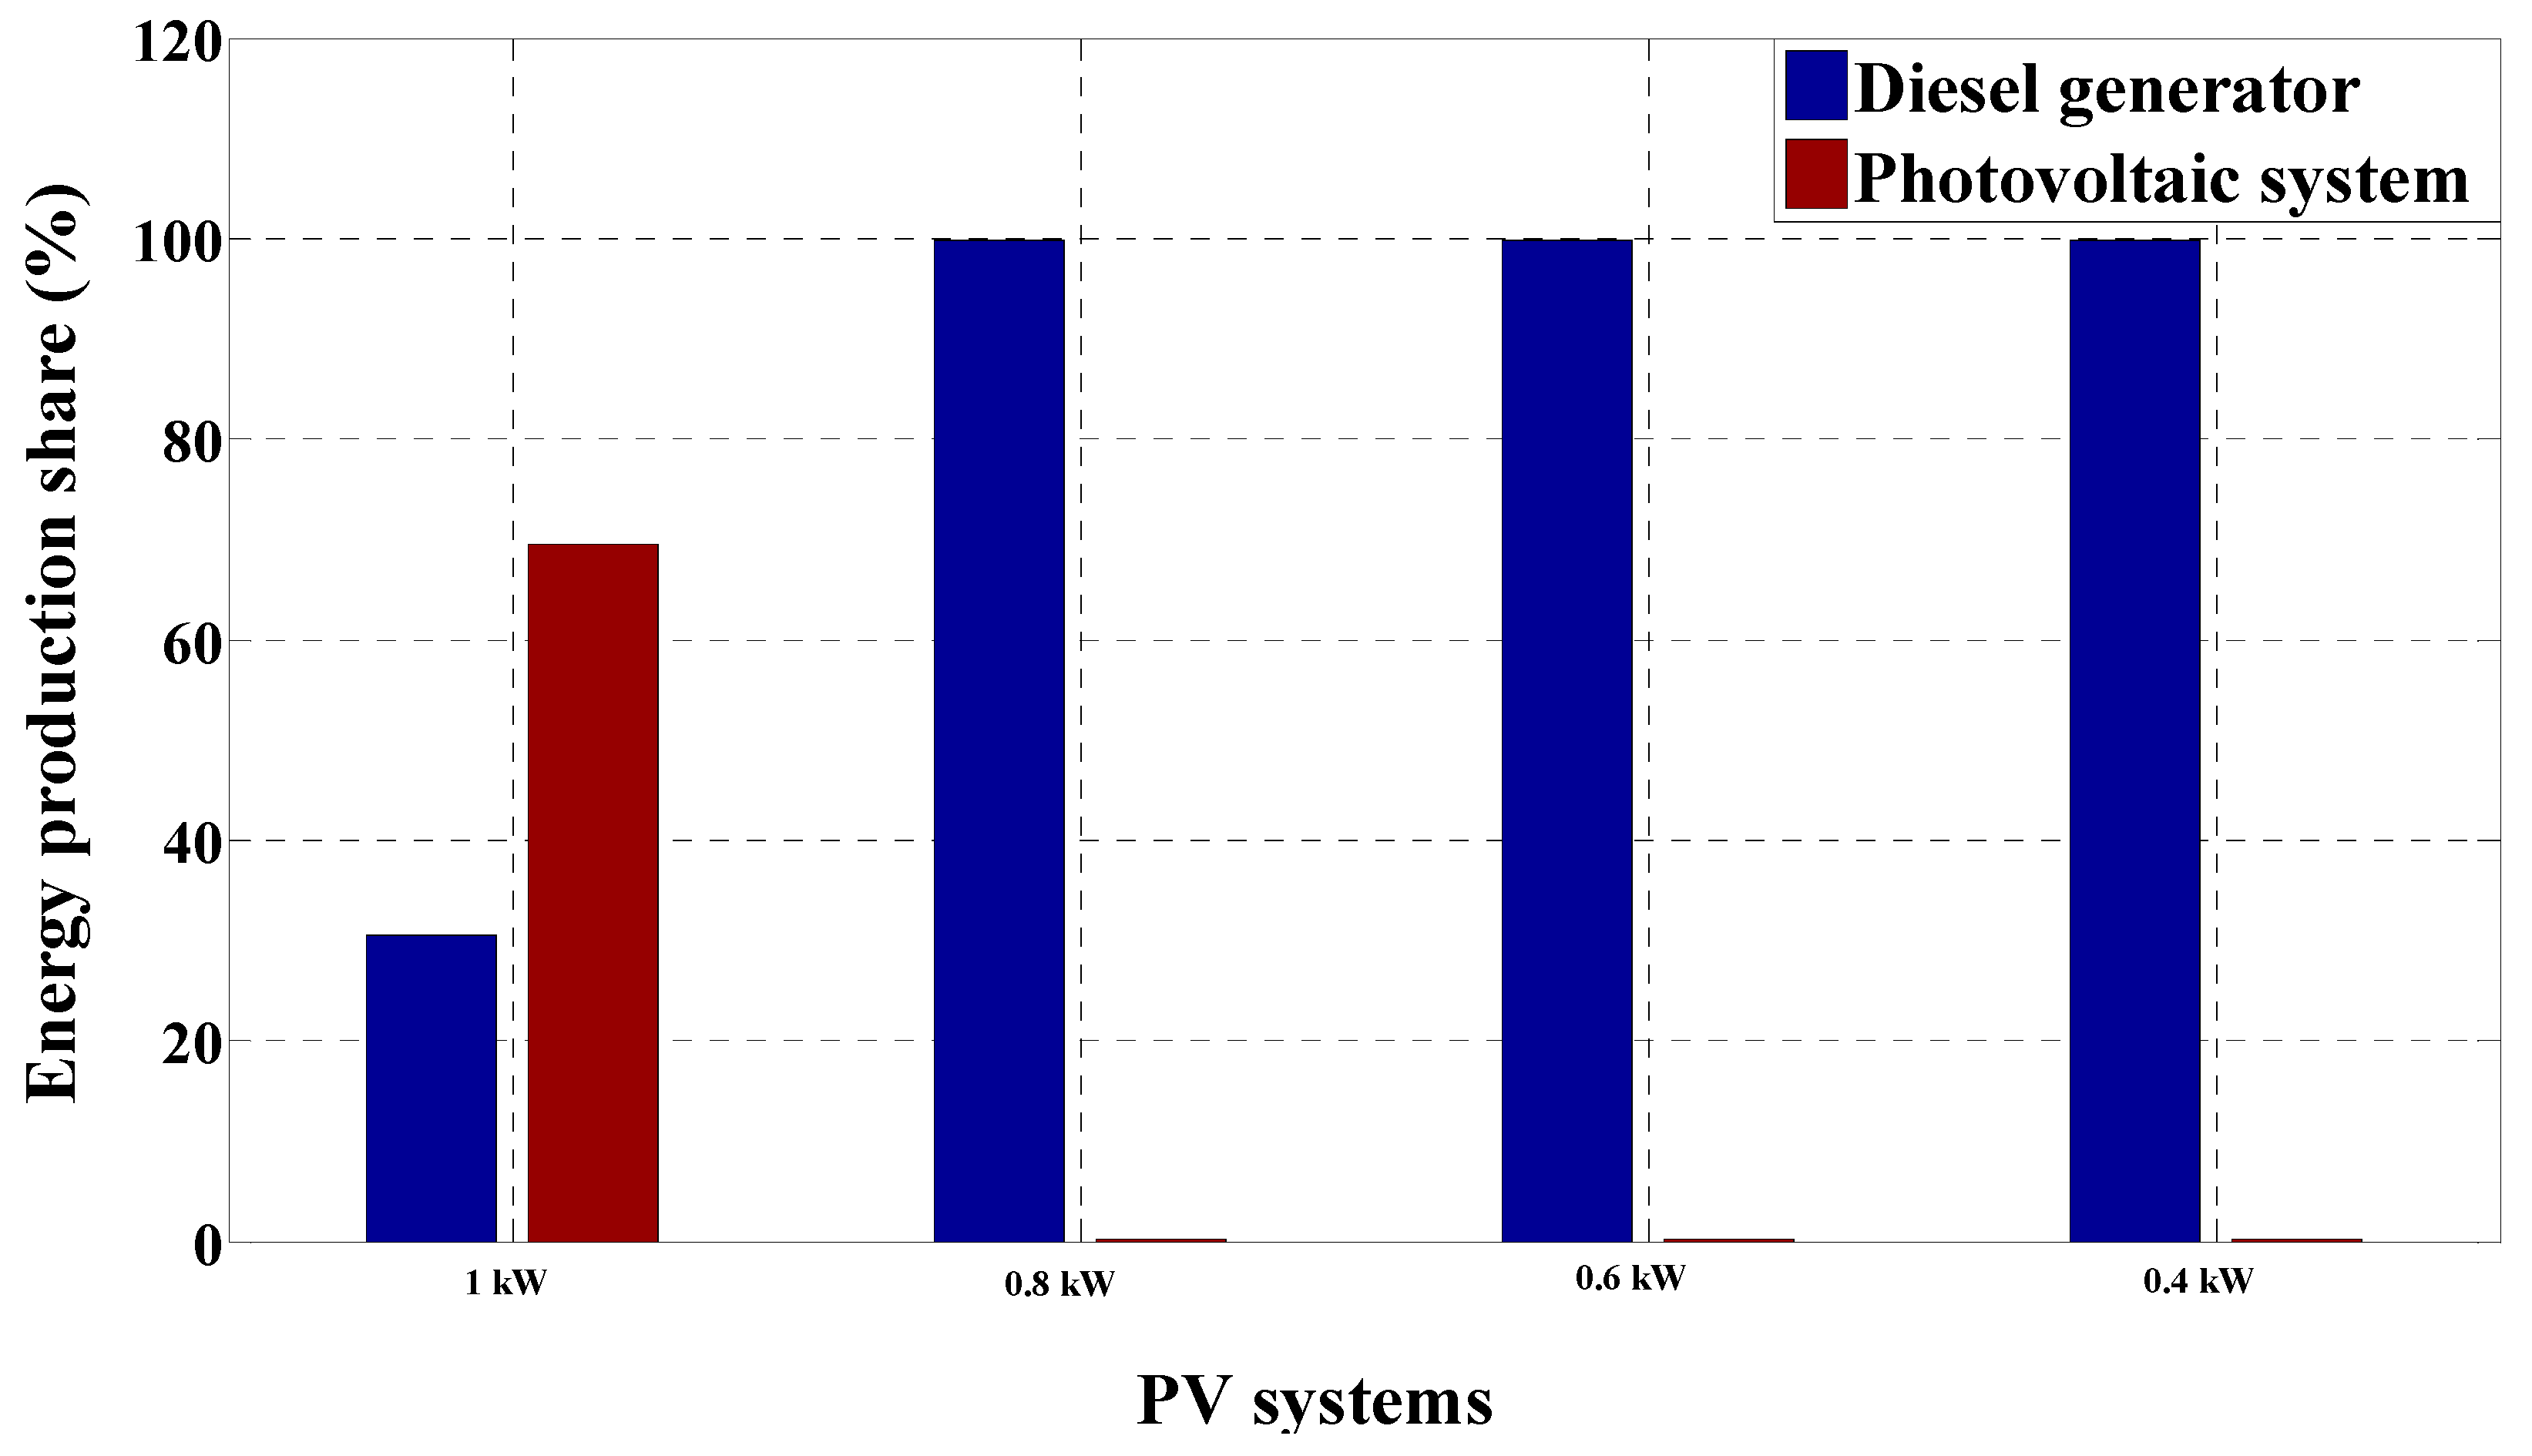
Figure 11 above, when 1 kW of PV system plus diesel generator is applied, the energy production is more than double other PV sizes due to the highest share of the PV system in the total production. Regardless of the PV sizes, 1 kW, 0.8 kW, 0.6 kW and 0.4 kW produced nearly the same amount of energy and most energy coming from diesel generator as shown in
Figure 12 below.
The total power generated by the PV arrays when the diesel generator is added increases, and this uses the solar irradiance as retrieved for the case location of Gwakwani Village. The solar irradiance fluctuates throughout the year with the highest months from January to March, September to December, while it dips at its lowest months from 12 March to 10 September (see
Figure 1).
The wasted energy is higher in 1 kW PV size compared with other scenarios due to the absence of energy storage equipment during the period of high PV productivity and low demand.
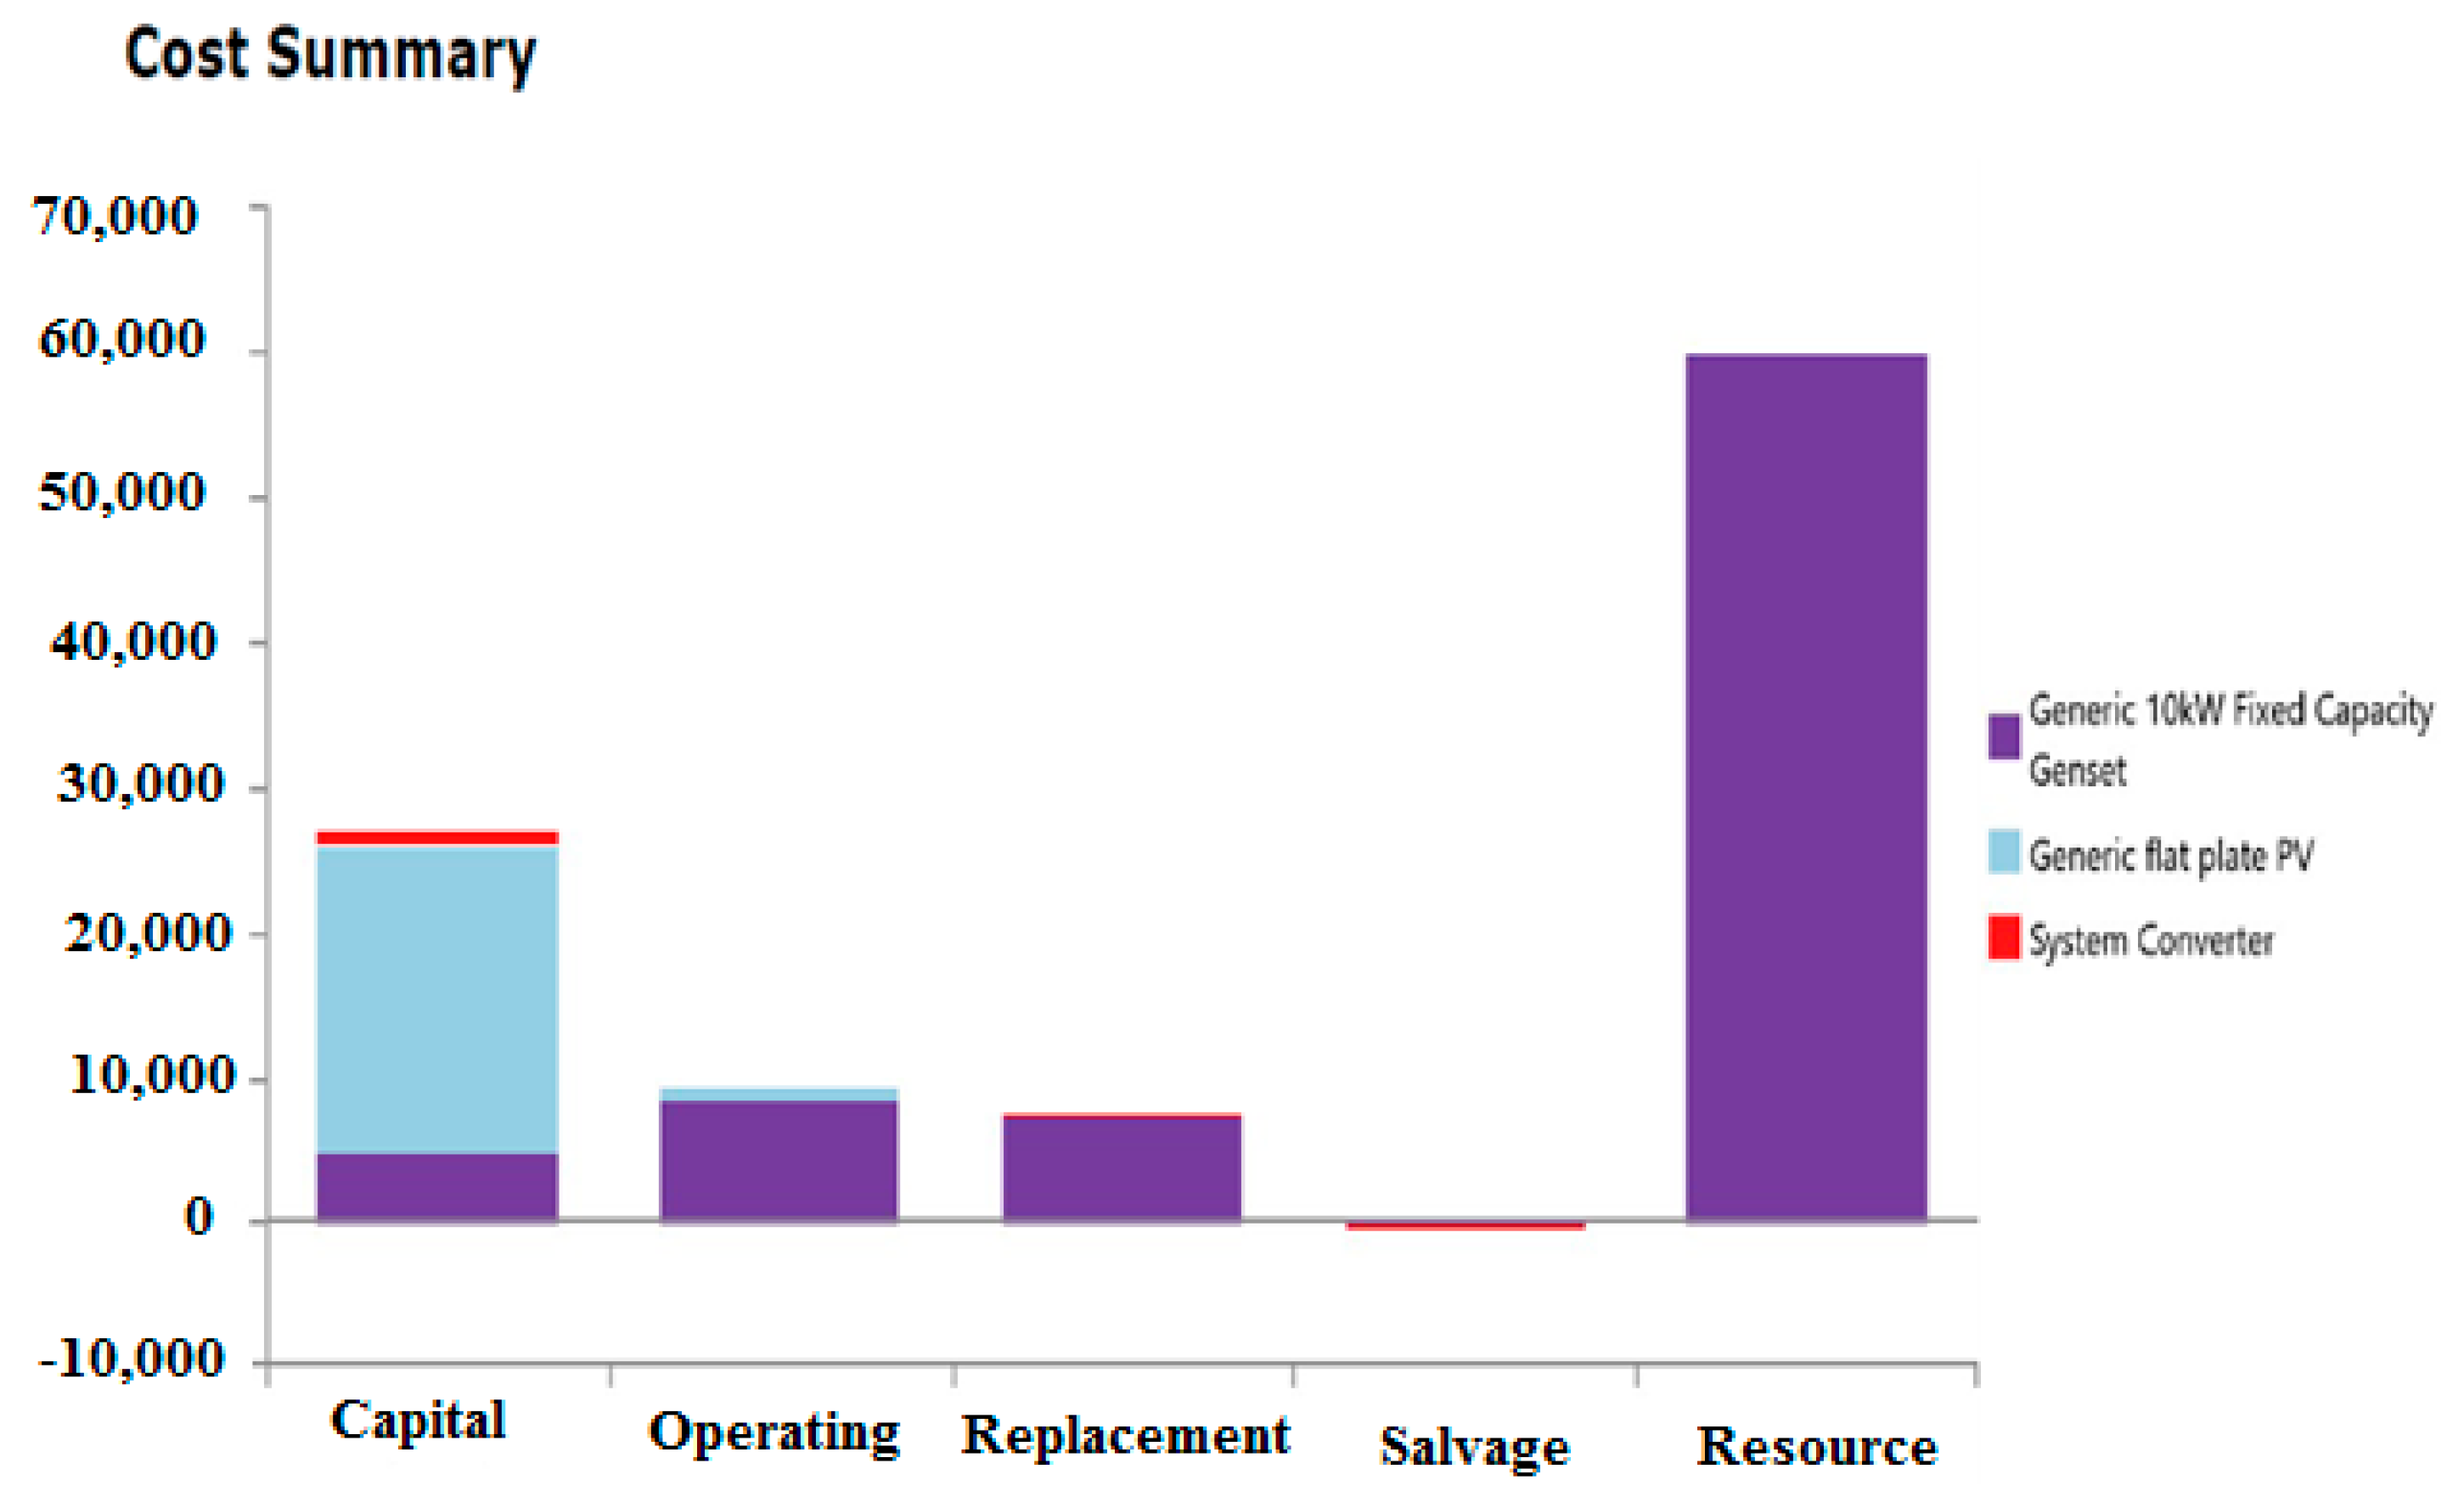
However, in other scenarios the surplus energy comes from a mismatch between the diesel generator production and demand since the diesel generator is operating at full capacity at any time of operation regardless of the required energy demand. The surplus energy is estimated to be 15,734 kWh, 4922 kWh, 4922 kWh, and 4922 kWh for 1, 0.8, 0.6, and 0.4 kW system sizes respectively; which is wasted without proper storage units. In terms of demand satisfaction, all scenarios can meet the total demand without any deficiency due to the sustainable and efficient source of energy (diesel generator). The cost details of the total system under different PV sizes are presented in
Figure 13 and
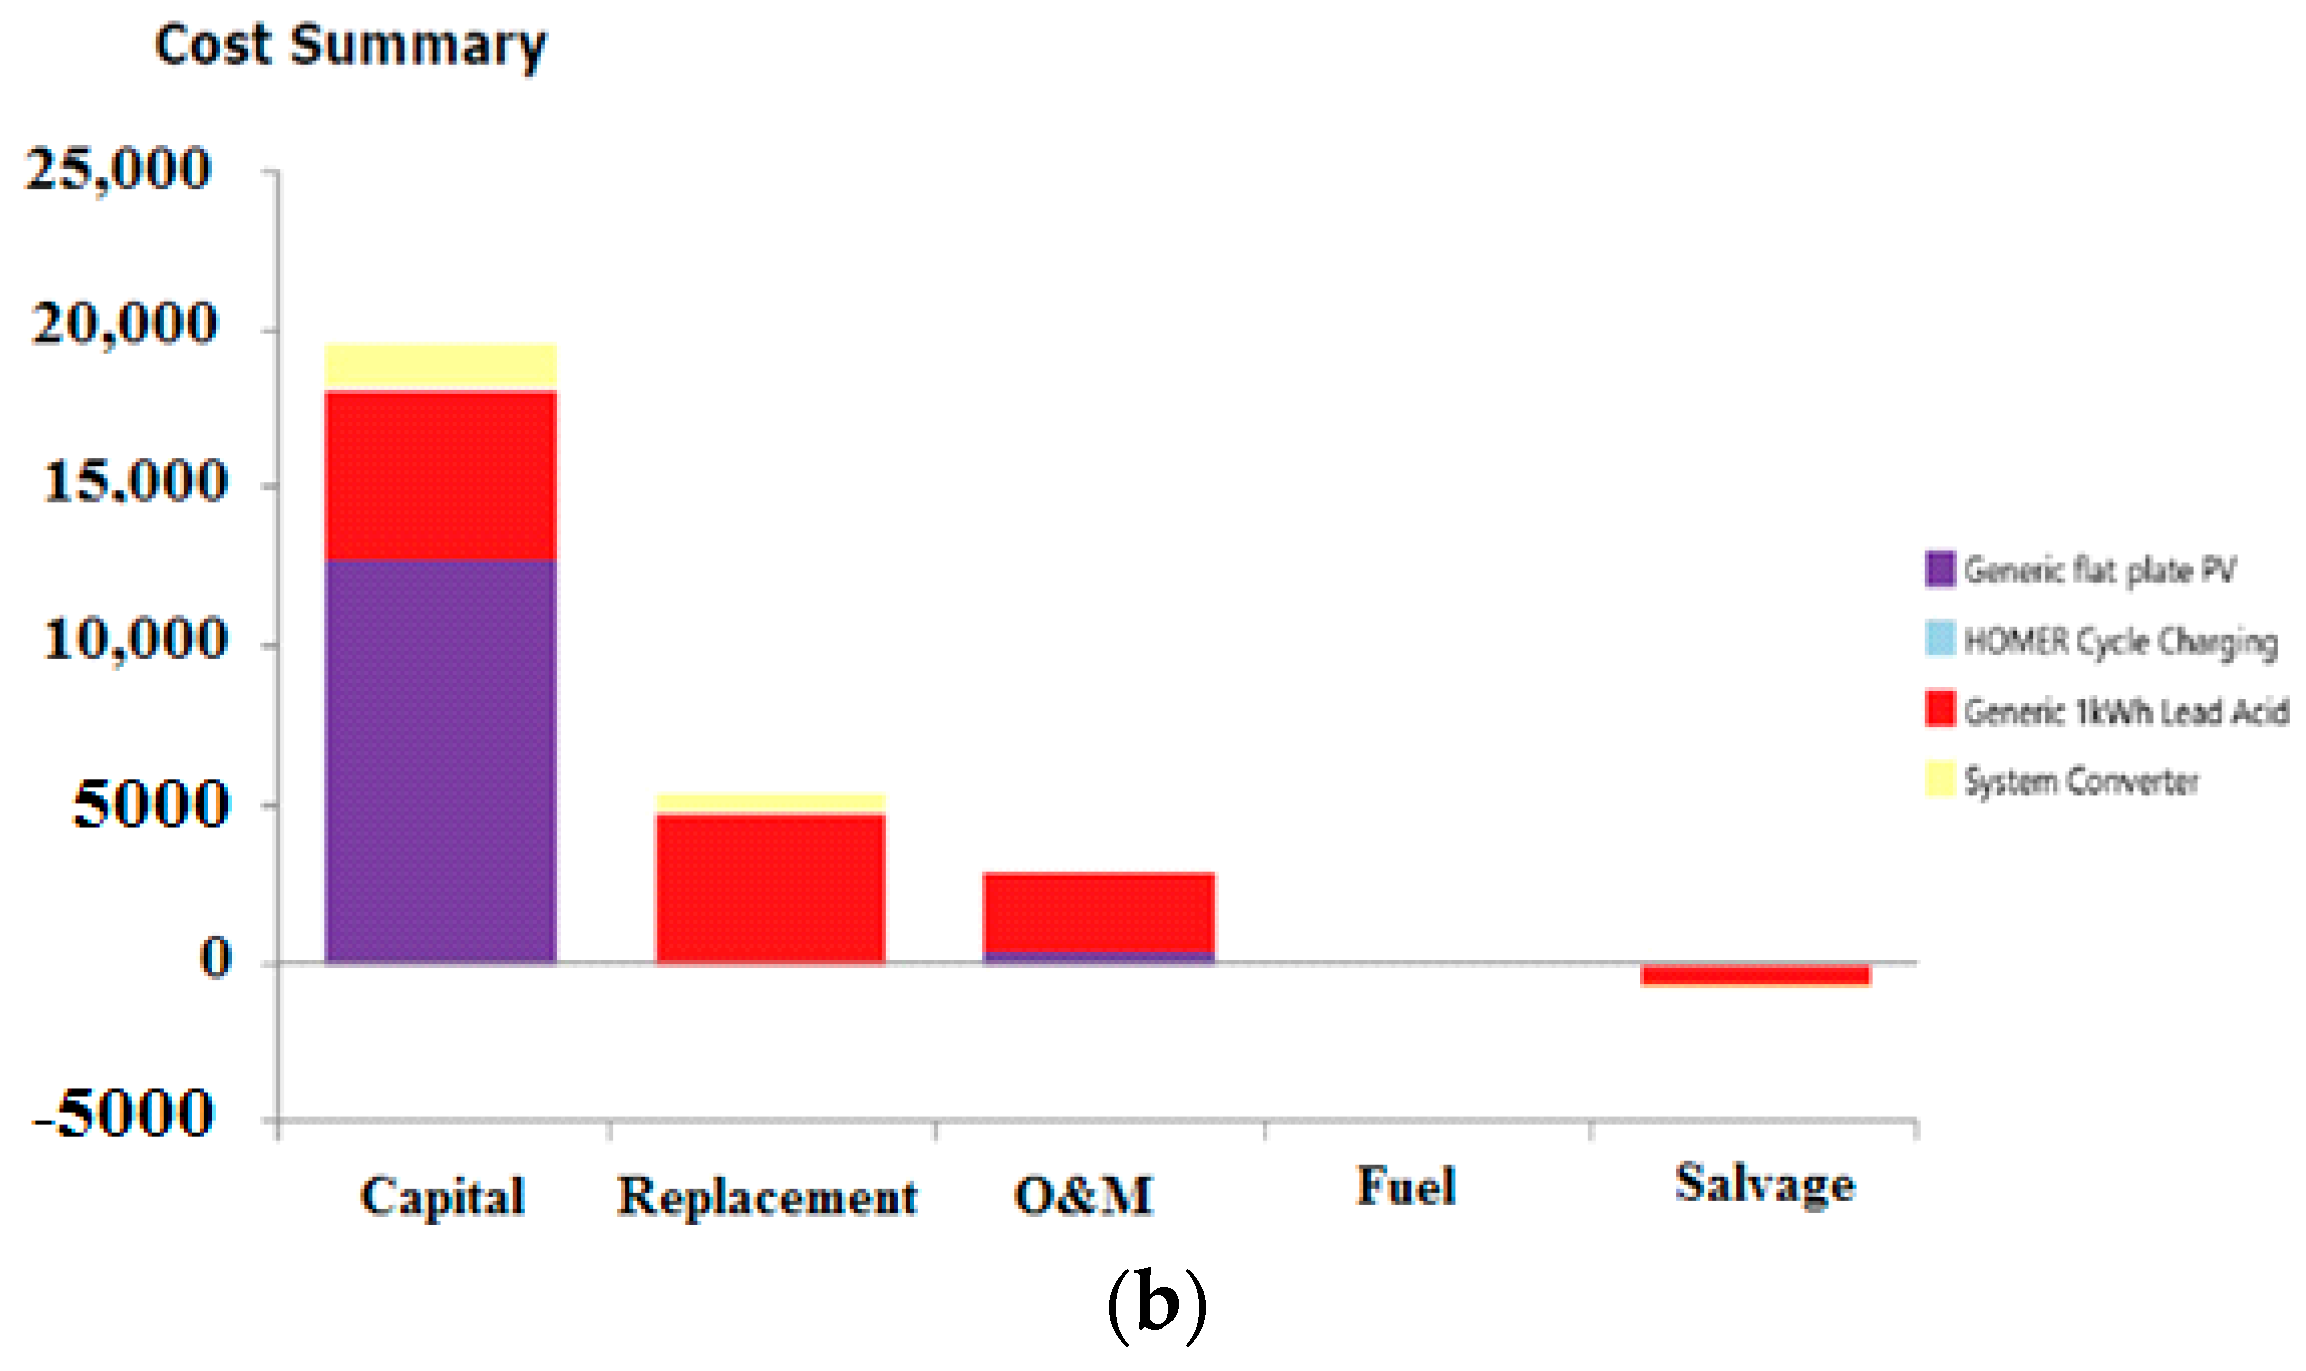
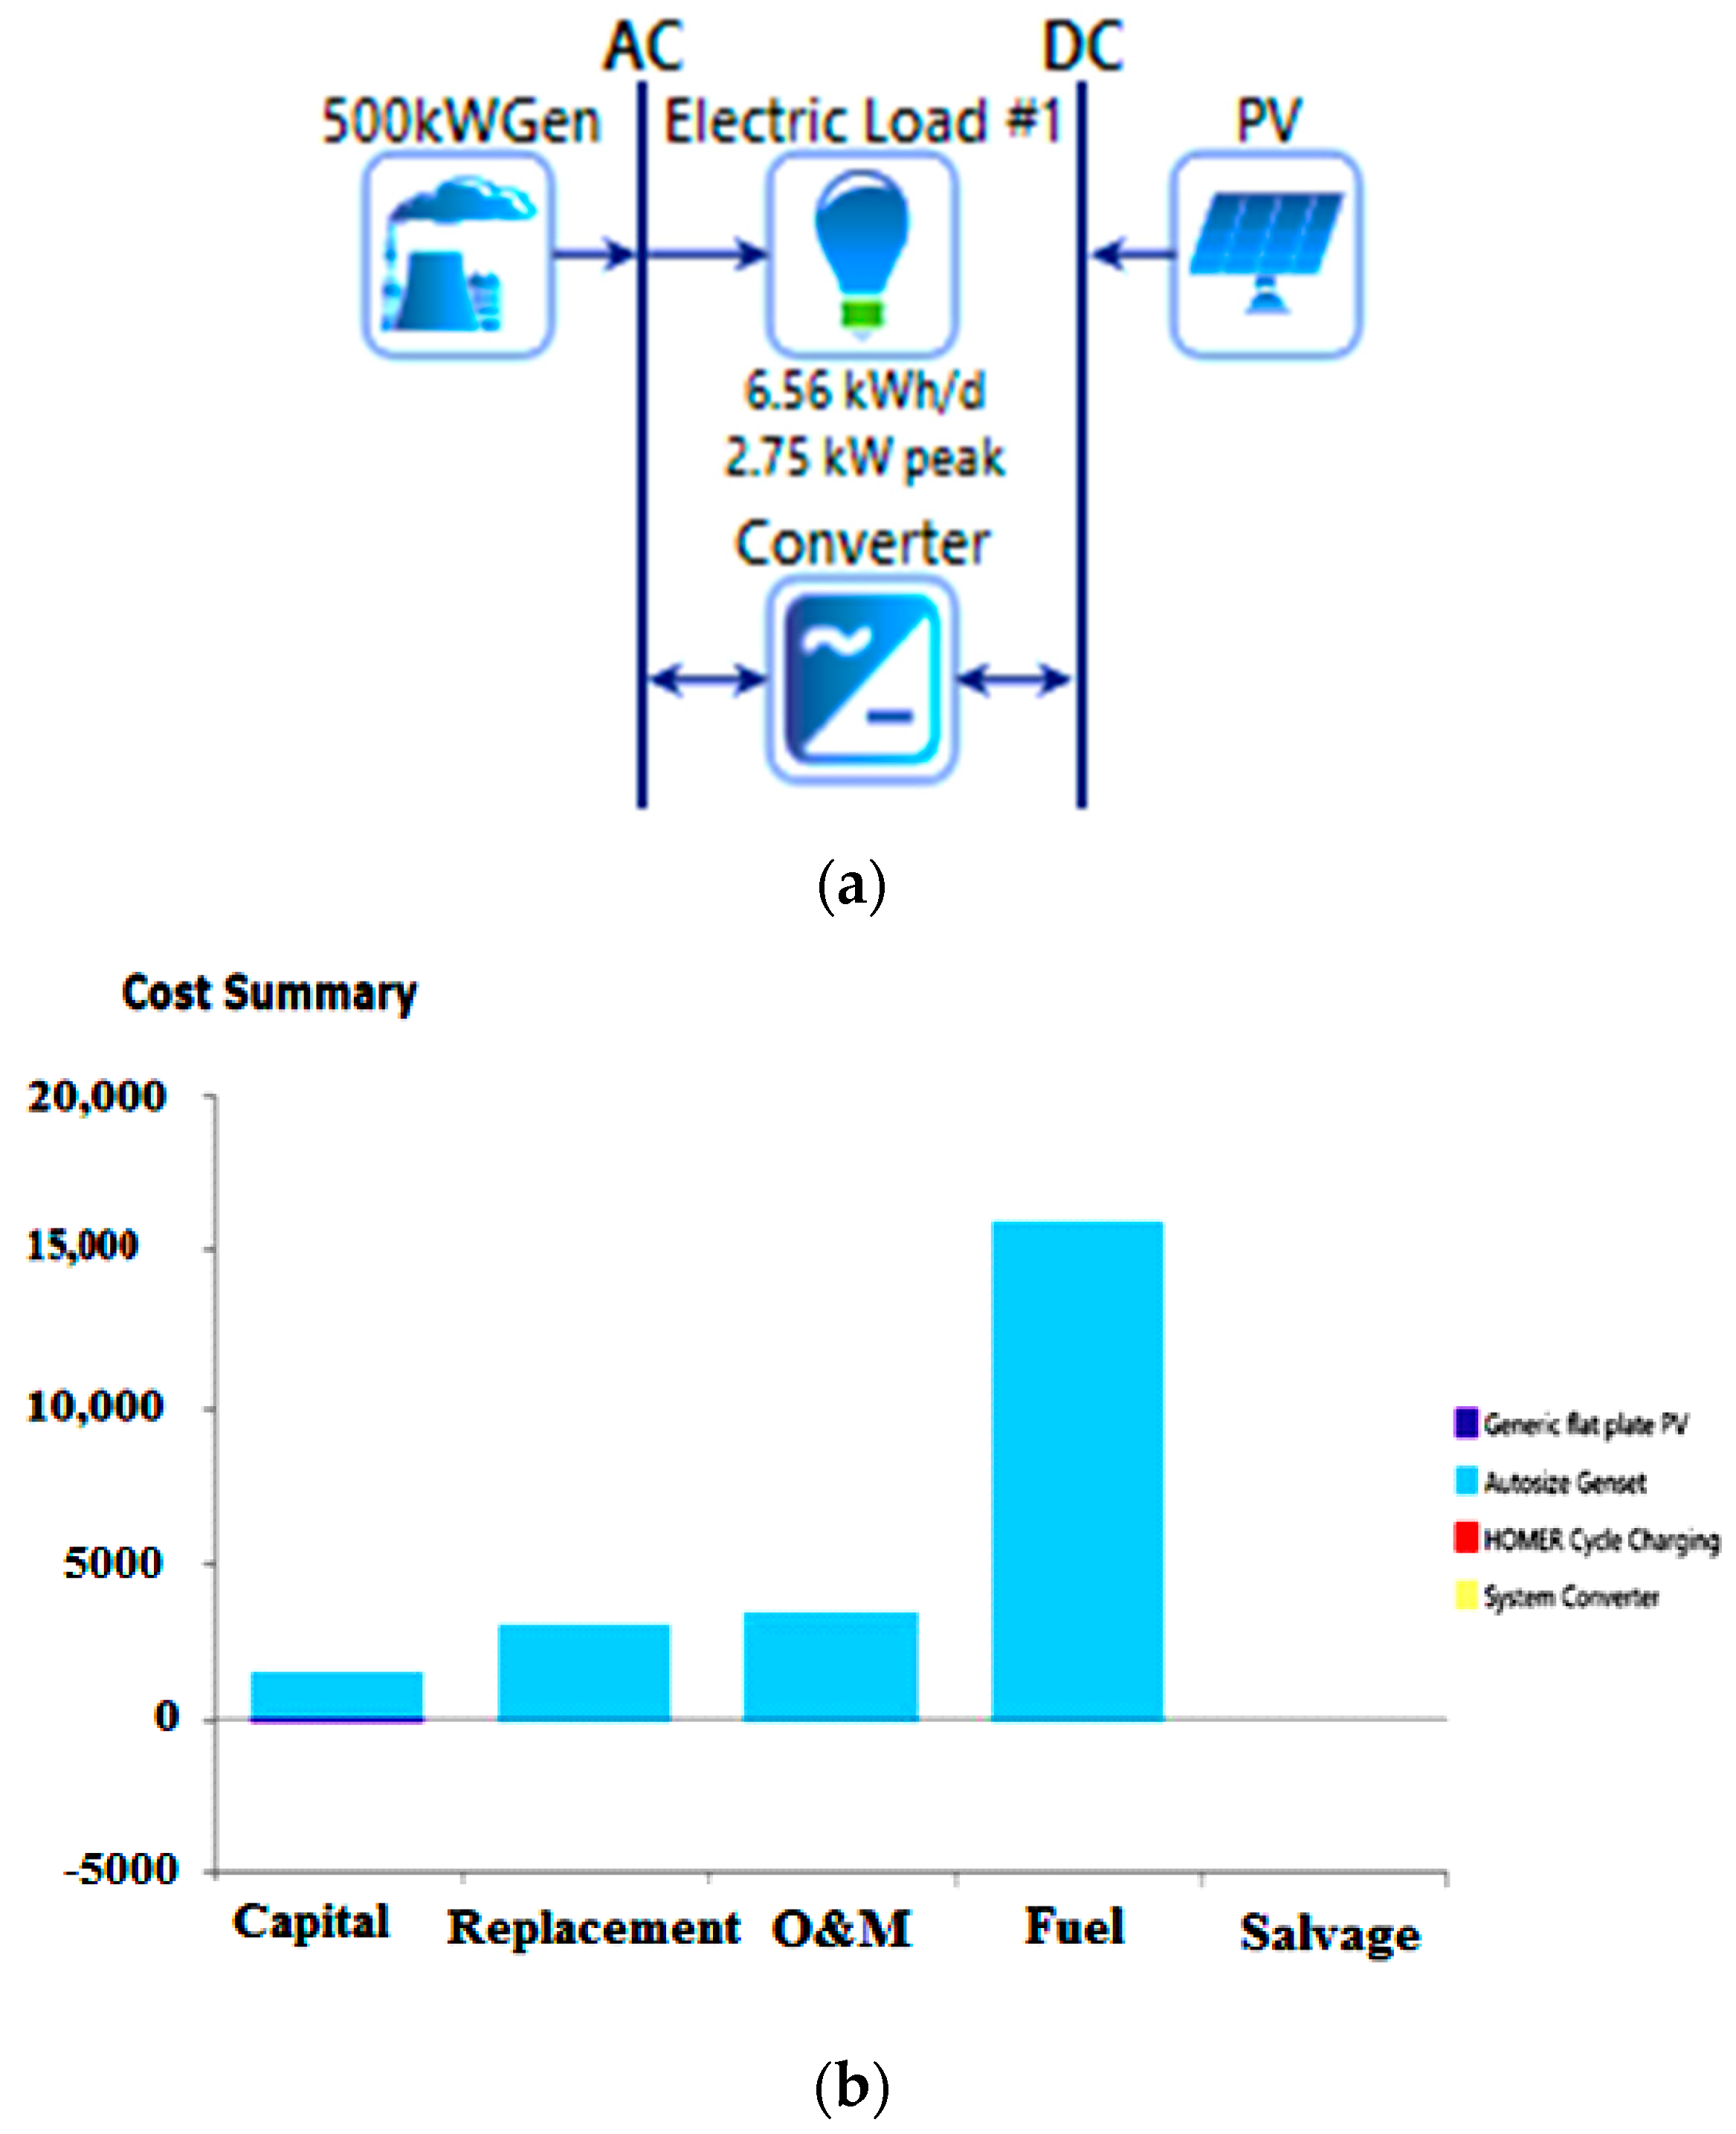
Figure 14.
There is a clear share of the 1 kW PV in the total capital cost of the system since the size is relatively high compared to other tested sizes and the PV. The PV system (1 kW) is responsible for nearly 60% of the total production. However, in other scenarios, most costs come from the diesel generator as in
Figure 14 and the resources cost represents the highest part of the cost in both sizes since the fuel price is quite high. Other sizes will be same as in
Figure 14. The effect of diesel operation on the environment can be considered as one of main disadvantage of this scenario, especially if the system extended to include more villages. More cost can be added to the system due to the emissions and based on the social carbon cost (SCC) of South Africa. The carbon dioxide (CO
2) is 6.9 ton/year for first year in contrast with 9.1 ton/year in other scenarios. The difference in emissions can be linked to the operation hours of diesel generator in each scenario. For 1 kW scenario, diesel generators were running for 2219 h/year whereas the running hours was estimated to be 2920 h/year. Finally, the average price of energy per kWh was 3.34
$/kWh in first scenario in contrast 3.4
$/kWh in other scenarios. To sum up, first scenario can be considered as a best optimum scenario based on the system cost, pollution levels and energy price. The first scenario has less surplus energy than scenario two, but slightly more surplus than scenario three. Scenario three has more CO
2 emissions than the first scenario and it also has a higher net present cost (see
Table 5 below).
5. Discussion
HOMER Pro as used for this study analysis is distinctively different from HOMER Grid. It enables start-up designs for regions such as Gwakwani lacking in any form of variable data for analysis and connectivity and access to grid. The simulation results give an overview into the viability of a HRES with the potential for further expansion in a HOMER Grid, if the demand arises [
10,
23,
29]. A simulation of the energy demand load requirement is necessary before the optimal planning design of the HRES and the configuration of the system is also dependent on the output power for generation and the load on the system [
4,
38]. It is important to consider the reliability status of the entire system, and while the reliability is considered to be relatively higher in a HRES (which is often a combination of both renewable and non-renewable resources), there is noticeably a considerable amount of savings on the total annualized costs associated with the system [
18].
In HOMER, the distribution of the energy system is regulated by the dispatch strategy and controller systems, where the economic dispatch controllers CC and LF and are pre-set at default in HOMER and this enables the system design to match the load without any considerations for future adjustments. Due to this operational strategy (which is active only in the moment), the LF dispatch strategy of the diesel generators enables it to produce just enough power to serve the load, without producing any surplus energy [
28]. While in the CC dispatch strategy, the generators produce as much power as required, without producing excess electricity and then further charges generators with the surplus power [
23]. This allows the engine to operate storage and power sources to serve the load in a systematic way through a dispatch strategy, with the deferrable load of higher priority to battery charging. The dispatch strategies used in the three scenarios are:
Scenario (1) PV-Battery: Cycle Charging (CC)
Scenario (2) PV-Diesel Generator: Cycle Charging (CC)
Scenario (3) PV-Diesel Generator plus Battery: Load Following (LF)
Comparison between PV-Battery Scenario and PV-Diesel Generator Scenario
The comparison will include only 1 kW PV system since this was observed as the optimal mode of operation in each scenario. Based on the result above, the operation of photovoltaic with the battery has many advantages in contrast with its operation with diesel generator. There is a clear difference in system costs and energy price per kWh between different scenarios, regardless of its economic advantages. The operation of the photovoltaics with battery has no emissions—and this can be an added feature benefit in environmental factors. The comparison summary between these scenarios is given in
Table 5.
6. Conclusions and Future Work
Renewable energy-based off-grid rural electrification programs are one of the most effective ways to increase access to energy in remote areas of developing countries. In this paper, three scenarios of off-grid system have been investigated and compared to provide sustainable energy for a small village in South Africa. These scenarios are (1) PV-battery system, (2) PV-diesel generator and (3) PV—both diesel generator and battery system. Based on this research analysis both battery and diesel generator systems achieved the same objective function of backing up the PV system at periods of supply shortages. The four different PV sizes used in each model scenario indicated different optimal sizes and this was used as the rallying point for optimization. The optimal size selection satisfied the criteria conditions of: overall system cost, pollution emissions and demand satisfaction. As it is presented in the result section in scenario (1) the PV-Battery model—1 kW PV size was the optimal option between all sizes. The total cost of this size is the cheapest between all sizes which was approximately $26,916.03 compared with $27,053.39, $27,311.95, and $27,484.29 for 0.8 kW, 0.6 kW and 0.4 kW. This leads to the cheapest energy price per kWh between all sizes. Other advantages can be noticed in 1 kW size related to the demand satisfaction and battery degradation.
In scenario (2) the PV-Diesel Generator model, same size (1 kW) was the optimum in contrast with other scenarios. The power share of the PV system in 1 kW size is nearly 60% of the total energy produced whereas the share is nearly zero in other scenarios. In terms of the pollution, 6 tCO2/year is released by 1 kW scenario compared with 9.6 tCO2 in other scenarios. The only problem with this scenario is the wasted energy will be higher than other scenarios.
In scenario (3) the PV-Diesel Generator and Battery model, adequately satisfies demand with a surplus energy of 3508 (kWh/year) and energy price per 4.55 ($/kWh), the emissions rates however are 295 (kg/year) and the system net present costs at $140,970.60 ($/year).
The three model system scenarios can be used for electrification and match the energy demand at some considerable cost. The optimal solution however, ensures a more reliable cost-beneficial system as seen in scenario (1). The costs of adopting scenario (3) is not economically viable for a small village setting such as Gwakwani at
$140,970.60 NPC, however the surplus energy per year of 3.508 (kWh/year) indicates the potential for cost minimization through the application of economics of scale, which is a more viable option. This would be more beneficial if the Gwakwani village had access and connection to a grid system to supply surplus energy at a fixed cost, to earn income and invariable reduce CO
2 emission. Thereby offsetting the initial capital investment costs of
$157,253 in the scenario (3) model. Also, the combination of the PV-wind system is economically beneficial for remote areas with less than a daily load of 75 kWh/day and a load point of 50 km or more away from grid [
18]. This situation is characteristic to the Gwakwani village with a daily load point of 6.56 kWh/day. With the source of sustenance of the Gwakwani village is farming and agriculture; biomass and wind are available renewable energy resources which can be further considered in a more detailed simulation analysis using biomass and wind turbine; based on the results, this can be added, swapped, or supplemented with the PV in a techno-economic assessment. Alternatively, this can be applied as a standalone system and compared. A simple tariff builder system can also be installed to evaluate costs per kWh of each family unit (in a demand-side response) to give allowance for any future increase.
Lastly, while the optimal sizes aim to satisfy three main conditions of system cost, pollution emissions and demand satisfaction, distinctive disparities exist between the model scenarios. The first and second scenario can sufficiently meet the demand without any a considerable interruption. The reliability of the system is significantly reduced in a HRES with an uneven power sharing control dynamic in the DC/AC Bus connection, which can occur when the system malfunctions in the DC/AC converter, since the main challenge of power sharing is to achieve a desired load distribution when the system is connected to a DC-bus configuration and the AC power is lost (due to malfunctioning) [
4]. The size under PV-Battery scenario (1) does not release any harmful emissions compared with nearly 6 tCO
2/year in PV-Diesel scenario. There is a huge different in cost between these scenarios. The cost in PV-Battery represents 26% of the cost in PV-Diesel Generator scenario. In addition to all the mentioned differences that clearly support the PV-Battery scenario, there is a global trend towards enhancing renewable energy penetration and this approach requires a high capacity to store energy in several ways, including batteries, flywheels, and hydrogen. This will inevitably lead to a reduction in the storage technique prices. In contrast, the emission penalty is increasing, and most industrialized countries are trying to move away from conventional fuels to preserve the environment and build a strong and sustainable economy. Future research studies will include more appliances to accommodate the wasted energy, and different energy storage techniques can be tested and compared with batteries. A controller system dynamic model using either a MATLAB simulation or a combined dispatch algorithm which modulates start time, finish time and allows for an out-of-the-box controller algorithm which enables a flexible design to recalibrate itself in periods of higher energy demand, solar irradiation fluctuations and other unforeseen climatic challenges, storage and high emissions is proposed to actively choose between the LF and CC strategies at every step of the process.


