Tailings Dams Failures: Updated Statistical Model for Discharge Volume and Runout


Abstract
:1. Introduction
2. Materials and Methods
- A generalized linear model (glm) with the Gaussian family using a log link function (Dmax.2 in Table 2).
- A model Dmax.3 which uses the new predictor Hf.
3. Results and Discussion
3.1. Released Volume of Tailings
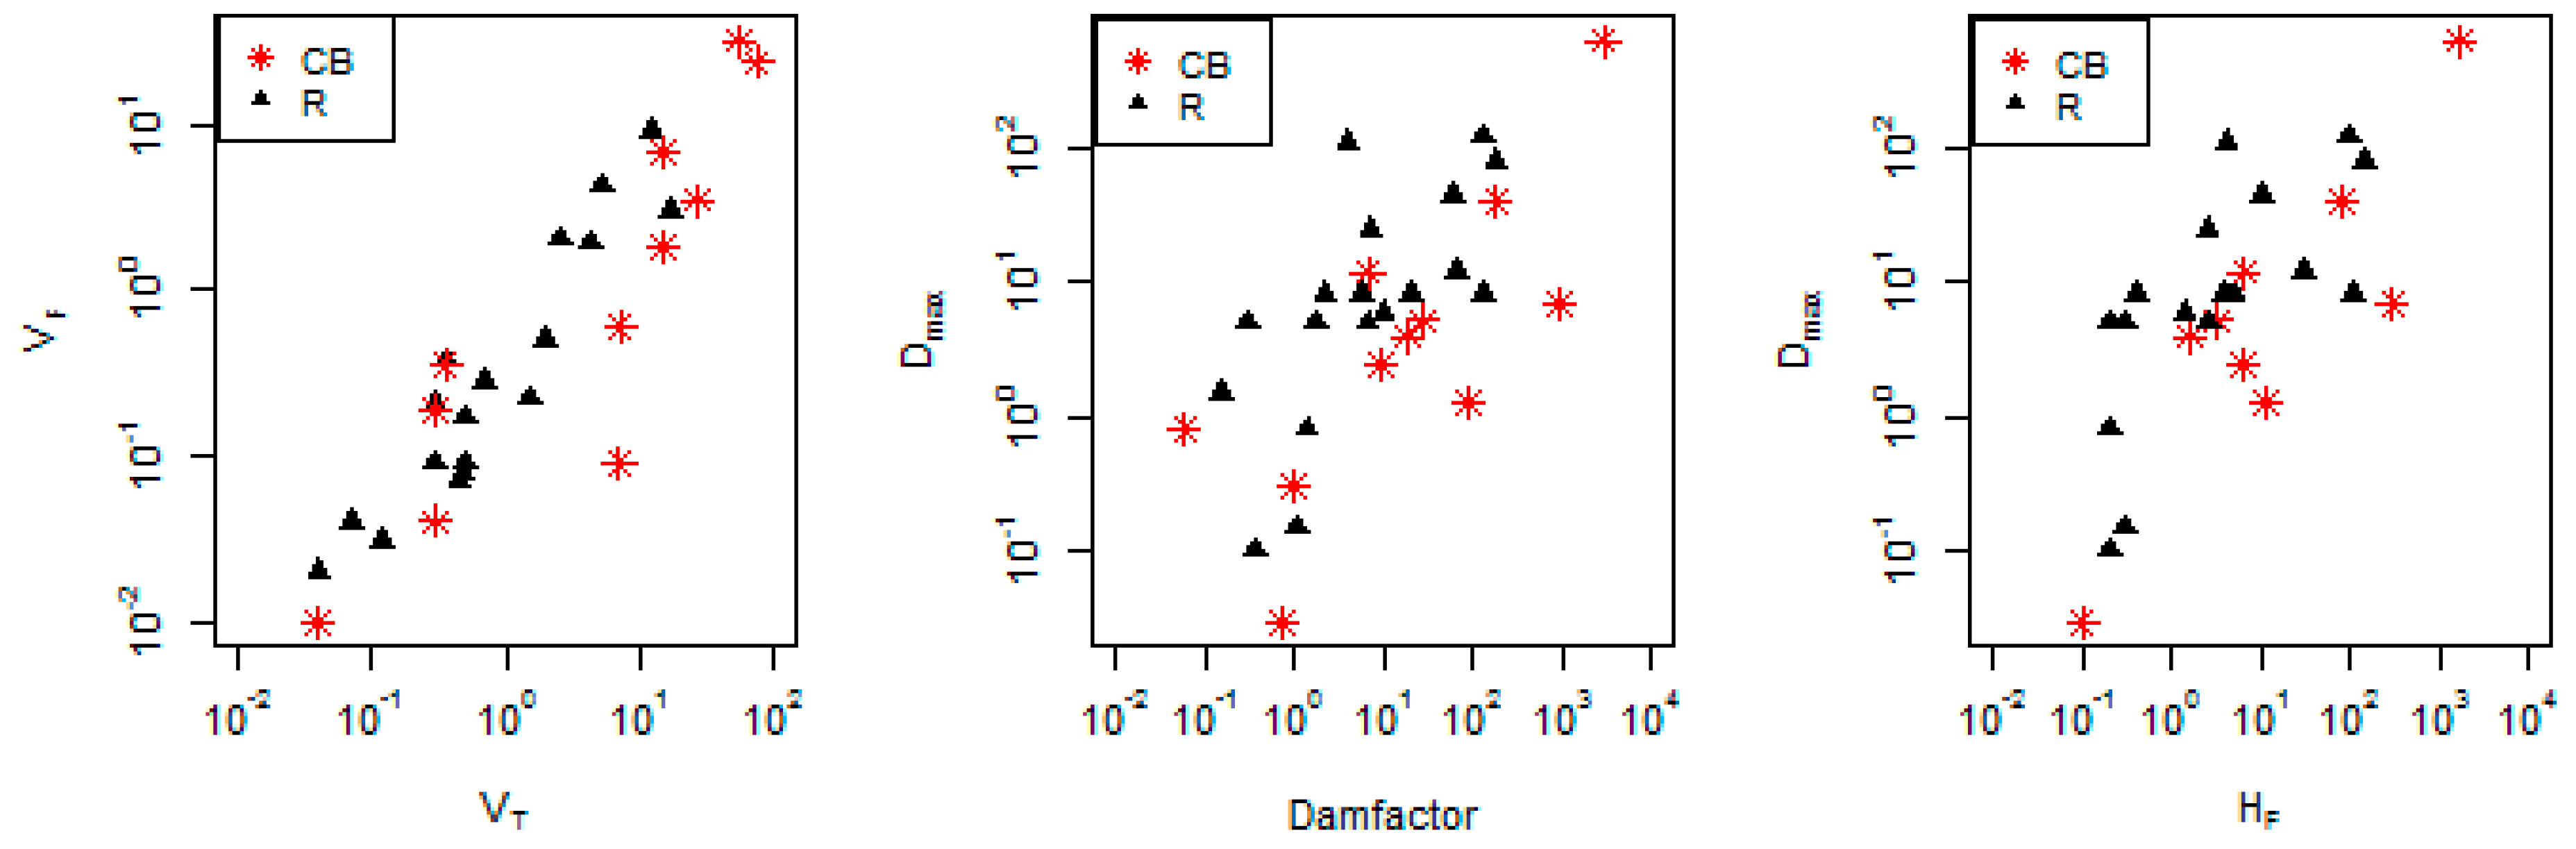
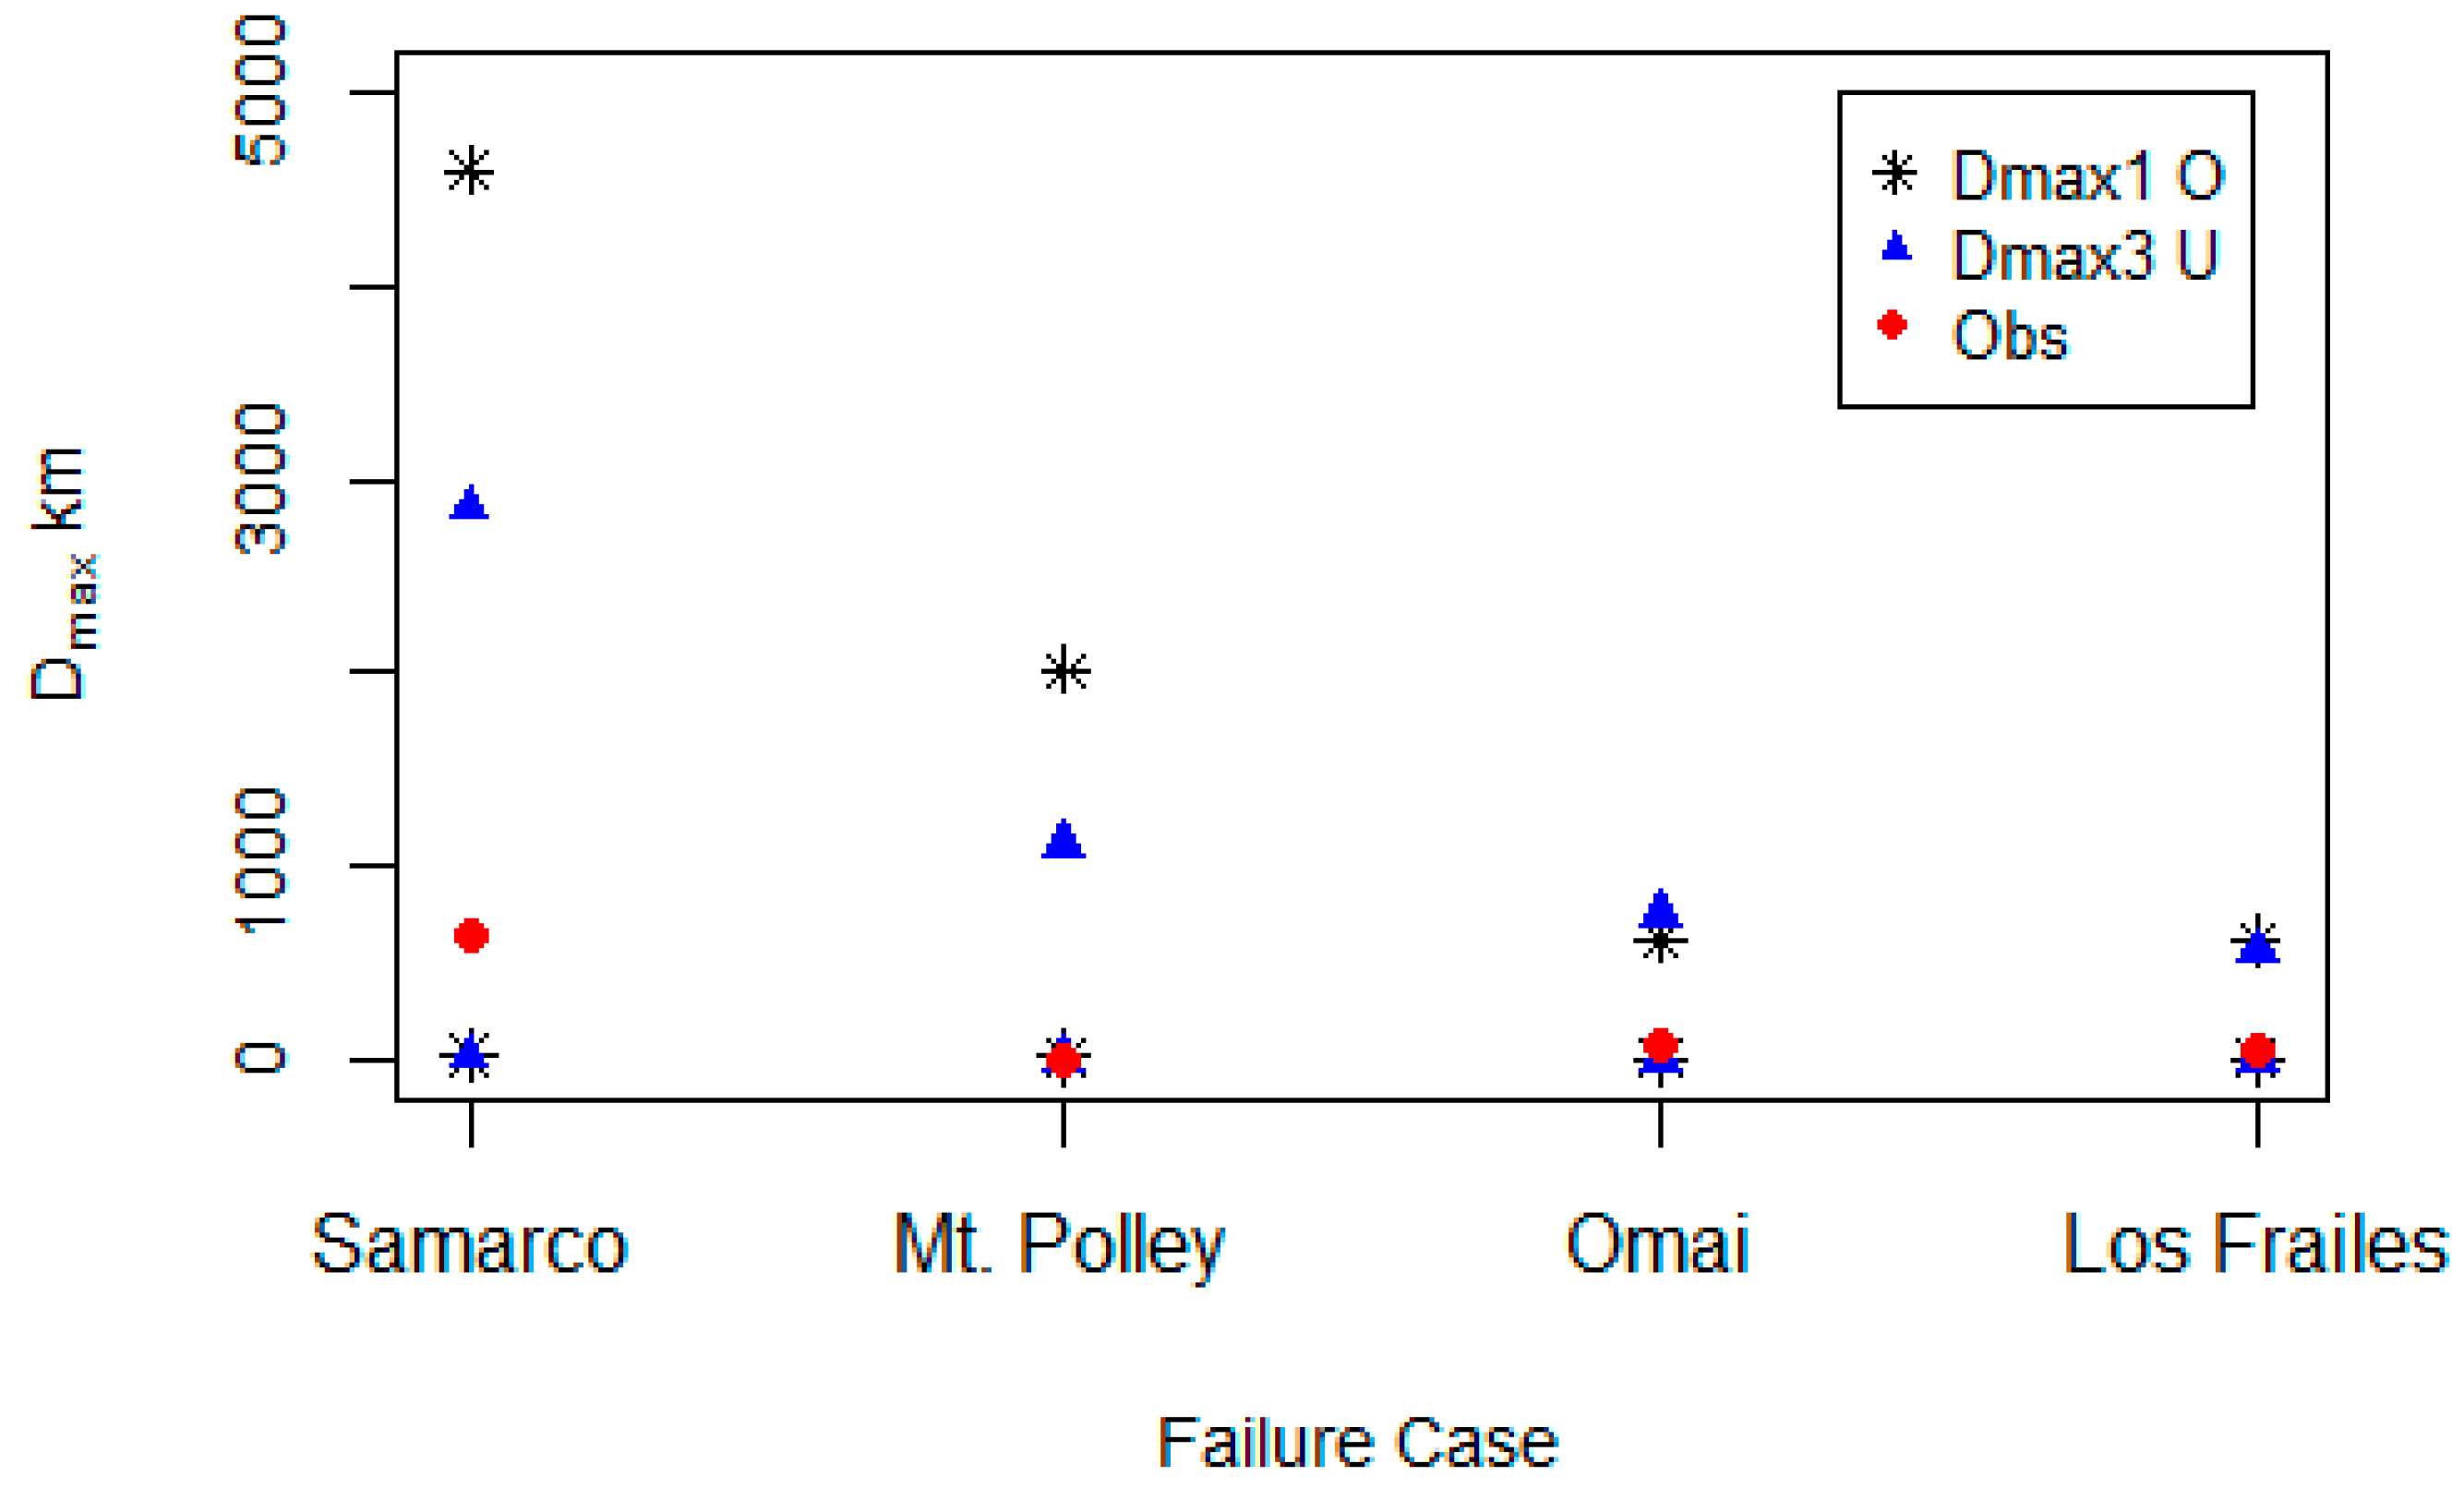
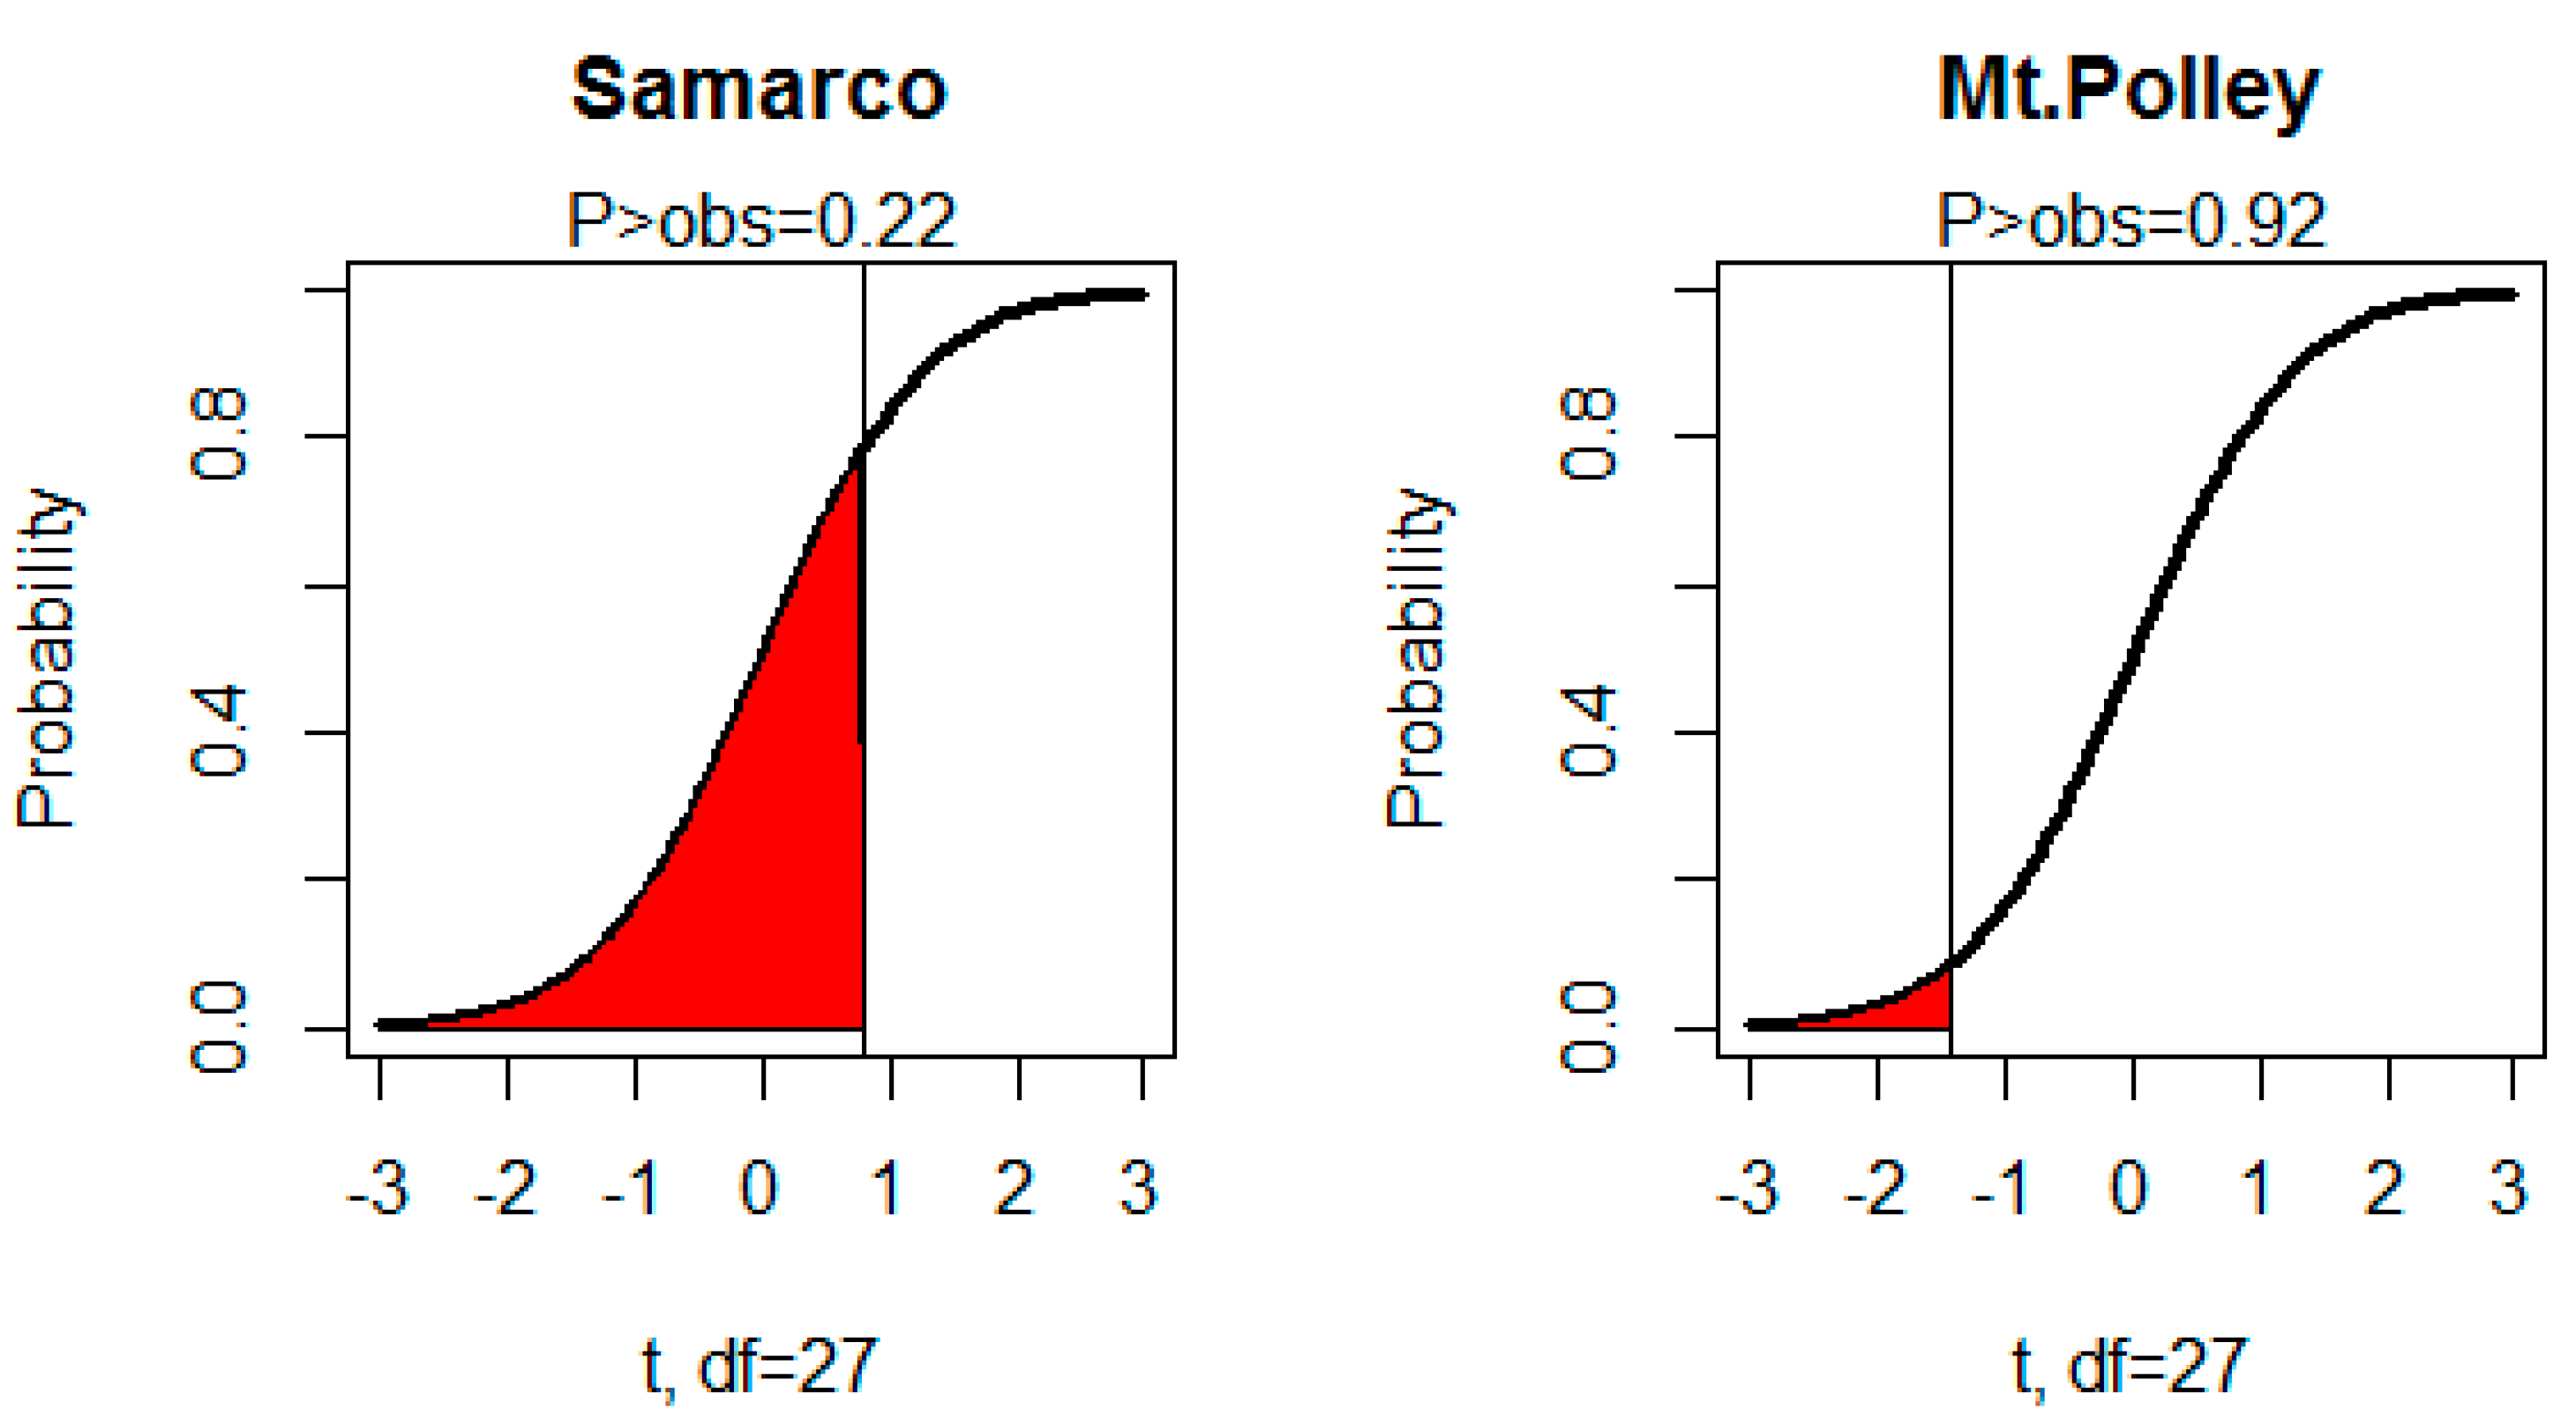
3.2. Run-Out Distance (Dmax)
4. Conclusions
Acknowledgments
Author Contributions
Conflicts of Interest
References
- BHP Billiton Results for The Year Ended 20 June 2016. Available online: http://www.bhp.com/-/media/bhp/documents/investors/news/2016/160816_bhpbillitonresultsyearended30june2016.pdf?la=en (accessed on 1 July 2017).
- Form 20-F, Annual Report Pursuant to Section 12 or 15(d) of the Securities Exchange Act of 1934. Available online: http://www.vale.com/EN/investors/information-market/annual-reports/20f/20FDocs/Vale_20-F_FY2016_-_i.pdf (accessed on 1 July 2017).
- Renova Foundation Update. Available online: http://www.bhp.com/-/media/documents/media/reports-and-presentations/2017/170607_renovafoundationupdate.pdf (accessed on 1 June 2017).
- Fernandes, G.W.; Goulart, F.F.; Ranieri, B.D.; Coelho, M.S.; Dalesf, K.; Boesche, N.; Bustamante, M.; Carvalho, F.A.; Carvalho, D.C.; Dirzo, R.; et al. Deep into the mud: Ecological and socio-economic impacts of the dam breach in Mariana, Brazil. Nat. Conserv. 2016, 14, 35–45. [Google Scholar] [CrossRef]
- Design of Tailings Dams and Impoundments. Available online: http://www.infomine.com/library/publications/docs/Davies2002b.pdf (accessed on 1 April 2017).
- Caldwell, J.A.; Van Zyl, D. Thirty years of tailings history from tailings & mine waste. In Proceedings of the 15th International Conference on Tailings and Mine Waste, Vancouver, BC, Canada, November 2011. [Google Scholar]
- Morgenstern, N.R. Improving the safety of mine waste impoundments. In Tailings and Mine Waste 2010; CRC Press: Vail, CO, USA, 2010; pp. 3–10. [Google Scholar]
- Strachan, C.; Caldwell, J. New directions in tailings management. In Tailings and Mine Waste 2010; CRC Press: Vail, CO, USA, 2010; pp. 41–48. [Google Scholar]
- Martin, V.; Akkerman, A. Challenges with conducting tailings dam breach studies. In Proceedings of the 85th Annual Meeting of International Commission on Large Dams, Prague, Czech Republic, July 2017. [Google Scholar]
- Rico, M.; Benito, G.; Diez-Herrero, A. Floods from tailings dam failures. J. Hazard. Mater. 2008, 154, 79–87. [Google Scholar] [CrossRef] [PubMed]
- Pierce, M.W.; Thornton, C.I.; Abt, S.R. Predicting peak outflow from breached embankment dams. J. Hydraul. Eng. 2010, 15, 338–349. [Google Scholar] [CrossRef]
- MacDonald, T.; Langridge-Monopolis, J. Breaching characteristics of dam failures. J. Hydraul. Eng. 1984, 110, 567–586. [Google Scholar] [CrossRef]
- Álvarez, M.; Puertas, J.; Peña, E.; Bermúdez, M. Two-dimensional dam-break flood analysis in data-scarce regions: The case study of Chipembe dam, Mozambique. Water 2017, 9, 432. [Google Scholar] [CrossRef]
- Cannata, M.; Marzocchi, R. Two-dimensional dam break flooding simulation: A GIS-embedded approach. Nat. Hazards 2012, 61, 1143–1159. [Google Scholar] [CrossRef]
- TSF Failures 1915–2017 as of 16 August 2017. Available online: http://www.csp2.org/tsf-failures-1915-2017 (accessed on October 2017).
- Blight, G.E.; Robinson, M.G.; Diering, J.A.C. The flow of slurry from a breached tailings dam. J. South. Afr. Inst. Min. Metall. 1981, 1, 1–10. [Google Scholar]
- Tailings Dams Risk of Dangerous Occurrences. Lessons Learnt from Practical Experiences. Available online: http://www.unep.fr/shared/publications/pdf/2891-TailingsDams.pdf (accessed on 11 January 2018).
- Chronologies of Major Tailings Dams Failures. Available online: http://www.patagoniaalliance.org/swp-content/uploads/2014/09/Chronology-of-major-tailings-dam-failures.pdf (accessed on 4 September 2014).
- Fonseca do Carmo, F.; Kamino, L.H.Y.; Tobias, R.; de Campos, I.C.; Fonseca do Carmo, F.; Silvino, G.; de Castro, K.J.S.X.; Mateus Leite, M.; Rodrigues, N.U.A.; et al. Fundão tailings dam failures: The environment tragedy of the largest technological disaster of Brazilian mining in global context. Perspect. Ecol. Conserv. 2017, 15, 145–151. [Google Scholar] [CrossRef]
- Los Frailes Tailings Incident, Mining & Environment Research Network. Available online: http://www.pebblescience.org/pdfs/LosFrailes.pdf (accessed on 25 April 1998).
- La Catástrofe de Aznalcóllar, X Aniversario: ¿Una Lección Aprendida? Available online: http://assets.wwf.es/downloads/_informe_2008.pdf (accessed on 1 April 2008).
- Van Niekerk, H.J.; Viljoen, M.J. Causes and consequences of the Merriespruit and other tailings-dam failures. L. Degrad. Dev. 2005, 16, 201–212. [Google Scholar] [CrossRef]
- Feng, C.; Wang, H.; Lu, N. Log-transformation and its implications for data analysis. Shanghai Arch. Psychiatry 2014, 26, 105–109. [Google Scholar] [PubMed]


| No | Mine | Year | H (m) | VT (×106 m3) | Dmax (km) | VF (×106 m3) | Failure Type a | Source |
|---|---|---|---|---|---|---|---|---|
| 1 | (unidentified), Southwestern USA | 1973 | 43 | 0.5 | 25 | 0.17 | SI | Rico |
| 2 | Aitik mine, Sweden (Boliden Ltd.) | 2000 | 15 | 15 | 5.2 | 1.8 | ER | CB |
| 3 | Arcturus (Zimbawe) | 1978 | 25 | 1.7–2 Mt | 0.3 | 0.0211 b | OT | Rico |
| 4 | Bafokeng, South Africa | 1974 | 20 | 13 c | 45 | 3 | SE | Rico |
| 5 | Balka Chuficheva, Russia | 1981 | 25 | 27 | 1.3 | 3.5 | SI | CB |
| 6 | Bellavista, Chile | 1965 | 20 | 0.45 | 0.8 | 0.07 | EQ | Rico |
| 7 | Bonsal, North Carolina, USA | 1985 | 6 | 0.038 | 0.8 | 0.011 | OT | CB |
| 8 | Cerro Negro No. (3 of 5) | 1965 | 20 | 0.5 | 5 | 0.085 | EQ | Rico |
| 9 | Cerro Negro No. (4 of 5) | 1985 | 40 | 2 | 8 | 0.5 | EQ | Rico |
| 10 | Churchrock, New Mexico, United Nuclear | 1979 | 11 | 0.37 | 110 d | 0.37 | FN | Rico/CB |
| 11 | Cities Service, Fort Meade, Florida | 1971 | 15 | 12.34 | 120 | 9 | SE | Rico |
| 12 | Deneen Mica Yancey County, North Carolina, USA | 1974 | 18 | 0.3 | 0.03 | 0.038 | SI | CB |
| 13 | El Cobre New Dam | 1965 | 19 | 0.35 | 12 | 0.35 | EQ | CB |
| 14 | El Cobre Old Dam | 1965 | 35 | 4.25 | 12 | 1.9 | EQ | Rico |
| 15 | Fundão-Santarem, Minas Gerais, Brazil (Samarco) | 2015 | 90 | 55 | 637 | 32 e | ST | CB |
| 16 | Galena Mine (1974) | 1974 | 9 | NA | 0.61 | 0.0038 | OT | Rico |
| 17 | Gypsum Tailings Dam (Texas, USA) | 1966 | 11 | 7 f | 0.3 | 0.085 | SE | CB |
| 18 | Hokkaido, Japan | 1968 | 12 | 0.3 | 0.15 | 0.09 | EQ | Rico |
| 19 | Imperial Metals, Mt Polley, British Columbia, Canada | 2014 | 40 | 74 | 7 | 23.6 | FN | CB |
| 20 | Itabirito (Brazil) | 1986 | 30 | NA | 12 | 0.1 | ST | Rico |
| 21 | La Patagua New Dam (Chile) | 1965 | 15 | NA | 5 | 0.035 | EQ | Rico |
| 22 | Los Frailes, near Seville, Spain (Boliden Ltd.) | 1998 | 27 | 15 | 41 | 6.8 g | FN | CB |
| 23 | Los Maquis No. 3 | 1965 | 15 | 0.043 | 5 | 0.021 | EQ | Rico |
| 24 | Merriespruit, South Africa (Harmony)-No. 4A Tailings Complex | 1994 | 31 | 7.04 | 4 h | 0.6 h | OT | CB |
| 25 | Mochikoshi No. 1, Japan (1 of 2) | 1978 | 28 | 0.48 | 8 | 0.08 | EQ | Rico |
| 26 | Mochikoshi No. 2 (Japan) | 1978 | 19 | NA | 0.15 | 0.003 | EQ | Rico |
| 27 | Olinghouse, Nevada, USA | 1985 | 5 | 0.12 | 1.5 | 0.025 | SE | Rico |
| 28 | Omai Mine, No. 1, 2, Guyana (Cambior) | 1995 | 44 | 5.25 | 80 | 4.2 | ER | Rico |
| 29 | Prestavel Mine-Stava, North Italy, 2, 3 (Prealpi Mineraria) | 1985 | 29.5 | 0.3 | 8 i | 0.2 | SI | Rico |
| 30 | Sgurigrad, Bulgaria | 1996 | 45 | 1.52 | 6 | 0.22 | SI | Rico |
| 31 | Stancil, Maryland, USA | 1989 | 9 | 0.074 | 0.1 | 0.038 | SI | Rico |
| 32 | Taoshi, Linfen City, Shanxi province, China (Tahsan Mining Co.) | 2008 | 50.7 | 0.29 | 2.5 | 0.19 | U | CB |
| 33 | Tapo Canyon (USA) | 1994 | 24 | NA | 0.18 | NA | EQ | Rico |
| 34 | Tyrone, New Mexico (Phelps Dodge) | 1980 | 66 | 2.5 | 8 | 2 | SI | Rico |
| 35 | Veta de Agua (Chile) | 1985 | 24 | 0.7 | 5 | 0.28 | EQ | Rico |
| Name | Model |
|---|---|
| VF.1 | log(VF)~log(VT) |
| Dmax.1 | log(Dmax)~log(H × VF) |
| Dmax.2 | Dmax~log(H × VF), glm, Gaussian, log link |
| Dmax.3 | log(Dmax)~log(Hf) |
| Data | R2 | p-Value | Standard Error | 5-fold CV, 100 reps | Outliers | Leverage | Cook’s Distance |
|---|---|---|---|---|---|---|---|
| O | 0.87 | 1.209 × 10⁻⁹ | 0.288 | 3.3 | P.11, P.12 | P.9 | |
| U | 0.815 | 1.285 × 10⁻¹¹ | 0.402 | 11.5 | P.17 | P.19, P.15 | P.17 |
| Data | Points | Median Prediction * | Q5 | Q95 | Observed | Probability VF > Observed | Probability VF > VT |
|---|---|---|---|---|---|---|---|
| O | Samarco (P.15) | 19.8 | 5.2 | 75.7 | 32 | 0.27 | 0.1 |
| Mt Polley (P.19) | 26.8 | 6.8 | 104.8 | 23.6 | 0.56 | 0.1 | |
| Gympsum (P.17) | 2.42 | 0.71 | 8.2 | 0.09 | 0.99 | 0.07 | |
| U | Samarco (P.15) | 15.2 | 4.1 | 57.3 | 32 | 0.17 | 0.05 |
| Mt Polley (P.19) | 20.3 | 5.3 | 76.9 | 23.6 | 0.42 | 0.05 | |
| Gypsum (P.17) | 2.13 | 0.6 | 7.6 | 0.09 | 0.99 | 0.08 |
| Model | Data * | R2 | p-Value | 5-Fold CV, 100 reps | Significant Outliers | Leverage | Cook’s Distance |
|---|---|---|---|---|---|---|---|
| Dmax.1 | U | 0.44 | 5.335 × 10⁻⁵ | 249.5 | P.12 | P.7, P.15 | P.19, P.12 |
| Dmax.1 | O | 0.55 | 5.39 × 10⁻⁶ | 54.5 | P.12 | P.12, P.28 | |
| Dmax.2 | U | NA | NA | 284.9 | P.11, P.15, P.19 | P.15, P.7 | P.15 |
| Dmax.3 | U | 0.53 | 4.415 × 10⁻⁶ | 230.3 | P.12 | P.7, P.15 | P.7, P.12, P.19 |
| Model | Points | Median Prediction * | Q5 | Q95 | Observed | Probability Dmax > Observed |
|---|---|---|---|---|---|---|
| Dmax.1 O | Samarco (P.15) | 294 | 19 | 4595 | 637 | 0.3 |
| Mt Polley (P.19) | 141 | 10 | 2012 | 7 | 0.96 | |
| Bonsal (P.7) | 0.25 | 0.02 | 3.25 | 8 | 0.014 | |
| Dmax.1 U | Samarco (P.15) | 141 | 6 | 3130 | 637 | 0.21 |
| Mt Polley (P.19) | 74 | 3.6 | 1525 | 7 | 0.9 | |
| Bonsal (P.7) | 0.28 | 0.01 | 6 | 0.8 | 0.23 | |
| Dmax.3 U | Samarco (P.15) | 174 | 10 | 2933 | 637 | 0.22 |
| Mt Polley (P.19) | 68 | 4 | 1054 | 7 | 0.92 | |
| Bonsal (P.7) | 0.3 | 0.02 | 5 | 0.8 | 0.28 |
© 2018 by the authors. Licensee MDPI, Basel, Switzerland. This article is an open access article distributed under the terms and conditions of the Creative Commons Attribution (CC BY) license (http://creativecommons.org/licenses/by/4.0/).
Share and Cite
Concha Larrauri, P.; Lall, U. Tailings Dams Failures: Updated Statistical Model for Discharge Volume and Runout. Environments 2018, 5, 28. https://doi.org/10.3390/environments5020028
Concha Larrauri P, Lall U. Tailings Dams Failures: Updated Statistical Model for Discharge Volume and Runout. Environments. 2018; 5(2):28. https://doi.org/10.3390/environments5020028
Chicago/Turabian StyleConcha Larrauri, Paulina, and Upmanu Lall. 2018. "Tailings Dams Failures: Updated Statistical Model for Discharge Volume and Runout" Environments 5, no. 2: 28. https://doi.org/10.3390/environments5020028
APA StyleConcha Larrauri, P., & Lall, U. (2018). Tailings Dams Failures: Updated Statistical Model for Discharge Volume and Runout. Environments, 5(2), 28. https://doi.org/10.3390/environments5020028