1. Introduction
International agencies, national agendas, and local governments are influenced by policy decisions. Effective policymaking relies on scenarios of future conditions, and modelling is an important tool in forecasting such conditions. Economic, demographic, and social policy decisions are perhaps most dependent on reliable population projections, with those made by the United Nations as the most commonly cited figures. Historically, population projections have been based on demographic statistics such as fertility and mortality rates [
1].
There has, however, been a move in recent years toward a more ecological approach to population growth. In addition to economic development, sustainability goals such as universal energy access [
2], water security [
3], quality of life [
4], and female education [
5] must be taken into account when projecting future populations. The rising field of biophysical economics has pushed for the inclusion of energy into traditional ‘social’ sciences [
6]. A biophysical approach to economics is one rooted in the first principles and natural constraints inherent to the scientific method. Recently, a positive feedback between increasing energy consumption and more desirable demographic statistics has been quantified [
4]. Our previous publications have explored biophysical approaches to the global energy–climate–population nexus [
7], regional development [
8], and the renewable energy revolution [
9]. This paper applies the global-level methodology of our previous work to the region of sub-Saharan Africa (see
Supplementary Table S1). Just as our global-level work combined all nations in the world into one model [
7], so this manuscript will combine each of the nations in sub-Saharan Africa into a similar model. We acknowledge that merging these countries together raises several complex socio-economic issues; however, we assume a one-society/leadership general approach for the common goal of development. In this report we examine three scenarios that bracket energy policy decisions facing the region in the 21st century while also seeking historical analogues for the task of sustainable development in sub-Saharan Africa. All of this is done under the assumptions of the United Nations population projections for the region.
Economic and social development is a global concern in the 21st century. In the world today there are developed nations characterized by strong economies and high standards of living; developing nations transitioning towards stronger economies and lower fertility rates; and least developed economies characterized by low gross per capita national incomes (<
$900 USD2006), low human development index (HDI), and high economic vulnerability (a relative measure of population, economic, and agricultural statistics) [
10]. sub-Saharan African countries are, for the most part, at the low end of the development spectrum.
The most recent United Nations population projections estimate that sub-Saharan Africa (For the purpose of our study, sub-Saharan Africa (hereafter, ‘SSA’) refers to all nations not defined by the UN as ‘Northern Africa’. This includes the countries and territories on the continent of Africa without a Mediterranean shoreline, South Sudan but not Sudan, as well as the island nations of Cabo Verde, Comoros, Mauritius, Réunion, São Tomé and Principe, and Seychelles. In total there are 51 nations included in SSA (
Supplemental Table S1). This designation excludes the North African countries and territories of Algeria, Egypt, Libya, Morocco, Tunisia, and Western Sahara.) will be home to nearly four billion (3.93 × 10
9) people by 2100 [
1]. This paper uses a biophysical approach to examine the feasibility of achieving the UN projection. We examine the extent to which energy availability can limit the development of economies and compare the current conditions in sub-Saharan Africa with the recent historical development of other nations. In our work, we use per capita energy consumption as a measurable result of development efforts including industrialization and increasing per capita wealth. As such, total energy consumption is used as a proxy for economic development.
Africa (specifically SSA) was known as “the dark continent” after Henry Stanley remarked on Europe’s relatively poor understanding of the continent in 1878 [
11]. The “Scramble for Africa” and subsequent colonization have resulted in low economic growth rates and regional heterogeneity in SSA [
12]. Separate from the fossil fuel-rich Northern Africa, SSA may also be considered a modern day dark continent because the region has the world’s lowest per capita energy consumption [
8] and the world’s fastest projected population growth in the 21st century [
1]. The combined population of the 51 countries comprising SSA was 937 million in 2014. Whereas many development and sustainability initiatives focus on food production and per capita GDP, recent climate change agreements (i.e., the Paris Agreement) have shifted attention to the developing world’s dependence on fossil fuel use and its attendant carbon emissions [
13]. Although the greenhouse gas emissions of African countries generally do not prominently feature in climate change debates, the fossil fuel reserves of these countries are of critical importance. More recently, energy (particularly electricity) has become an area of focus. For example, the Sustainable Energy for All initiative (SE4All) [
2] was developed with the goals of eradicating global energy poverty, including universal access to electricity and modern cooking fuels. There is a strong correlation between electricity consumption and economic development [
14]. Analysis from years 1971–1992 indicate that developing countries tend to converge to similar patterns of energy use, further reinforcing the development link with energy consumption and complicating decarbonisation efforts [
15].
This study aims to elucidate how SSA can achieve sustainable development in the 21st century, while facing high population growth rates, limited fossil fuel reserves, low Human Development Index (HDI), and the need and cost to build out a renewable energy infrastructure (e.g., Warner and Jones [
8]).
2. Materials and Methods
In 2012, it was estimated that 86% of the world’s population had access to electricity and 59% had access to non-solid cooking fuels [
16]. The same 2012 statistics were 35% and 18% in SSA [
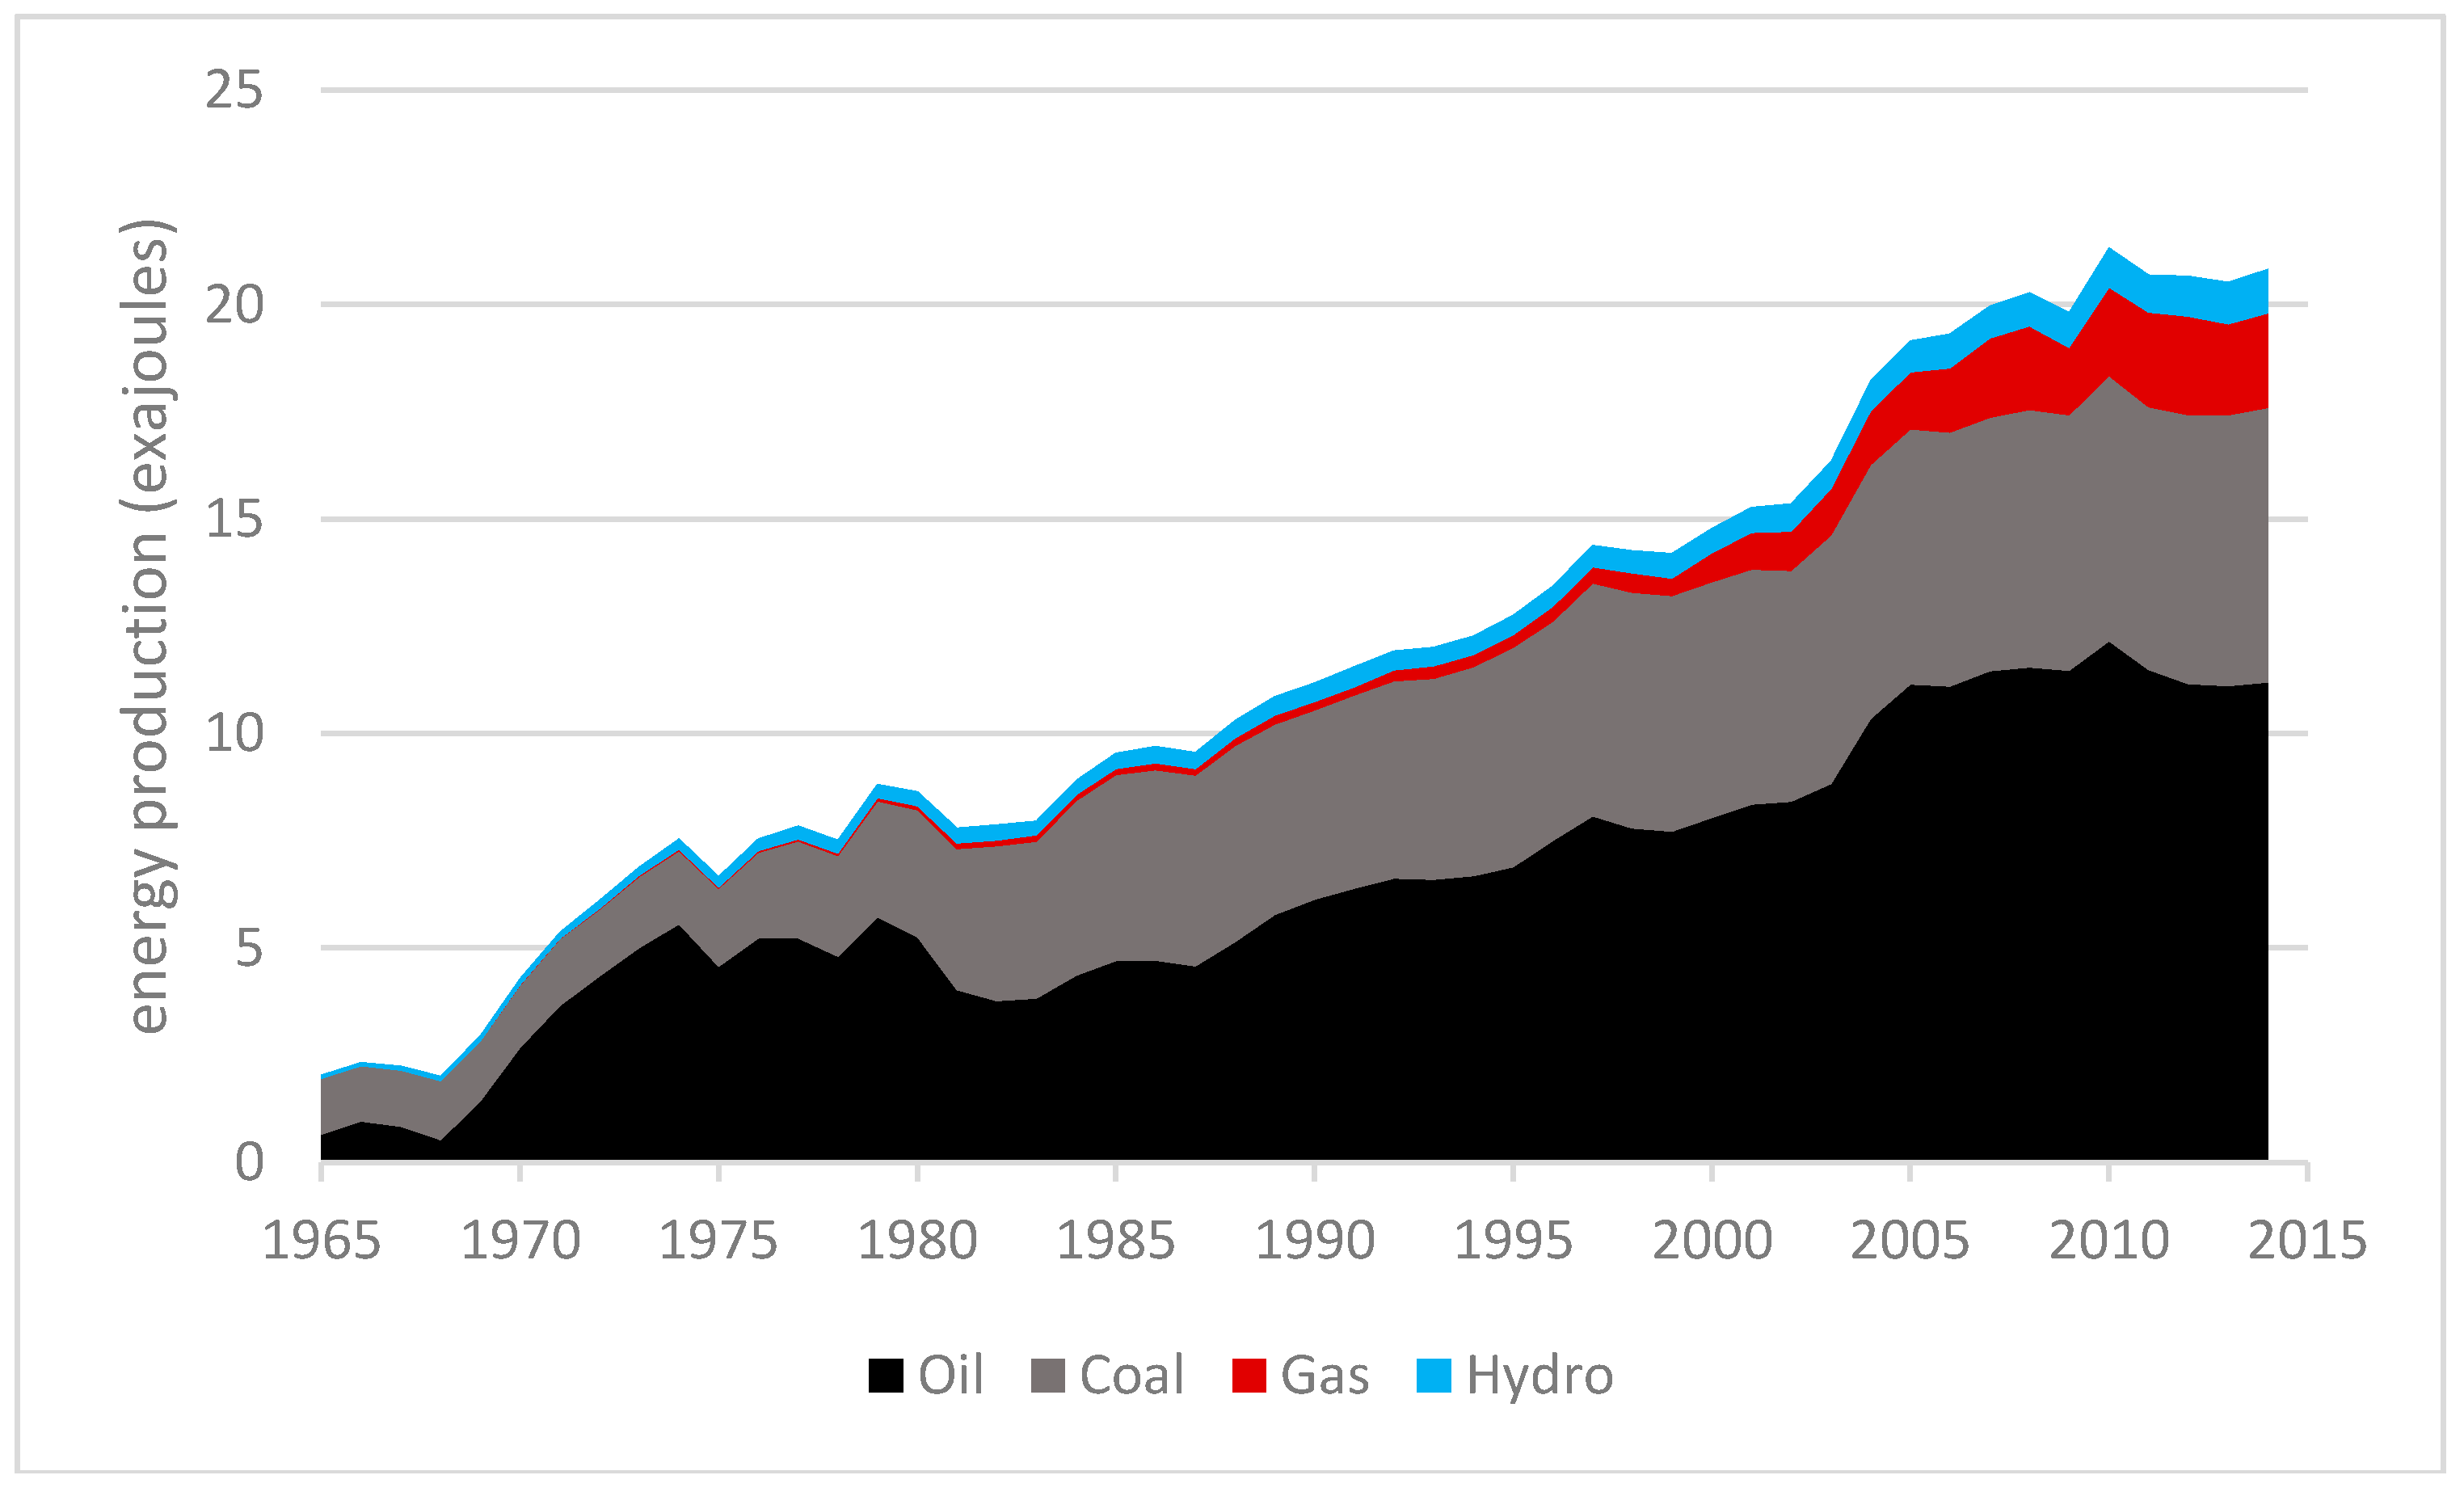
16]. Year-end 2014 fossil fuel reserves in SSA were estimated at 1500 EJ (24% oil, 60% coal, 16% natural gas) [
17]. Uranium is abundant [
18]; however, nuclear energy is unused in the region outside of South Africa. Total energy consumption was 11.8 EJ (10.7 EJ from fossil fuels and nuclear and 1.1EJ from renewable sources), or 12.6 GJ/person (6.7 GJ/person not including South Africa). In addition, SSA has been a net exporter of energy since 1969, and in 2014 exported 9.2 EJ [
17] or the equivalent of 9.8 GJ/person. Consuming (12.6 GJ/person) and exporting (9.8 GJ/person) energy means that, assuming no exportation or population change, the region has 76 years of fossil fuel energy in proven reserves [
17].
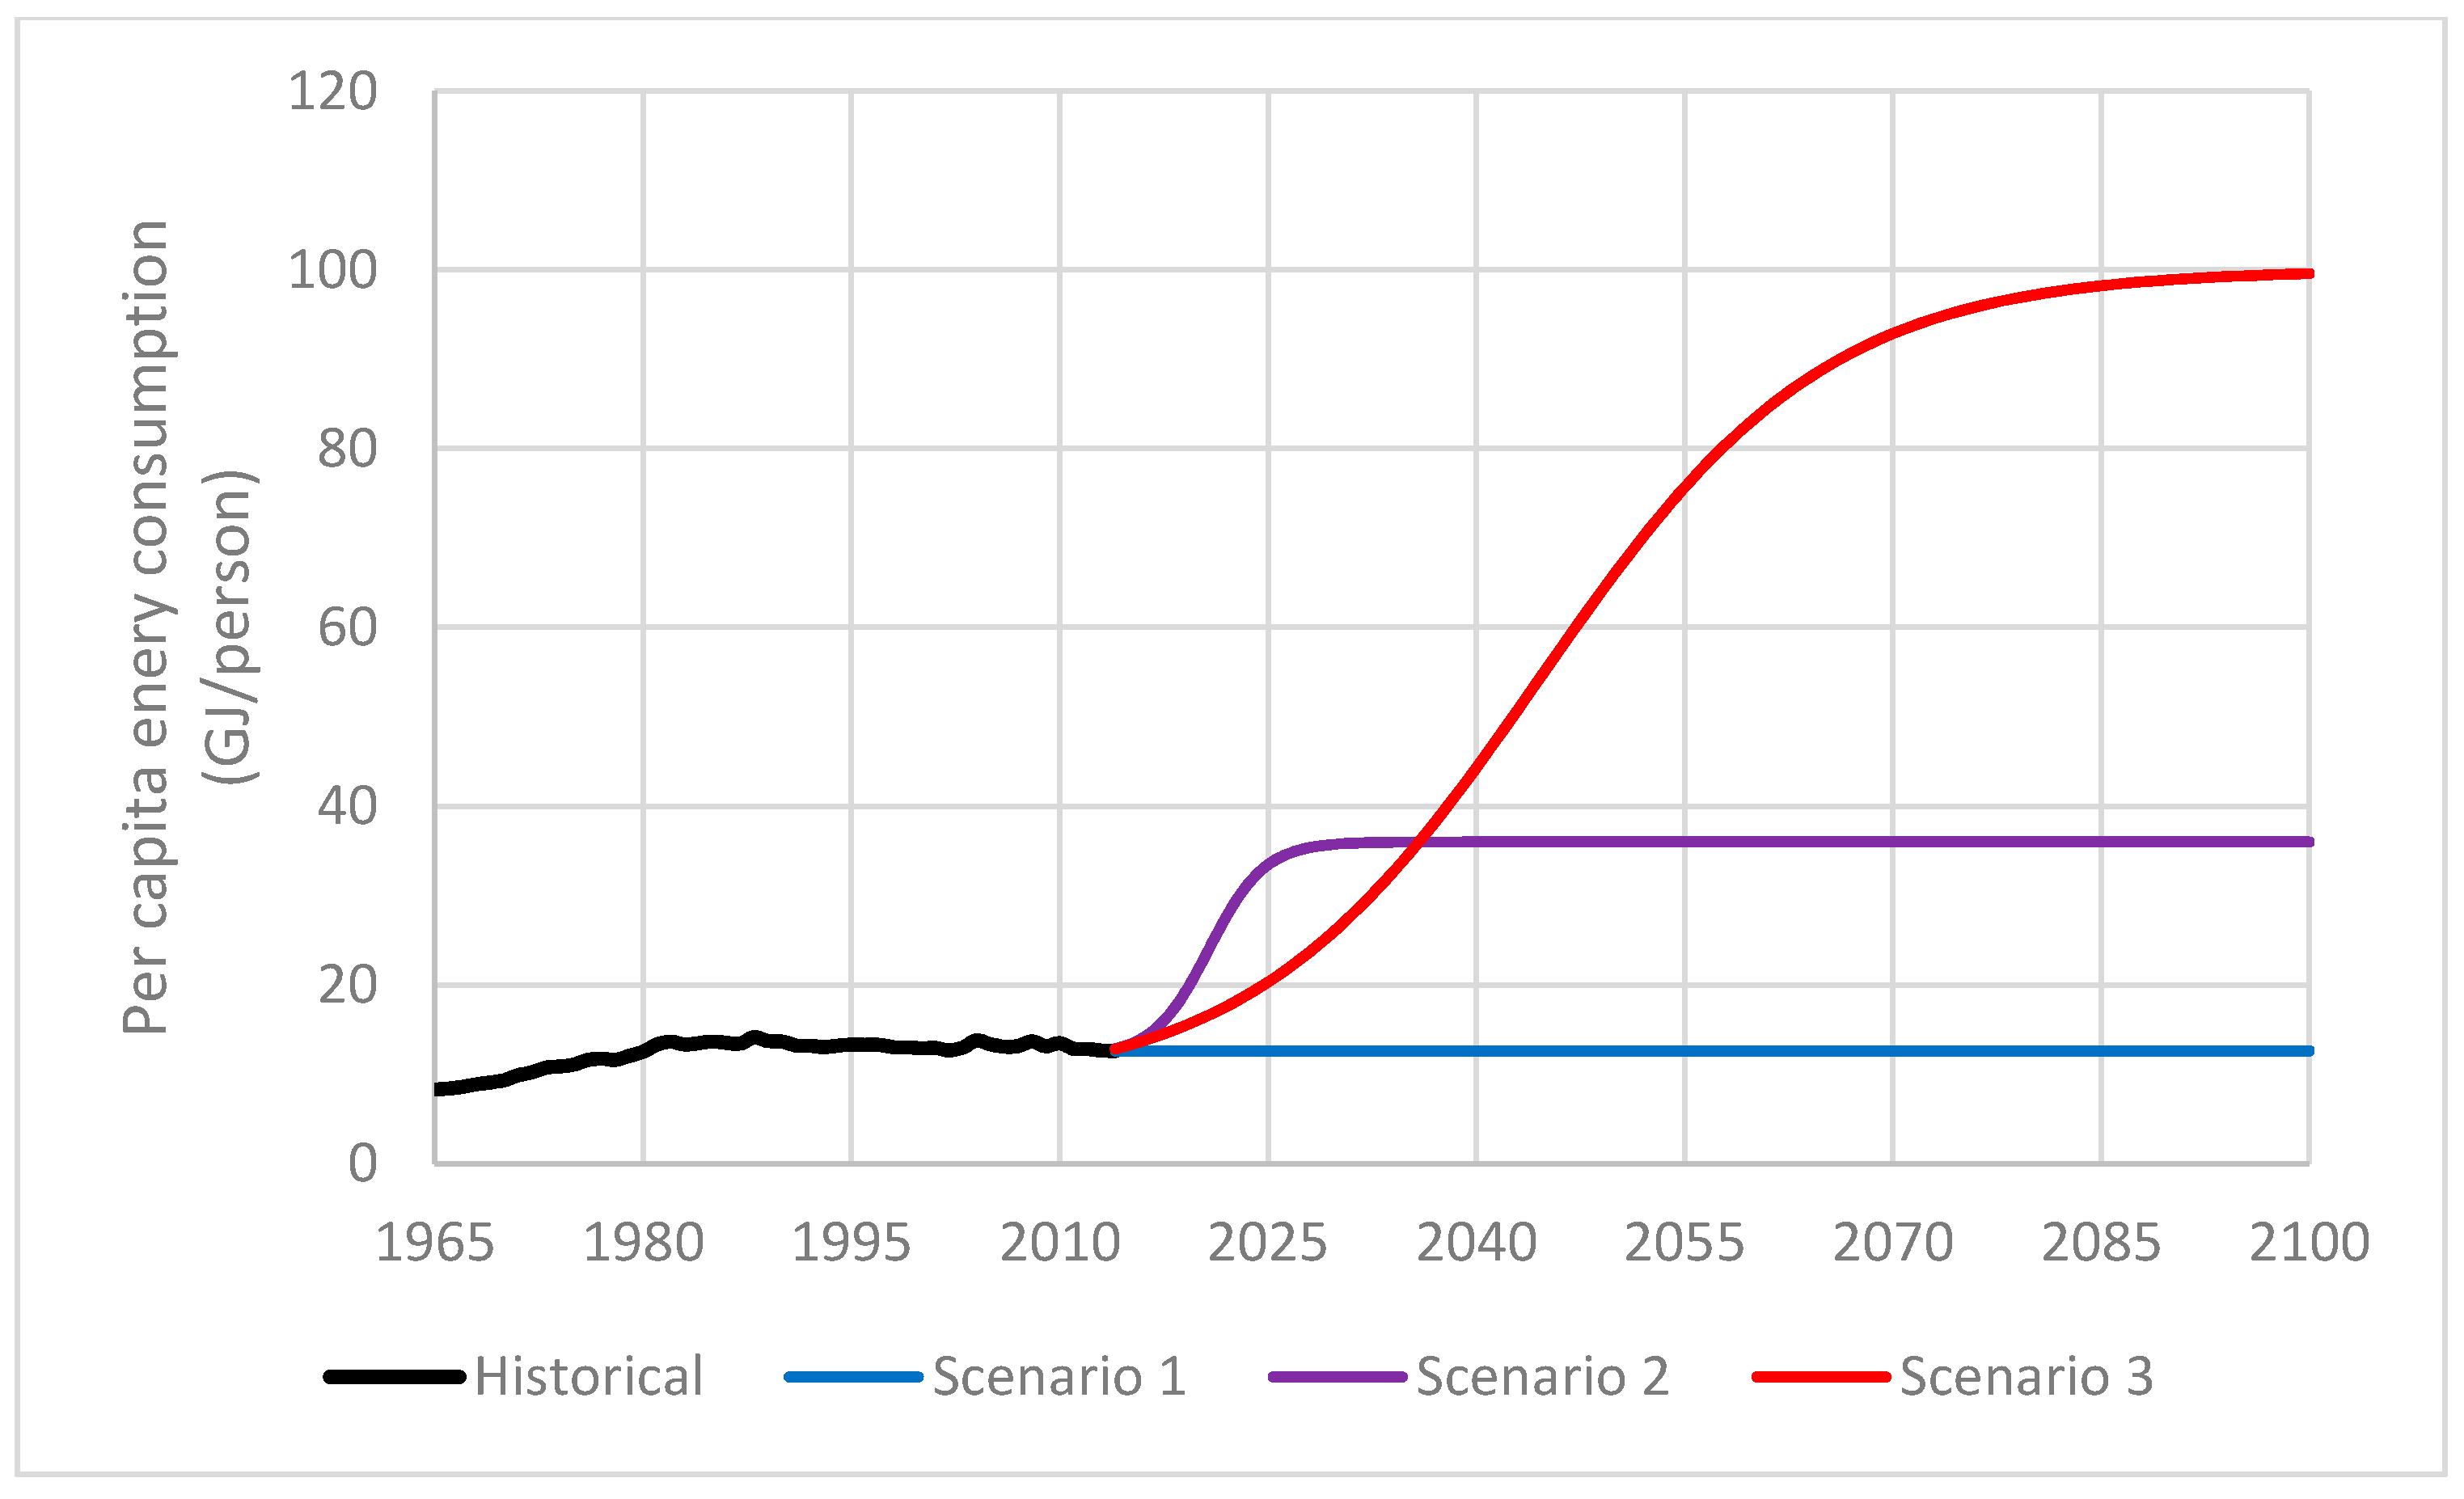
The energy demand portion of this paper involves three energy consumption scenarios. The first scenario holds per capita energy consumption in the region at the 2014 value (12.6 GJ/person) in order to quantify the effect of the projected population growth only. If we assume that 65% of the population in SSA (606 million) is not consuming energy [
16] (thus 0 GJ/person), then the remaining 35% (331 million) are consuming energy at 36 GJ/person. The SE4ALL initiative schedules its goals to be met by 2030, so our second energy consumption scenario projects the entire 2030 population (1.4 billion) to be consuming at 36 GJ/person. Similar to the first scenario, the per capita energy consumption will be held constant from 2030 throughout the remainder of the 21st century.
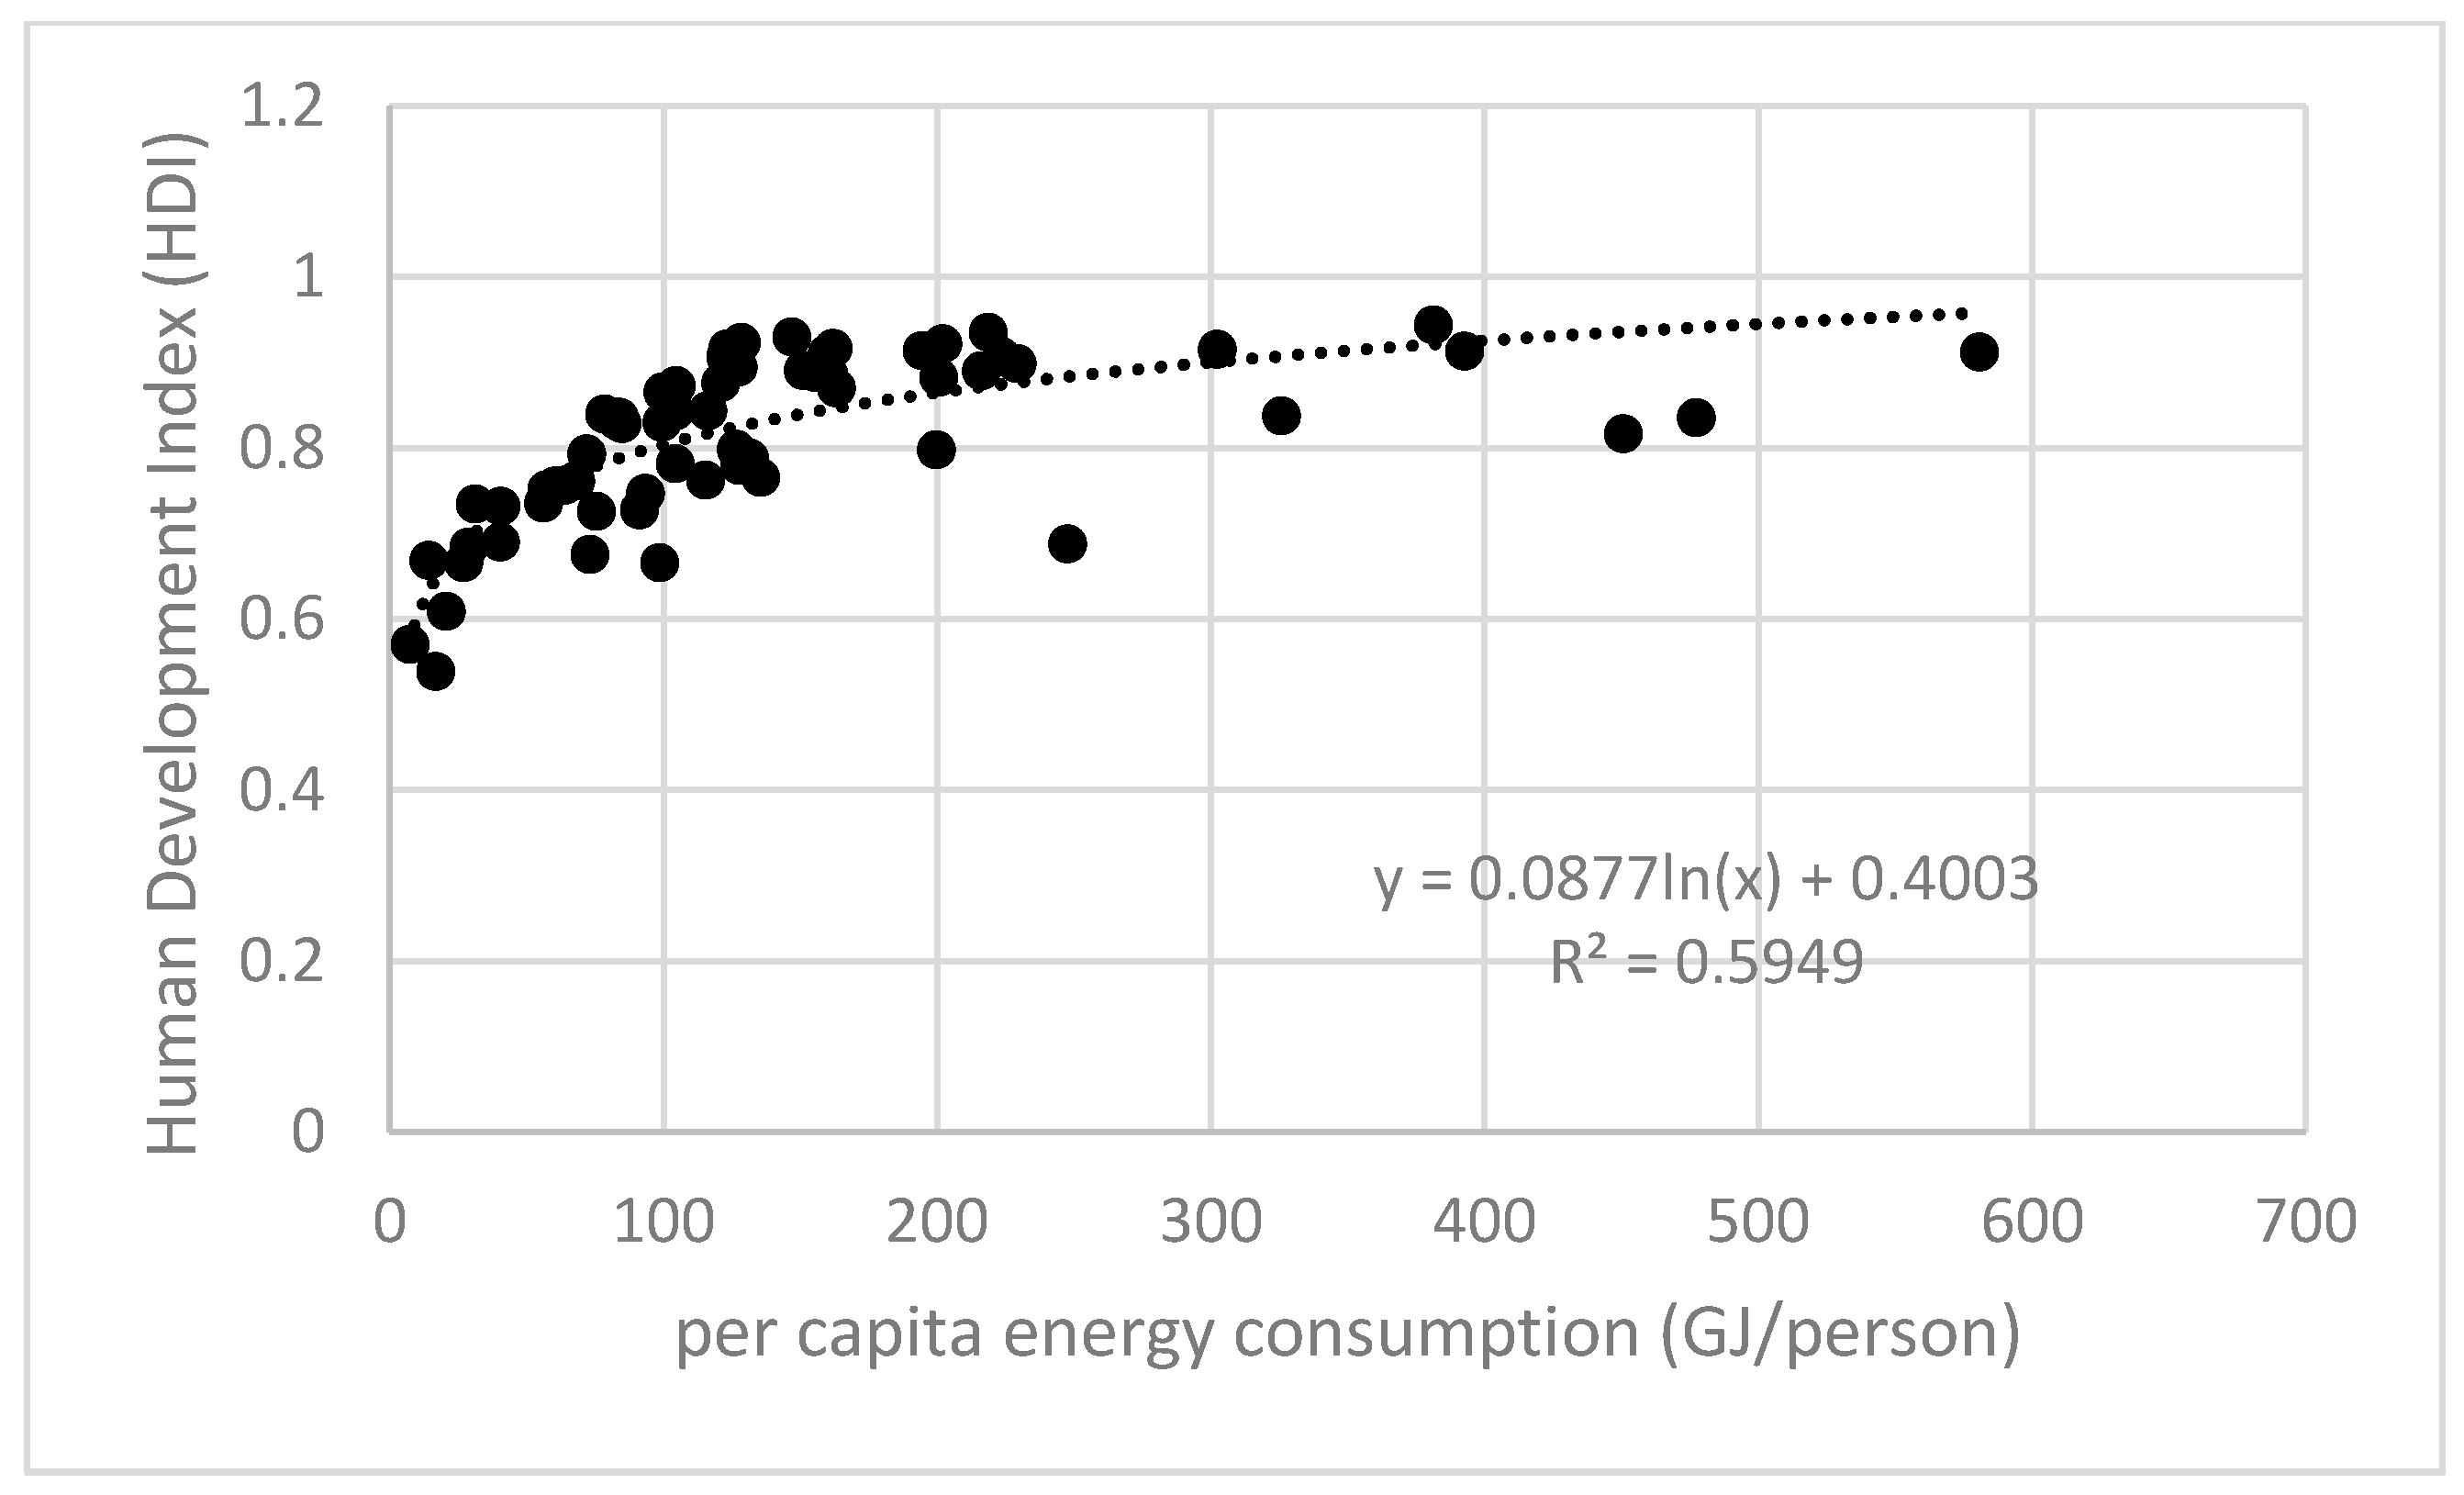
We developed our third scenario via three different approaches. First, ref. [
7] we extended the global trend in average annual population and energy consumption growth from 2000–2014 and projected that the global per capita energy consumption would reach 106 GJ/person in 2100. This scenario is similar to the second per capita energy scenario used in Warner and Jones [
8]. Second, the human development index (HDI) is a measure of a country’s life expectancy, education, and per capita income. HDI is measured on a scale from zero to one, with values greater than 0.8 considered to be “very high human development”. Lambert, Hall, Balogh, Gupta, and Arnold [
4] sought to quantify the effect of energy access on the quality of the consumers’ life. One of the aspects of their study included comparing energy usage to various quality of life indices including HDI. Lambert, Hall, Balogh, Gupta, and Arnold [
4] found a logarithmic correlation between per capita energy consumption and HDI (R
2 = 0.4859) using their datasets. We used a different dataset and also found a similar correlation (R
2 = 0.5949). Using our data, we determine that achieving an HDI of 0.8 corresponds with a per capita energy consumption of 95 GJ/person (
Figure 1). Third, the overall findings in [
4] suggest that significant improvements to most quality of life indices occurs at a consumption rate of 100 GJ/person (and do not significantly increase above 150 GJ/person). Our third energy consumption scenario will raise the SSA consumption level to 100 GJ/person by 2100.
We modelled annual per capita energy consumption in the second and third scenarios using a logistic growth curve ([
19]). The remaining modelling is based on the 2015 UN population projections [
1], the 2015 BP proven fossil fuel reserve estimates [
17], and the World Nuclear Association reasonably assured uranium reserves [
18]. Historical production and consumption was based on data from BP [
17]. Additional coal production data was obtained from Rutledge [
20]. From 2015–2100 we model the production of fossil fuels and nuclear energy using the Hubbert single-cycle technique [
21]. This technique utilises past production and current reserve estimates to project a bell-shaped production forecast. SSA produced 1 EJ of hydropower in 2014 [
17], though it was estimated that as of 2002 (0.65 EJ produced) Africa only utilized 4% of technically feasible hydropower potential. We can then estimate the hydroelectric potential of Africa at 16 EJ. This potential is modelled to be reached in 2100. The total energy demand is a function of the per capita consumption in each scenario and the projected population. From total energy demand, we subtracted the fossil fuel and hydropower production, leaving renewable energy (or import) demand.
We decided to specify a renewable energy mixture into the future using the approach of Jones and Warner [
7], though the specific breakdown of renewable energy by source (RES) is not the aim of this study. We use this breakdown only as a means of relating the scale of the issues at hand. In this study we will use a rounded breakdown of SSA: 50% wind, 20% solar, and 30% other renewables [
17]. The average wind turbine in the United States (using a 5MW equivalent) operates at a capacity factor of 0.3 [
22], producing about 47.3 TJ per year. One square kilometre of solar panels produce about 414 TJ per year [
23]. Our representative other renewable energy source is algae biofuels. We use biofuels from algae because liquid fuels comprise ~18% of total global energy consumption [
24] and algae biofuel (in a laboratory setting) out produces other sources [
25]. One square kilometre of algae production yields approximately 79.3 TJ, per year [
26]. Using these yields we were able to assign relative figures to the production needs of the region in each scenario.
Finally, we sought historical analogues to development efforts similar to our development proxy scenarios in SSA. We looked at energy consumption [
17] and population data [
1] from 1965–2014. Using these data, we sought nations that consumed at or around the 2014 SSA per capita level in 1965 and their per capita consumption in 2014 compared to our three SSA model scenarios for 2065. We grouped the countries generally into our three scenario trajectories and evaluated each country’s economic and energy history from 1965–2014. Using these evaluations, we determine whether or not there are historical analogues for the current situation in SSA and make policy recommendations based on the successes and failures of each historical evaluation.
4. Discussion
This study was conceived as a human-inclusive ecosystem approach to sustainable development in a part of the world facing high population growth rates, limited fossil fuel reserves, low HDI, and the need and cost to build out a renewable energy infrastructure. It has been shown here (
Figure 1) and in the literature [
4,
7] that per capita energy consumption is an important metric for gauging a country’s economic and social health. Seeing that SSA is the world’s lowest per capita energy consuming region, has one of the lowest regional per capita GDPs, ranks near the bottom of the HDI scale, and has the highest birth-rate, one can argue then that in order to improve those metrics that per capita energy consumption should increase. The question facing SSA is can this be achieved, and if so how? This is especially true in light of projected peak fossil fuel production.
Though currently a net energy exporter, the argument can be made that exporting energy at this point in time is a potentially short-sighted resource management strategy. First, even in scenario 1, SSA becomes a net energy importer by 2047. This is theoretically the longest that SSA could be a net exporter (barring extensive fossil fuel discoveries or a decline in per capita consumption). End-member options available to the region regarding export potential are to (1) cease exporting energy and instead use the currently-available excess energy from fossil fuel production capacity to build the renewable energy infrastructure that will be necessary for the back half of the century, or (2) continue to make the region’s excess fossil fuel energy available on the world market but use the revenue to develop a renewable energy infrastructure. Implementing either of these options would require a unified plan. As such it is more likely that a combination of the two end-member strategies will be required on a nation-by nation basis. Although SSA is a regional aggregate of countries, not a united organization with defined strategies and policies, the African Union is an organization comprised of every African nation except Morocco (Burkina Faso and the Central African Republic are currently suspended). As such there may be some limited hope for a united effort to combat this and similar global and regional issues in Africa.
There are additional economic concerns in SSA. Weakening of the global economy and variability in commodity prices have slowed economic growth in SSA [
27]. One growing source of foreign investment in SSA is China [
28]. China has taken great interest in the natural resources of the region, gaining trade consideration with its non-interference policy that does not require consideration of the environment and ignores corruption [
29]. The investments made by China are mostly focused on supplying oil and other raw materials for the growing infrastructure of an economy that was, until recently, growing at nearly 9% per year [
30]. China refers to the partnerships with sub-Saharan African countries as beneficial trade amongst developing nations, sometimes referred to as South–South cooperation [
31]. Chinese trade is often more favourably looked upon in SSA, as the benefits are more symbiotic than was the case during European colonization [
29]. What is not clear is what impact that trade relationship is having on the long-term sustainable development of China or SSA [
31].
We have assumed that HDI acts as a general indicator of developmental success in the analysis of these countries. This is not to suggest that HDI is either a perfect indicator or the only metric that should be used in sustainable development policy. Though HDI is a useful starting point for measuring development success, Bilbao-Ubillos [
32] suggests that the inclusion of additional parameters such as economic and social inequality would increase the reliability of the HDI. It is important to note that there is evidence that the trend of lowering fertility with increased HDI may reverse at HDI values greater than 0.86 [
33]. Given that the majority of SSA countries are significantly below this level, we do not consider this an immediate development problem.
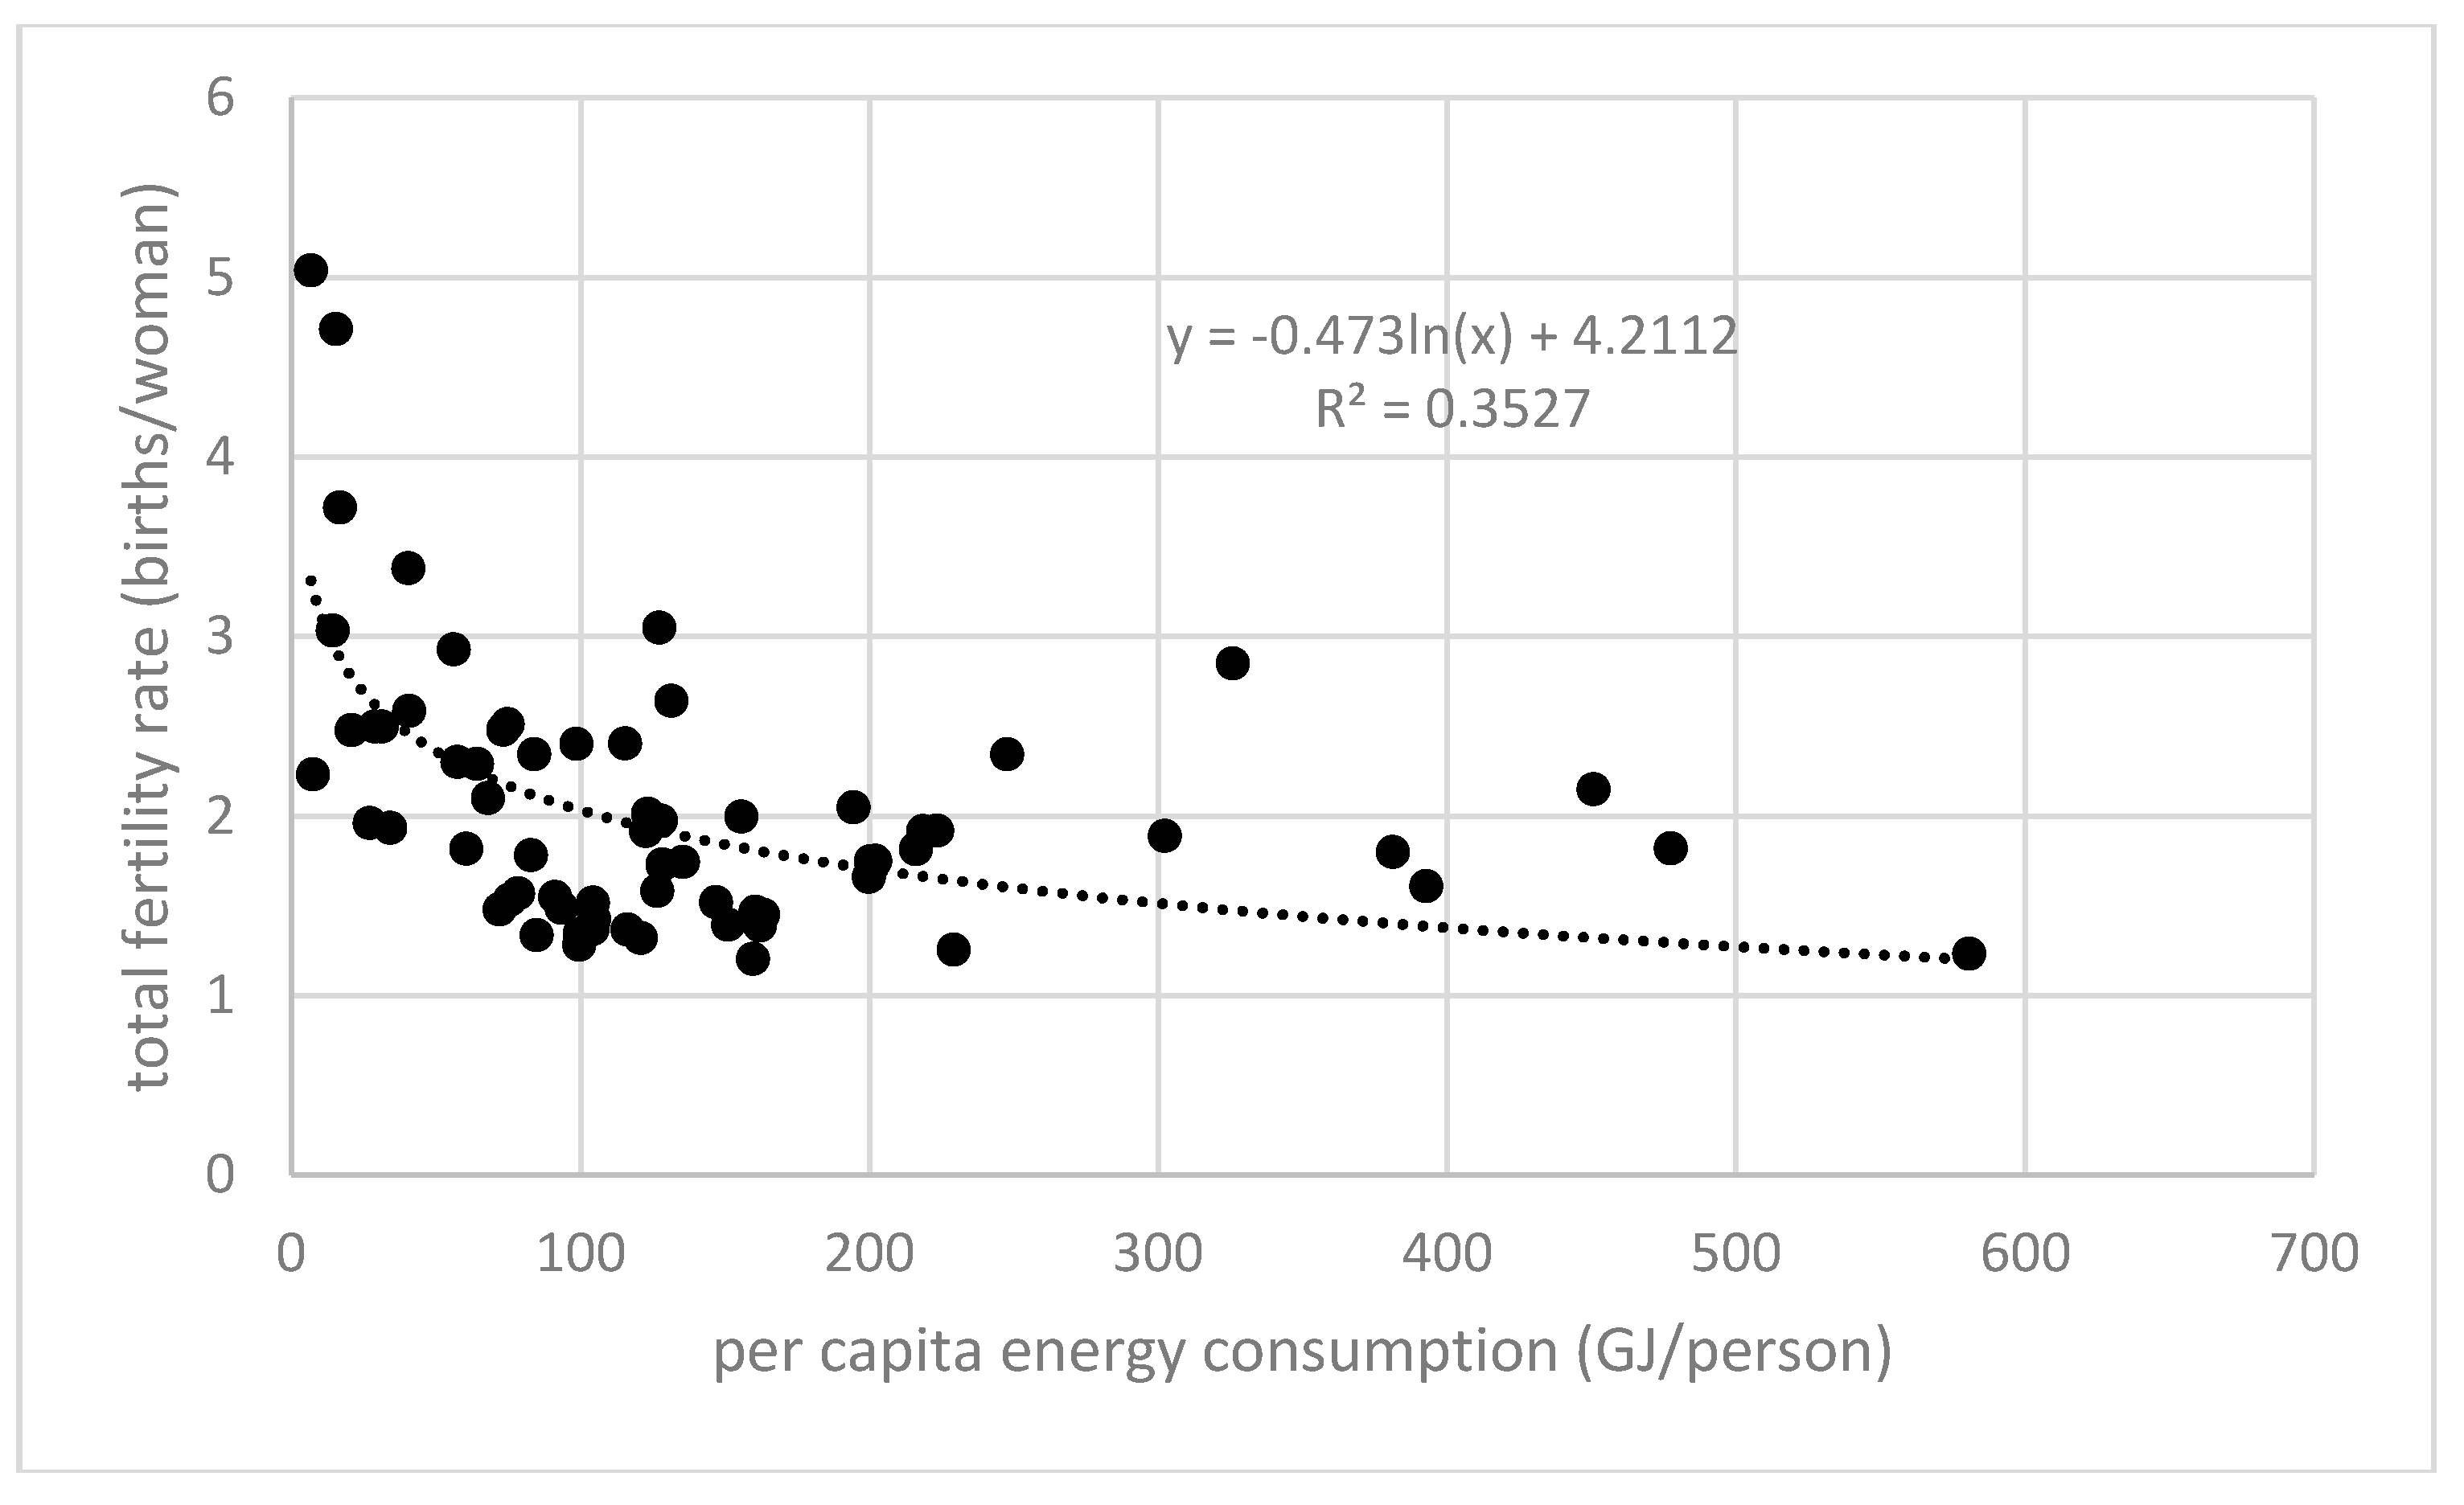
Sub-Saharan African nations have some of the highest total fertility rates (TFRs) in the world [
1]. There are several reasons for this. The Sahara Desert shielded SSA from the spread of fertility beliefs that were not as based on the importance of ancestors and family lineage [
34]. As a route for further research, we have examined the correlation of per capita energy consumption and TFR.
Figure 6 illustrates this relationship across 67 countries. Ideal family size and desired fertility were shown to both decrease as a result of increased education in Malawi, Uganda, and Ethiopia [
35]. Total fertility rates less than 1.5 in Europe (an extreme value for SSA) correlate with five separate variables, including social and economic incentives to postpone fertility, that suggest that single-generation changes in TFR can have a large effect on age cohort numbers [
36].
One question of particular note is how climate change will affect the energy export ability of the region. The economy of the region is 20–40% agricultural [
37]. As a net energy exporter, the region may be selling its energy reserves without regard for future need. The problem is that in a world more sensitive to the effect of carbon-intense growth, what market (for exports or domestic use) will be available for fossil fuels in the future? SSA as a whole faces a dilemma that several other energy producing regions (e.g., the Middle East, North Africa, Russia) face: if the global climate agreements (e.g., COP-21) are to be achieved, the next decade is the last chance for these countries to monetize their fossil fuel reserves. For example, exploitation and exporting of fossil fuels has been an effective means of increasing per capita energy consumption and GDP in Iran. However, the projected expansion of renewable energy infrastructure in the 21st century suggests that non-renewable energy could be better used internally for the transition to renewable energy, either exported for revenue to build a renewable infrastructure or used directly in creating the renewable infrastructure.
The Intergovernmental Panel on Climate Change (IPCC)
Fifth Assessment Report [
38] outlines the climate change issue in SSA: increased drought risk in already at-risk areas, reduced crop productivity, and adverse effects on food security. The renewable energy sources used in our analysis are all climate-dependent. The effect of climate change on the hydropower potential of SSA must be incorporated into plans for the next century [
39]. The available potential for wind and solar power in southern Africa is not likely to change significantly out to at least 2050 [
40]. This further reinforces both the need for expansion of these infrastructures and our choice of renewable energy sources.
The IPCC expects climate change to significantly increase the movement of human populations throughout the 21st century due to such risks as increasing natural disaster events, land-use changes, and ecosystem shifts [
38]. Without proper planning, migration can stress local health services and spread infectious diseases [
41]. Climate change (specifically warming) in Africa is also linked to increased conflict [
42]. It has been suggested that climate change plays a significant role in the current migrations seen around the world, including Syria [
43]. The immigration “crisis” currently experienced in Europe and elsewhere therefore has a certain climate aspect about it. It is therefore not unreasonable to infer that a more unexpected consequence of anthropogenic climate change in Africa will be conflict and emigration.
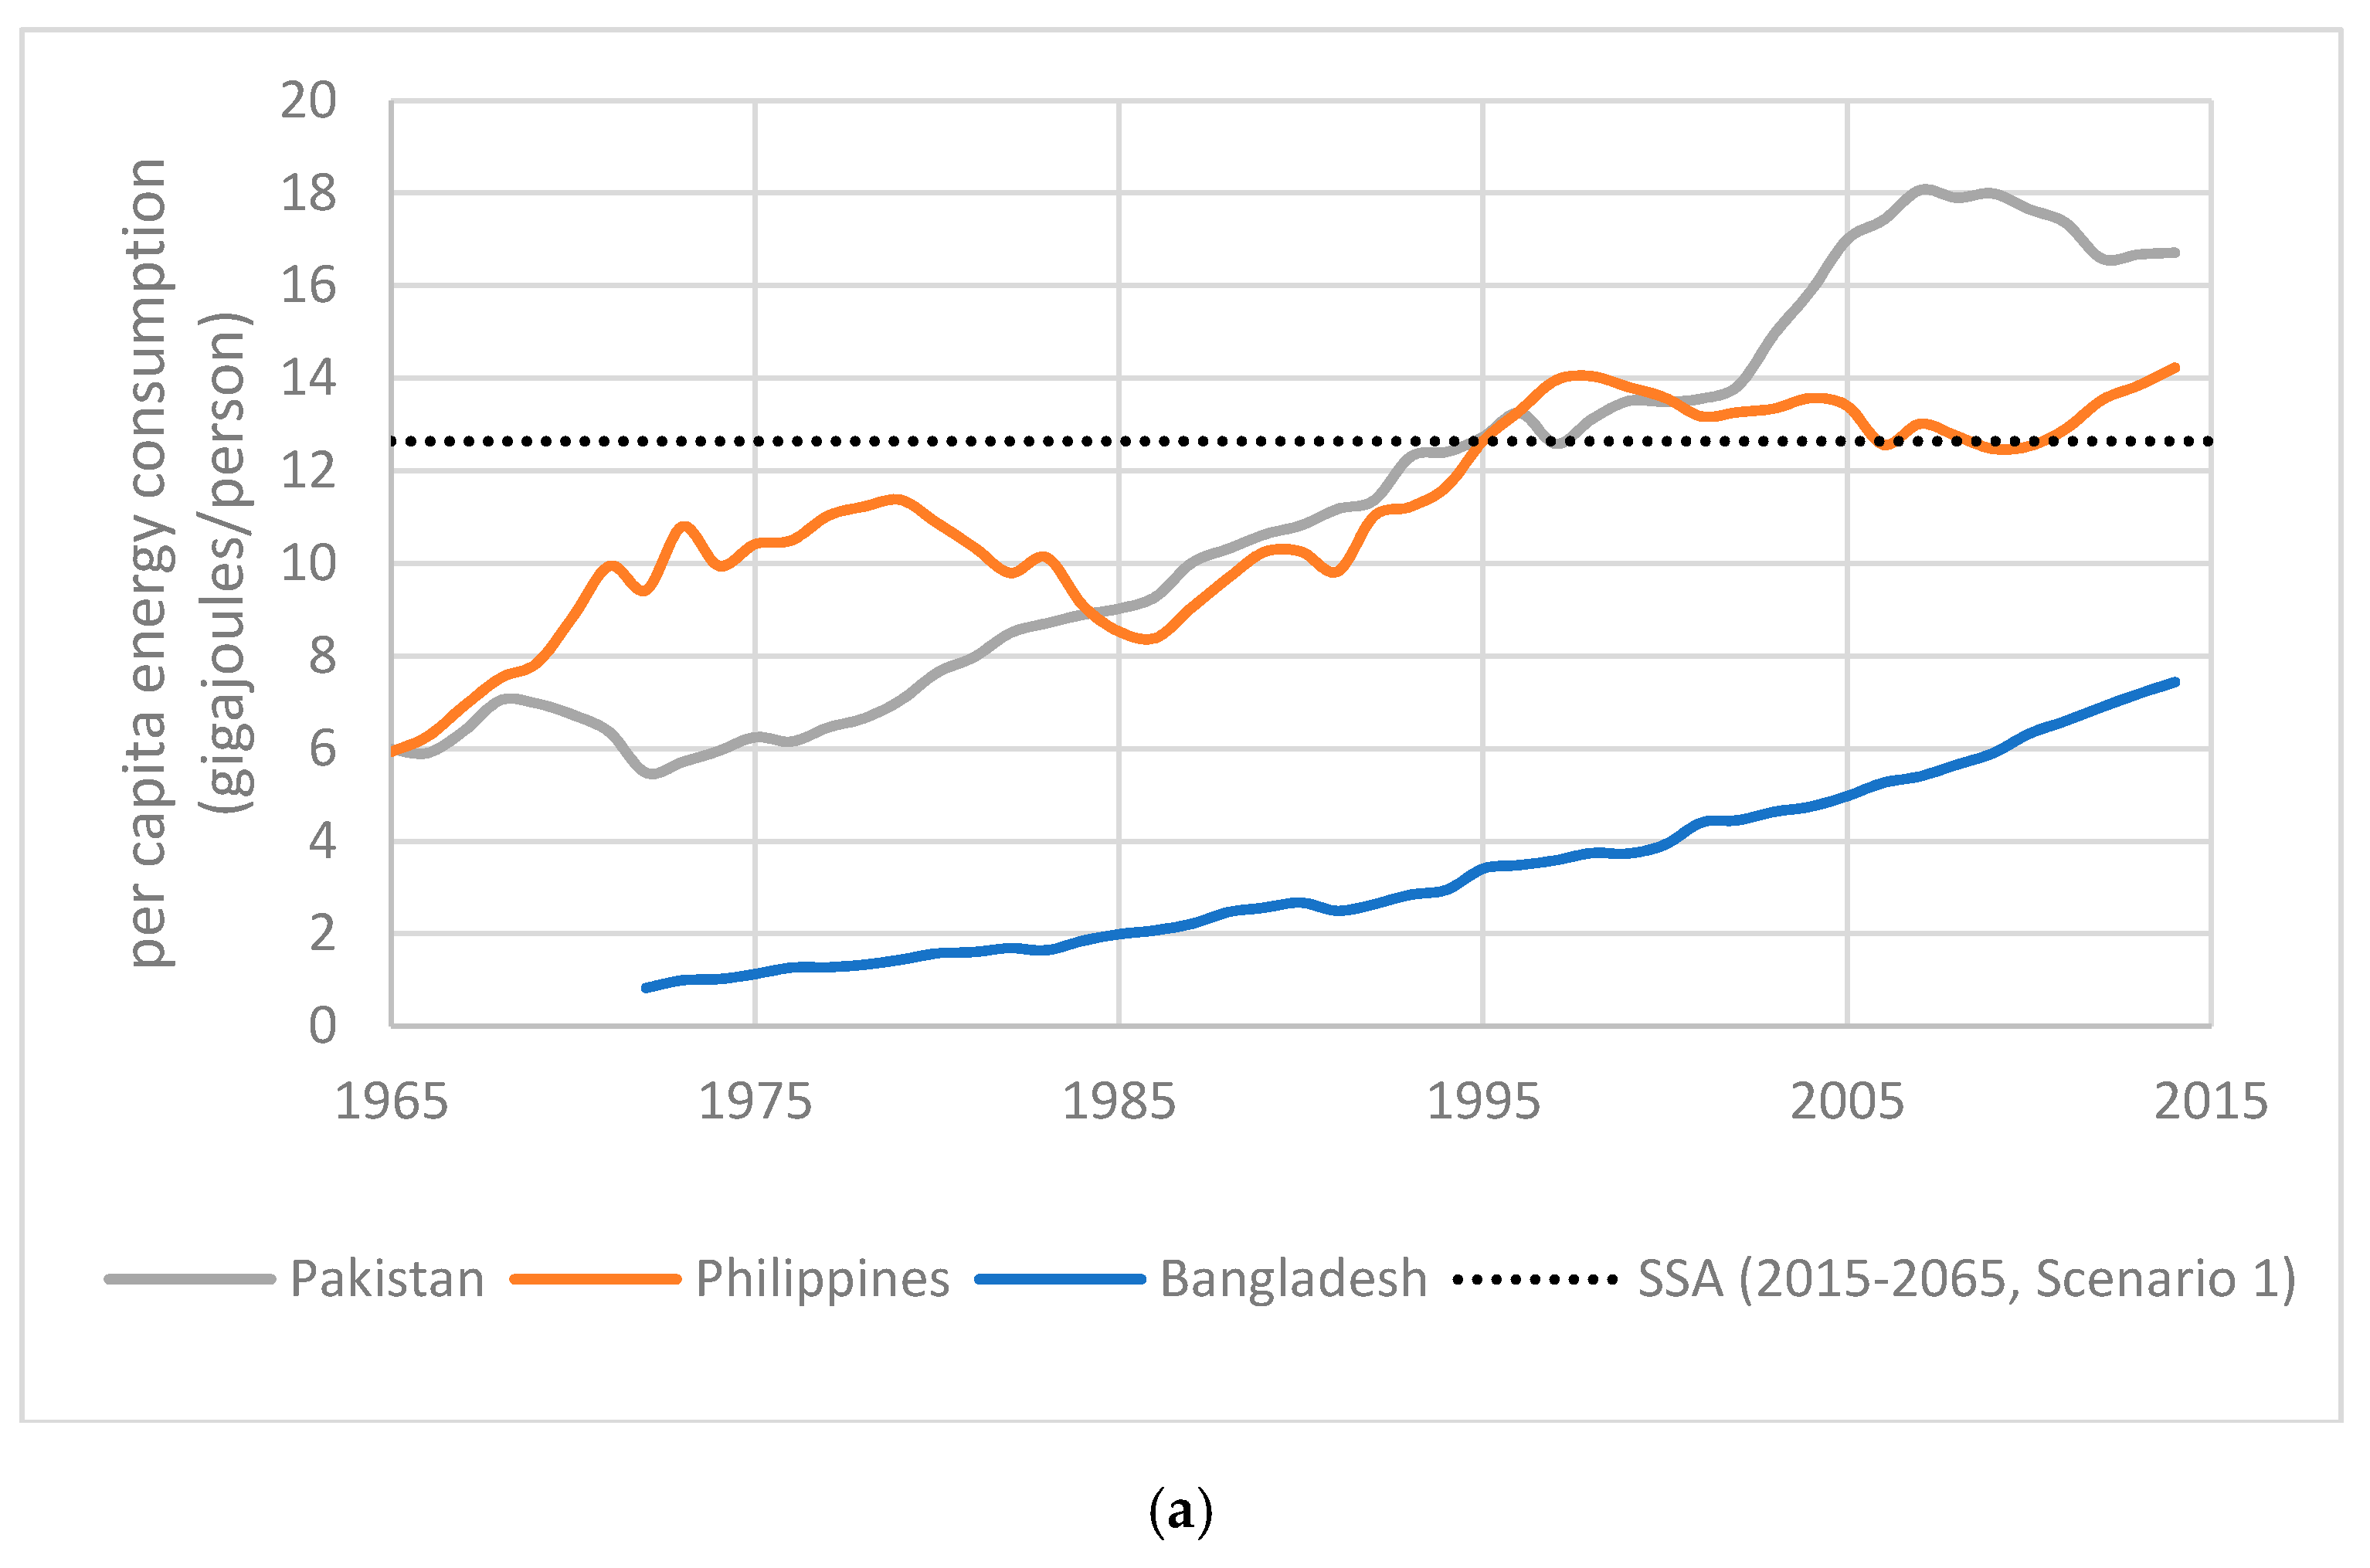
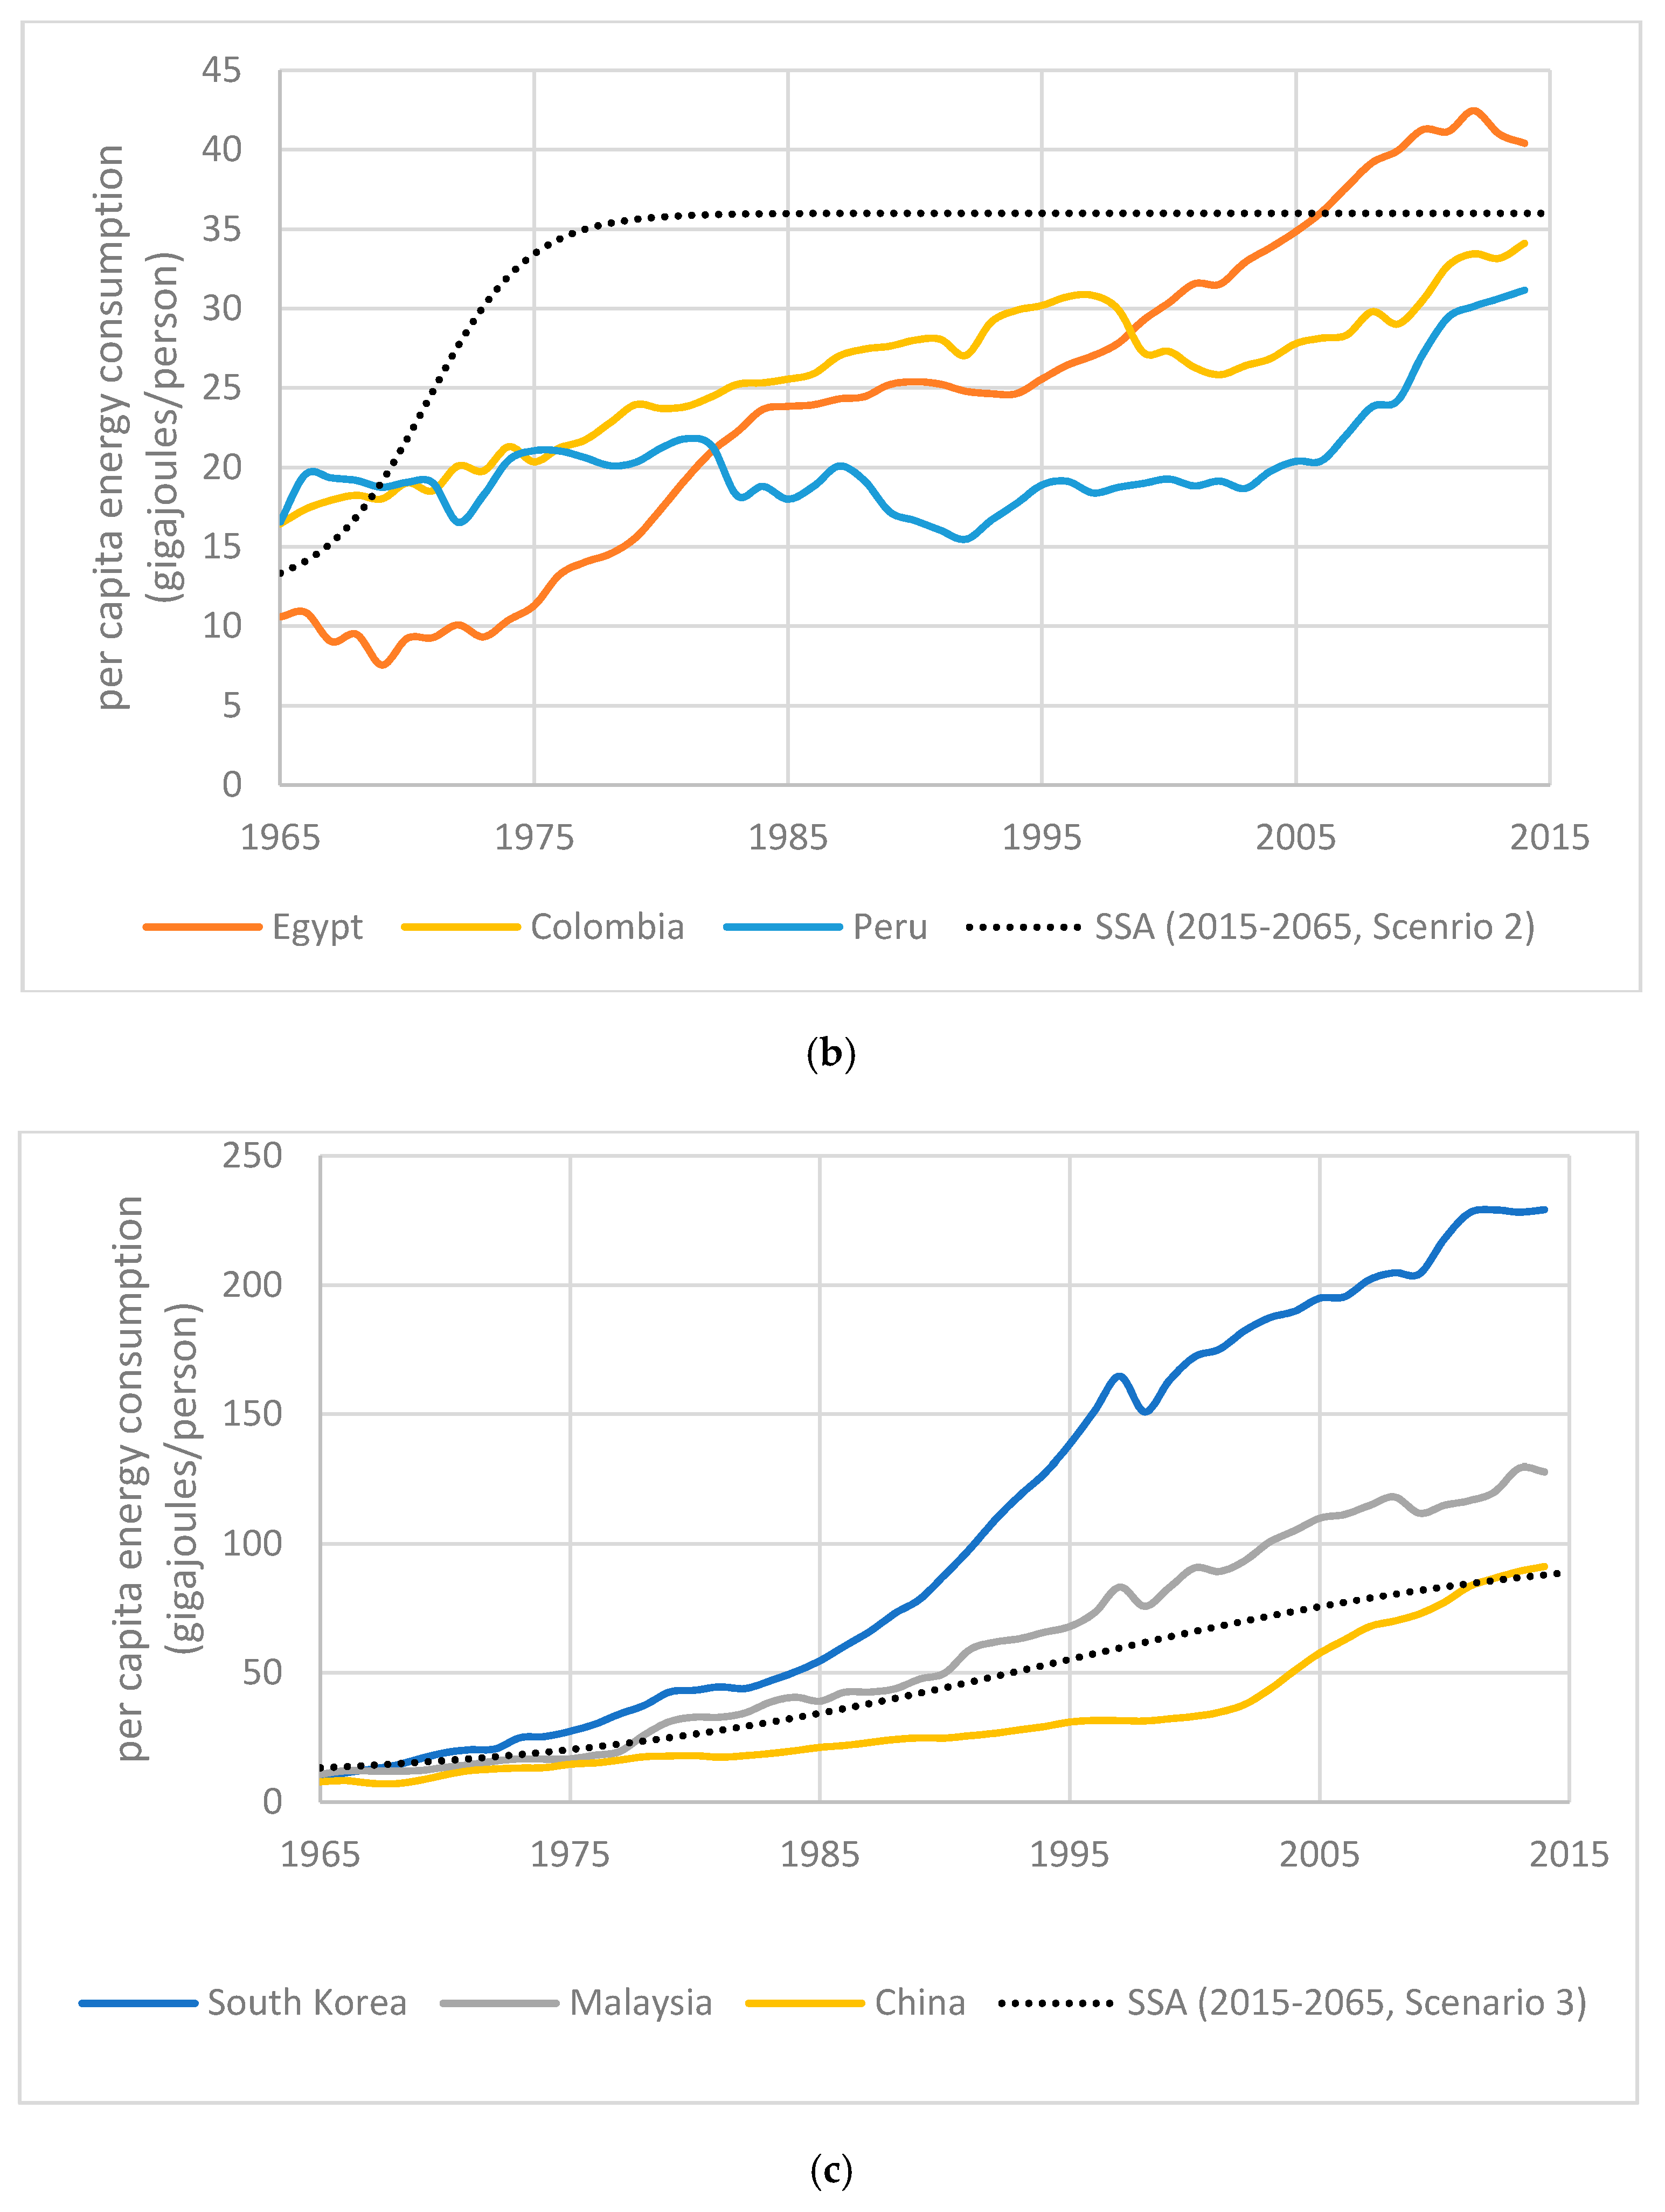
In addition to these results, we have identified nine countries that may serve as historical analogues to the three scenarios we have developed for SSA in the 21st century. Three of those, Pakistan, Philippines, Bangladesh, are potential analogues for scenario 1; three, Egypt, Columbia, Peru, for scenario 2; and three, South Korea, Malaysia, China, for scenario 3 (
Figure 5).
4.1. Scenario 1 Analogues
The partition of India (1947) established the independent nations of India and Pakistan from the former British colony of India. In turn, Bangladesh won independence from Pakistan in 1971. Growth of the energy sector in Pakistan started strong; however, the growth in demand has outpaced supply for decades [
44]. As a result, per capita energy consumption in Pakistan has grown from 6.0 to 16.7 GJ/person since 1965. Currently, the energy situation in Pakistan has been described as a ‘crisis’ resulting from a variety of factors such as debt, declining fossil fuel production, and reliance on inefficient fuels [
45].
By the end of the twentieth century in Bangladesh, more than 80% of the population was dependent on woody biomass for household energy use [
46]. In 2014 the average person in Bangladesh consumed 7 GJ of energy. This number is up from 0.8 GJ at the time of independence. Much like Pakistan, the current energy profile of Bangladesh is heavily reliant on fossil fuels and little progress has been made in the growth of renewable energy [
47]. That said, there has been initiative in renewable energy planning this century as Bangladesh seeks to expand accessibility to the 76% of the population without non-biomass energy access across all uses [
48]. In addition to energy and economic concerns, the majority of Bangladesh and the 160 million people living therein are less than 10 m above sea level. Climate change and sea level rise issues may be of more immediate concerns for Bangladesh.
The United States formally granted independence to the Philippines in 1946. In 1965 the country consumed energy at a rate of 6 GJ per person. The 2014 value was 14 GJ per person. The Philippines remains primarily dependent on imported fossil fuels, though hydropower and RES contributed 13% of total consumption in 2014 [
17]. It is projected that the rate of increase in energy demand will outpace renewables growth in the Philippines and that the RES share of total energy will decrease by 2030 [
49]. Similar to its investment in SSA infrastructure, China has energy-based interests in the Philippines. The Philippines are at the centre of energy-related territorial disputes in the South China Sea [
50].
4.2. Scenario 2 Analogues
In the mid-20th century, several Latin American countries grew their economies as a result of large international loans, that in turn allowed their economies to exhibit desirable, loan-friendly growth [
51]. In the 1980s, the debt of these countries exceeded the ability to pay and as part of the loan restructuring agreement, the countries had to raise exports and taxes and cut many government funded programs [
52]. Colombia and Peru were involved in this Latin American “lost decade” of the 1980s. Interestingly, Peru has a relatively near-high HDI (0.734) despite low per capita energy consumption (31 GJ/person); this may be due to the large discrepancy in urban and rural electrification as 60% of rural Peru does not have access to electricity [
53], compared to a national value of 91% [
16]. Increasing debt remains a primary concern of the economies of several Latin American countries, including Colombia and Brazil [
54].
Egypt has had mixed success in achieving economic and social development. In addition to engaging in two foreign wars, the Egyptian government enforced state control of banks and limited private credit availability in the early 1970s through the 1980s, suppressing growth [
55]. The per capita energy consumption increased markedly in the 1970s, due to declining real energy prices [
56]. It was suggested by Choucri and Lahiri [
57] that this meant that changes in the price of oil would require significant adjustments in the economy. The economy moved towards privatization throughout the 1990s and the economy began to grow at a faster rate [
55]. After the Arab Spring events of 2011, the current struggle to establish a stable government will require input and support from the international community [
58], not unlike the discussed Latin American countries.
4.3. Scenario 3 Analogues
Post Korean War economic growth in South Korea is attributed to foreign investment and aid [
59]. South Korea made the most dramatic growth in per capita energy consumption from 1965–2014. Ko, et al. [
60] noted that the economic development success in South Korea has been tightly correlated with per capita energy consumption. Yoo [
61] corroborates this, finding that the economic growth in South Korea was heavily dependent on growth in per capita electricity consumption. While total energy consumption increased 43-fold from 1965–2014, fossil fuel use only increased 38-fold [
17].
At a GDP annual growth rate of 6% since 1991, Malaysia has transformed from an agrarian economy to a developing nation on the cusp of reaching high human development status [
62]. Causality analysis supports the government’s claims that the growth in the Malaysian economy has been a result of industrialization, and is thus energy dependent [
63]. Additionally, the urbanization of Malaysia since 1970 has been determined to have caused the increase in energy consumption via Granger causality analysis [
64]. Granger causality analysis is a tool for determining time-delayed relationships between data series [
65]. Accounting for 97% of energy consumption in 2014 [
17], the country is currently fossil fuel dependent. With no appreciable coal reserves and only 62 EJ of oil and gas reserves [
17], the success in Malaysia has been heavily reliant on imported energy.
China is classified as a nearly developed nation. The growth in the Chinese economy since the 1970s has been shown to be Granger caused by energy use; however, the effect of international trade has been an important component of China’s 9% per year economic growth rate [
66]. Economic growth in China has also come at the cost of environmental health [
67]. China’s consumption of coal has doubled since 2003 [
17]. There is evidence that growth in China’s economy and a reduction in carbon intensity may be possible [
68]. China has increased its HDI from low human development status (0.501) in 1990 to near-high status (0.727) in 2014 [
69].
4.4. Historical Analogues Discussion
What might these historical examples tell us about SSA? The magnitude of the problem facing SSA in the 21st century is on a scale beyond any of the nine examples. Raising the 2014 SSA population to even 36 GJ/person would immediately make the region dependent on energy imports. The countries discussed in both the historical analogues (as well as those currently in sub-Saharan Africa) were endowed with different resource bases, as well as being home to different cultures and governments and faiths. For example, each of the three countries given as analogues for scenario 3 either had large quantities of domestic fossil fuel reserves early on or now are able to import significant fossil fuels to propel their economy. Each of these countries has a significant trade surplus, and they disproportionately export value-added finished products allowing them to purchase fossil fuel energy. In both China and Malaysia fossil fuel consumption outpaced total energy consumption Fossil fuel use increased 39-fold in Malaysia from 1965–2014, compared to a 37-fold increase, respectively, in total energy consumption [
17]. Given the high population growth rate, limited fossil fuel reserves, and limited demonstrated ability to produce value-added products for export it is unlikely that SSA will be able to build out a renewable energy infrastructure to allow it to increase its per capita energy consumption to a level to significantly improve its HDI.
In contrast, the three countries given as analogues for scenario 1 have failed to significantly increase their per capita energy consumption from 1965 to 2014 (
Figure 5a). These countries had limited fossil fuel energy reserves, have negative trade balances, and have failed to develop robust export markets of value-added finished goods required to generate the capital needed to purchase the energy to meet domestic demand and per capita energy expansion to allow them to achieve a high HDI. These are the best analogues to the future of SSA. In addition, it would not seem desirable to follow the course of actions that resulted in the Latin American Debt Crisis of the 1980s. Relying on extensive foreign loans to build out a renewable energy infrastructure is not a viable option unless SSA could transition from an economy largely driven by raw material exports to one of value-added finished goods [
70].
In each of the example countries discussed above, fossil fuel use and carbon emissions are associated with (regardless of causality) economic growth. It has been suggested via Granger causality analysis that transitioning to renewable energy does not prevent economic growth [
71]. Energy consumption and per capita GDP trends indicate that an accelerated transition to renewable energy is in the best interest of sub-Saharan African countries [
72]. Our study reinforces this notion. In order to achieve the SE4All goal [
1] (scenario 2), SSA will have to triple their per capita energy consumption by 2030 and maintain that level through the 21st century. This expansion in per capita energy consumption can only be met with a significant transition toward renewable energy sources (
Figure 4 and
Table 2).
Table 3 provides an overview of each scenario, the assumptions therein, and the results.
There are other measures that could, in theory, ease the renewable energy transition. These measures are intended to counter the increase in energy consumption associated with economic development [
73]. Decoupling economic development from increased energy use has proven moderately successful in developing economies with well-established programs, but often these economies lack cohesive management plans [
74]. Energy efficiency is often suggested as an energy policy goal, going so far as to be called an energy source in itself. However, rebound effects (Jevons’ Paradox) often result in energy efficient practices leading to increased energy usage [
75]. While energy efficiency is a significant factor in economic development, it has not proven to establish a long-term reduction in overall energy consumption [
76]. Published studies promising quick transitions and current technology often fail rigorous testing of assumptions that include 30%+ efficiency gains, scalability, and renewable energy potential [
77]. It is our opinion that the focus of the energy transition should not rely heavily on efficiency gains at this time.
4.5. Policy Implications
Importing energy is not ideal for any economy. Europe and North America burned their energy reserves in order to fuel the Industrial Revolution, fight two World Wars, and (re)construct some of the most powerful economies in the world. Global production of fossil fuels is not expected to peak until the mid-century [
7,
78,
79]. There is still plenty of energy available, and plenty of energy on the world market (119 EJ of oil were traded in 2014 [
17]); however, the real challenge around the world today is to translate remaining energy reserves and the energy available on the world market to building a renewable energy infrastructure. Waiting for peak global fossil fuel energy production is not likely to lead to a smooth transition away from those peaking fuels. Carbon pledges and the immediacy of climate change should stand as a better motivator for these nations to begin the transition now.
More specifically to the issues affecting SSA, population growth, poverty, health, emigration, climate change, and food security are each a real concern. We doubt that the projected population will be achieved in SSA, especially at such a low per capita energy consumption rate. Of note, since 1965, the total fertility rate of SSA has declined from 6.7 to 5.1 (−1.6 children per woman) [
1]. We examined nine comparative countries throughout the three outlined scenarios in this study. Each of these nine countries have experienced total fertility rate declines between two and three times this rate from 1965–70 to 2010–15. Total fertility rate during this period range from −4.7 children per woman in Bangladesh to −2.9 children per woman in Pakistan [
1]. The UN population projections for SSA include a similar drop (−2.4 child per woman) from today out to 2060–65. The projected total fertility rate for SSA is projected to drop to 2.2 children per woman by 2100. Even with these drops in projected fertility, the population of SSA (median UN projection) still exhibits a 4-fold increase from near 1 billion today to near 4 billion by 2100.
As such, we believe that the impact of total fertility rate and per capita energy consumption is the most important avenue for further SSA research. The fossil fuel energy reserves of the region are ample until 2047 at current population and low consumption levels, though inadequate if either or both figures are to significantly increase. There is a question as to what nuclear energy may produce. Based on historical trends in the region, there will be very limited nuclear power in SSA. Some have suggested that the best short-term option for the region may be to develop small hydropower policies in order to exploit as much of the region’s hydropower potential as possible [
80], but this cannot be a long-term solution as it has estimated that the maximum SSA hydropower potential is 16.3 EJ, and our scenarios show that hydropower can only meet a small percentage of projected energy demand (
Figure 4).
Nobel Laureate Richard Smalley [
81] compiled a list of the ten most pressing needs for humanity in the 21st century. Included on his list were population (#10), education (#8), environment (#4), and food (#3). The most important issue was energy. It was his hypothesis that solving the energy issue would result in a significant lessening of all of the other issues. Our study supports the notion that energy availability may be a root solution to many issues in SSA, highlighting the necessity that that energy will have to come from renewables (
Figure 4). Investment from the developed world could prove a worthwhile investment in both alleviating projected population growth (and thus aid in the future) as well as helping to move the global energy infrastructure towards renewable energy, and thus sustainability.
Recent studies have highlighted potential policy strategies for achieving some of the goals indicated within our model. Given the scale of the issue and the diversity of the national situations in sub-Saharan Africa, we suggest a route that builds energy systems from the ground up, beginning with microgrids. Decentralised renewable energy microgrids have shown promise for energy self-reliance and community-based energy management [
82]. The development of energy storage systems within microgrids has the potential to provide appropriate flexibility to these systems, if proven scalable [
83]. There are different motivations that drive the adoption of renewable energy as a whole, as well as different motivations to adopt different RES [
84]. This said, there remain several issues in evaluating the effectiveness of smart grid cost/benefit analyses [
85]. Despite motivational differences, there is promise that community-based direct involvement in renewable energy development is a key factor in motivating renewable energy adoption [
86]. Given these studies in conjunction with the results of our work here we recommend that efforts to raise the per capita energy consumption in sub-Saharan Africa can be initiated with a focus on improving quality of life without traditionally carbon-intensive large-scale power generation. Though this is not the complete solution to energy availability in sub-Saharan Africa, it represents a promising starting point.
5. Conclusions
In conclusion, per capita energy consumption in SSA should be grown via renewable energy infrastructure and SSA needs to take immediate action to prevent the population growth projected by the UN [
1]. Additional concerns pertaining to the reliability and storage of renewable energy (especially at the scales required in this study) have not been sufficiently addressed from an engineering standpoint. Further research is needed to examine the economic and energy cost-benefit of these two renewable energy paths. Though we have quantified the scale of concerns in sub-Saharan Africa using a different approach, a more specific quantitative and biophysical population projection is necessary for effective policy decisions in the region. Often, studies are quick to present climate change and renewable energy as a hopeless forgone conclusion or as a simple matter of economic substitution and engineering breakthroughs. We believe that the biophysical approach used here offers a balance of real-world limitations and solutions.
We believe that these biophysical approaches will become increasingly necessary for 21st century policymakers. We agree with the late Dr. Smalley’s conclusion that energy is the means to easing the other issues facing the world today. We expand on that conclusion to add that the world will require a massive renewable energy infrastructure buildout by the end of the century [
7], even in the absence of climate change concerns [
9]. SSA is currently a net energy exporting region; however, as we have shown here that energy surplus is a result of extremely low consumption. Throughout this study we have cited other work that finds energy consumption is strongly associated with both economic and social development. The transition to renewable energy has been shown to rely in part on the effectiveness of government [
87]. It is critical that, as a unified region rather than as individual nations, policies are enacted and followed through that begin to plan now for avoiding catastrophic energy poverty in SSA beyond 2050.
We have suggested that the excess production capacity could be utilised along two paths towards a renewable energy region. First, the countries in SSA could continue to be net energy exporters for as long as possible (particularly in selling excess uranium reserves to Europe and China) and use the revenue to invest in the renewable energy infrastructure of the region. Second, SSA could continue to use fossil fuels in-region as a bridge, while diverting the excess capacity as the energy required to produce the physical renewable energy infrastructure. We believe that option one presents a more economically viable option. Though historically, energy sources have taken decades to scale up to global significance [
88], optimism may be found in that recent electrification rates in less developed countries [
89] may offer hope for quicker transitions in SSA. The scale of the energy issue in sub-Saharan Africa (including supply, access, and climate change) presents a case untested in world history. We believe that our findings suggest that the best path forward for sub-Saharan Africa is a unified, regional-scale approach focused on energy access via community-based renewable microgrids.


