Identifying Reliable Opportunistic Data for Species Distribution Modeling: A Benchmark Data Optimization Approach


Abstract
:1. Introduction
2. Methods and Material
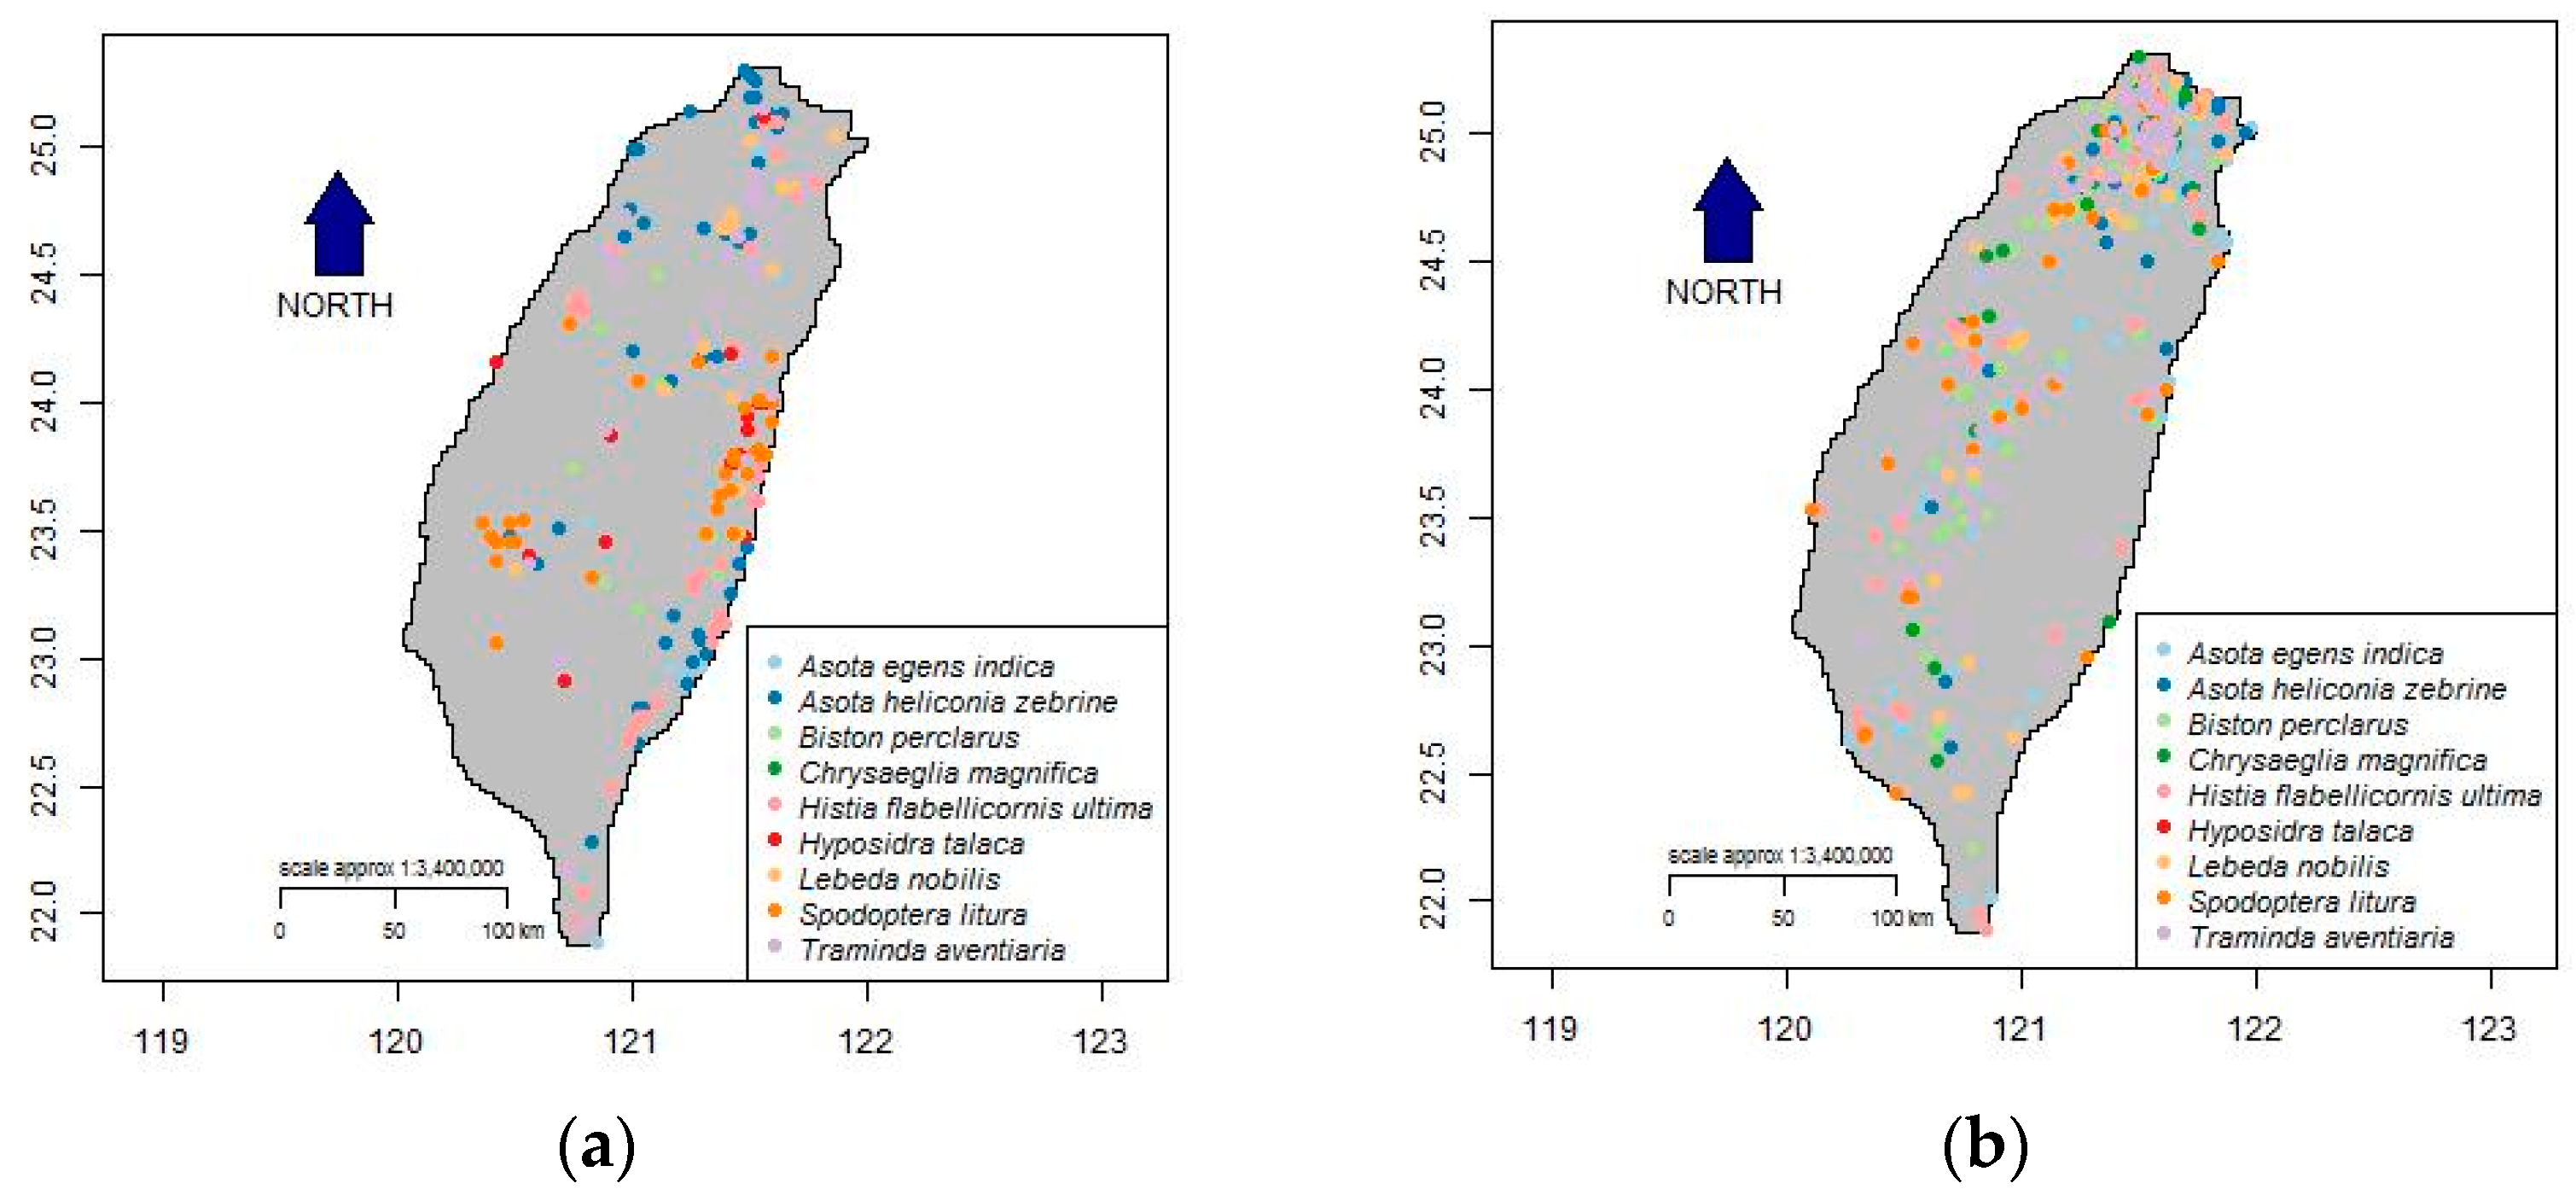
2.1. Study Area and Focal Species
2.2. Optimal Data Filtering Method
- Step 1.
- Select n random samples from (opportunistic data).
- Step 2.
- Calculate the objective function, , which is equal to the geometric mean of based on professional data and n opportunistic data.
- Step 3.
- Implement an annealing schedule: generate a uniform random number, , between 0 and 1. If < 0.5, add a sample into the n random samples from the rest of opportunistic data; otherwise, remove a sample from the n random samples at random. Calculate the objective function, .
- Step 4.
- Calculate M = exp [−Δ/T], where Δ is the change in the objective function, a comparison between the current and the last , and T is the cooling rate (0–1).
- Step 5.
- Generate a uniformed random number (rand) in the range of 0–1. If rand < M, accept the new values; otherwise, discard the changes.
- Step 6.
- Repeat Steps 3–5 until either the objective function value falls beyond a given stop criterion (e.g., > a default value) or a specified number of iterations (e.g., 100,000 runs) have been completed.
2.3. Statistical Testing on Environmental Variables and HSI Similarity among Datasets
2.4. Model Performance Evaluation and Data Bootstrapping for Uncertainty Analysis
3. Results
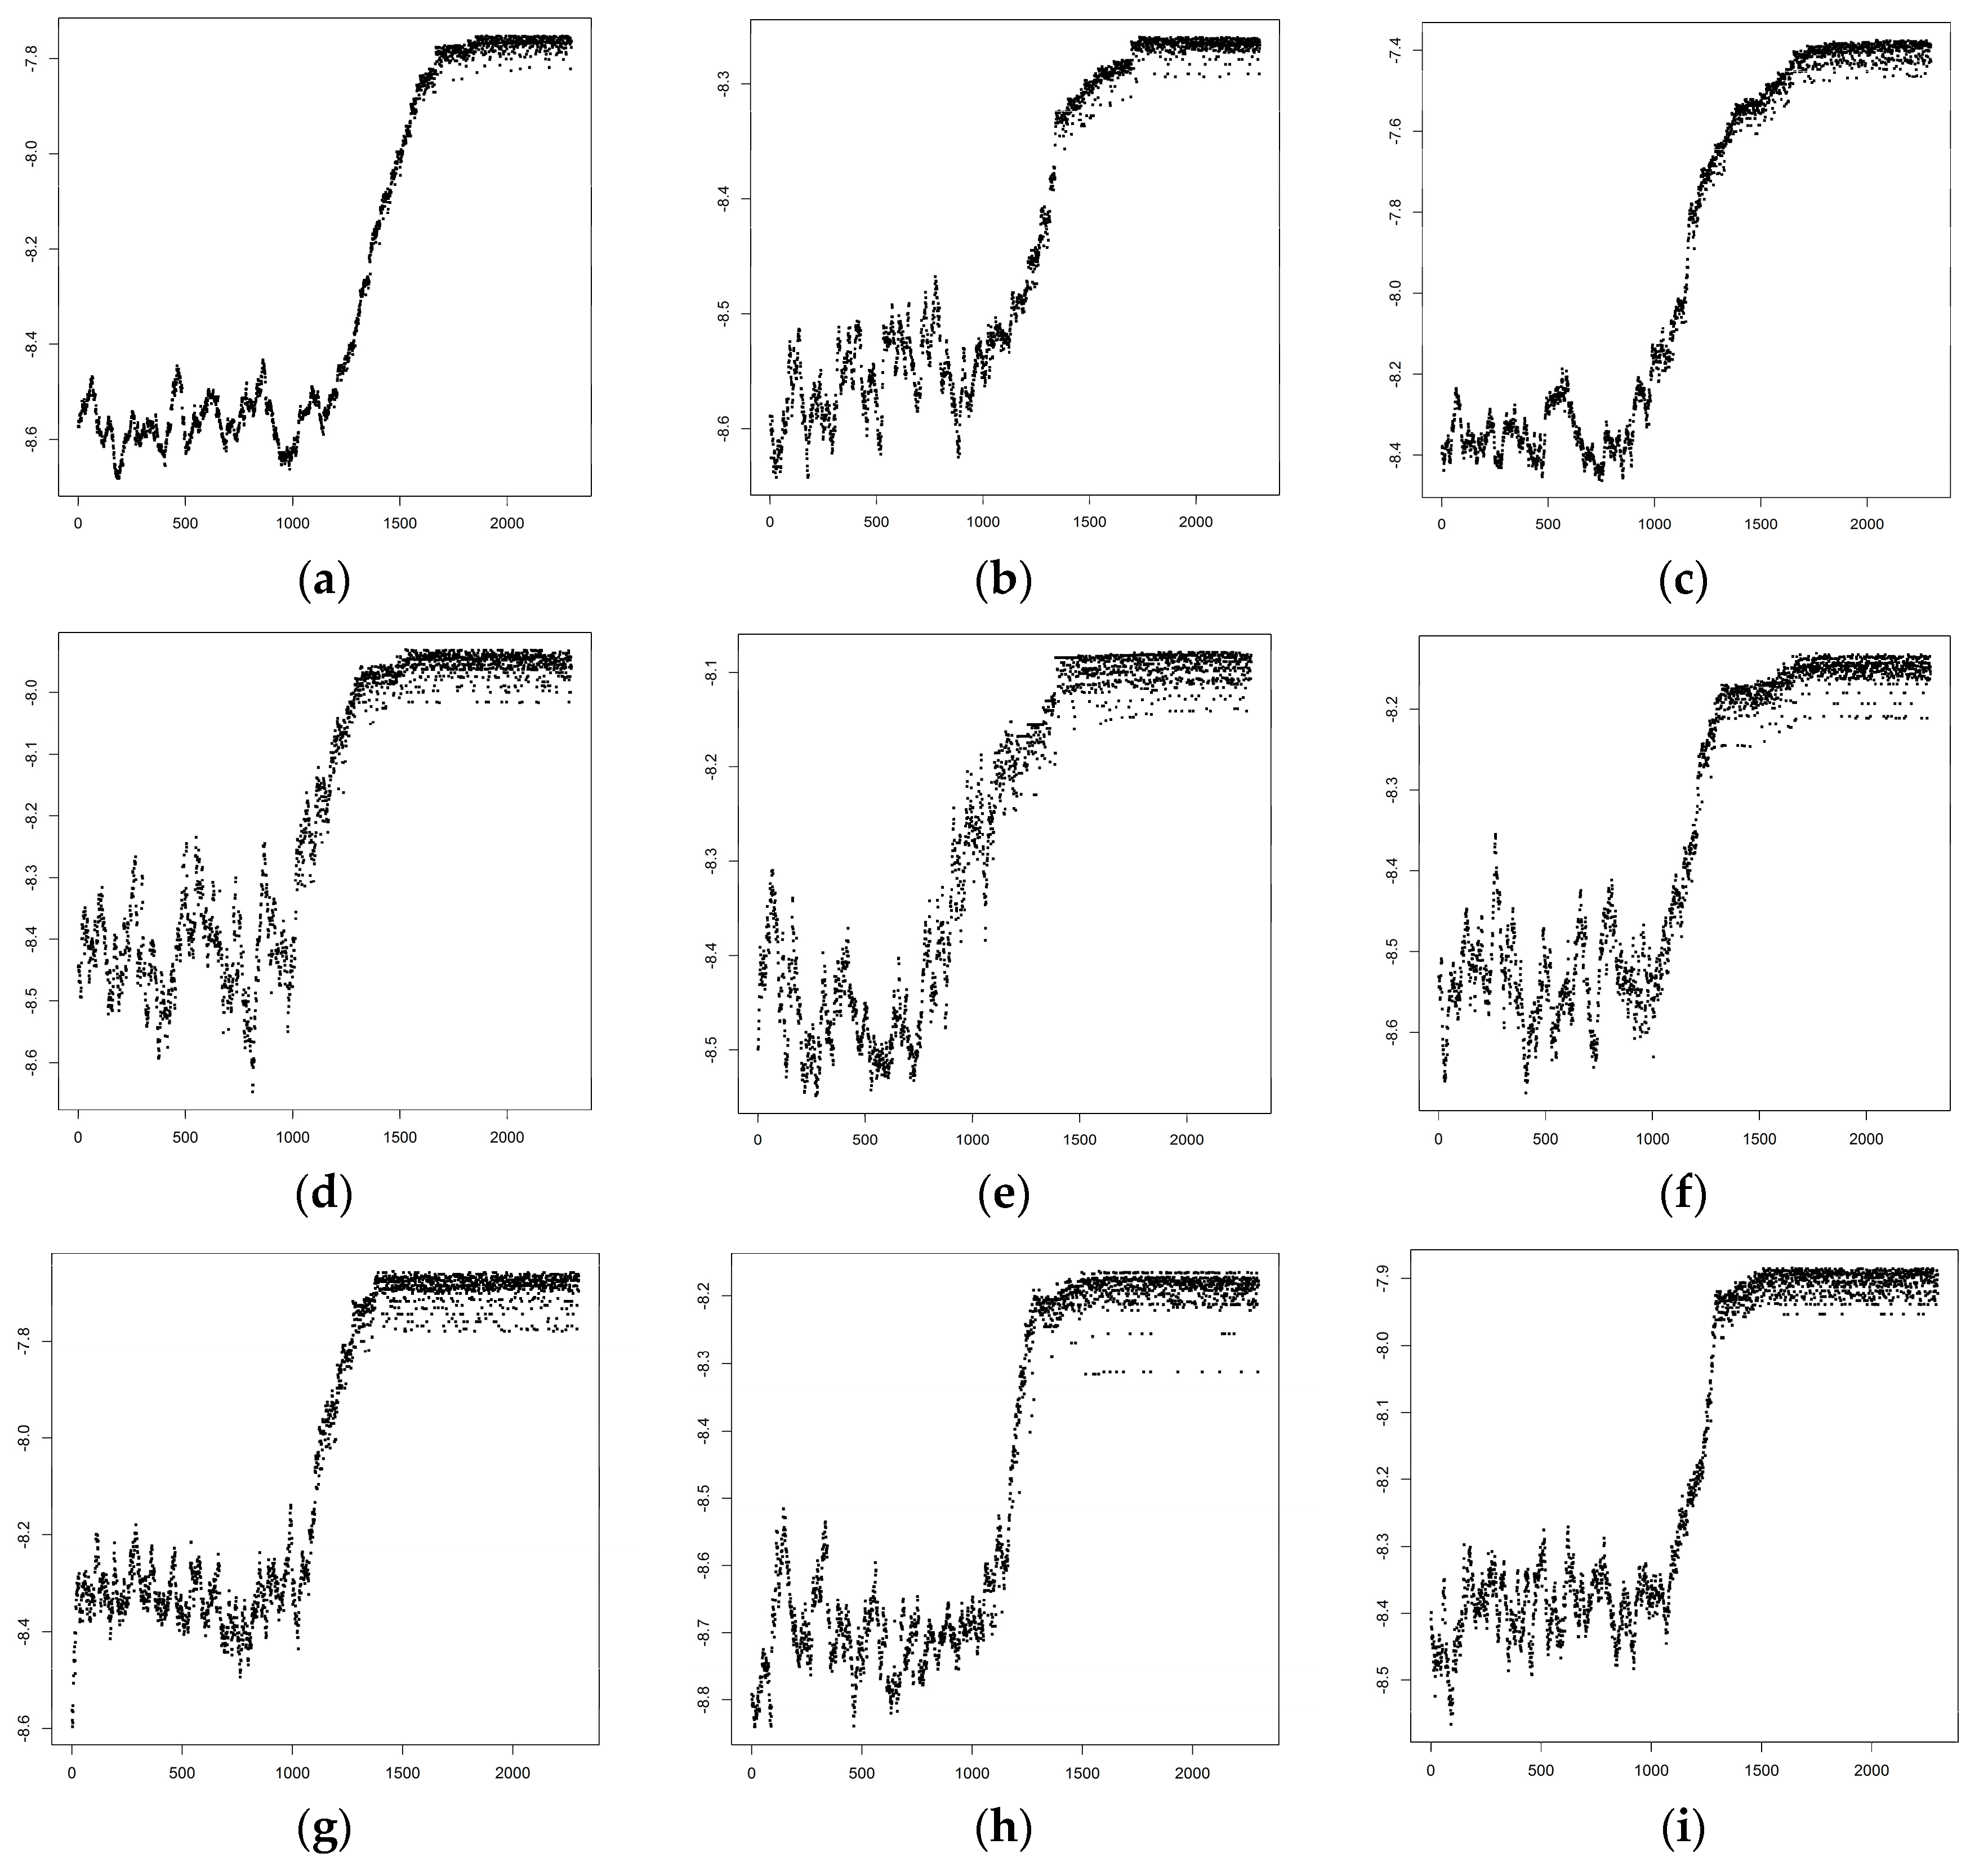
3.1. Optimized Selection of Opportunistic Data
3.2. Statistical Testing on Environmental Variables and HSI Similarity among Datasets
3.3. Performance and Uncertainty Analysis
4. Discussion
4.1. Optimal Data Filtering Procedure
4.2. Uncertainty Analysis
4.3. Method Validation
5. Conclusions
Supplementary Materials
Acknowledgments
Author Contributions
Conflicts of Interest
References
- Isaac, N.J.B.; van Strien, A.J.; August, T.A.; Zeeuw, M.P.D.; Roy, D.B. Statistics for citizen science: Extracting signals of change from noisy ecological data. Methods Ecol. Evol. 2014, 5, 1052–1060. [Google Scholar] [CrossRef]
- Worthington, J.P.; Silvertown, J.; Cook, L.; Cameron, R.; Dodd, M.; Greenwood, R.M.; McConway, K.; Skelton, P. Evolution megalab: A case study in citizen science methods. Methods Ecol. Evol. 2012, 3, 303–309. [Google Scholar] [CrossRef]
- Lin, Y.-P.; Deng, D.; Lin, W.-C.; Lemmens, R.; Crossm, N.D.; Henle, K.; Schmeller, D.S. Uncertainty analysis of crowd-sourced and professionally collected field data used in species distribution models of taiwanese moths. Biol. Conserv. 2015, 181, 102–110. [Google Scholar] [CrossRef]
- Pacifici, K.; Reich, B.J.; Miller, D.A.W.; Gardner, B.; Stauffer, G.; Singh, S.; McKerrow, A.; Collazo, J.A. Integrating multiple data sources in species distribution modeling: A framework for data fusion. Ecology 2017, 98, 840–850. [Google Scholar] [CrossRef] [PubMed]
- Silvertown, J. A new dawn for citizen science. Trends Ecol. Evol. 2009, 24, 467–471. [Google Scholar] [CrossRef] [PubMed]
- Dickinson, J.L.; Zuckerberg, B.; Bonter, D.N. Citizen science as an ecological research tool: Challenges and benefits. Annu. Rev. Ecol. Evol. Syst. 2010, 41, 149–172. [Google Scholar] [CrossRef]
- Newman, G.; Zimmerman, D.; Crall, A.; Laituri, M.; Graham, J.; Stapel, L. User-friendly web mapping: Lessons from a citizen science website. Int. J. Geogr. Inf. Sci. 2010, 24, 1815–1869. [Google Scholar] [CrossRef]
- Jackson, M.M.; Gergel, S.E.; Martin, K. Citizen science and field survey observations provide comparable results for mapping vancouver island white-tailed ptarmigan (lagopus leucura saxatilis) distributions. Biol. Conserv. 2015, 181, 162–172. [Google Scholar] [CrossRef]
- Ratnieks, F.L.W.; Schrell, F.; Sheppard, R.C.; Brown, E.; Bristow, O.E.; Garbuzov, M. Data reliability in citizen science: Learning curve and the effects of training method, volunteer background and experience on identification accuracy of insects visiting ivy flowers. Methods Ecol. Evol. 2016, 7, 1226–1235. [Google Scholar] [CrossRef]
- Bried, J.T.; Siepielski, A.M. Opportunistic data reveal widespread species turnover in enallagma damselflies at biogeographical scales. Ecography 2017. [Google Scholar] [CrossRef]
- Louvrier, J.; Duchamp, C.; Lauret, V.; Marboutin, E.; Cubaynes, S.; Choquet, R.; Miquel, C.; Gimenez, O. Mapping and explaining wolf recolonization in france using dynamic occupancy models and opportunistic data. Ecography 2017. [Google Scholar] [CrossRef]
- Sullivan, B.L.; Phillips, T.; Dayer, A.A.; Wood, C.L.; Farnsworth, A.; Iliff, M.J.; Davies, I.J.; Wiggins, A.; Fink, D.; Hochachka, W.M.; et al. Using open access observational data for conservation action: A case study for birds. Biol. Conserv. 2017, 208. [Google Scholar] [CrossRef]
- eBird. Available online: http://eBird.org (accessed on 29 September 2017).
- Stafford, R.; Hart, A.G.; Collins, L.; Kirkhope, C.L.; Williams, R.L.; Rees, S.G.; Lloyd, J.R.; Goodenough, A.E. Eu-social science: The role of internet social networks in the collection of bee biodiversity data. PLoS ONE 2010, 5, e14381. [Google Scholar] [CrossRef] [PubMed] [Green Version]
- Aanensen, D.M.; Huntley, D.M.; Feil, E.J.; al-Own, F.; Spratt, B.G. Epicollect: Linking smartphones to web applications for epidemiology, ecology and community data collection. PLoS ONE 2009, 4, e6968. [Google Scholar] [CrossRef] [PubMed]
- Delaney, D.G.; Sperling, C.D.; Adams, C.S.; Leung, B. Marine invasive species: Validation of citizen science and implications for national monitoring networks. Biol. Invasions 2008, 10, 117–128. [Google Scholar] [CrossRef]
- Roy, H.E.; Adriaens, T.; Isaac, N.J.B.; Kenis, M.; Onkelinx, T.; Martin, G.S.; Brown, P.M.J.; Hautier, L.; Poland, R.; Roy, D.B.; et al. Invasive alien predator causes rapid declines of native european ladybirds. Divers. Distrib. 2012, 18, 717–725. [Google Scholar] [CrossRef]
- Zapponi, L.; Cini, A.; Bardiani, M.; Hardersen, S.; Maura, M.; Maurizi, E.; Zan, L.R.D.; Audisio, P.; Bologna, M.A.; Carpaneto, G.M.; et al. Citizen science data as an efficient tool for mapping protected saproxylic beetles. Biol. Conserv. 2017, 208, 139–145. [Google Scholar] [CrossRef]
- Geldmann, J.; Heilmann-Clausen, J.; Holm, T.E.; Levinsky, I.; Markussen, B.; Olsen, K.; Rahbek, C.; Tøttrup, A.P. What determines spatial bias in citizen science? Exploring four recording schemes with different proficiency requirements. Divers. Distrib. 2016, 22, 1139–1149. [Google Scholar] [CrossRef]
- Guillera-Arroita, G. Modelling of species distributions, range dynamics and communities under imperfect detection: Advances, challenges and opportunities. Ecography 2017, 40, 281–295. [Google Scholar] [CrossRef]
- Vantieghem, P.; Maes, D.; Kaiser, A.; Merckx, T. Quality of citizen science data and its consequences for the conservation of skipper butterflies (hesperiidae) in flanders (northern belgium). J. Insect Conserv. 2017, 21, 451–463. [Google Scholar] [CrossRef]
- Bonney, R.; Shirk, J.L.; Phillips, T.B.; Wiggins, A.; Ballard, H.L.; Miller-Rushing, A.J.; Parrish, J.K. Citizen science. Next steps for citizen science. Science 2014, 343, 1436–1437. [Google Scholar] [CrossRef] [PubMed]
- Genet, K.S.; Sargent, L.G. Evaluation of methods and data quality from a volunteer-based amphibian call survey. Wildl. Soc. Bull. 2003, 31, 703–714. [Google Scholar]
- Kamp, J.; Oppel, S.; Heldbjerg, H.; Nyegaard, T.; Donald, P.F. Unstructured citizen science data fail to detect long-term population declines of common birds in denmark. Divers. Distrib. 2016, 22, 1024–1035. [Google Scholar] [CrossRef]
- Elith, J.; Graham, C.H.; Anderson, R.P.; Dudík, M.; Ferrier, S.; Guisan, A.; Hijmans, R.J.; Huettmann, F.; Leathwick, J.R.; Lehmann, A.; et al. Novel methods improve prediction of species’ distributions from occurrence data. Ecography 2006, 29, 129–151. [Google Scholar] [CrossRef]
- Fithian, W.; Elith, J.; Hastie, T.; Keith, D.A. Bias correction in species distribution models: Pooling survey and collection data for multiple species. Methods Ecol. Evol. 2015, 6, 424–438. [Google Scholar] [CrossRef] [PubMed]
- Munson, M.A.; Caruana, R.; Fink, D.; Hochachka, W.M.; Iliff, M.; Rosenberg, K.V.; Sheldon, D.; Sullivan, B.L.; Wood, C.; Kelling, S. A method for measuring the relative information content of data from different monitoring protocols. Methods Ecol. Evol. 2010, 1, 263–273. [Google Scholar] [CrossRef]
- Van Strien, A.J.; van Swaay, C.A.M.; Termaat, T. Opportunistic citizen science data of animal species produce reliable estimates of distribution trends if analysed with occupancy models. J. Appl. Ecol. 2013, 50, 1450–1458. [Google Scholar] [CrossRef]
- Kosmala, M.; Wiggins, A.; Swanson, A.; Simmons, B. Assessing data quality in citizen science. Front. Ecol. Environ. 2016, 14, 551–560. [Google Scholar] [CrossRef]
- Sullivan, B.L.; Aycrigg, J.L.; Barry, J.H.; Bonney, R.E.; Bruns, N.; Cooper, C.B.; Damoulas, T.; Dhondt, A.A.; Dietterich, T.; Farnsworth, A.; et al. The ebird enterprise: An integrated approach to development and application of citizen science. Biol. Conserv. 2014, 169, 31–40. [Google Scholar] [CrossRef]
- Theobald, E.J.; Ettinger, A.K.; Burgess, H.K.; DeBey, L.B.; Schmidt, N.R.; Froehlich, H.E.; Wagner, C.; HilleRisLambers, J.; Tewksbury, J.; Harsch, M.A.; et al. Global change and local solutions: Tapping the unrealized potential of citizen science for biodiversity research. Biol. Conserv. 2015, 181, 236–244. [Google Scholar] [CrossRef]
- Jetz, W.; McPherson, J.M.; Guralnick, R.P. Integrating biodiversity distribution knowledge: Toward a global map of life. Trends Ecol. Evol. 2012, 27, 151–159. [Google Scholar] [CrossRef] [PubMed]
- Maes, D.; Vanreusel, W.; Jacobs, I.; Berwaerts, K.; Dyck, H. Applying iucn red list criteria at a small regional level: A test case with butterflies in flanders (north belgium). Biol. Conserv. 2012, 145, 258–266. [Google Scholar] [CrossRef]
- Yu, J.; Wong, W.-K.; Hutchinson, R.A. Modeling experts and novices in citizen science data for species distribution modeling. In Proceedings of the 2010 IEEE International Conference on Data Mining, Sydney, Australia, 13–17 December 2010; pp. 1157–1162. [Google Scholar]
- Yu, J.; Kelling, S.; Gerbracht, J.; Wong, W.-K. Automated data verification in a large-scale citizen science project: A case study. In Proceedings of the 2012 IEEE 8th International Conference on E-Science, Chicago, IL, USA, 8–12 October 2012; pp. 1–8. [Google Scholar]
- Enjoymoths FB Group. Available online: https://www.facebook.com/groups/EnjoyMoths2/ (accessed on 29 September 2017).
- Taiwan Biodiversity Information Facility. Available online: http://taibif.tw/en (accessed on 29 September 2017).
- Metzger, M.J.; Bunce, R.G.H.; Jongman, R.H.G.; Sayre, R.; Trabucco, A.; Zomer, R. A high-resolution bioclimate map of the world: A unifying framework for global biodiversity research and monitoring. Glob. Ecol. Biogeogr. 2013, 22, 630–638. [Google Scholar] [CrossRef]
- Guisan, A.; Thuiller, W. Predicting species distribution: Offering more than simple habitat models. Ecol. Lett. 2005, 8, 993–1009. [Google Scholar] [CrossRef]
- Peterson, A.T.; Papeş, M.; Eaton, M. Transferability and model evaluation in ecological niche modeling: A comparison of garp and maxent. Ecography 2007, 30, 550–560. [Google Scholar] [CrossRef]
- Naimi, B.; Araújo, M.B. Sdm: A reproducible and extensible r platform for species distribution modelling. Ecography 2016, 39, 368–375. [Google Scholar] [CrossRef]
- Thuiller, W. Patterns and uncertainties of species’ range shifts under climate change. Glob. Chang. Biol. 2004, 10, 2020–2027. [Google Scholar] [CrossRef]
- Grenouillet, G.; Buisson, L.; Casajus, N.; Lek, S. Ensemble modelling of species distribution: The effects of geographical and environmental ranges. Ecography 2011, 34, 9–17. [Google Scholar] [CrossRef]
- Dorazio, R.M. Accounting for imperfect detection and survey bias in statistical analysis of presence-only data. Glob. Ecol. Biogeogr. 2014, 23, 1472–1484. [Google Scholar] [CrossRef]
- Robini, M.C.; Reissman, P.-J. From simulated annealing to stochastic continuation: A new trend in combinatorial optimization. J. Glob. Optim. 2013, 56, 185–215. [Google Scholar] [CrossRef]
- Buisson, L.; Thuiller, W.; Casajus, N.; Lek, S.; Grenouillet, G. Uncertainty in ensemble forecasting of species distribution. Glob. Chang. Biol. 2009, 16, 1145–1157. [Google Scholar] [CrossRef]
- Barry, S.; Elith, J. Error and uncertainty in habitat models. J. Appl. Ecol. 2006, 43, 413–423. [Google Scholar] [CrossRef]


| Data Type | GBIF | FB | (FB_o) | Proportion | ||||
|---|---|---|---|---|---|---|---|---|
| Species | 0.3 | 0.4 | 0.5 | 0.3 | 0.4 | 0.5 | ||
| Asota egens indica | 37 | 170 | 69 | 60 | 54 | 41% | 35% | 32% |
| Asota heliconia zebrina | 103 | 101 | 60 | 60 | 59 | 59% | 59% | 58% |
| Biston perclarus | 29 | 140 | 58 | 51 | 43 | 41% | 36% | 31% |
| Chrysaeglia magnifica | 39 | 60 | 23 | 28 | 23 | 38% | 47% | 38% |
| Histia flabellicornis ultima | 58 | 67 | 10 | 10 | 11 | 15% | 15% | 16% |
| Hyposidra talaca | 34 | 63 | 28 | 28 | 28 | 44% | 44% | 44% |
| Lebeda nobilis | 21 | 63 | 29 | 28 | 20 | 46% | 44% | 32% |
| Spodoptera litura | 33 | 59 | 20 | 20 | 20 | 34% | 34% | 34% |
| Traminda aventiaria | 39 | 64 | 28 | 27 | 28 | 44% | 42% | 44% |
| Dataset | FB | GBIF | GBIF + FB_o | |
|---|---|---|---|---|
| Species | ||||
| Asota egens indica |  |  |  | |
| Asota heliconia zebrine |  | 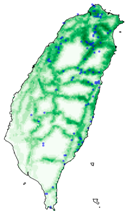 |  | |
| Biston perclarus |  |  |  | |
| Chrysaeglia magnifica | 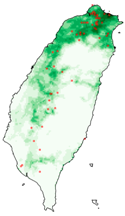 | 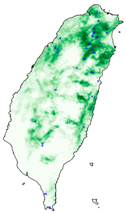 | 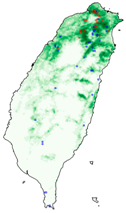 | |
| Histia flabellicornis ultima | 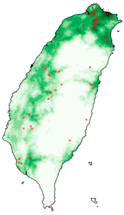 |  | 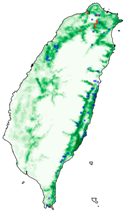 | |
| Hyposidra talaca | 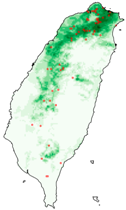 | 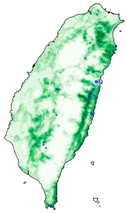 | 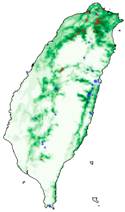 | |
| Lebeda nobilis |  | 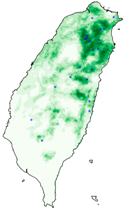 | 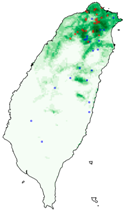 | |
| Spodoptera litura | 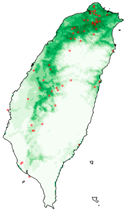 |  | 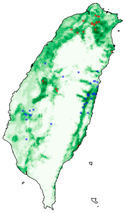 | |
| Traminda aventiaria |  |  |  | |
 | ||||
| Species | FB | GBIF + FB | GBIF + FB_o | GBIF + FB_r |
|---|---|---|---|---|
| Asota egens indica | 0.39 | 0.57 | 0.71 | 0.78 |
| Asota heliconia zebrine | 0.59 | 0.88 | 0.91 | 0.90 |
| Biston perclarus | 0.49 | 0.64 | 0.77 | 0.74 |
| Chrysaeglia magnifica | 0.47 | 0.80 | 0.91 | 0.90 |
| Histia flabellicornis ultima | 0.40 | 0.85 | 0.99 | 0.96 |
| Hyposidra talaca | 0.17 | 0.61 | 0.77 | 0.78 |
| Lebeda nobilis | 0.44 | 0.69 | 0.84 | 0.82 |
| Spodoptera litura | 0.19 | 0.62 | 0.83 | 0.82 |
| Traminda aventiaria | 0.54 | 0.83 | 0.86 | 0.94 |
| SDM Type | AUC Results | ||
|---|---|---|---|
| GAM | Asota egens indica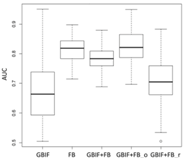 | Asota heliconia zebrine | Biston perclarus |
Chrysaeglia magnifica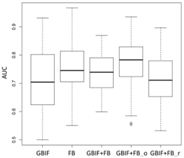 | Histia flabellicornis ultima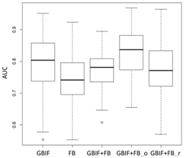 | Hyposidra talaca | |
Lebeda nobilis | Spodoptera litura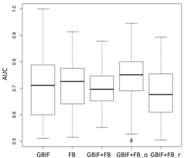 | Traminda aventiaria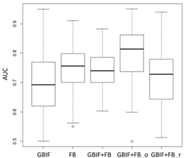 | |
| GLM | Asota egens indica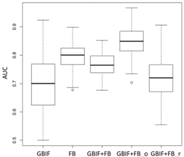 | Asota heliconia zebrine | Biston perclarus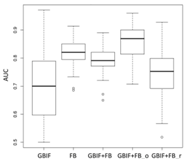 |
Chrysaeglia magnifica | Histia flabellicornis ultima | Hyposidra talaca | |
Lebeda nobilis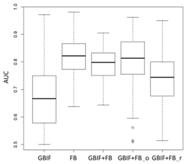 | Spodoptera litura | Traminda aventiaria | |
| Maxent | Asota egens indica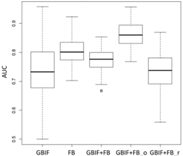 | Asota heliconia zebrine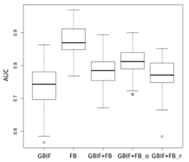 | Biston perclarus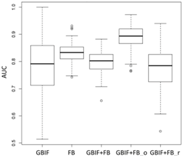 |
Chrysaeglia magnifica | Histia flabellicornis ultima | Hyposidra talaca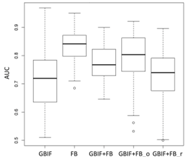 | |
Lebeda nobilis | Spodoptera litura | Traminda aventiaria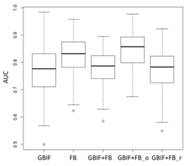 | |
| SVM | Asota egens indica | Asota heliconia zebrine | Biston perclarus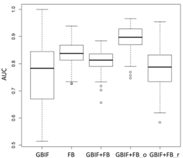 |
Chrysaeglia magnifica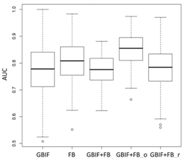 | Histia flabellicornis ultima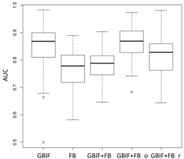 | Hyposidra talaca | |
Lebeda nobilis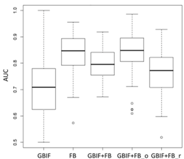 | Spodoptera litura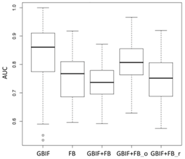 | Traminda aventiaria | |
| Species | Model | Dataset | ||||
|---|---|---|---|---|---|---|
| GBIF | FB | GBIF + FB | GBIF + FB_o | GBIF + FB_r | ||
| Asota egens indica | GAM | 0.90 | 0.97 | 0.98 | 0.97 | 0.90 |
| GLM | 0.53 | 0.87 | 0.88 | 0.81 | 0.73 | |
| Maxent | 0.32 | 0.77 | 0.78 | 0.60 | 0.55 | |
| SVM | 0.68 | 0.82 | 0.82 | 0.87 | 0.72 | |
| Asota heliconia zebrina | GAM | 0.95 | 0.98 | 0.98 | 0.98 | 0.96 |
| GLM | 0.78 | 0.81 | 0.89 | 0.88 | 0.86 | |
| Maxent | 0.62 | 0.59 | 0.79 | 0.76 | 0.73 | |
| SVM | 0.81 | 0.85 | 0.84 | 0.85 | 0.81 | |
| Biston perclarus | GAM | 0.91 | 0.98 | 0.98 | 0.97 | 0.91 |
| GLM | 0.43 | 0.85 | 0.88 | 0.72 | 0.69 | |
| Maxent | 0.28 | 0.70 | 0.73 | 0.44 | 0.42 | |
| SVM | 0.72 | 0.82 | 0.80 | 0.83 | 0.73 | |
| Chrysaeglia magnifica | GAM | 0.92 | 0.96 | 0.96 | 0.96 | 0.91 |
| GLM | 0.58 | 0.68 | 0.78 | 0.70 | 0.65 | |
| Maxent | 0.30 | 0.41 | 0.57 | 0.43 | 0.38 | |
| SVM | 0.71 | 0.77 | 0.78 | 0.81 | 0.71 | |
| Histia flabellicornis ultima | GAM | 0.96 | 0.95 | 0.97 | 0.97 | 0.95 |
| GLM | 0.69 | 0.70 | 0.86 | 0.77 | 0.74 | |
| Maxent | 0.47 | 0.47 | 0.71 | 0.55 | 0.50 | |
| SVM | 0.82 | 0.71 | 0.81 | 0.87 | 0.81 | |
| Hyposidra talaca | GAM | 0.90 | 0.95 | 0.95 | 0.95 | 0.90 |
| GLM | 0.49 | 0.73 | 0.80 | 0.71 | 0.65 | |
| Maxent | 0.35 | 0.47 | 0.62 | 0.47 | 0.45 | |
| SVM | 0.64 | 0.82 | 0.80 | 0.81 | 0.73 | |
| Lebeda nobilis | GAM | 0.86 | 0.95 | 0.96 | 0.95 | 0.86 |
| GLM | 0.29 | 0.73 | 0.79 | 0.53 | 0.54 | |
| Maxent | 0.24 | 0.45 | 0.54 | 0.33 | 0.29 | |
| SVM | 0.65 | 0.82 | 0.79 | 0.79 | 0.70 | |
| Spodoptera litura | GAM | 0.91 | 0.95 | 0.95 | 0.95 | 0.89 |
| GLM | 0.35 | 0.68 | 0.71 | 0.59 | 0.53 | |
| Maxent | 0.20 | 0.39 | 0.54 | 0.36 | 0.29 | |
| SVM | 0.74 | 0.74 | 0.72 | 0.73 | 0.64 | |
| Traminda aventiaria | GAM | 0.92 | 0.96 | 0.97 | 0.96 | 0.92 |
| GLM | 0.56 | 0.69 | 0.80 | 0.72 | 0.68 | |
| Maxent | 0.31 | 0.40 | 0.60 | 0.41 | 0.40 | |
| SVM | 0.69 | 0.78 | 0.76 | 0.81 | 0.71 | |
| Average | 0.62 | 0.75 | 0.81 | 0.75 | 0.69 | |
© 2017 by the authors. Licensee MDPI, Basel, Switzerland. This article is an open access article distributed under the terms and conditions of the Creative Commons Attribution (CC BY) license (http://creativecommons.org/licenses/by/4.0/).
Share and Cite
Lin, Y.-P.; Lin, W.-C.; Lien, W.-Y.; Anthony, J.; Petway, J.R. Identifying Reliable Opportunistic Data for Species Distribution Modeling: A Benchmark Data Optimization Approach. Environments 2017, 4, 81. https://doi.org/10.3390/environments4040081
Lin Y-P, Lin W-C, Lien W-Y, Anthony J, Petway JR. Identifying Reliable Opportunistic Data for Species Distribution Modeling: A Benchmark Data Optimization Approach. Environments. 2017; 4(4):81. https://doi.org/10.3390/environments4040081
Chicago/Turabian StyleLin, Yu-Pin, Wei-Chih Lin, Wan-Yu Lien, Johnathen Anthony, and Joy R. Petway. 2017. "Identifying Reliable Opportunistic Data for Species Distribution Modeling: A Benchmark Data Optimization Approach" Environments 4, no. 4: 81. https://doi.org/10.3390/environments4040081
APA StyleLin, Y.-P., Lin, W.-C., Lien, W.-Y., Anthony, J., & Petway, J. R. (2017). Identifying Reliable Opportunistic Data for Species Distribution Modeling: A Benchmark Data Optimization Approach. Environments, 4(4), 81. https://doi.org/10.3390/environments4040081