Abstract
The spatial footprint of unconventional (hydraulic fracturing) and conventional oil and gas development in the Marcellus Shale region of the State of Pennsylvania was digitized from high-resolution, ortho-rectified, digital aerial photography, from 2004 to 2010. We used these data to measure the spatial extent of oil and gas development and to assess the exposure of the extant natural resources across the landscape of the watersheds in the study area. We found that either form of development: (1) occurred in ~50% of the 930 watersheds that defined the study area; (2) was closer to streams than the recommended safe distance in ~50% of the watersheds; (3) was in some places closer to impaired streams and state-defined wildland trout streams than the recommended safe distance; (4) was within 10 upstream kilometers of surface drinking water intakes in ~45% of the watersheds that had surface drinking water intakes; (5) occurred in ~10% of state-defined exceptional value watersheds; (6) occurred in ~30% of the watersheds with resident populations defined as disproportionately exposed to pollutants; (7) tended to occur at interior forest locations; and (8) had >100 residents within 3 km for ~30% of the unconventional oil and gas development sites. Further, we found that exposure to the potential effects of landscape disturbance attributable to conventional oil and gas development was more prevalent than its unconventional counterpart.
1. Introduction
Relatively new, unconventional, deep drilling and extraction technology known, as hydraulic fracturing, or “fracking”, has created important new sources and markets for hydrocarbon products, especially for natural gas. In less than 10 years, approximately 10,000 wells have been established in the Marcellus Shale region of the State of Pennsylvania in the United States (Figure 1) []. The environmental impact of this activity is potentially critical and is even more important considering that the area has been exploited for other types of hydrocarbon extraction, (oil, coal, methane) for over 100 years. See Figure 2. Although there has been much attention given to the effects of fracking, it is critical to understand the context of decades of other hydrocarbon extraction in which this takes place. This paper examines the combined impact of both conventional and unconventional hydrocarbon extraction in this region utilizing Geographic Information Systems (GIS) technology and available geospatial and social datasets.
Activities associated with unconventional oil and gas development have created socio-economic and environmental concerns. Prominent among the socio-economic concerns are overall economic benefit, differential rents paid to landowners, disparate perspectives on environmental responsibilities among landowners, property value decline, strain on local infrastructure and state and local institutions and on-site and off-site environmental impacts [,,]. Environmental concerns related to unconventional oil and gas development include water quantity [,], water quality [,,,,,,,], air quality impacts [] and habitat fragmentation [,,].
The recent development of unconventional oil and gas resources by use of directional drilling and hydraulic fracturing extends a long history of various types of oil and gas development in Pennsylvania. The first commercial oil field was established near the city of Titusville, Pennsylvania in 1859 [], and it has been estimated that approximately 325,000 oil and gas wells have been developed since that time []. It is useful to classify current oil and gas development in Pennsylvania (and elsewhere) into two types: unconventional (directional drilling, hydraulic fracturing and stimulation of relatively long wells drilled along sub-horizontal reservoirs, primarily in shale that is rich in organic matter, and in coal beds) and conventional (vertical wells drilled in closed structural stratigraphic and combination traps combined with local stimulation of the relatively porous reservoir rocks) []. Conventional wells are also generally developed by hydraulically fracturing rock layers, but they are typically not as deep and do not utilize the volume of fluids required for unconventional wells [].
Both unconventional and conventional oil and gas deposits occur in Pennsylvania, including coal-bed methane [,,], and both types of deposits present potential environmental impacts [,,,,,] (Table S1). The U.S. Geological Survey [], Figure S1 and Gregory et al. [] provide useful schematics for understanding the different types of oil and gas development.
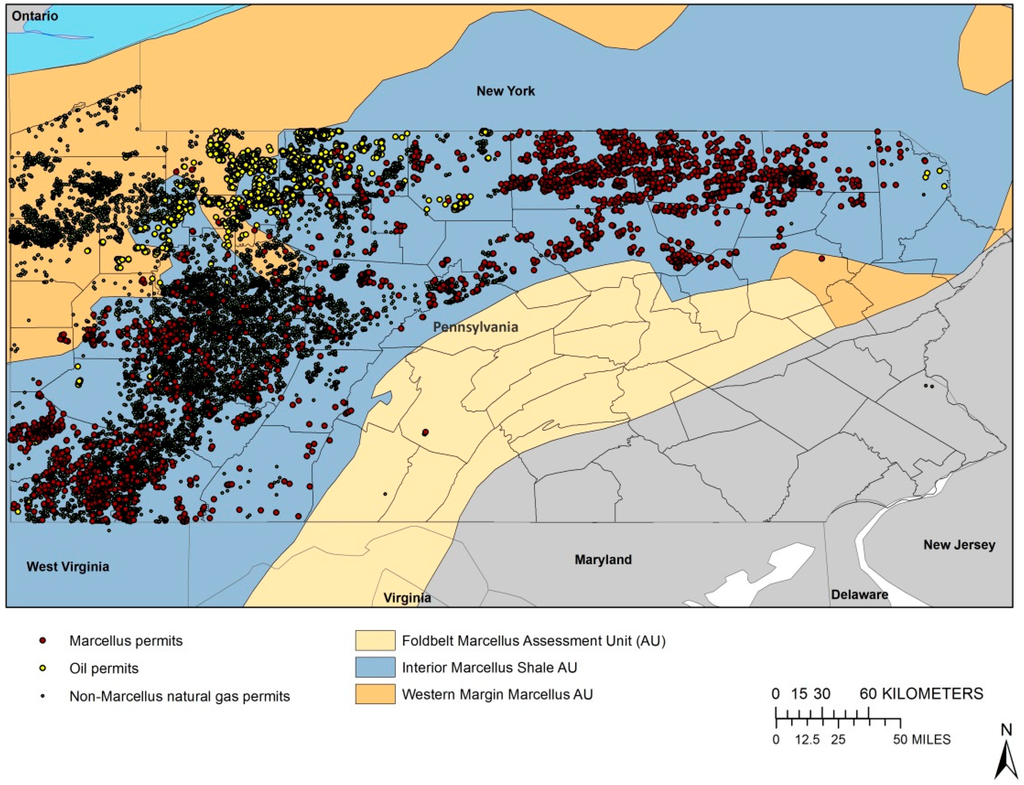
Figure 1.
The distribution of unconventional (Marcellus) and conventional (non-Marcellus) natural gas permits within Pennsylvania. Base-map data courtesy of the U.S. Geological Survey National Atlas [].
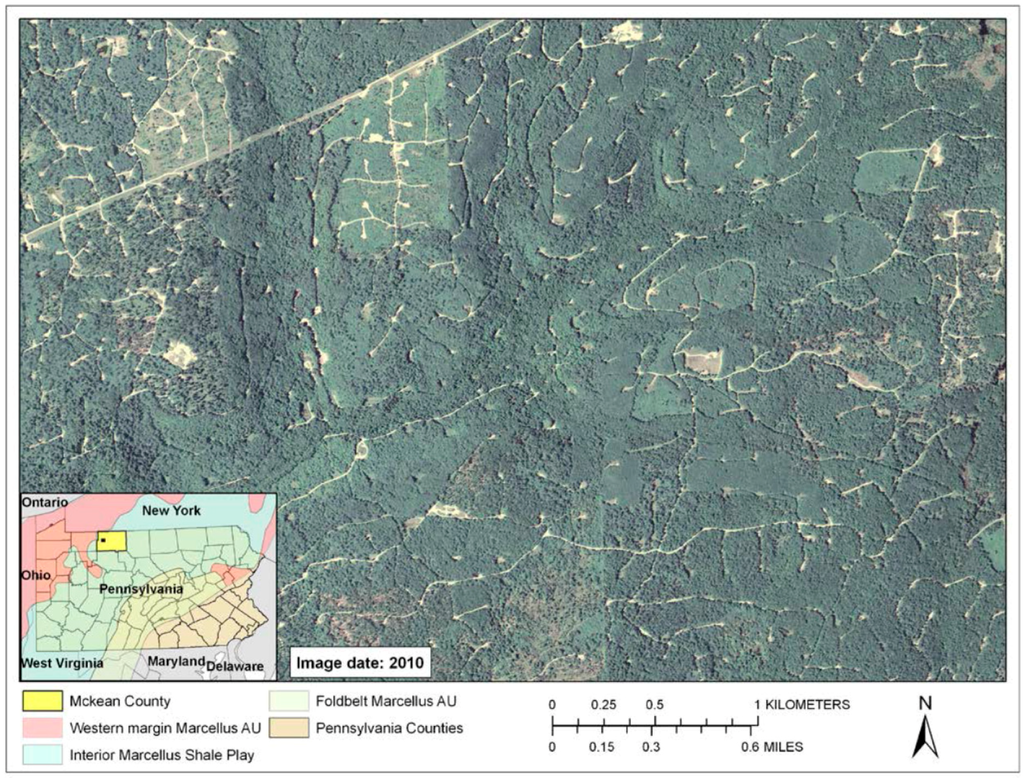
Figure 2.
A forested landscape in McKean County, Pennsylvania, showing the distribution of roads, well pads and pipelines related to combined hydrocarbon development. This particular pattern of disturbance is primarily the result of conventional oil and gas development, but highlights the combined effects of decades of hydrocarbon extraction in Pennsylvania. Source: National Agricultural Imagery Program.
The objective of this paper is to present a comprehensive assessment of the potential impacts that arise from unconventional and conventional oil and gas exploration across the Pennsylvania landscape. We examine landscape disturbance in the context of proximity to streams, impaired streams (as defined by the Clean Water Act), wildland trout streams (as defined by the State of Pennsylvania) and proximity of surface drinking water intakes to oil and gas development sites. We also assess the fragmenting effects of oil and gas development on Pennsylvania forests, the occurrence of oil and gas development on exceptional value lands (as defined by Pennsylvania) and the number of people living in close proximity to unconventional oil and gas development sites. Many studies have focused on the potential impacts of unconventional oil and gas development in Pennsylvania, especially as they relate to water quality [,,,,,]. Without including conventional sites, it is not possible to assess the combined disturbance from all oil and gas development in the state []. We provide brief overviews of directional drilling and hydraulic fracturing, coal-bed methane and conventional activities in the electronic online Supplemental Information.
2. Methods
2.1. Study Area and Data Preparation
The 81,480-km2 study area was defined as all of the 12-digit hydrologic units (watersheds) from the watershed boundary dataset (WBD) used by the National Hydrography Dataset (NHD) [] within the Marcellus Shale Interior Assessment Unit []. The NHD is the surface-water component of The National Map. The NHD contains features, such as lakes, ponds, streams, rivers, canals, dams and streamgages, for digital mapping and analysis of surface-water systems. Watersheds were chosen as the analysis unit because of the aquatic resources focus of this research. Site disturbance from unconventional and conventional oil and gas exploration was mapped from high-resolution digital aerial photography acquired through the National Agriculture Imagery Program (NAIP) from 2004, 2005/2006, 2008 and 2010. NAIP provides ortho-rectified imagery at 2 to 3 year intervals at a spatial resolution of approximately 1 m2 [].
Sites were photo-identified as unconventional or conventional using the locational and permit information contained within the permit database maintained by the Pennsylvania Department of Environmental Protection (PADEP) []. Site disturbance from unconventional and conventional oil and gas development was mapped separately so that the individual and combined effects of both activities could be evaluated. Coal-bed methane sites were classified as conventional in this study, because the permit database did not identify this activity specifically. In general, a site is a verified, and/or photo-identified disturbed pad, with a road and/or impoundment that has altered the natural environment whether or not it is producing, abandoned, exploratory or unpermitted. Thus, our datasets distinguish directional drilling and hydraulic fracturing from all other types of oil and gas development in the Marcellus region of Pennsylvania.
The number of individual unconventional and conventional oil and gas sites are 1632 and 11,204 respectively, and their respective total areas are ~37 km2 and ~57 km2 for a total area of 94 km2 (Table 2). While most sites have a single permit, there are sites identified, in the permit databases, as both unconventional and conventional, because permits for both types of drilling are associated with the site. Oil permits also may be associated with sites permitted as unconventional, conventional or both activities. For reporting purposes (Table 2), we have labeled the permit types as fracking only (MS), conventional only (conv), fracking and oil (MS-oil), conventional and oil (conv-oil), fracking and conventional (MS-conv) and fracking, conventional and oil (MS-conv-oil). Oil permits also may be associated with either, or both, unconventional and conventional permits. The MS-conv-oil and MS-conv permits are duplicated across unconventional and conventional site files. Because both conventional and unconventional development can occur at the same site, the combined areal footprint of both types of development in the study region is ~85 km2, which is less than the total area of 94 km2. Analyses of the combined disturbance from both types of development were based on combining the two datasets and eliminating duplicate polygons. The typical sizes of individual conventional and unconventional sites are small (~0.005 km2 and ~0.025 km2, respectively), as indicated by the areal and numerical statistics (Table 2). Conventional sites tend to be concentrated in the western portion of the study area, and unconventional sites tend to be concentrated in the southwestern and northeastern portions of the study area (Figure S2 in Supplemental Information; see also Figure 3).
Several spatial datasets were used to examine the potential landscape effects of unconventional and conventional oil and gas exploration. These datasets included exceptional value watersheds, wilderness trout streams, environmental justice areas (http://www.pasda.psu.edu), streams from the 1:24,000 National Hydrography Data (NHD) [,], surface drinking water intakes [,], streams identified as impaired under Section 303(d) of the Clean Water Act (CWA) [], population (dasymetrically computed from census data [] and land cover [].
Exceptional value (EVAL) streams were published in 1996 by the PADEP and are based on stream surveys conducted by the Environmental Resources Research Institute and Law Environmental Incorporated and define high-quality streams based on a number of factors (see the Supplemental Information, Section 4.4). The survey identified 116 streams statewide of which 86 occurred in the Marcellus study area and ranged in size from 1.38 km2 to 92.56 km2. These streams are small, sub-watersheds and tended to occur in the headwaters of the 12-digit watersheds. The definition of “high quality or exceptional value waters” can be found in 25 Pennsylvania Code, Section 94.4b [].
Wildland trout streams are based on two datasets developed in 2014 by the Pennsylvania Fish and Boat Commission (Supplemental Information, Sections 4.1 and 4.2). The first dataset, “Wilderness Trout Streams”, identifies streams that provide a “wild trout fishing experience,” and the second, “Class A Wild Trout Stream”, are defined as those streams that support populations maintained by natural reproduction only (i.e., non-stocked). We combined the two datasets, removed duplicates for the analyses and hereafter refer to the dataset as “wildland trout streams”.
Environmental justice encompasses the concept that fair and equitable treatment of all people extends to the environment in which they live, but the reality is that socio-economically disadvantaged groups tend to be exposed to higher rates of environmental pollution than the population as a whole []. Pennsylvania environmental justice areas are defined based on poverty rates of at least 20% and non-white populations of at least 30% (Supplemental Information, Section 4.3).
The National Land Cover Database (NLCD) land cover data [] were used to quantify forest fragmentation attributable to unconventional and conventional oil and gas development. We used the 2001 NLCD data because they predated most of the unconventional gas exploration features. Furthermore, because the features in the gas exploration map are relatively small, the landscape analyses could not be supported at the native 30 m × 30 m pixel size of the NLCD. Therefore, we re-sampled the 2001 NLCD land cover to a 10 m × 10 m pixel size, converted the disturbance data from vector to raster format using the same pixel size and embedded the disturbance data into the 2001 NLCD, resulting in a dataset that showed the change in landscape characteristics that resulted from oil and gas development. All of the original landscape disturbance data that were compiled for this paper, along with the 11 USGS reports, are available for download at the USGS Sciencebase site [].
2.2. Landscape Analyses
The spatial data were used to ask a series of questions that, as a set, represent an assessment of potential impacts arising from unconventional and conventional oil and gas development on the landscape (Table 1). GIS routines were used to conduct the analyses. All analyses were summarized and reported by 12-digit hydrologic units (HUC-12), except for the forest fragmentation and population analyses. The study area served as the reporting unit for the forest fragmentation analyses, and 3-km buffers (radius) around unconventional gas exploration sites served as the reporting units for the population analysis.

Table 1.
Assessment questions.
| 1) How many watersheds have oil and gas (O/G) development? |
| 2) How many watersheds have streams within 30 m or 60 m of O/G development? |
| 3) How many watersheds have impaired streams within 30 m or 60 m of O/G development? |
| 4) How many watersheds contain wildland trout streams within 30 m or 60 m of O/G? |
| 5) How many watersheds contain environmental justice areas and O/G development? |
| 6) How many watersheds contain both drinking water intakes (DWI) and O/G? |
| 7) How many watersheds have DWI within 1, 5 and 10 km downstream of O/G |
| 8) What are the population densities within 3 km of unconventional O/G sites? |
| 9) What is the amount (area) of forest interior loss due to O/G development? |
| 10) How has O/G development changed forest structure? |
Note: “Impaired” indicates streams that do not meet the criteria of Sections 305(b) of the Clean Water Act. See the metadata description at [].
- Questions (Table 1) related to occurrence and proximity were addressed using GIS intersection and buffering routines. Streams located within 30 m or 60 m of a gas exploration site (e.g., Table 1, Question 2) were estimated by expanding (buffering) the sites by those distances and then intersecting the expanded sites with the streams. The outcome (result) of these operations was used to estimate the number of watersheds with gas exploration sites within 30 m or 60 m of a stream, a wildland trout stream and an impaired stream. The 30-m threshold distance was based on the Governor’s Marcellus Shale Advisory Commission report recommendation that sites should not be within 30 m of a stream [], and we added 60 m to evaluate the effect of including a more conservative threshold. Simple GIS intersections (without buffering) were used to estimate the number of watersheds with gas exploration sites, the number of watersheds with environmental justice areas and gas exploration sites, the number of watersheds with surface drinking water intakes and gas exploration sites and the number of exceptional value watersheds with gas exploration sites. We downloaded both impaired streams and impaired water bodies, but only used impaired streams in the analysis, because there were no impaired water bodies within 60 m of unconventional or conventional gas exploration.

Table 2.
Total drilling sites by type. Permit types are fracking only (MS), conventional only (conv), fracking and oil (MS-oil), conventional and oil (conv-oil), fracking and conventional (MS-conv) and fracking, conventional and oil (MS-conv-oil). Note: average area does not equal exactly the total area because of rounding.
| Unconventional Oil and Gas | |||
| Near-by permits | Number of sites | Average area (km2) | Total area (km2) |
| MS | 1136 | 0.025 | 27.831 |
| MS-conv-oil | 3 | 0.003 | 0.008 |
| MS-conv | 479 | 0.019 | 9.059 |
| MS-oil | 14 | 0.006 | 0.089 |
| Total | 1632 | 36.987 | |
| Conventional Oil and Gas | |||
| conv | 10,297 | 0.005 | 47.217 |
| conv-oil | 425 | 0.002 | 0.783 |
| MS-conv-oil | 3 | 0.003 | 0.008 |
| MS-conv | 479 | 0.019 | 9.059 |
| Total | 11,204 | 57.067 |
- GIS network functions were used to estimate the number of watersheds with gas exploration sites upstream of a surface drinking water intake. Streams were used as the network; surface drinking water intakes defined the starting points; and the gas exploration sites defined the stopping points. The stopping points were defined by computing the Euclidean distance between all gas exploration sites within a 350-m buffer of a stream. The results from this analysis depend on the values assigned to the model parameters. We used stream distances of 1 km, 5 km and 10 km between drinking water intakes and gas exploration sites. These distances represent the length over which biotic and abiotic in-stream processes can remove or dilute pollutants [,]. For nitrogen, a possible component of unconventional oil and gas development wastewater [], it is well established that in-stream dilution or removal is inversely related to stream size, such that it tends to persist in very large streams []. The Monongahela and Allegheny Rivers are within the study region and are important sources of drinking water. We chose the 10-km distance based on the presence of large rivers in the study region. Further, many of the numerous possible constituents in fracking wastewater [,] may be novel [] and, therefore, may persist downstream regardless of stream size. Our selection of a 350-m distance between gas exploration sites and streams is a conservative interpretation of the results reported by Boyer et al. [], who compared pre- and post-fracking groundwater well samples and found elevated concentrations of bromide, an indicator of the presence of fracking fluids, after initiation of fracking. Boyer et al. [] suggested a minimum distance of 915 m (3000 ft) between fracking sites and groundwater wells based on their results. Bromide, can react with the disinfection products used in drinking water treatment plants to create byproducts (i.e., disinfection byproducts) that can present health risks []. The GIS network functions were applied also to the conventional gas exploration sites using the same distance parameters. Our rationale was that wastewater from conventional oil and gas development, including coal-bed methane, presents many of the same water quality issues as unconventional gas development [,,]. For example, benzene, a carcinogenic compound [], is a constituent of wastewater from conventional oil and gas development [,]. In addition to the drinking water intakes, there are also centralized drinking water (CWT) facilities in Pennsylvania that are potentially a major source of bromide and other contaminants [,,].
- Population estimates within 3 km of a gas exploration site were determined using dasymetric analyses and GIS buffering. Dasymetric methods distribute population estimates to individual pixels based on land cover []. We downloaded dasymetric maps based on NLCD 2006 census data from the U.S. Environmental Protection Agency’s (EPA’s) EnviroAtlas website []. Dasymetric population estimation within a specified distance of conventional oil and gas development was not undertaken, because it does not include horizontal drilling.
- The forest fragmentation effects of conventional and unconventional gas extraction were not based on patch and edge measurement, because such measurements are poorly suited for the detection of forest fragmentation change. We used change in forest interior as our indicator of forest fragmentation. The four forest NLCD classes (deciduous forest, evergreen forest, mixed forest and woody wetlands) were used to define the forest class for the analyses []. Forest interior was estimated using moving windows [,,]. Moving windows is a well-established image processing technique where a geometric shape (typically a square) is passed over a raster map one pixel at a time; a mathematical operation is performed using the pixels within the geometric shape, and the result of the mathematical operation is assigned to the center pixel in the geometric shape. We measured forest interior by counting the number of forest pixels inside moving windows that had side lengths of 50 m (5 pixels), 110 m (11 pixels) and 150 m (150 pixels) and assigning the result to the center pixel of the window. We also used a less conservative threshold of 90% to define interior. The 110-m side length scale was chosen for consistency with the study by Harper [], and the 50-m and 150-m side length scales were included because forest interior is a scale-dependent characteristic. Forest interior change was based on a comparison of the 10 m × 10 m NLCD with and without the embedded gas exploration maps.
- The change in the amount of forest interior was supported by a structural analysis of forests based on mathematical morphology [,]. Mathematical morphology (Section 6 in the Supplemental Information) classifies a feature (e.g., forest) into structural classes, such as core (interior), edge, bridge (corridor), perforated (non-forest “hole” in interior forest) and patch (isolated). The main input parameters for mathematical morphology are connectivity and edge width. We used eight neighbor connectivity and a 100-m (10 pixel) edge width []. Interior was defined as 100% forest within the moving window.
3. Results
Unconventional and conventional oil and gas development exists across the study area, occurring in ~50% of the watersheds (Figure 3). The sites are in some places close to streams, impaired streams, wildland trout streams and surface drinking water intakes, and sites are present in locations designated as environmental justice areas (Table 3). Approximately 50% of the watersheds with conventional oil and gas development were within 30 m of a stream, and ~30% of the watersheds with unconventional oil and gas development were within 30 m of a stream (Table 3; Figure 4). Those percentages, increased to nearly 65% (conventional) and 40% (unconventional) when the threshold distance was increased to within 60 m of a stream. The possibility of unconventional or conventional gas development being sited within 30 m or 60 m of an impaired stream was low, with the proximal co-occurrence concentrated mostly in the western portion of the study area and associated mostly with conventional development (Figure S3).
Unconventional and conventional oil and gas development has occurred in some of Pennsylvania’s exceptional value watersheds (Figure 5), and the possibility of either type of oil and gas development occurring in these watersheds was about equal (Table 3). Oil and gas development in close proximity (30 m, 60 m) to wildland trout streams in these exceptional value watersheds has occurred only minimally (Table 3).
Unconventional and conventional oil and gas development has occurred in approximately one-third to one-half of the watersheds that have drinking water intakes, and it is sited directly upstream of the intakes in approximately 5% to 20% of these watersheds, depending on the upstream distance used (Table 3). Both types of development occur upstream of drinking water intakes with development concentrated in the southwestern portion of the study area along the Allegheny and Monongahela Rivers (Figure 6).
Unconventional and conventional oil and gas development occurred in ~10% and ~29%, respectively, of the watersheds that have defined environmental justice areas (Table 3), and their co-occurrence was concentrated in the western portion of the study area (Figure 7). Relatedly, estimated dasymetric populations within 3 km of unconventional sites ranged from zero to greater than 10,000 people, with ~30% of the 1632 unconventional oil and gas development sites having at least 100 people within the 3-km radius (Table 4).
Interior forest loss was quantifiable despite the small-sized individual sites and the small areal extent of unconventional and conventional oil and gas development relative to the study area (see Methods). Interior forest loss ranged from ~20 km2 to ~185 km2 depending on the type of oil and gas development and the spatial scale at which interior forest was measured, which is ~1.5× to ~5× greater than the loss of forest attributable to the overall disturbance activities (Table 5). The interior forest loss results are supported by the relatively high percentage increase in the perforated forest structure class, which identifies “holes” of non-forest in interior forest locations (Supplemental Material, Section 6).
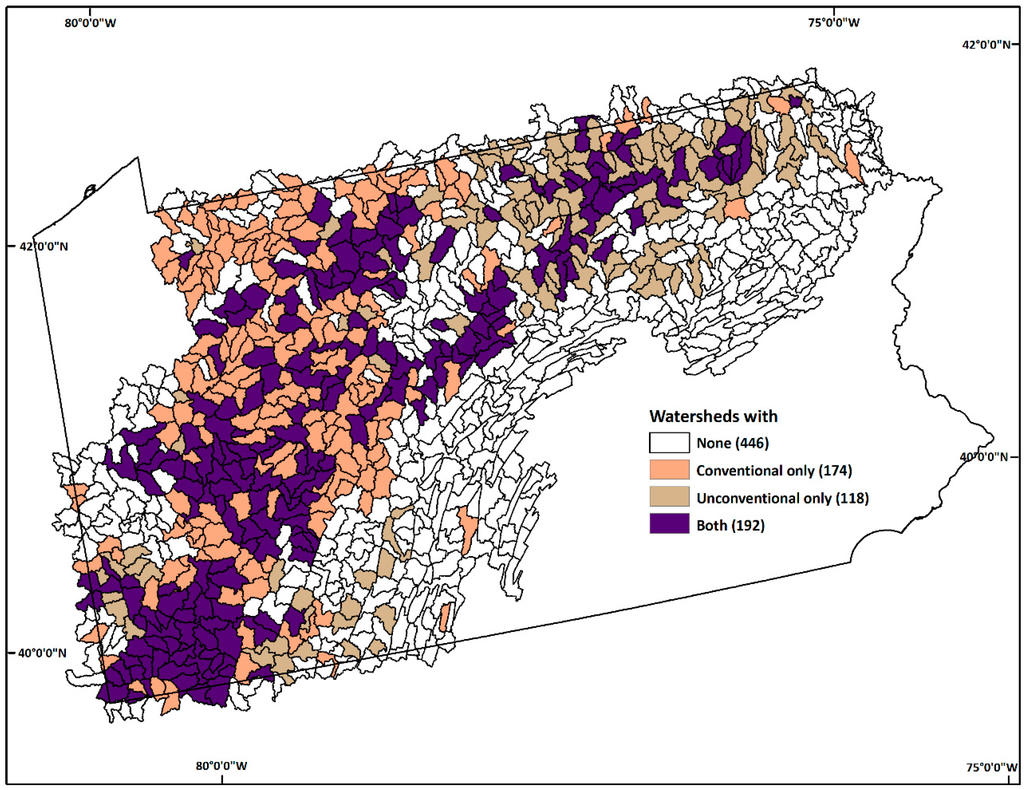
Figure 3.
Study area 12-digit hydrologic units (HUC-12) watersheds and the pattern of oil and gas development. Values in parentheses are the number of watersheds.
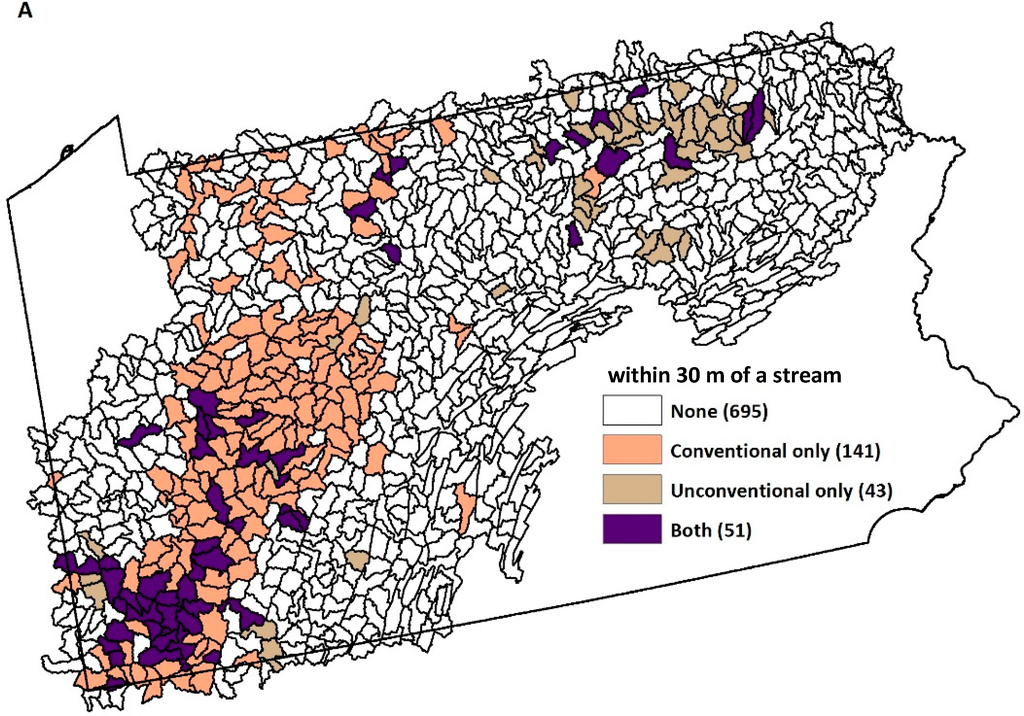
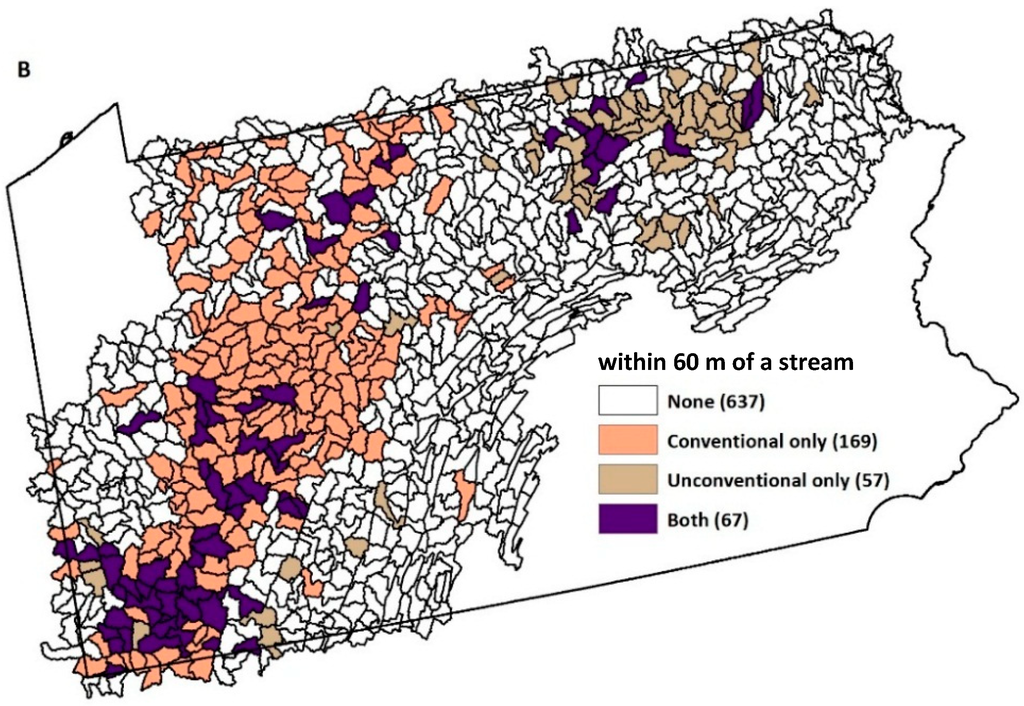
Figure 4.
Oil and gas development in close proximity to streams. Values in parentheses are the number of watersheds. (A) Conventional and unconventional development within 30 m of a stream; and (B) conventional and unconventional development within 60 m of a stream.
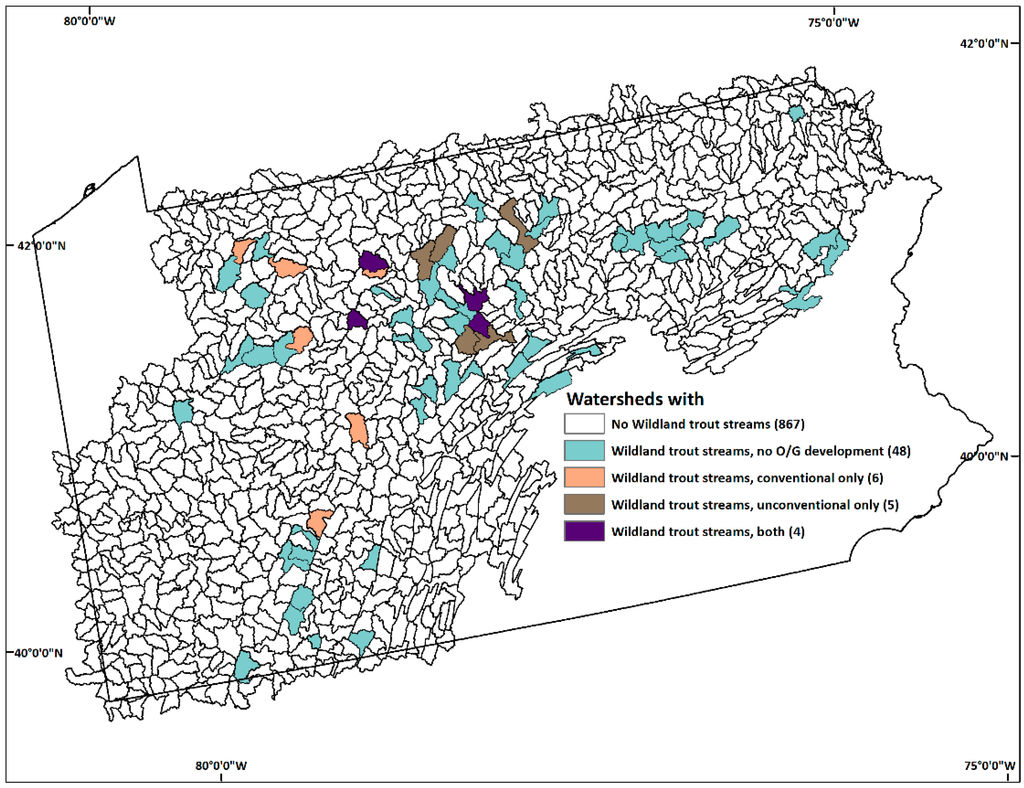
Figure 5.
Oil and gas development in the study area in relation to Pennsylvania’s wildland trout streams in the study area. Values in parentheses are the number of watersheds. Some of the watersheds labeled as “No O/G development” in this figure are labeled as having oil and gas development in Figure 3. In these watersheds, the oil and gas development did not occur in the portion of the watershed identified as “of exceptional value” by the State (see Methods).

Table 3.
Oil and gas development in relation to watershed resources. There are 930 12-digit watersheds in the study area and 484 with oil and gas development. Values in the column labeled “both” identifies where unconventional and conventional co-occur in the same watershed, and the column labeled “total” identifies where either or both activities co-occur.
| Indicator: Watersheds with… | Conventional Oil and Gas | Unconventional Oil and Gas | Both | Total |
|---|---|---|---|---|
| Oil and Gas (O/G) development | 366 | 310 | 192 | 484 |
| Streams within 30 m of O/G development | 192 | 94 | 51 | 235 |
| Streams within 60 m of O/G development | 236 | 124 | 67 | 293 |
| Impaired streams | 151 | 118 | 76 | 193 |
| Impaired streams within 30 m of O/G development | 16 | 2 | 0 | 18 |
| Impaired streams within 60 m of O/G development | 32 | 4 | 2 | 34 |
| Wildland trout streams (= 240) | ||||
| Wildland trout streams within 30 m of O/G development | 1 | 0 | 0 | 1 |
| Wildland trout streams within 60 m of O/G development | 3 | 1 | 1 | 3 |
| Study area exceptional value watersheds (EVAL) (= 63) | ||||
| EVAL and O/G Development | 10 | 9 | 4 | 15 |
| Environmental justice (EJ) areas (= 125) | ||||
| Environmental justice (EJ) areas and O/G development | 38 | 14 | 14 | 38 |
| Drinking water intakes (DWI) (= 187) | ||||
| DWI and O/G development | 73 | 64 | 46 | 91 |
| DWI within 1 km downstream of O/G development | 9 | 0 | 0 | 9 |
| DWI within 5 km downstream of O/G development | 28 | 8 | 6 | 30 |
| DWI within 10 km downstream of O/G development | 36 | 18 | 14 | 40 |

Table 4.
Dasymetric population estimates within 3 km of unconventional gas extraction sites.
| Population Range | No. of Sites |
|---|---|
| 0 | 417 |
| 1 to 99 | 711 |
| 100 to 499 | 365 |
| 500 to 999 | 69 |
| 1000 to 9999 | 69 |
| >10,000 | 1 |
| Total 1632 |
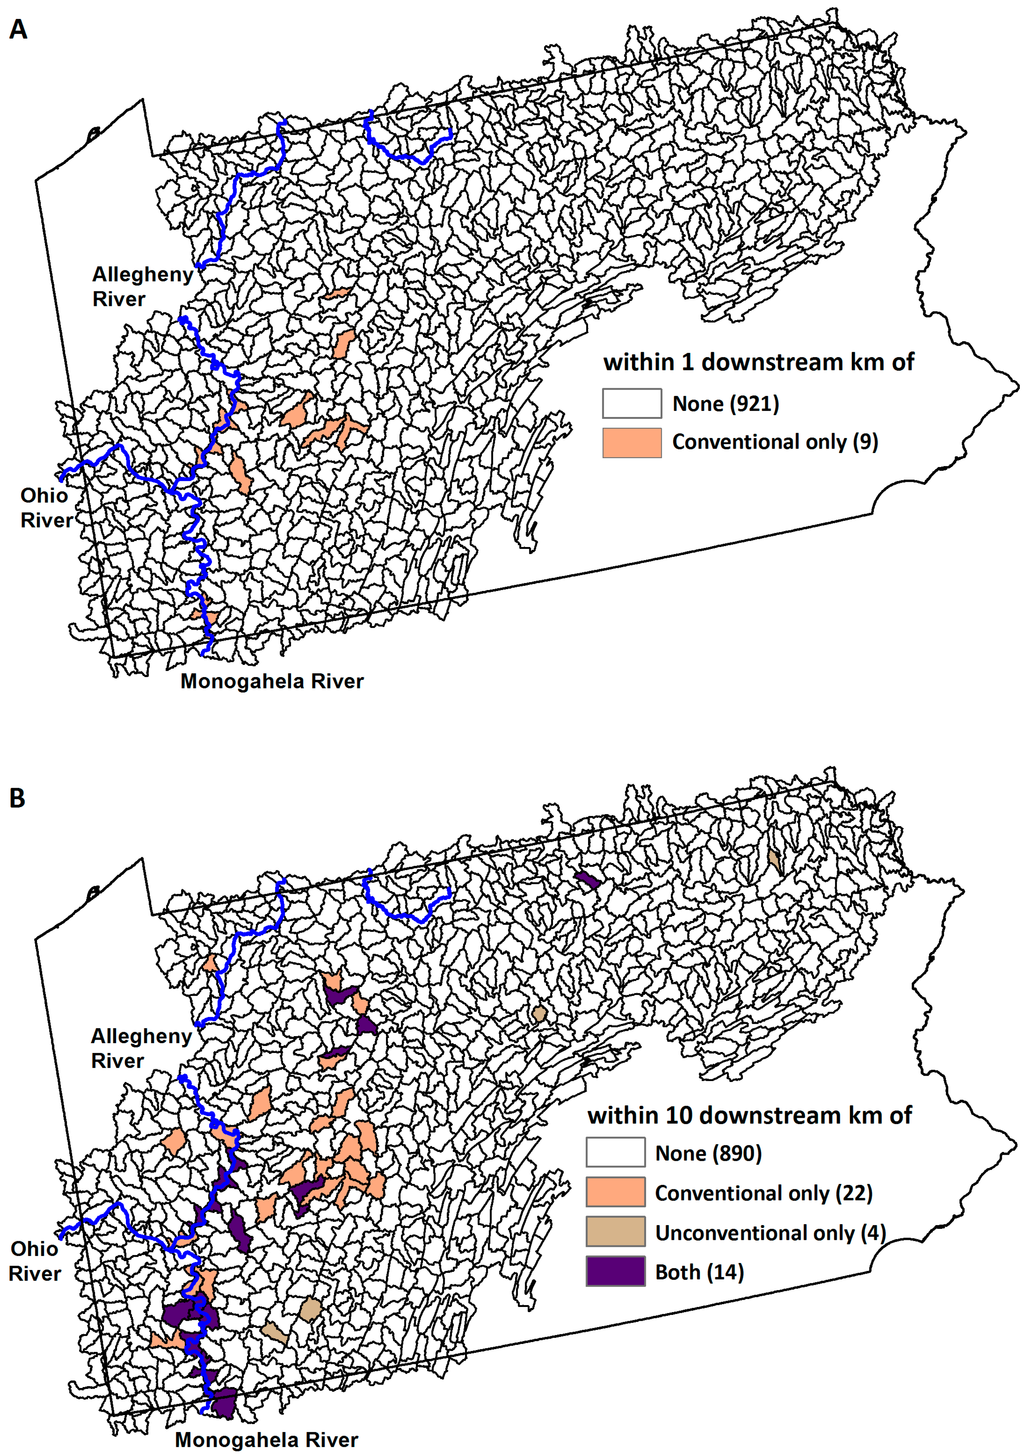
Figure 6.
Surface drinking water intakes (DWI) within 1 km downstream (A) and 10 km downstream (B) of oil and gas development. Values in parentheses are the number of watersheds.
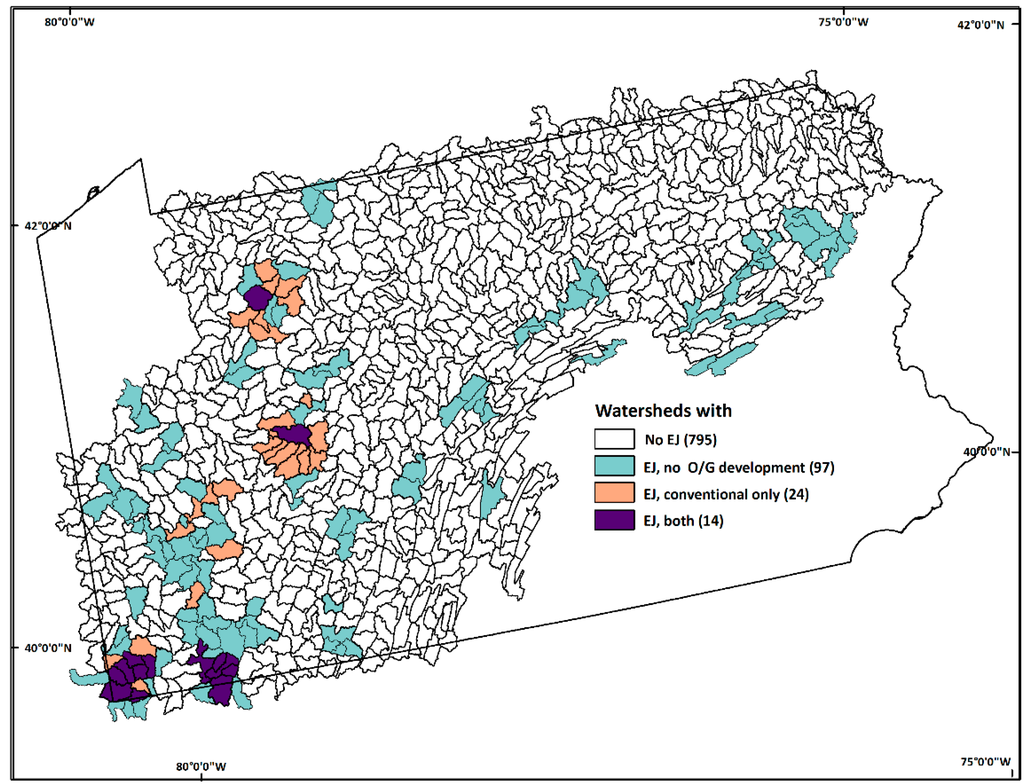
Figure 7.
Oil and gas development in relation to environmental justice (EJ) areas as defined by the State of Pennsylvania. Values in parentheses are the number of watersheds. Some of the watersheds labeled as “EJ, none” in this figure are labeled as having oil and gas development in Figure 3. In these watersheds, the oil and gas development did not occur in the portion of the watershed identified as an environmental justice area by the State.

Table 5.
Interior forest loss attributable to unconventional and conventional oil and gas exploration. The area in km2 of interior forest is reported in the National Land Cover Database (NLCD) row, and loss attributable to conventional, unconventional or both extraction activities is reported in the rows for conventional oil and gas, unconventional oil and gas and both, respectively. Pf = 100 denotes interior expressed as 100% forest in the window, and Pf = 90 denotes interior expressed as ≥90% forest in the window. Total forest area in the study area was 5,700,994 km2, and forest loss attributable to conventional, unconventional and both was 33.33 km2, 14.81 km2 and 43.93 km2, respectively.
| Pf = 100 | Window | Size | |
|---|---|---|---|
| 5 × 5 | 11 × 11 | 15 × 15 | |
| NLCD | 49,152.81 | 40,705.32 | 36,253.42 |
| conventional | −74.52 | −134.31 | −166.32 |
| unconventional | −20.81 | −27.72 | −30.79 |
| both | −89.31 | −154.08 | −188.58 |
| Pf = 90 | |||
| NLCD | 50,167.38 | 45,520.28 | 42,474.17 |
| conventional | −66.60 | −86.84 | −91.02 |
| unconventional | −24.80 | −23.50 | −25.84 |
| both | −79.98 | −102.58 | −109.49 |
4. Discussion
The ecological landscape has been described as “the stage that the plot is played out on” [,]. Unconventional and conventional oil and gas development have become a widespread and indelible aspect of the Pennsylvania landscape that exposes many of its resources to environmental degradation. Natural gas wells are closely tied to landscape variables []. Unconventional and conventional oil and gas development occurs in over half of the watersheds in the study area, occurs in close proximity to streams, is upstream of surface drinking water intakes, occurs where people reside and in the vicinity of populations that may have disproportionate exposures to pollutants, has occurred in a few state-identified exceptional value watersheds and is commonly located at interior forest environments.
Unconventional and conventional oil and gas development was often closer to streams than the recommended separation distance of 30 m [], including 18 streams identified as impaired and four wildland trout streams. Because of the chemical composition of wastewater from all types of oil and gas development [,,,,], even the rare or accidental release of the wastewater into the environment threatens aquatic ecosystems [,,,,], threatens actively-managed Pennsylvania trout populations [,] and potentially complicates restoration and recovery of impaired streams []. Our proximity results for unconventional oil and gas development were not consistent with those of Entrenkin [], who found that ~4% of Pennsylvania unconventional oil and gas sites were within 100 m of a 1:24,000-scale NHD stream, whereas we found that ~35% and ~45% of these sites were within 30 m and 60 m (respectively) of a 1:24,000-scale NHD stream.
Much of the interest in the relationship between drinking water and unconventional oil and gas development in Pennsylvania has focused on ground water sources of drinking water, rather than surface water sources of drinking water [,,,,]. Our focus was the potential exposure of surface drinking water intakes to contamination from conventional, as well as unconventional oil and gas development. Our results suggest that surface drinking water intakes for several communities along the Allegheny and Monongahela Rivers are potentially exposed to contamination from unconventional and conventional oil and gas development. In 2008, a portion of the Monongahela River was reported to have high total dissolved solids (TDS) concentrations, and discharge of wastewater from unconventional and coal-bed methane oil and gas development was cited as one of four possible sources []. Although the source (or sources) of the high TDS concentrations in the Monongahela will probably never be known with certainty, the event prompted new wastewater treatment standards for facilities that accept wastewater from oil and gas development []. High TDS is considered a secondary (not health threatening) drinking water contaminant that influences the hardness, color and taste of water [].
Forests are an important feature of the Pennsylvania landscape [,]. Although the amount of forest loss across the entire study region was small, there was a tendency for oil and gas development to occur at interior forest locations (Table 4, Table S1). Interior forest is an expression of forest condition [], because of the impact of edge effects on forests [,,,] and the biota that are forest dependent []. The apparent tendency of oil and gas development to be located at interior forest locations raises two interesting areas of research. Hypothetically, there is some potential to manage for the effects of unconventional oil and gas development on forest spatial pattern [], because the drilling technology can reach up to 3 km horizontally []. The “horizontal” feature of unconventional oil and gas exploration could be used to locate sites away from interior forest locations. Such management would be complicated by the number of wells per well pad and the prescribed direction of the individual wells, as well as other local land use issues, but despite these constraints, preservation of interior forest may be possible at some locations. Secondly, perforations, small clearings in the interior of forested landscapes, may be unique in relation to the types of edge effects they create, since the source of the edge effect is isolated (surrounded by forest). Most edge effect studies have not distinguished between interior and exterior edge effects [,]. Our results on forest interior loss are consistent with those of Drohan et al. [] who also reported that a substantial fraction of unconventional oil and gas well pads in Pennsylvania were located in interior forest environments. Likewise, Meng [] showed that fracking locations correlated with the elevation and the amount of forest tend to increase as elevation increases in Pennsylvania.
Unconventional oil and gas development in Pennsylvania appears to have received considerably more attention in the literature [,,,,,] than conventional oil and gas development. Overall, we have found that conventional oil and gas development, rather than its unconventional counterpart, exposes a greater portion of Pennsylvania aquatic resources to pollutants. This outcome was expected because there were ~10-times more conventional sites than unconventional sites, and the conventional sites encompassed ~50% more area (see Methods). Several exposure pathways of wastewater contamination have been documented from unconventional oil and gas development [,], and most (e.g., transportation spills, drilling site discharge, wastewater disposal) appear to apply also to conventional oil and gas development []. Incorporating conventional oil and gas development into similar analyses would provide a more integrated assessment of combined risk for both types of development.
Acknowledgments
We are grateful to Robert Milici (Emeritus Geologist, USGS) for his guidance on describing oil and gas development and his review of the paper. We are especially grateful to Jim Wickham of EPA for his technical assistance and suggestions.
Author Contributions
E. Terrence Slonecker led the research project and collaborated with the other author on the manuscript, which was revised by all authors. Lesley E. Milheim was responsible for data preparation and GIS analyses. All authors read and approved the final manuscript.
Conflicts of Interest
The authors declare no conflict of interest.
References
- Slonecker, E.; Milheim, L.; Roig-Silva, C.; Malizia, A.; Marr, D.; Fisher, G. Landscape Consequences of Natural Gas Extraction in Bradford and Washington Counties, Pennsylvania, 2004–2010; US Geological Survey, Open-File Report; U.S. Geological Survey: Reston, VA, USA, 2012.
- Montz, B.; Wilmer, K.; Walsh-Haehle, S.; Lazarus, N.; Kucuker, Y.; Herr, M. Interconnections in resource development: Controversies surrounding the Marcellus Shale in New York. Northeast. Geogr. 2010, 2, 1–16. [Google Scholar]
- Myers, K.R.; Flenner, A.W. Landowner protection from Marcellus Shale development. Westlaw J. Environ. 2011, 31. Available online: http://1ssikh2qbm1bew1ow26ufyx1.wpengine.netdna-cdn.com/wp-content/uploads/2011/04/wlj_haz3120_commentary_myers-flenner_pdf (accessed on 27 April 2011). [Google Scholar]
- Meng, Q.; Ashby, S. Distance: A critical aspect for environmental impact assessment of hydraulic fracking. Extr. Ind. Soc. 2014, 1, 124–126. [Google Scholar] [CrossRef]
- Nicot, J.-P.; Scanlon, B.R. Water use for shale-gas production in Texas, US. Environ. Sci. Technol. 2012, 46, 3580–3586. [Google Scholar] [CrossRef] [PubMed]
- GMSAC. Governor’s Marcellus Shale Advisory Commission Report. Pennsylvania Department of Environmental Protection: Harrisburg, PA, USA, 2011. Available online: http://www.portal.state.pa.us/portal/server.pt/community/marcellus_shale_advisory_commission/20074 (accessed on 19 February 2015).
- Barbot, E.; Vidic, N.; Gregory, K.; Vidic, R. Spatial and temporal correlation of water quality parameters of produced waters from Devonian-age shale following hydraulic fracturing. Environ. Sci. Technol. 2013, 47, 2562–2569. [Google Scholar] [CrossRef] [PubMed]
- Entrekin, S.; Evans-White, M.; Johnson, B.; Hagenbuch, E. Rapid expansion of natural gas development poses a threat to surface waters. Front. Ecol. Environ. 2011, 9, 503–511. [Google Scholar] [CrossRef]
- Gregory, K.B.; Vidic, R.D.; Dzombak, D.A. Water management challenges associated with the production of shale gas by hydraulic fracturing. Elements 2011, 7, 181–186. [Google Scholar] [CrossRef]
- Kargbo, D.M.; Wilhelm, R.G.; Campbell, D.J. Natural gas plays in the Marcellus Shale: Challenges and potential opportunities. Environ. Sci. Technol. 2010, 44, 5679–5684. [Google Scholar] [CrossRef] [PubMed]
- Vidic, R.; Brantley, S.; Vandenbossche, J.; Yoxtheimer, D.; Abad, J. Impact of shale gas development on regional water quality. Science 2013, 340. [Google Scholar] [CrossRef] [PubMed]
- Warner, N.R.; Christie, C.A.; Jackson, R.B.; Vengosh, A. Impacts of shale gas wastewater disposal on water quality in Western Pennsylvania. Environ. Sci. Technol. 2013, 47, 11849–11857. [Google Scholar] [CrossRef] [PubMed]
- Maloney, K.O.; Yoxtheimer, D.A. Production and disposal of waste materials from gas and oil extraction from the Marcellus Shale play in Pennsylvania. Environ. Pract. 2012, 14, 278–287. [Google Scholar] [CrossRef]
- Drohan, P.; Brittingham, M. Topographic and soil constraints to shale-gas development in the northcentral appalachians. Soil Sci. Soc. Am. J. 2012, 76, 1696–1706. [Google Scholar] [CrossRef]
- Johnson, N.; Gagnolet, T.; Ralls, R.; Zimmerman, E.; Eichelberger, B.; Tracey, C.; Kreitler, G.; Orndorff, S.; Tomlinson, J.; Bearer, S. Pennsylvania Energy Impacts Assessment Report 1: Marcellus Shale Natural Gas and Wind; The Nature Conservancy-Pennsylvania Chapter: Harrisburg, PA, USA, 2010. [Google Scholar]
- Drohan, P.; Brittingham, M.; Bishop, J.; Yoder, K. Early trends in landcover change and forest fragmentation due to shale-gas development in Pennsylvania: A potential outcome for the northcentral Appalachians. Environ. Manag. 2012, 49, 1061–1075. [Google Scholar] [CrossRef] [PubMed]
- Milici, R.C.; Swezey, C. Assessment of Appalachian Basin Oil and Gas Resources: Devonian Shale-Middle and Upper Paleozoic Total Petroleum System; US Department of the Interior, US Geological Survey: Reston, VA, USA, 2006.
- Pennsylvania Department of Environmental Protection (PADEP). Abandoned and Orphan Oil and Gas Wells and the Well Plugging Program; Fact Sheet 8000-FS-1670; PADEP: Harrisburg, PA, USA, 2012. [Google Scholar]
- USGS. Natural Gas Production in the United States; Fact. Sheet FS-113–01; U.S. Geoloigcal Survey: Reston, VA, USA, 2002.
- Pennsylvania Department of Environmental Protection (PADEP). Act 13 Frequently Asked Questions. 2012. Available online: http://files.dep.state.pa.us/OilGas/OilGasLandingPageFiles/Act13/ (accessed on 19 February 2015).
- Markowski, A.K. Coalbed methane resource potential and current prospects in Pennsylvania. Int. J. Coal Geol. 1998, 38, 137–159. [Google Scholar] [CrossRef]
- USEPA. Coalbed Methane Extraction: Detailed Study Report; Report EPA-820-R-10-22; U.S. Environmental Protection Agency: Washington, DC, USA, 2010.
- Wilson, J.M.; VanBriesen, J.M. Oil and gas produced water management and surface drinking water sources in Pennsylvania. Environ. Pract. 2012, 14, 288–300. [Google Scholar] [CrossRef]
- Benko, K.L.; Drewes, J.E. Produced water in the western united states: Geographical distribution, occurrence, and composition. Environ. Eng. Sci. 2008, 25, 239–246. [Google Scholar] [CrossRef]
- Boyer, E.W.; Swistock, B.R.; Clark, J.; Madden, M.; Rizzo, D.E. The Impact of Marcellus Gas Drilling on Rural Drinking Water Supplies. The Center for Rural Pennsylvania, Pennsylvania General Assembly. Available online: www.rural.palegislature.us/documents/reports/Marcellus_and_drinking_water_2011_rev.pdf (accessed on 15 December 2014).
- Stearns, M.; Tindall, J.; Cronin, G.; Friedel, M.; Bergquist, E. Effects of coal-bed methane discharge waters on the vegetation and soil ecosystem in Powder River Basin, Wyoming. Water Air Soil Pollut. 2005, 168, 33–57. [Google Scholar] [CrossRef]
- Wang, X.; Melesse, A.M.; McClain, M.E.; Yang, W. Water quality changes as a result of coalbed methane development in a rocky mountain watershed. J. Am. Water Resour. Assoc. 2007, 43, 1383–1399. [Google Scholar] [CrossRef]
- USGS. Nationalatlas. Gov—National Atlas of the United States. United States Geological Survey. The National Map Small-Scale Collection. 2012. Available online: http://nationalatlas.gov/ (accessed on 19 February 2015). [Google Scholar]
- Dewald, T.; Roth, K. The national hydrography dataset-integrating the USEPA reach file and USGS DLG. In Proceedings of 1998 International ESRI User Conference, San Diego, CA, USA, 28 July 1998.
- Coleman, J.L.; Team, M.S.A. Assessment of Undiscovered Oil and Gas Resources of the Devonian Marcellus Shale of the Appalachian Basin Province, 2011. US Geological Survey. Available online: http://pubs.usgs.gov/fs/2011/3092/ (accessed on 15 December 2014).
- USDA. National Agricultural Imagery Program (NAIP). 2004. Available online: http://www.fsa.usda.gov/FSA/apfoapp?area=home&subject=prog&topic=nai (accessed on 15 December 2014). [Google Scholar]
- USGS. National Hydrography Dataset. 2014. Available online: http://nhd.usgs.gov/ (accessed on 25 May 2015). [Google Scholar]
- Wickham, J.D.; Wade, T.G.; Riitters, K.H. An environmental assessment of United States drinking water watersheds. Landsc. Ecol. 2011, 26, 605–616. [Google Scholar] [CrossRef]
- USEPA. EPA EDG Dataviewer. 2014. Available online: https://edg.epa.gov/clipship/ (accessed on 13 December 2014). [Google Scholar]
- USEPA. Watershed Assessment, Tracking & Environmental Results. 2015. Available online: http://iaspub.epa.gov/tmdl/attains_state.control?p_state=PA&p_cycle=&p_report_type=T (accessed on 13 March 2015). [Google Scholar]
- US Census Bureau, Measuring America—People, Places, and Our Economy. 2014. Available online: http://www2.census.gov/census_2010/04-Summary_File_1/Pennsylvania/ (accessed on 5 May 2015).
- Multi-Resolution Land Cover Consortium (MRLC). National Land Cover Database (NLCD). 2015. Available online: www.mrlc.gov (accessed on 10 December 2014). [Google Scholar]
- Pennsylvania Code. Section 93.4b. Qualifying as High Quality or Exceptional Value Waters. 2015. Available online: http://www.pacode.com/secure/data/025/chapter93/s93.4b.html (accessed on 25 May 2015).
- Brulle, R.J.; Pellow, D.N. Environmental justice: Human health and environmental inequalities. Annu. Rev. Public Health 2006, 27, 103–124. [Google Scholar] [CrossRef] [PubMed]
- Homer, C.; Dewitz, J.; Yang, L.; Jin, S.; Danielson, P.; Xian, G.; Coulston, J.; Herold, N.; Wickham, J.; Megoun, K. Completion of the 2011 National Land Cover Database for the conterminous United States—Representing a decade of land cover change information. Photogramm. Eng. Remote Sens. 2015, (in press). [Google Scholar]
- USGS. Sciencebase Catalog: Slonecker. 2015. Available online: https://www.sciencebase.gov/catalog/folder/551333cee4b02e76d75c0982 (accessed on 25 May 2015). [Google Scholar]
- PASDA. Pennsylvania Spatial Data Access. 2015. Available online: http://www.pasda.psu.edu/uci/MetadataDisplay.aspx?entry=PASDA&file=IntegratedListNonAttaining2015_01.xml&dataset=888 (accessed on 5 December 2014).
- Alexander, R.B.; Smith, R.A.; Schwarz, G.E. Effect of stream channel size on the delivery of nitrogen to the Gulf of Mexico. Nature 2000, 403, 758–761. [Google Scholar] [CrossRef] [PubMed]
- USEPA. Draft Plan to Study the Potential Impacts of Hydraulic Fracturing on Drinking Water Resources; Report EPA 440, 5-80-018; U.S. Environmental Protection Agency: Washington, DC, USA, 2011.
- States, S.; Cyprych, G.; Stoner, M.; Wydra, F.; Kuchta, J.; Monnell, J.; Casson, L. Marcellus shale drilling and brominated THMs in Pittsburgh, PA., drinking water. J. Am. Water Works Assoc. 2013, 105, E432–E448. [Google Scholar] [CrossRef]
- Mondal, S.; Wickramasinghe, S.R. Produced water treatment by nanofiltration and reverse osmosis membranes. J. Membr. Sci. 2008, 322, 162–170. [Google Scholar] [CrossRef]
- USEPA. Ambient Water Quality Criteria for Benzene; Report EPA 440, 5–80–018; EPA: Washington, DC, USA, 1980.
- Hladik, M.L.; Focazio, M.J.; Engle, M. Discharges of produced waters from oil and gas extraction via wastewater treatment plants are sources of disinfection by-products to receiving streams. Sci. Tot. Environ. 2014, 466, 1085–1093. [Google Scholar] [CrossRef] [PubMed]
- Mennis, J.; Hultgren, T. Intelligent dasymetric mapping and its application to areal interpolation. Cartogr. Geograph. Inf. Sci. 2006, 33, 179–194. [Google Scholar] [CrossRef]
- USEPA. Enviroatlas. 2015. Available online: http://enviroatlas.epa.gov/enviroatlas/ (accessed on 19 March 2015). [Google Scholar]
- Wickham, J.; Riitters, K.; Wade, T.; Coulston, J. Temporal change in forest fragmentation at multiple scales. Landsc. Ecol. 2007, 22, 481–489. [Google Scholar] [CrossRef]
- Riitters, K.; Wickham, J.; O’Neill, R.; Jones, B.; Smith, E. Global-scale patterns of forest fragmentation. Conserv. Ecol. 2000, 4, 3. Available online: http://www.consecol.org/vol4/iss2/art3 (accessed on 19 March 2015). [Google Scholar]
- Riitters, K.H.; Wickham, J.D. Decline of forest interior conditions in the conterminous United States. Sci. Rep. 2012, 2. [Google Scholar] [CrossRef] [PubMed]
- Harper, K.A.; Macdonald, S.E.; Burton, P.J.; Chen, J.; Brosofske, K.D.; Saunders, S.C.; Euskirchen, E.S.; Roberts, D.; Jaiteh, M.S.; ESSEEN, P.A. Edge influence on forest structure and composition in fragmented landscapes. Conserv. Biol. 2005, 19, 768–782. [Google Scholar] [CrossRef]
- Vogt, P.; Riitters, K.H.; Estreguil, C.; Kozak, J.; Wade, T.G.; Wickham, J.D. Mapping spatial patterns with morphological image processing. Landsc. Ecol. 2007, 22, 171–177. [Google Scholar] [CrossRef]
- Soille, P.; Vogt, P. Morphological segmentation of binary patterns. Patt. Recogn. Lett. 2009, 30, 456–459. [Google Scholar] [CrossRef]
- Meentemeyer, V.; University of Georgia, Athens, GA, USA. Personal communication, 2014.
- Hutchinson, G.E. The Ecological Theater and the Evolutionary Play; Yale University Press: New Haven, CT, USA, 1965. [Google Scholar]
- Meng, Q. Modeling and prediction of natural gas fracking pad landscapes in the Marcellus Shale region, USA. Landsc. Urban. Plan. 2014, 121, 109–116. [Google Scholar] [CrossRef]
- Chapman, P.M.; Bailey, H.; Canaria, E. Toxicity of total dissolved solids associated with two mine effluents to chironomid larvae and early life stages of rainbow trout. Environ. Toxicol. Chem. 2000, 19, 210–214. [Google Scholar] [CrossRef]
- Weber, R.; Fish, P.; Commission, B. History of the Management of Trout Fisheries in Pennsylvania; Division of Fisheries management, Bureau of Fisheries, Pennsylvania Fish and Boat Commission: Harrisburg, PA, USA, 2010. [Google Scholar]
- Norton, D.J.; Wickham, J.D.; Wade, T.G.; Kunert, K.; Thomas, J.V.; Zeph, P. A method for comparative analysis of recovery potential in impaired waters restoration planning. Environ. Manag. 2009, 44, 356–368. [Google Scholar] [CrossRef] [PubMed]
- Davies, R.J. Methane contamination of drinking water caused by hydraulic fracturing remains unproven. Proc. Natl. Acad. Sci. 2011, 108. [Google Scholar] [CrossRef] [PubMed]
- Jackson, R. Responses to Frequently Asked Questions and Comments about the Shale-Gas Paper by Osborn et al; Center on Global Climate Change, Duke University: Durham, NC, USA, 2011; Volume 13. [Google Scholar]
- Schon, S.C. Hydraulic fracturing not responsible for methane migration. Proc. Natl. Acad. Sci. 2011, 108. [Google Scholar] [CrossRef] [PubMed]
- Osborn, S.G.; Vengosh, A.; Warner, N.R.; Jackson, R.B. Methane contamination of drinking water accompanying gas-well drilling and hydraulic fracturing. Proc. Natl. Acad. Sci. 2011, 108, 8172–8176. [Google Scholar] [CrossRef] [PubMed]
- Water and Wastes Digest. PA DEP Secretary: New wastewater treatment standards for TDS now in effect, enforceable. Available online: http://www.wwdmag.com/pa-dep-secretary-new-wastewater-treatment-standards-tds-now-effect-enforceable (accessed on 25 May 2015).
- USEPA. Secondary Drinking Water Regulations: Guidance for Nuisance Chemicals; USEPA: Washington, DC, USA, 2014.
- Price, W.; Sprague, E. Pennsylvania’s forests: How they are changing and why we should care. Pinchot Institute for Conservation: Washington, DC, USA, 2011. Available online: http://www.pinchot.org/gp/Pennsylvania_Forest (accessed on 25 May 2015).
- Robinson, S.K.; Thompson, R.F., III; Donovan, T.M.; Whitehead, D.R.; Faaborg, J. Regional forest fragmentation and the nesting success of migratory birds. Science 1995, 267, 93–102. [Google Scholar] [CrossRef] [PubMed]
- Gascon, C.; Williamson, G.B.; da Fonseca, G.A. Receding forest edges and vanishing reserves. Science 2000, 288, 1356–1358. [Google Scholar] [CrossRef] [PubMed]
- Kapos, V. Effects of isolation on the water status of forest patches in the Brazilian Amazon. J. Trop. Ecol. 1989, 5, 173–185. [Google Scholar] [CrossRef]
- Weathers, K.C.; Cadenasso, M.L.; Pickett, S.T. Forest edges as nutrient and pollutant concentrators: Potential synergisms between fragmentation, forest canopies, and the atmosphere. Conserv. Biol. 2001, 15, 1506–1514. [Google Scholar] [CrossRef]
- Murcia, C. Edge effects in fragmented forests: Implications for conservation. Trends Ecol. Evol. 1995, 10, 58–62. [Google Scholar] [CrossRef]
- Rozell, D.J.; Reaven, S.J. Water pollution risk associated with natural gas extraction from the marcellus shale. Risk Anal. 2012, 32, 1382–1393. [Google Scholar] [CrossRef] [PubMed]
© 2015 by the authors; licensee MDPI, Basel, Switzerland. This article is an open access article distributed under the terms and conditions of the Creative Commons Attribution license (http://creativecommons.org/licenses/by/4.0/).