
Late 20th Century Hypereutrophication of Northern Alberta’s Utikuma Lake

 , , , , ,
Abstract
1. Introduction
Study Area
2. Materials and Methods
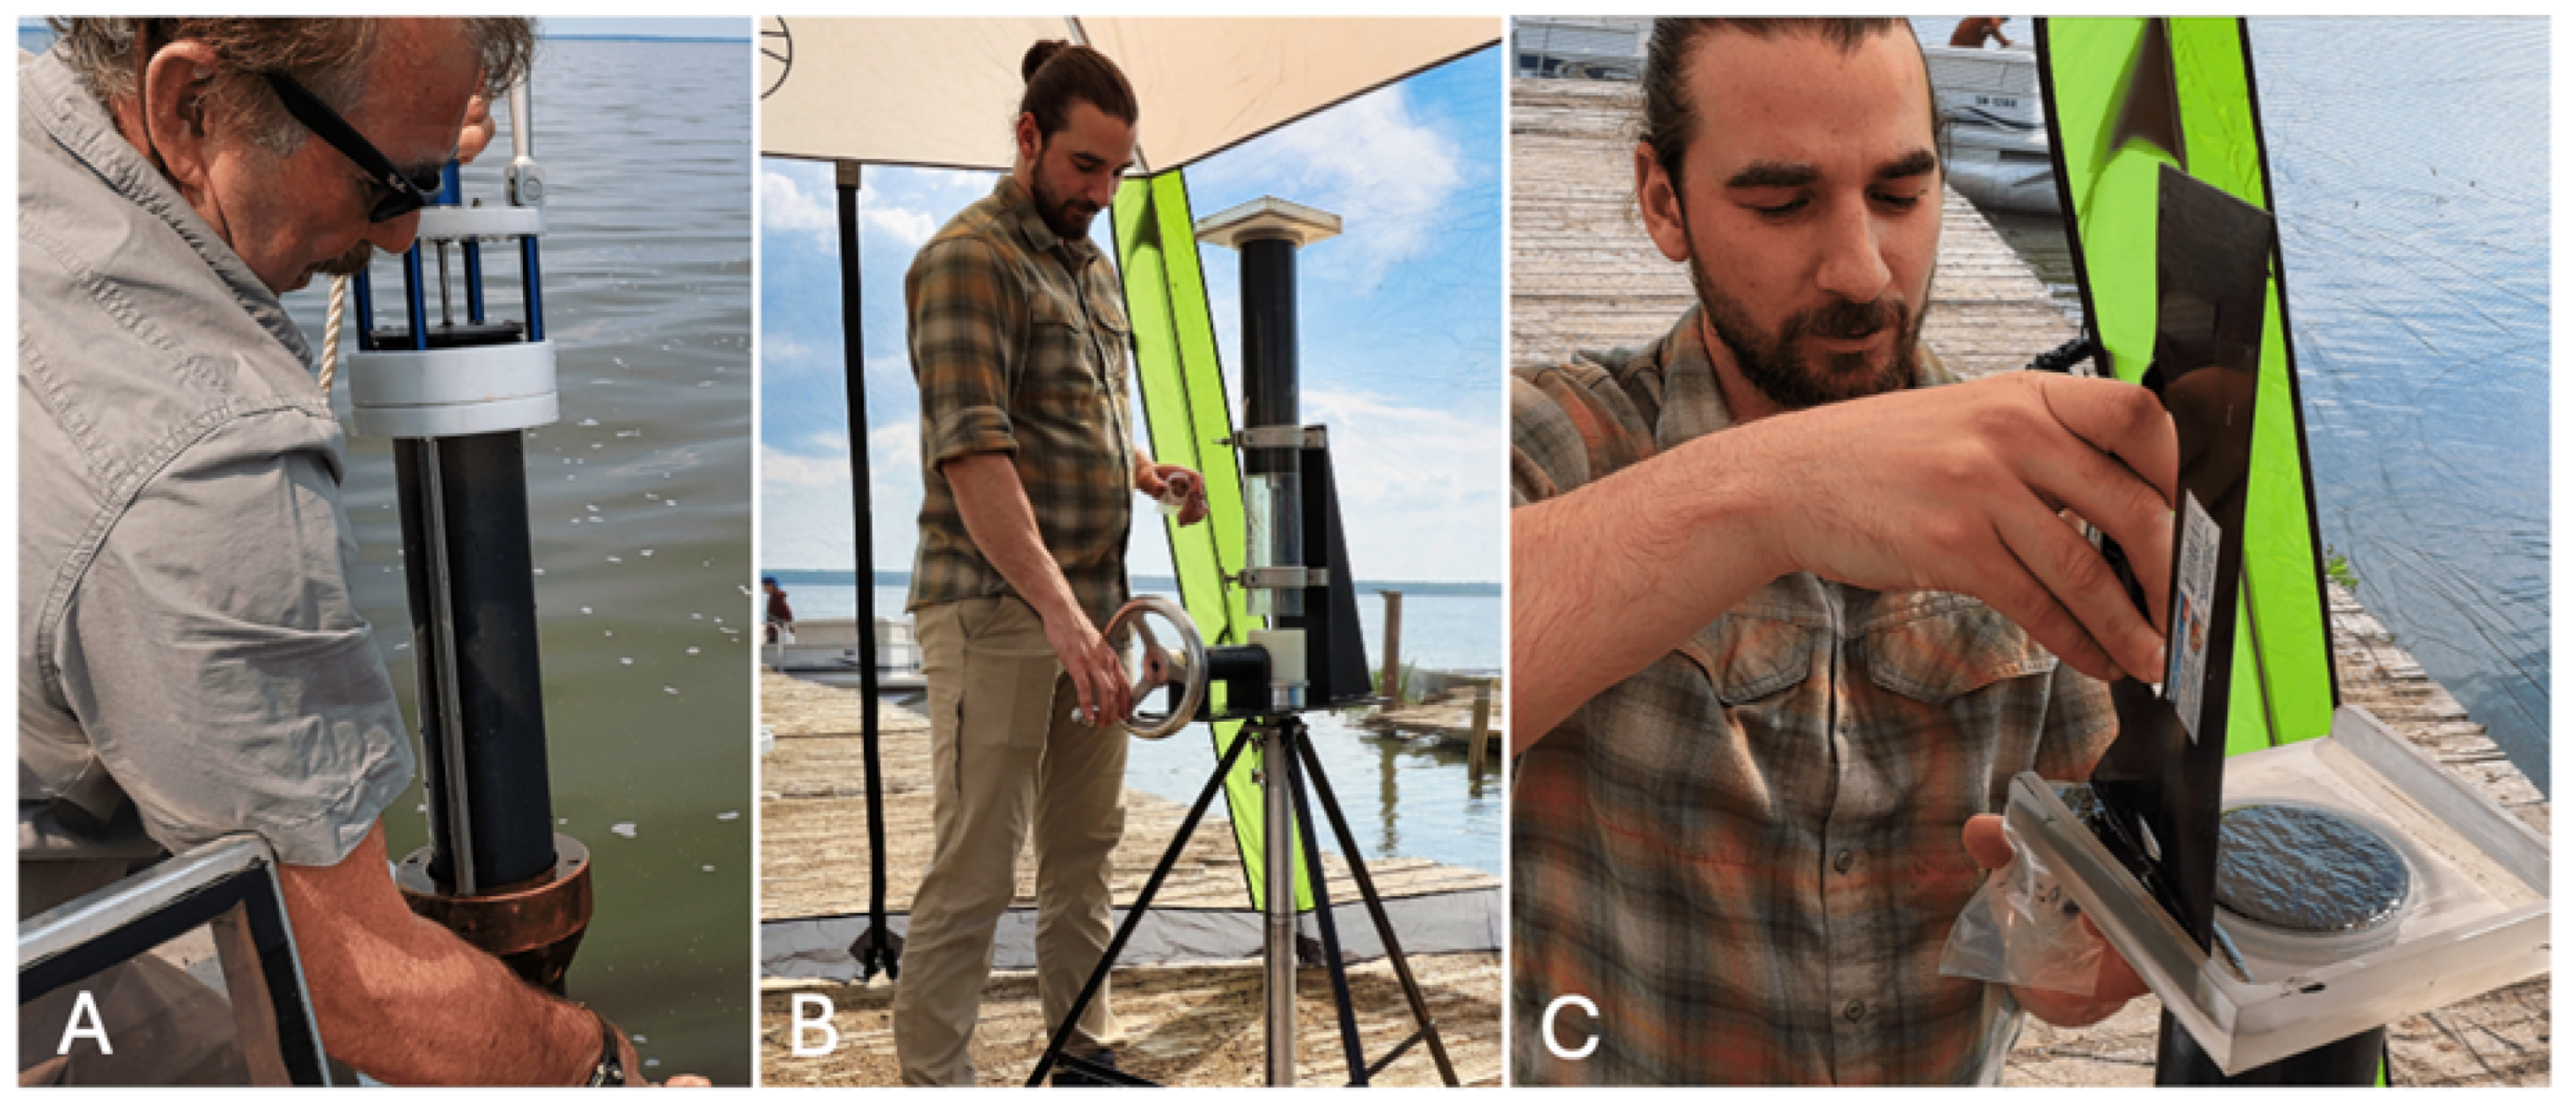
2.1. Core Collection and Subsampling
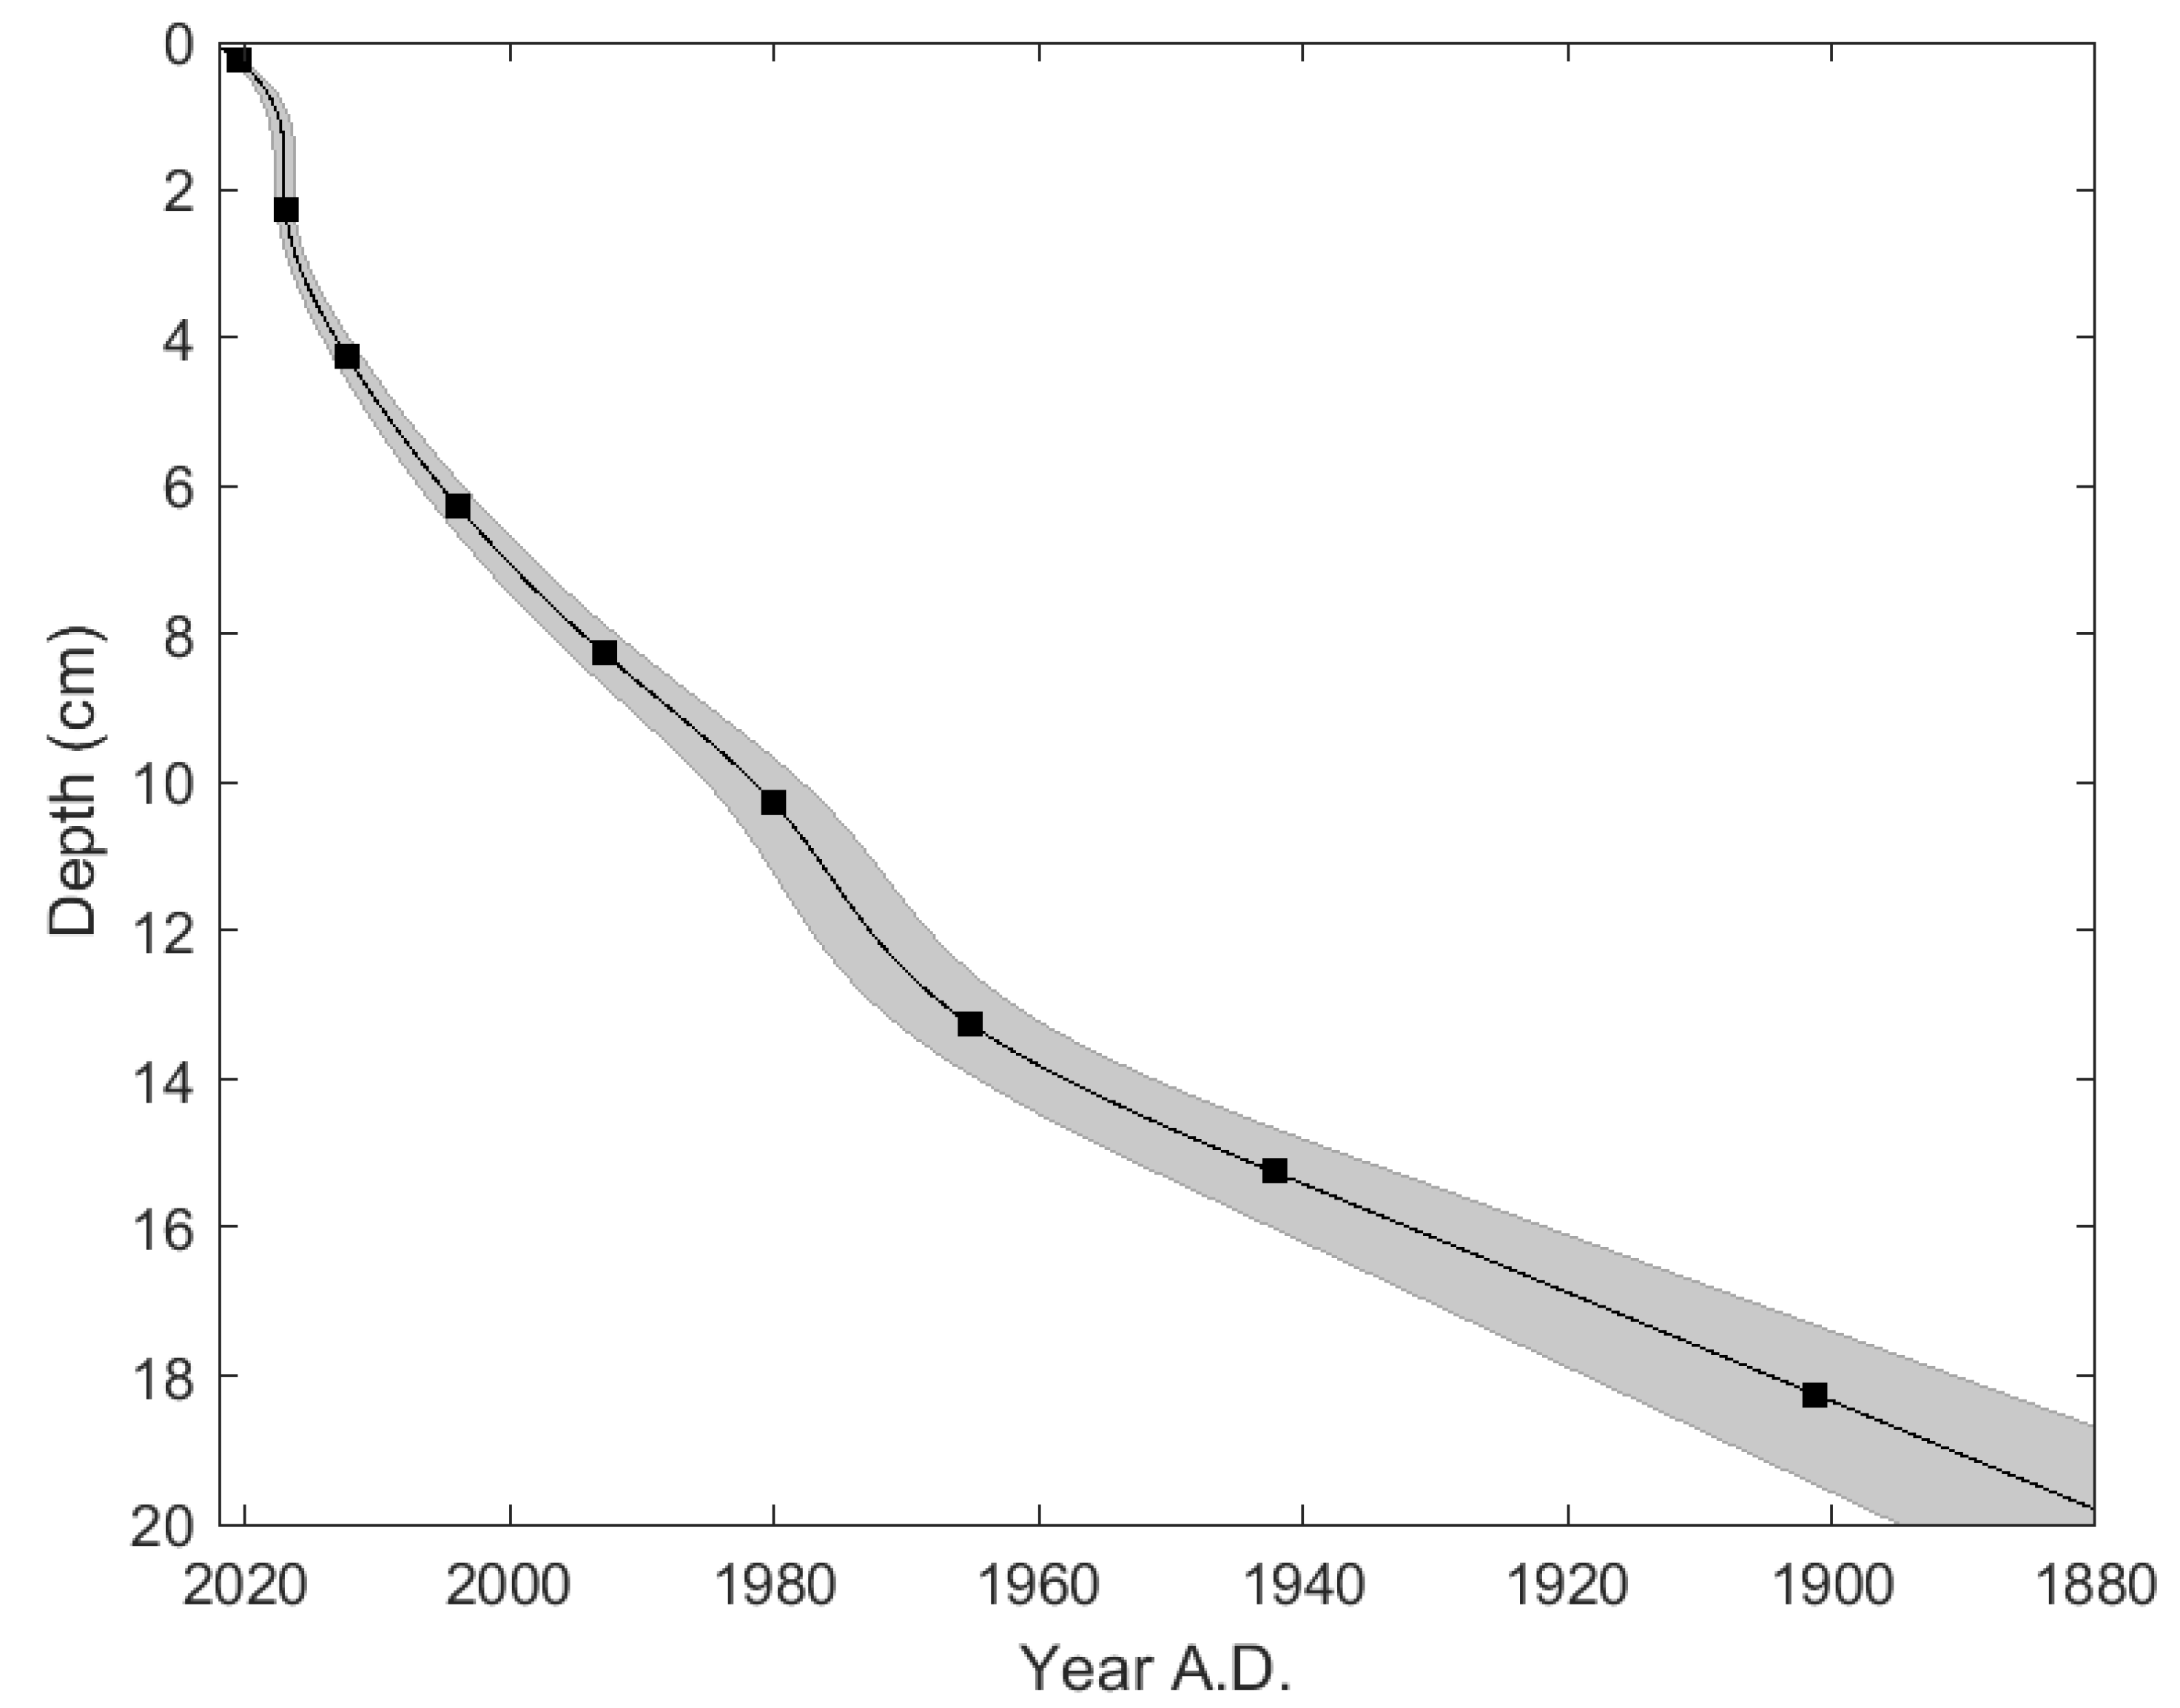
2.2. 210Pb Chronology
2.3. ITRAX-XRF Analysis
2.4. Grain Size Analysis
- 1.
- Addition of 10% HCl to dissolve and remove carbonate minerals.
- 2.
- Addition of 30% H2O2 to oxidize and remove organic matter.
- 3.
- Addition of 0.2 M NaOH to dissolve and remove biogenic silica.
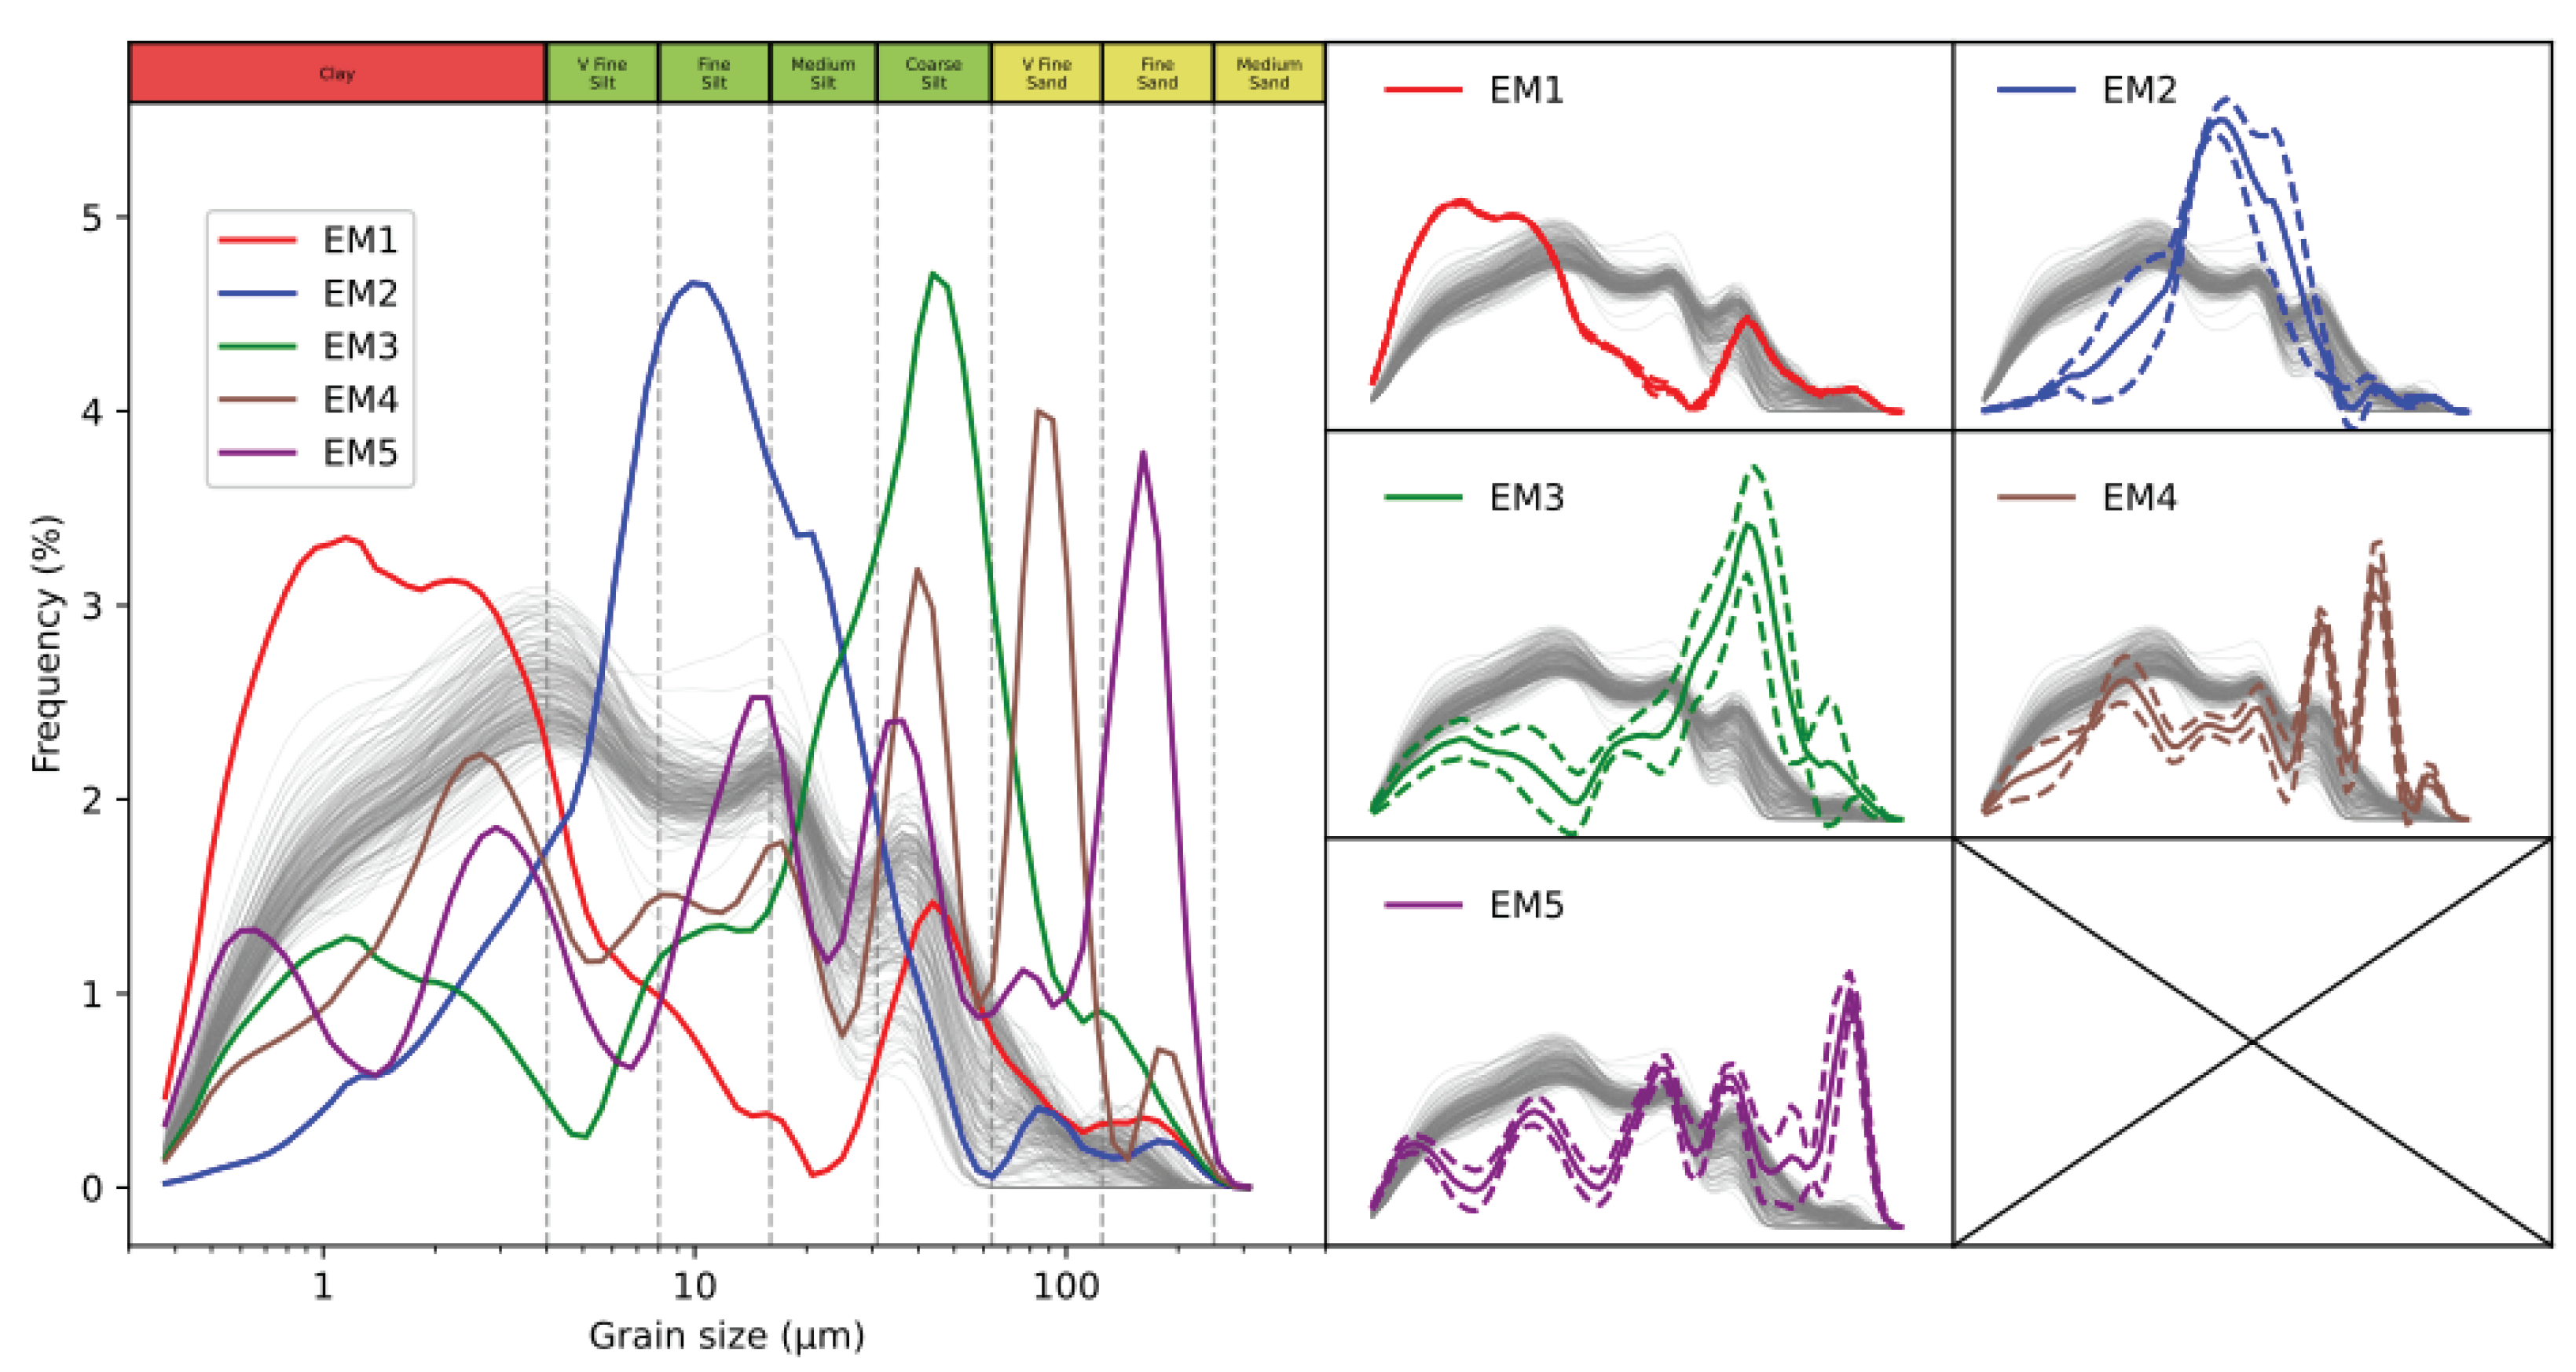
End-Member Modeling Analysis
2.5. CONISS Cluster Analysis of ITRAX Elemental Profiles and EMMA Data
2.6. Time Series Analysis
3. Results
3.1. Grain Size Analysis
3.2. CONISS Clustering of ITRAX and EMMA
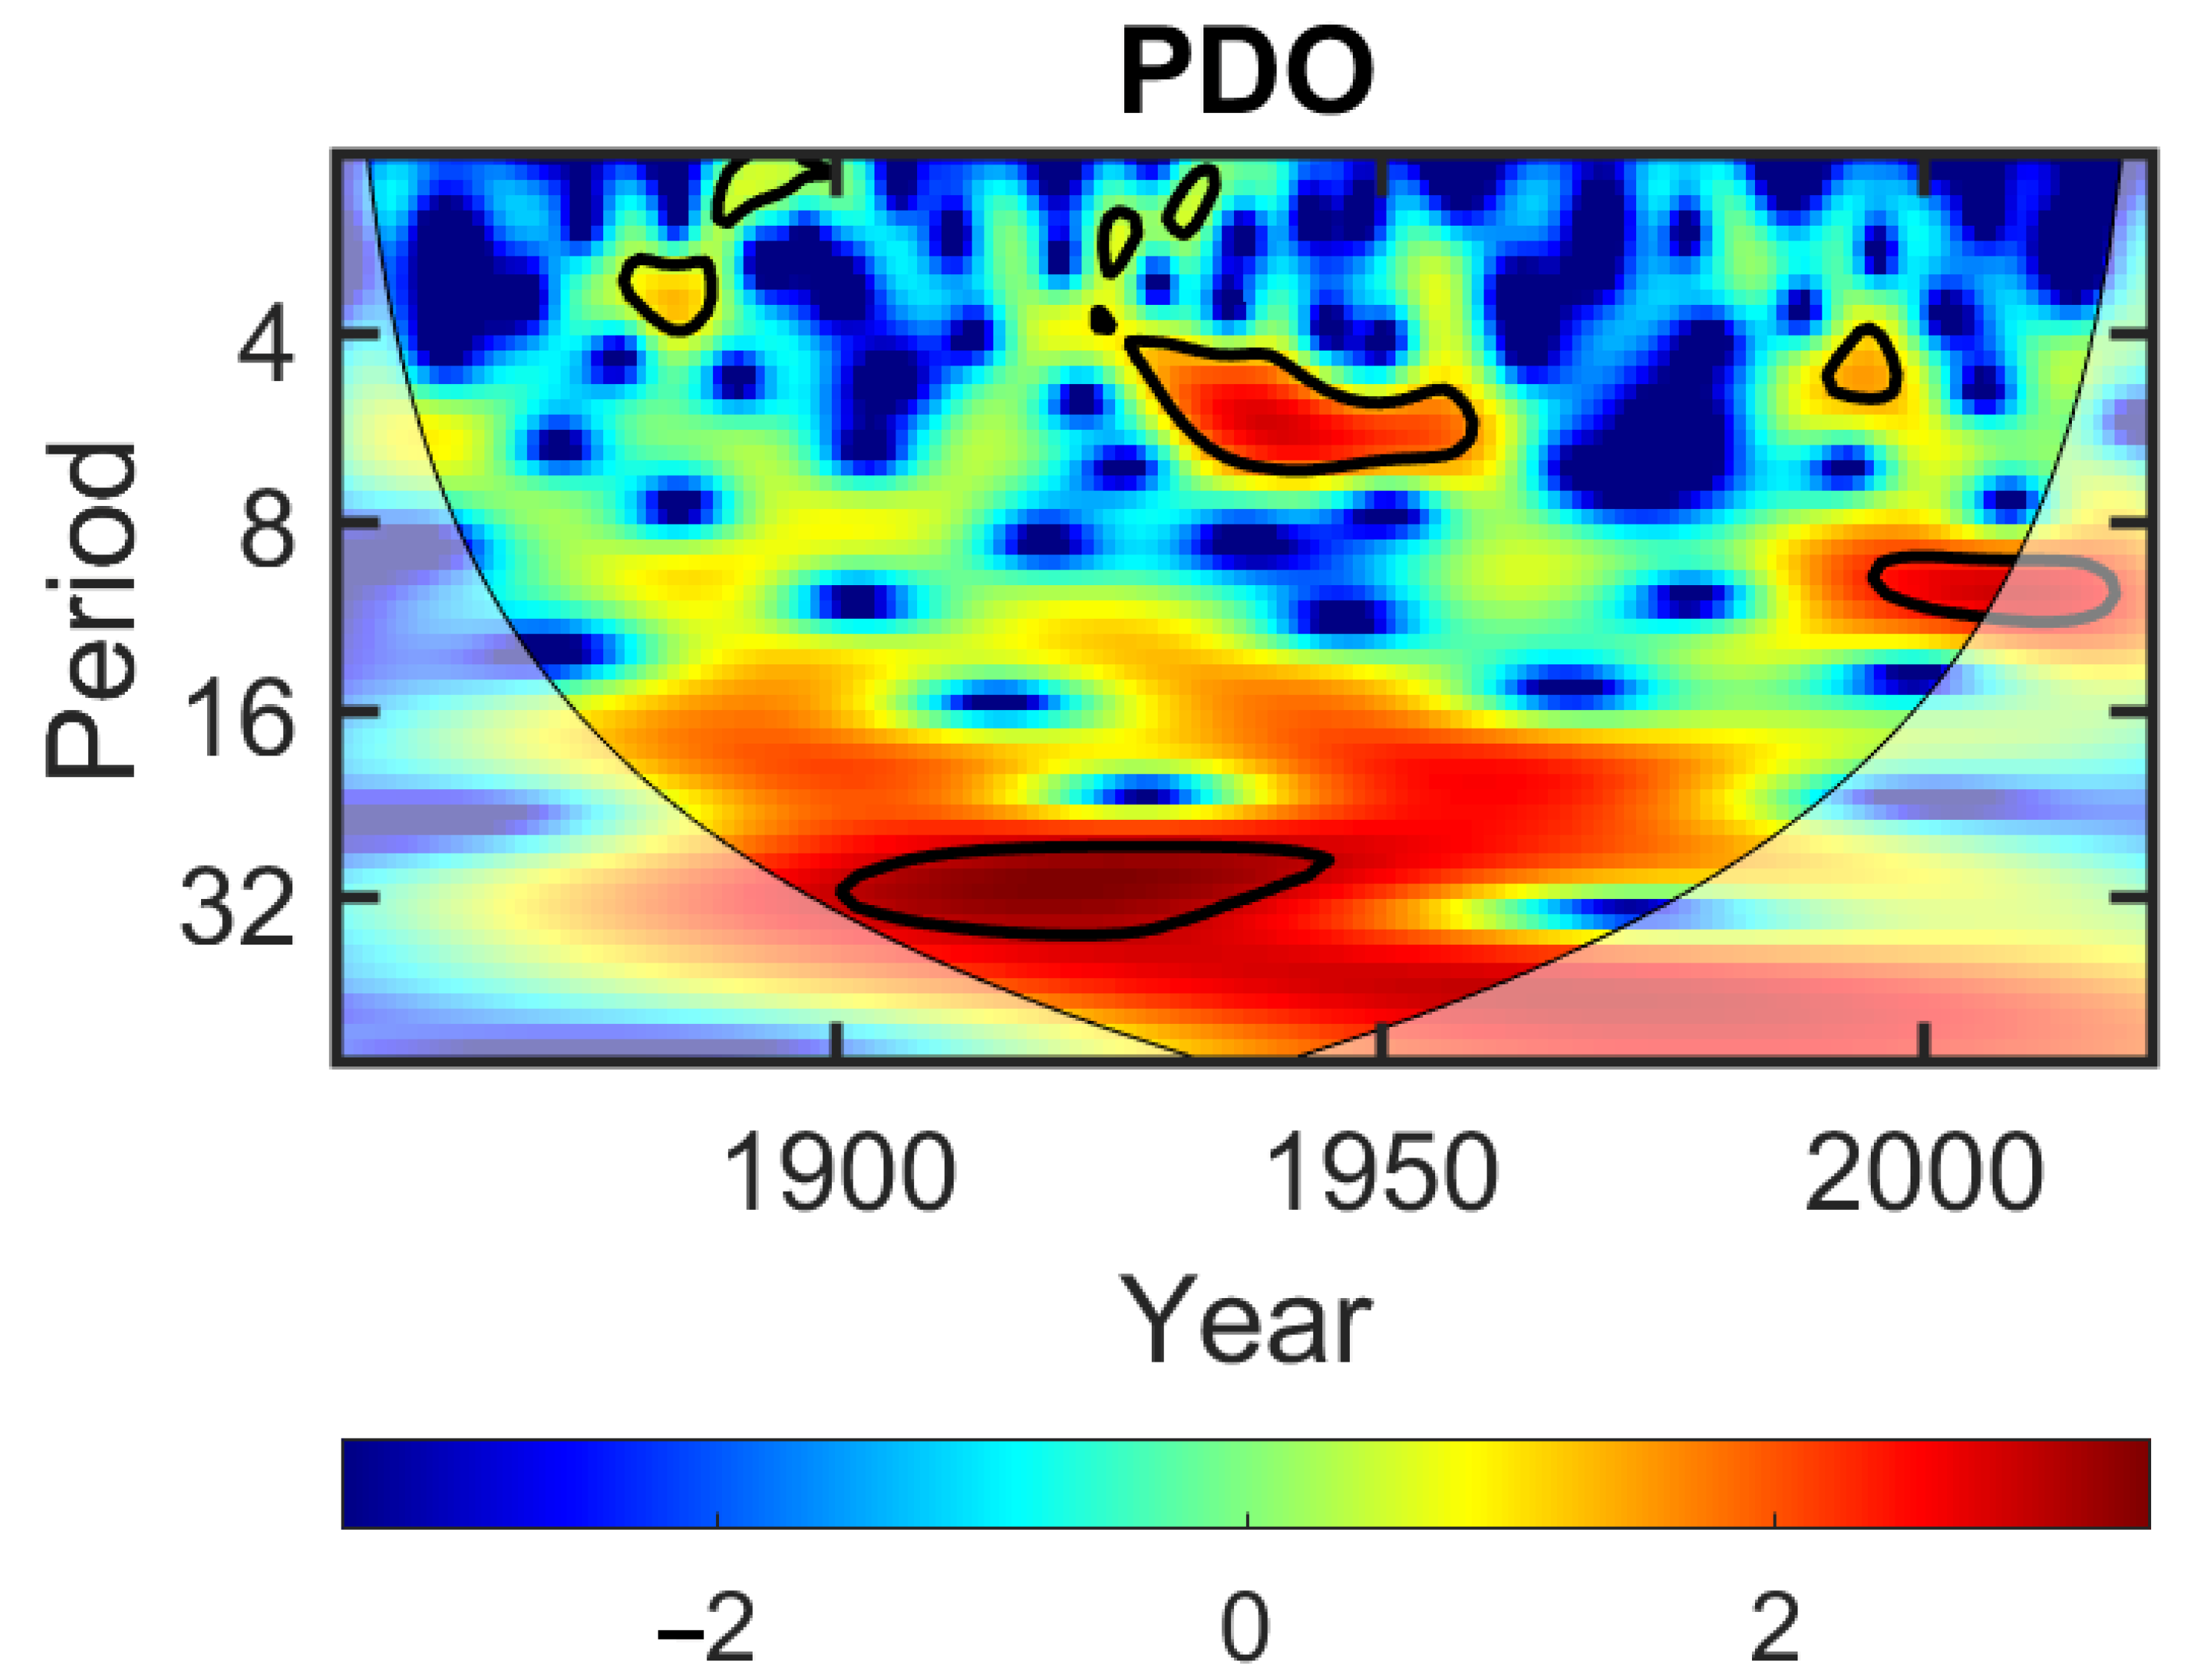
3.3. Time Series Analysis
3.3.1. ITRAX
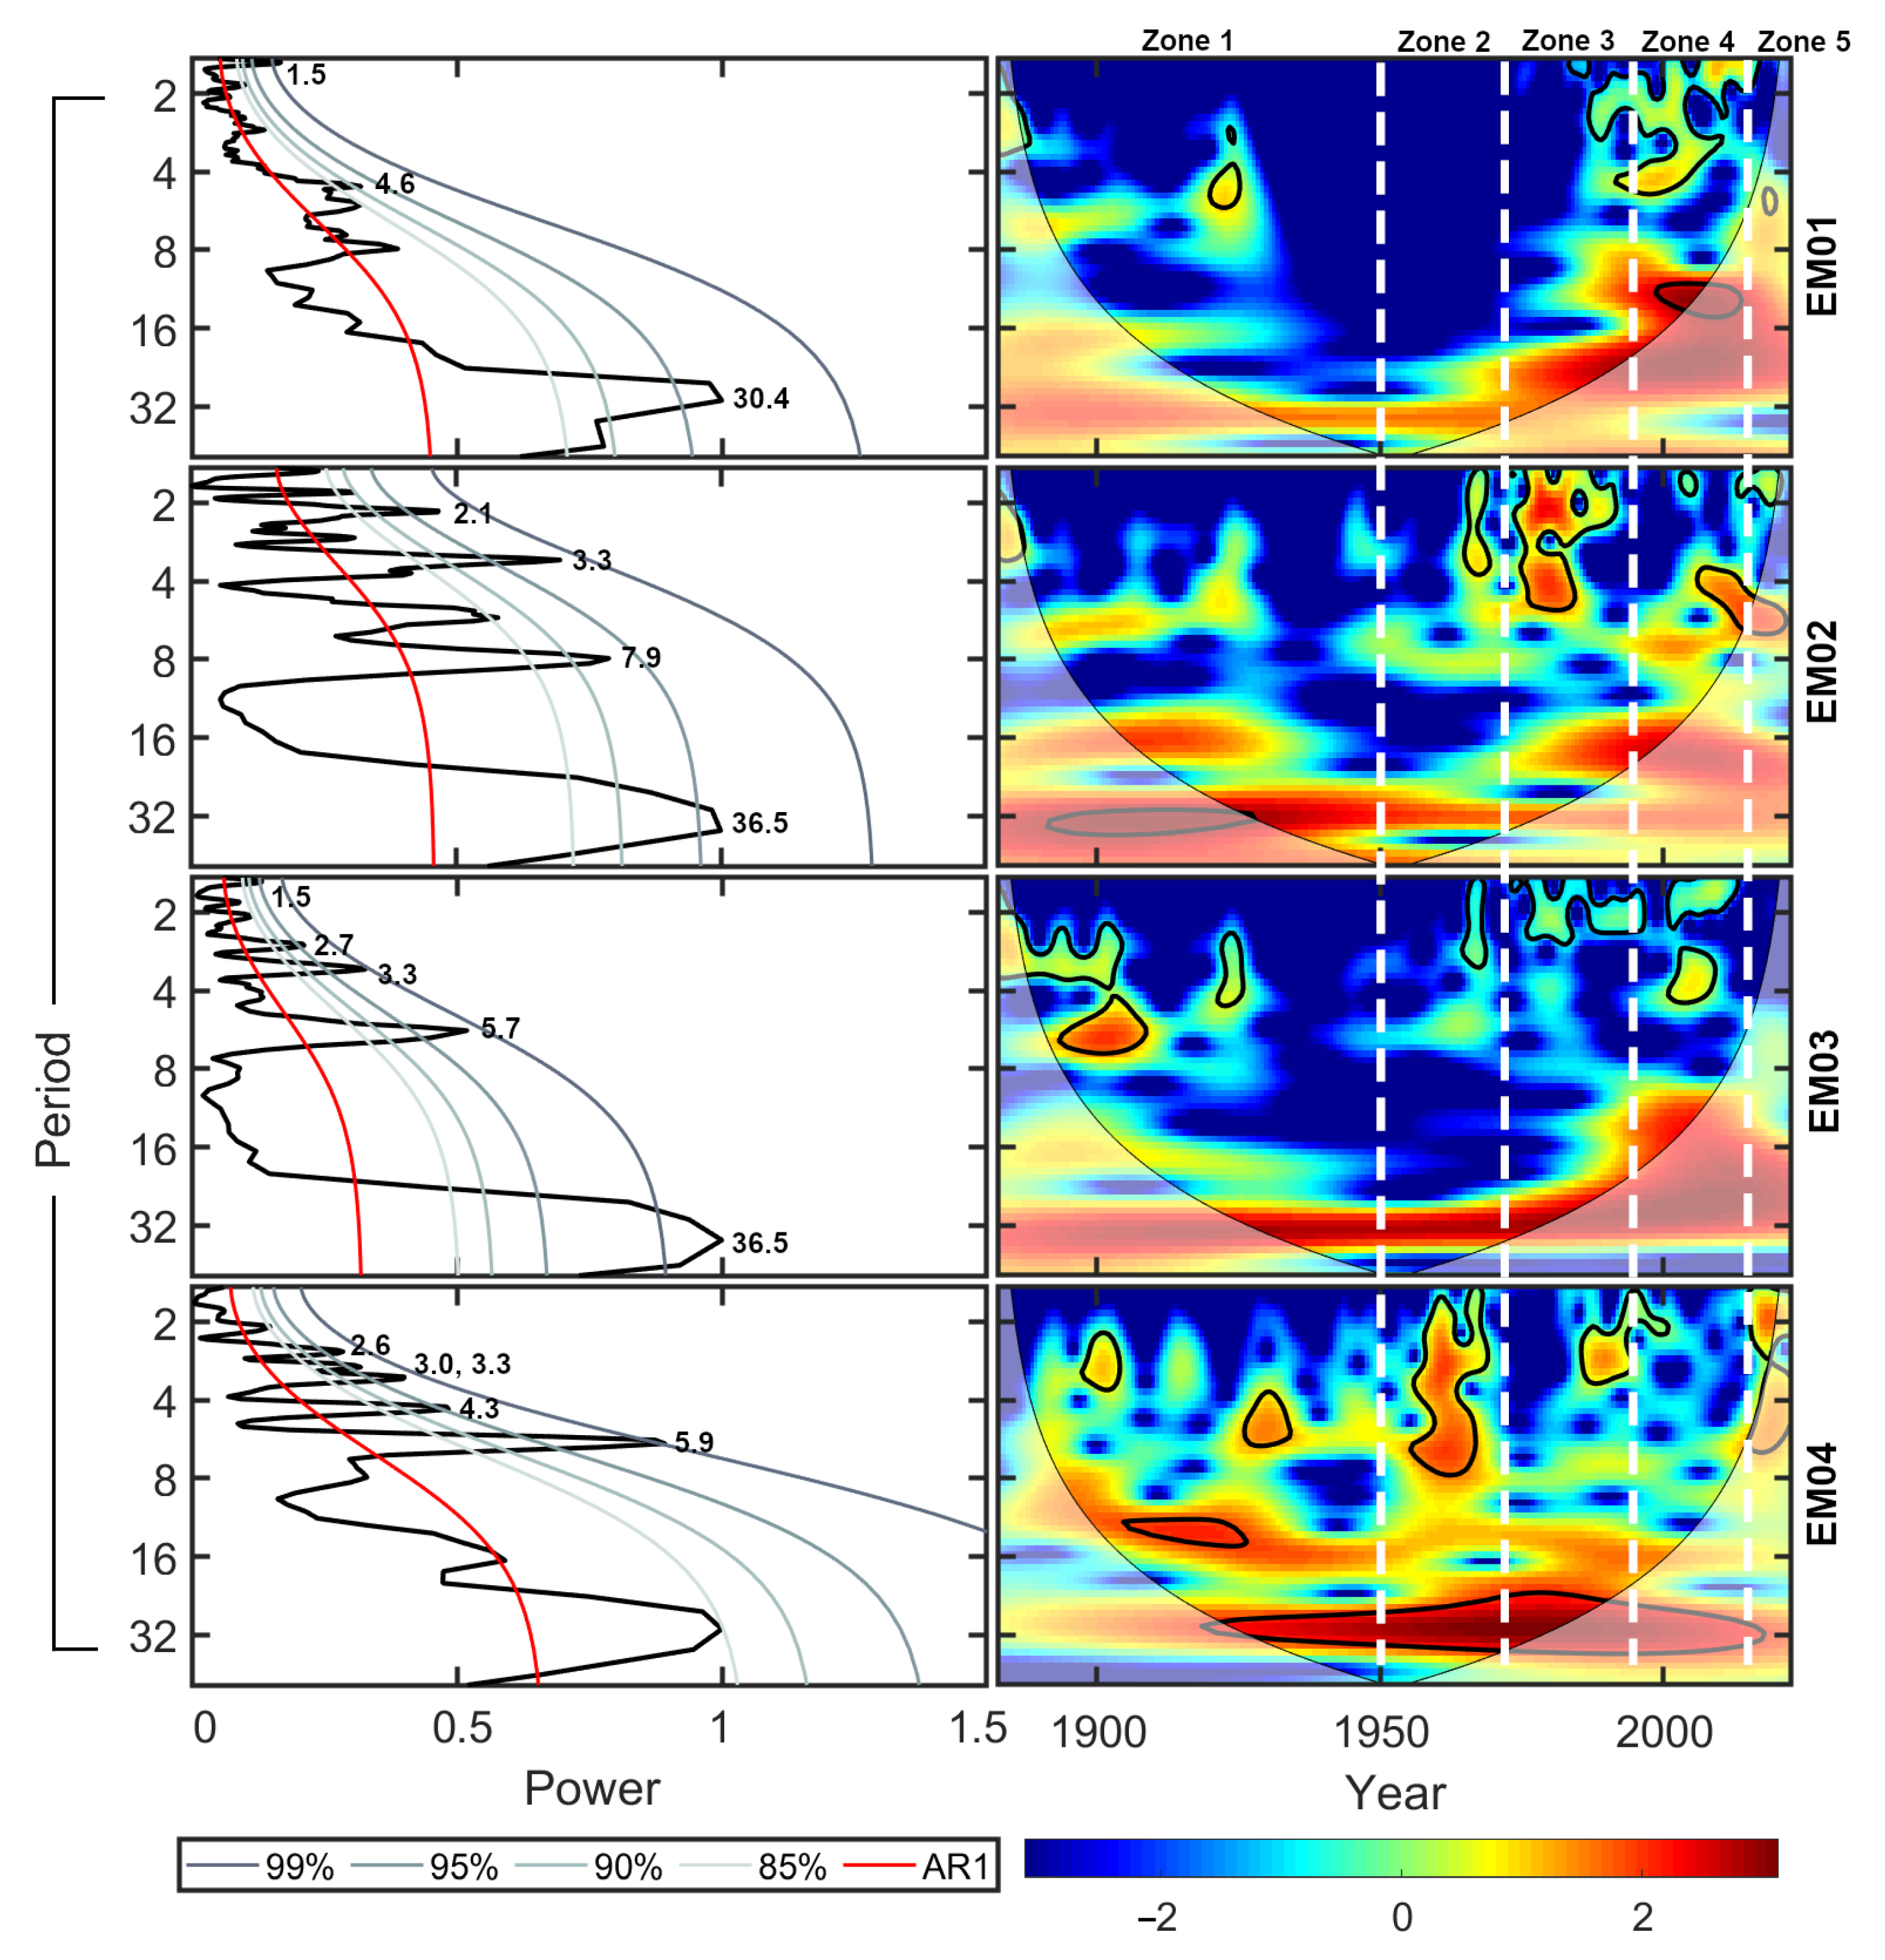
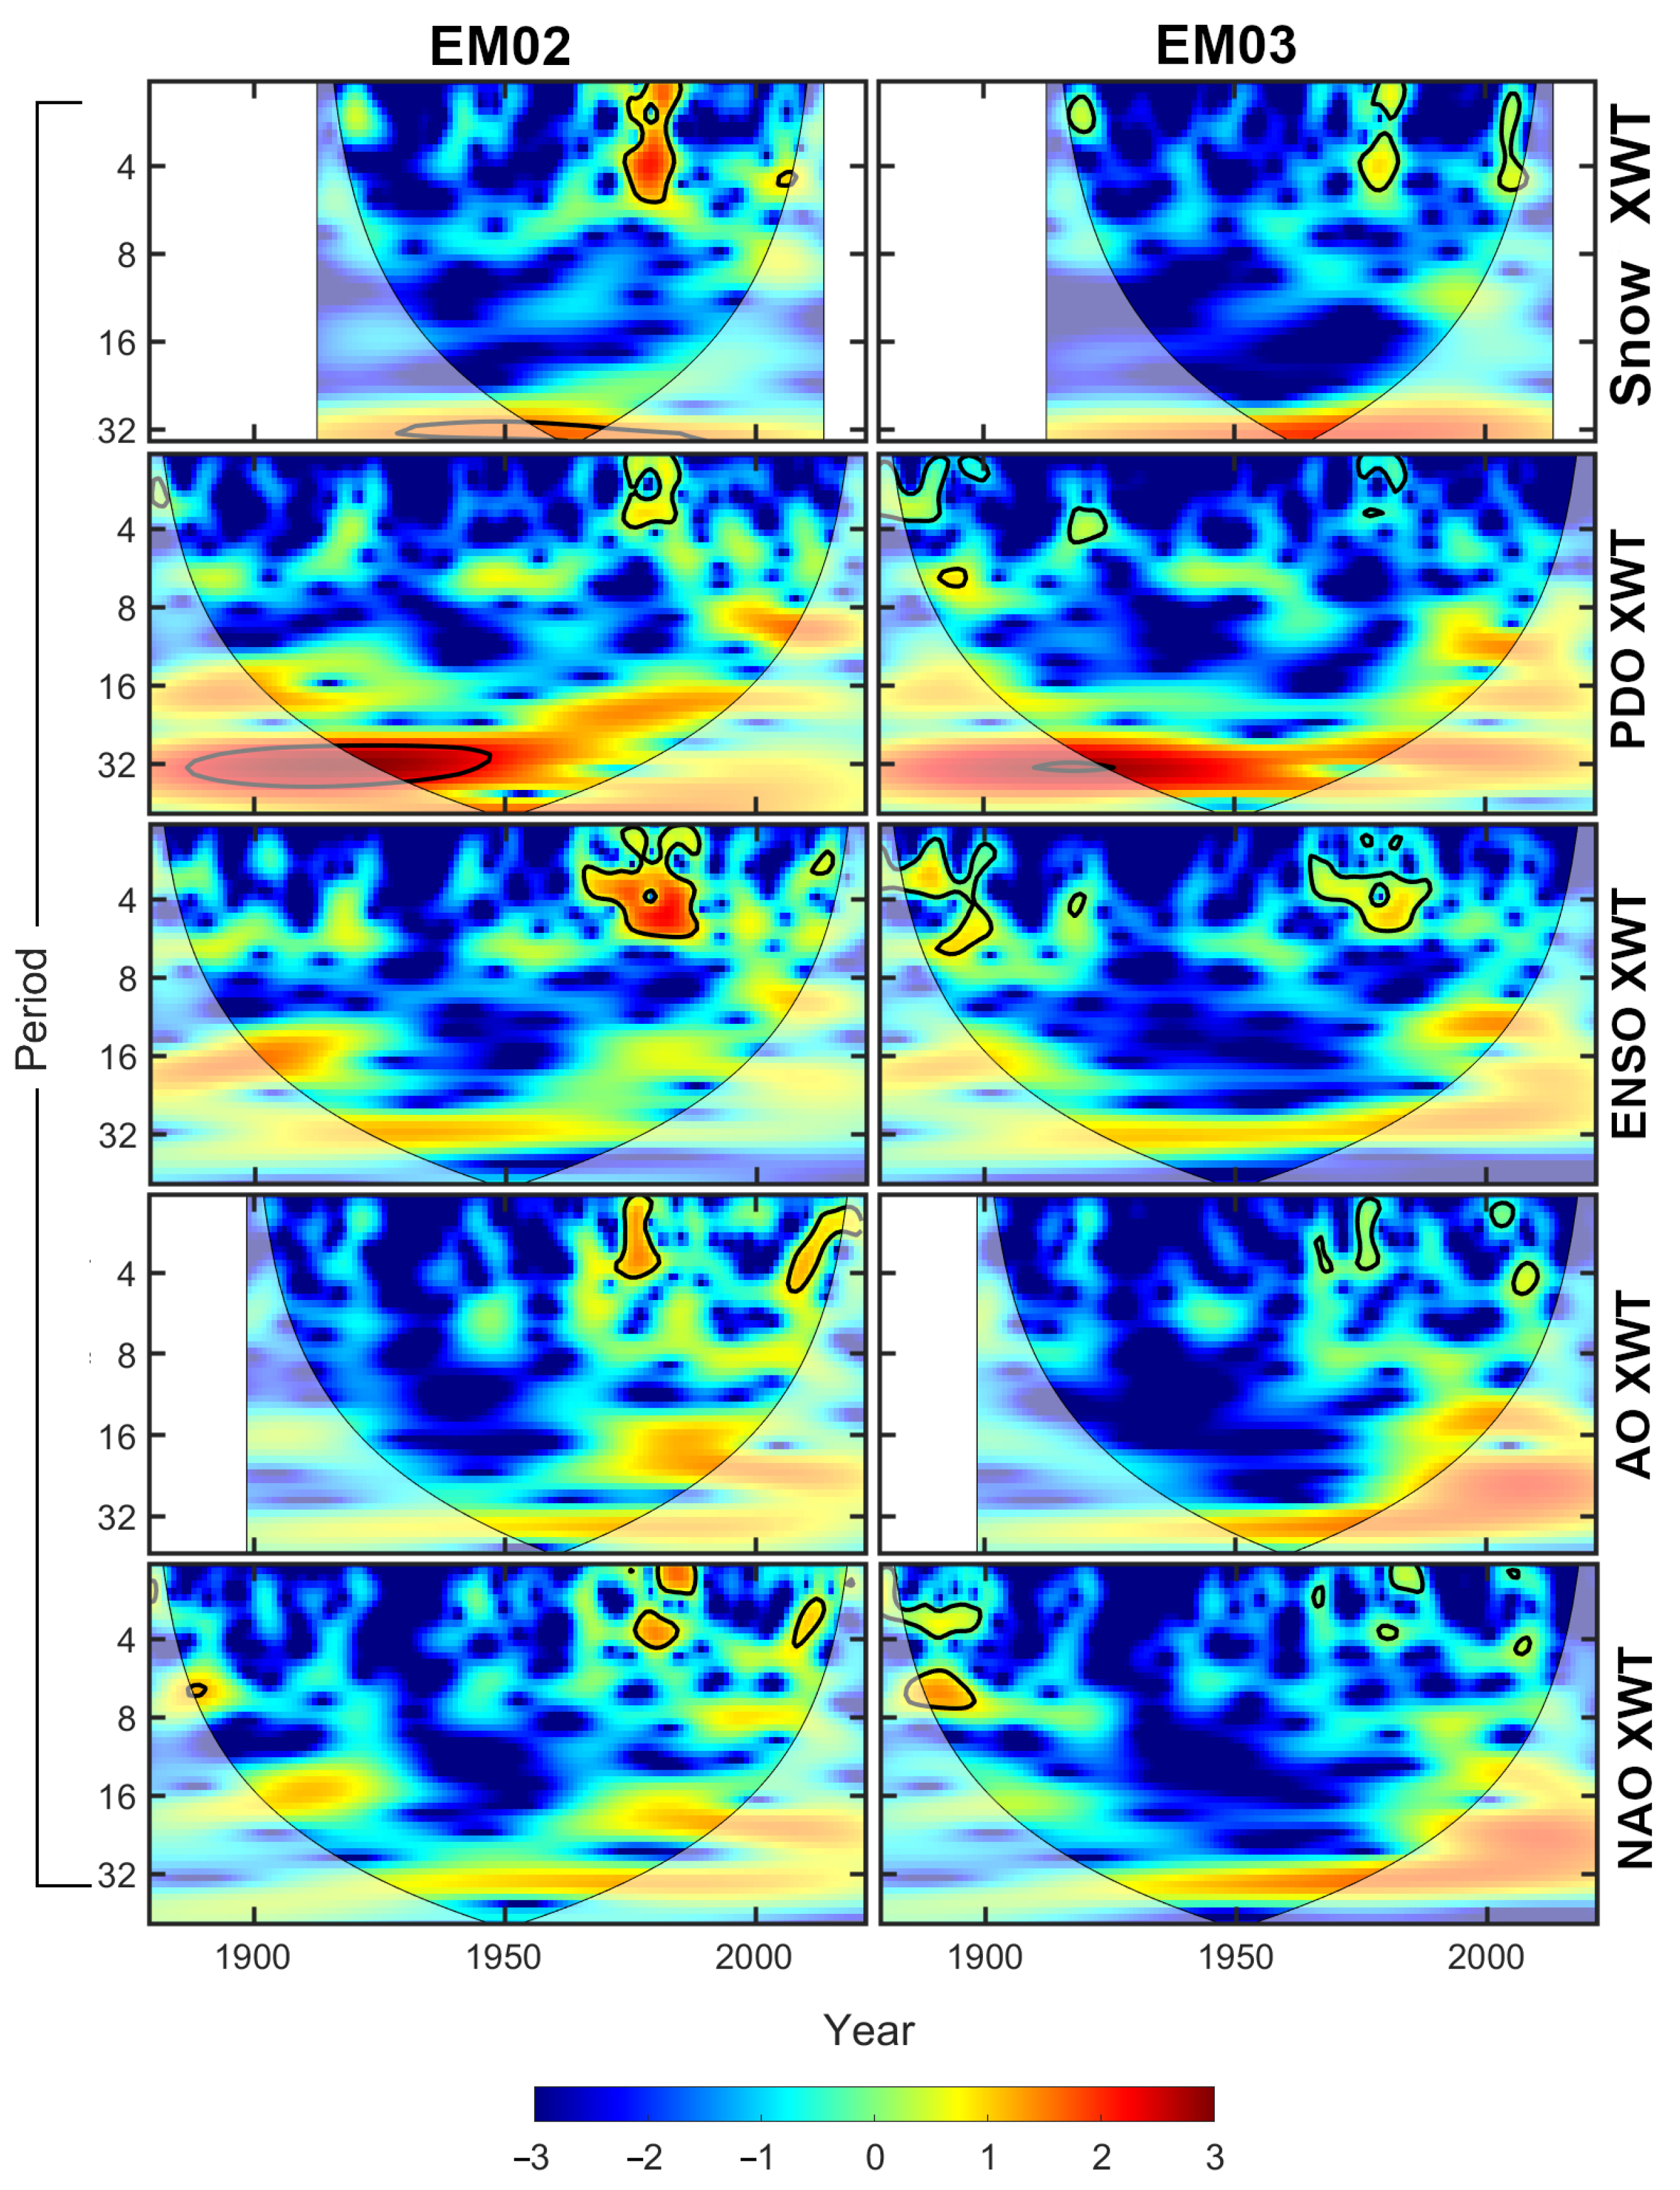
3.3.2. EMMA
4. Discussion
4.1. Spring Freshet
4.2. Storms
4.3. Anthropogenic Influence
5. Conclusions
Author Contributions
Funding
Data Availability Statement
Acknowledgments
Conflicts of Interest
Abbreviations
| WLFN | Whitefish Lake First Nation |
| EMMA | End-Member Modeling Analysis |
| MTM | Multitaper Method |
| CWT | Continuous Wavelet Transform |
| XWT | Cross Wavelet Transform |
| PDO | Pacific Decadal Oscillation |
| NAO | North Atlantic Oscillation |
| AO | Arctic Oscillation |
| ENSO | El Niño Southern Oscillation |
Appendix A
References
- CPP Environmental. Utikuma Lake 2018 Monitoring Report; CPP Environmental: Sherwood Park, AB, Canada, 2020. [Google Scholar]
- Paerl, H.W.; Barnard, M.A. Mitigating the global expansion of harmful cyanobacterial blooms: Moving targets in a human-and climatically-altered world. Harmful Algae 2020, 96, 101845. [Google Scholar] [CrossRef] [PubMed]
- Erratt, K.J.; Creed, I.F.; Lobb, D.A.; Smol, J.P.; Trick, C.G. Climate change amplifies the risk of potentially toxigenic cyanobacteria. Glob. Change Biol. 2023, 29, 5240–5249. [Google Scholar] [CrossRef]
- Schindler, D.; Wolfe, A.P.; Vinebrooke, R.; Crowe, A.; Blais, J.M.; Miskimmin, B.; Freed, R.; Perren, B. The cultural eutrophication of Lac la Biche, Alberta, Canada: A paleoecological study. Can. J. Fish. Aquat. Sci. 2008, 65, 2211–2223. [Google Scholar] [CrossRef]
- Schindler, D.W.; Hecky, R.E.; McCullough, G.K. The rapid eutrophication of Lake Winnipeg: Greening under global change. J. Great Lakes Res. 2012, 38, 6–13. [Google Scholar] [CrossRef]
- Taranu, Z.E.; Gregory-Eaves, I.; Leavitt, P.R.; Bunting, L.; Buchaca, T.; Catalan, J.; Domaizon, I.; Guilizzoni, P.; Lami, A.; McGowan, S.; et al. Acceleration of cyanobacterial dominance in north temperate-subarctic lakes during the Anthropocene. Ecol. Lett. 2015, 18, 375–384. [Google Scholar] [CrossRef]
- O’Neil, J.M.; Davis, T.W.; Burford, M.A.; Gobler, C.J. The rise of harmful cyanobacteria blooms: The potential roles of eutrophication and climate change. Harmful Algae 2012, 14, 313–334. [Google Scholar] [CrossRef]
- Huisman, J.; Codd, G.A.; Paerl, H.W.; Ibelings, B.W.; Verspagen, J.M.; Visser, P.M. Cyanobacterial blooms. Nat. Rev. Microbiol. 2018, 16, 471–483. [Google Scholar] [CrossRef] [PubMed]
- Munawar, M.; Fitzpatrick, M. Eutrophication in three Canadian Areas of Concern: Phytoplankton and major nutrient interactions. Aquat. Ecosyst. Health Manag. 2018, 21, 421–437. [Google Scholar] [CrossRef]
- Gushulak, C.A.; Chegoonian, A.M.; Wolfe, J.; Gray, K.; Mezzini, S.; Wissel, B.; Hann, B.; Baulch, H.M.; Finlay, K.; Leavitt, P.R. Impacts of hydrologic management on the eutrophication of shallow lakes in an intensive agricultural landscape (Saskatchewan, Canada). Freshwater Biol. 2024, 69, 984–1000. [Google Scholar] [CrossRef]
- Patterson, R.T.; Nasser, N.A.; Reinhardt, E.G.; Patterson, C.W.; Gregory, B.R.; Mazzella, V.; Roe, H.M.; Galloway, J.M. End-Member Mixing Analysis as a Tool for the Detection of Major Storms in Lake Sediment Records. Paleoceanogr. Paleoclimatol. 2022, 37, e2022PA004510. [Google Scholar] [CrossRef]
- MacDonald, G.M.; Larsen, C.P.; Szeicz, J.M.; Moser, K.A. The reconstruction of boreal forest fire history from lake sediments: A comparison of charcoal, pollen, sedimentological, and geochemical indices. Quat. Sci. Rev. 1991, 10, 53–71. [Google Scholar] [CrossRef]
- Shotbolt, L.A.; Thomas, A.D.; Hutchinson, S.M. The use of reservoir sediments as environmental archives of catchment inputs and atmospheric pollution. Prog. Phys. Geogr. 2005, 29, 337–361. [Google Scholar] [CrossRef]
- Gammon, P.R.; Neville, L.A.; Patterson, R.T.; Savard, M.M.; Swindles, G.T. A log-normal spectral analysis of inorganic grain-size distributions from a Canadian boreal lake core: Towards refining depositional process proxy data from high latitude lakes. Sedimentology 2017, 64, 609–630. [Google Scholar] [CrossRef]
- Mitchell, P.; Prepas, E.E. Atlas of Alberta Lakes; University of Alberta: Edmonton, AB, Canada, 1990. [Google Scholar]
- Sass, G.; Creed, I. Characterizing hydrodynamics on boreal landscapes using archived synthetic aperture radar imagery. Hydrol. Process. Int. J. 2008, 22, 1687–1699. [Google Scholar] [CrossRef]
- Natural Regions Committee. Natural Regions and Subregions of Alberta; Technical Report Pub. No., T/852; Downing, D.J., Pettapiece, W.W., Eds.; Government of Alberta: Edmonton, AB, Canada, 2006. [Google Scholar]
- Environment and Natural Resources Canada. Canadian Climate Normals 1991–2020 (Slave Lake). 2024. Available online: https://climate.weather.gc.ca/climate_normals/index_e.html#1991 (accessed on 25 July 2024).
- Patterson, R.T.; Nasser, N.A.; Tremblay, S.; Galloway, J.M. A portable extruder for accurate and precise high-resolution subsampling of unconsolidated sediment cores. J. Paleolimnol. 2022, 67, 183–189. [Google Scholar] [CrossRef]
- Swarzenski, P.W. 210Pb Dating. In Encyclopedia of Scientific Dating Methods; Rink, W.J., Thompson, J., Eds.; Springer: Dordrecht, The Netherlands, 2013; pp. 1–11. [Google Scholar] [CrossRef]
- Gregory, B.R.; Reinhardt, E.G.; Macumber, A.L.; Nasser, N.A.; Patterson, R.T.; Kovacs, S.E.; Galloway, J.M. Sequential sample reservoirs for Itrax-XRF analysis of discrete samples. J. Paleolimnol. 2017, 57, 287–293. [Google Scholar] [CrossRef]
- Croudace, I.W.; Rindby, A.; Rothwell, R.G. ITRAX: Description and evaluation of a new multi-function X-ray core scanner. Geol. Soc. Lond. Spec. Publ. 2006, 267, 51–63. [Google Scholar] [CrossRef]
- Gregory, B.R.; Patterson, R.T.; Reinhardt, E.G.; Galloway, J.M.; Roe, H.M. An evaluation of methodologies for calibrating Itrax X-ray fluorescence counts with ICP-MS concentration data for discrete sediment samples. Chem. Geol. 2019, 521, 12–27. [Google Scholar] [CrossRef]
- Löwemark, L.; Bloemsma, M.; Croudace, I.; Daly, J.S.; Edwards, R.J.; Francus, P.; Galloway, J.M.; Gregory, B.R.; Huang, J.J.S.; Jones, A.F.; et al. Practical guidelines and recent advances in the Itrax XRF core-scanning procedure. Quat. Int. 2019, 514, 16–29. [Google Scholar] [CrossRef]
- Thomson, J.; Croudace, I.; Rothwell, R. A geochemical application of the ITRAX scanner to a sediment core containing eastern Mediterranean sapropel units. Geol. Soc. Lond. Spec. Publ. 2006, 267, 65–77. [Google Scholar] [CrossRef]
- Chagué-Goff, C.; Chan, J.C.H.; Goff, J.; Gadd, P. Late Holocene record of environmental changes, cyclones and tsunamis in a coastal lake, Mangaia, Cook Islands. Isl. Arc 2016, 25, 333–349. [Google Scholar] [CrossRef]
- McNeill-Jewer, C.A.; Reinhardt, E.G.; Collins, S.; Kovacs, S.; Chan, W.M.; Devos, F.; LeMaillot, C. The effect of seasonal rainfall on nutrient input and biological productivity in the Yax Chen cave system (Ox Bel Ha), Mexico, and implications for μXRF core studies of paleohydrology. Palaeogeogr. Palaeoclimatol. Palaeoecol. 2019, 534, 109289. [Google Scholar] [CrossRef]
- Rothwell, R.G.; Croudace, I.W. Twenty Years of XRF Core Scanning Marine Sediments: What Do Geochemical Proxies Tell Us? In Micro-XRF Studies of Sediment Cores: Applications of a Non-Destructive Tool for the Environmental Sciences; Croudace, I.W., Rothwell, R.G., Eds.; Springer: Dordrecht, The Netherlands, 2015; pp. 25–102. [Google Scholar] [CrossRef]
- Murray, M.R. Is laser particle size determination possible for carbonate-rich lake sediments? J. Paleolimnol. 2002, 27, 173–183. [Google Scholar] [CrossRef]
- van Hengstum, P.; Reinhardt, E.; Boyce, J.; Clark, C. Changing sedimentation patterns due to historical land-use change in Frenchman’s Bay, Pickering, Canada: Evidence from high-resolution textural analysis. J. Paleolimnol. 2007, 37, 603–618. [Google Scholar] [CrossRef]
- R Core Team. R: A Language and Environment for Statistical Computing; R Foundation for Statistical Computing: Vienna, Austria, 2022. [Google Scholar]
- Dietze, E.; Dietze, M. Grain-size distribution unmixing using the R package EMMAgeo. E G Quat. Sci. J. 2019, 68, 29–46. [Google Scholar]
- Dietze, E.; Hartmann, K.; Diekmann, B.; IJmker, J.; Lehmkuhl, F.; Opitz, S.; Stauch, G.; Wünnemann, B.; Borchers, A. An end-member algorithm for deciphering modern detrital processes from lake sediments of Lake Donggi Cona, NE Tibetan Plateau, China. Sediment. Geol. 2012, 243–244, 169–180. [Google Scholar] [CrossRef]
- Grimm, E.C. CONISS: A FORTRAN 77 program for stratigraphically constrained cluster analysis by the method of incremental sum of squares. Comput. Geosci. 1987, 13, 13–35. [Google Scholar] [CrossRef]
- Juggins, S. Rioja: Analysis of Quaternary Science Data (Version 1.0-5). 2022. Available online: https://cran.r-project.org/package=rioja (accessed on 19 December 2024).
- Chen, Y.; Tong, M.S.; Mittra, R. Efficient and accurate finite-difference time-domain analysis of resonant structures using the Blackman–Harris window function. Microw. Opt. Technol. Lett. 1997, 15, 389–392. [Google Scholar] [CrossRef]
- Thomson, D.J. Spectrum estimation and harmonic analysis. Proc. IEEE 1982, 70, 1055–1096. [Google Scholar] [CrossRef]
- Schulz, M.; Mudelsee, M. REDFIT: Estimating red-noise spectra directly from unevenly spaced paleoclimatic time series. Comput. Geosci. 2002, 28, 421–426. [Google Scholar] [CrossRef]
- Husson, D.; Thibault, N.; Galbrun, B.; Gardin, S.; Minoletti, F.; Sageman, B.; Huret, E. Lower Maastrichtian cyclostratigraphy of the Bidart section (Basque Country, SW France): A remarkable record of precessional forcing. Palaeogeogr. Palaeoclimatol. Palaeoecol. 2014, 395, 176–197. [Google Scholar] [CrossRef]
- Torrence, C.; Compo, G.P. A practical guide to wavelet analysis. Bull. Am. Meteorol. Soc. 1998, 79, 61–78. [Google Scholar] [CrossRef]
- Grinsted, A.; Moore, J.C.; Jevrejeva, S. Application of the cross wavelet transform and wavelet coherence to geophysical time series. Nonlinear Process. Geophys. 2004, 11, 561–566. [Google Scholar] [CrossRef]
- Gushulak, C.A.; Reinhardt, E.G.; Cumming, B.F. Climate driven declines in terrestrial input over the middle and late Holocene of perched boreal lakes in northeast Ontario (Canada) and teleconnections to the North Atlantic. Quat. Sci. Rev. 2021, 265, 107056. [Google Scholar] [CrossRef]
- Spence, C.; Woo, M.K. Hydrology of the northwestern subarctic Canadian Shield. In Cold Region Atmospheric and Hydrologic Studies. The Mackenzie GEWEX Experience: Volume 2: Hydrologic Processes; Springer: Berlin/Heidelberg, Germany, 2008; pp. 235–256. [Google Scholar]
- Macumber, A.L.; Patterson, R.T.; Galloway, J.M.; Falck, H.; Swindles, G.T. Reconstruction of Holocene hydroclimatic variability in subarctic treeline lakes using lake sediment grain-size end-members. Holocene 2018, 28, 845–857. [Google Scholar] [CrossRef]
- Cockburn, J.M.; Lamoureux, S.F. Hydroclimate controls over seasonal sediment yield in two adjacent High Arctic watersheds. Hydrol. Process. Int. J. 2008, 22, 2013–2027. [Google Scholar] [CrossRef]
- Shi, D. Late Holocene Paleoclimate Reconstruction in Debauchery Bay, Northwest Territories Canada Using Particle Size Analysis and Geochemical Proxies. Master’s Thesis, Carleton University, Ottawa, ON, USA, 2024. [Google Scholar]
- Whitfield, P.H.; Moore, R.; Fleming, S.W.; Zawadzki, A. Pacific decadal oscillation and the hydroclimatology of western Canada—Review and prospects. Can. Water Resour. J. 2010, 35, 1–28. [Google Scholar] [CrossRef]
- Newton, B.W.; Prowse, T.D.; Bonsal, B.R. Evaluating the distribution of water resources in western Canada using synoptic climatology and selected teleconnections. Part 1: Winter season. Hydrol. Process. 2014, 28, 4219–4234. [Google Scholar] [CrossRef]
- Bevington, A.R.; Gleason, H.E.; Foord, V.N.; Floyd, W.C.; Griesbauer, H.P. Regional influence of ocean–atmosphere teleconnections on the timing and duration of MODIS-derived snow cover in British Columbia, Canada. Cryosphere 2019, 13, 2693–2712. [Google Scholar] [CrossRef]
- RahimiMovaghar, M.; Fereshtehpour, M.; Najafi, M.R. Spatiotemporal pattern of successive hydro-hazards and the influence of low-frequency variability modes over Canada. J. Hydrol. 2024, 634, 131057. [Google Scholar] [CrossRef]
- Mantua, N.J.; Hare, S.R. The Pacific decadal oscillation. J. Oceanogr. 2002, 58, 35–44. [Google Scholar] [CrossRef]
- MacDonald, G.M.; Case, R.A. Variations in the Pacific Decadal Oscillation over the past millennium. Geophys. Res. Lett. 2005, 32, L08703. [Google Scholar] [CrossRef]
- Beebee, R.A.; Manga, M. Variation in the Relationship Between Snowmelt Runoff in Oregon and ENSO and PDO. J. Am. Water Resour. Assoc. 2004, 40, 1011–1024. [Google Scholar] [CrossRef]
- Ma, L.; Yin, Z. Possible solar modulation of pacific decadal oscillation. Sol. Syst. Res. 2017, 51, 417–421. [Google Scholar] [CrossRef]
- Tamaddun, K.A.; Kalra, A.; Ahmad, S. Wavelet analyses of western US streamflow with ENSO and PDO. J. Water Clim. Chang. 2017, 8, 26–39. [Google Scholar] [CrossRef]
- Gurrapu, S.; St-Jacques, J.M.; Sauchyn, D.J.; Hodder, K.R. The influence of the Pacific Decadal Oscillation on annual floods in the rivers of Western Canada. J. Am. Water Resour. Assoc. 2016, 52, 1031–1045. [Google Scholar] [CrossRef]
- Nalley, D.; Adamowski, J.; Biswas, A.; Gharabaghi, B.; Hu, W. A multiscale and multivariate analysis of precipitation and streamflow variability in relation to ENSO, NAO and PDO. J. Hydrol. 2019, 574, 288–307. [Google Scholar] [CrossRef]
- Deser, C.; Phillips, A.S.; Hurrell, J.W. Pacific interdecadal climate variability: Linkages between the tropics and the North Pacific during boreal winter since 1900. J. Clim. 2004, 17, 3109–3124. [Google Scholar] [CrossRef]
- Deser, C.; Trenberth, K.E.; National Center for Atmospheric Research Staff (NCAR) (Eds.) The Climate Data Guide: Pacific Decadal Oscillation (PDO): Definition and Indices. 2022. Available online: https://climatedataguide.ucar.edu/climate-data/pacific-decadal-oscillation-pdo-definition-and-indices (accessed on 30 July 2023).
- Xiao, D.; Ren, H.L. A regime shift in North Pacific annual mean sea surface temperature in 2013/14. Front. Earth Sci. 2023, 10, 987349. [Google Scholar] [CrossRef]
- Patterson, R.T.; Chang, A.S.; Prokoph, A.; Roe, H.M.; Swindles, G.T. Influence of the Pacific Decadal Oscillation, El Niño-Southern Oscillation and solar forcing on climate and primary productivity changes in the northeast Pacific. Quat. Int. 2013, 310, 124–139. [Google Scholar] [CrossRef]
- Czajkowski, J.; Simmons, K.; Sutter, D. An analysis of coastal and inland fatalities in landfalling US hurricanes. Nat. Hazards 2011, 59, 1513–1531. [Google Scholar] [CrossRef]
- Stockwell, J.D.; Doubek, J.P.; Adrian, R.; Anneville, O.; Carey, C.C.; Carvalho, L.; De Senerpont Domis, L.N.; Dur, G.; Frassl, M.A.; Grossart, H.P.; et al. Storm impacts on phytoplankton community dynamics in lakes. Glob. Change Biol. 2020, 26, 2756–2784. [Google Scholar] [CrossRef]
- Hampton, S.E.; Sharma, S.; Brousil, M.R.; Filazzola, A. Winter and summer storms modify chlorophyll relationships with nutrients in seasonally ice-covered lakes. Ecosphere 2022, 13, e4272. [Google Scholar] [CrossRef]
- Xiao, J.; Chang, Z.; Fan, J.; Zhou, L.; Zhai, D.; Wen, R.; Qin, X. The link between grain-size components and depositional processes in a modern clastic lake. Sedimentology 2012, 59, 1050–1062. [Google Scholar] [CrossRef]
- Froese, R. Better Water Coming to Atikameg; South Peace News: High Prairie, AB, Canada, 2016. [Google Scholar]
- Holmer, M.; Storkholm, P. Sulphate reduction and sulphur cycling in lake sediments: A review. Freshw. Biol. 2001, 46, 431–451. [Google Scholar] [CrossRef]
- Kerekes, J.J.; Blouin, A.C.; Beauchamp, S.T. Trophic response to phosphorus in acidic and non-acidic lakes in Nova Scotia, Canada. Hydrobiologia 1990, 191, 105–110. [Google Scholar] [CrossRef]
- Correll, D.L. The role of phosphorus in the eutrophication of receiving waters: A review. J. Environ. Qual. 1998, 27, 261–266. [Google Scholar] [CrossRef]
- Johnson, T.C.; Brown, E.T.; McManus, J.; Barry, S.; Barker, P.; Gasse, F. A high-resolution paleoclimate record spanning the past 25,000 years in southern East Africa. Science 2002, 296, 113–132. [Google Scholar] [CrossRef]
- Johnson, T.C.; Brown, E.T.; Shi, J. Biogenic silica deposition in Lake Malawi, East Africa over the past 150,000 years. Palaeogeogr. Palaeoclimatol. Palaeoecol. 2011, 303, 103–109. [Google Scholar] [CrossRef]
- Department of Fisheries and Oceans. Annual Summary of Fish Harvesting Activities; Department of Fisheries and Oceans: Winnipeg, MB, Canada, 2010; Volume 25, Xiii + 88p. [Google Scholar]
- Government of Alberta. Utikumasis Lake Fisheries Management Objectives; Technical Report; Government of Alberta: Edmonton, AB, Canada, 2018. [Google Scholar]
- Government of Alberta. Utikuma Lake FIN Summary; Technical Report; Government of Alberta: Edmonton, AB, Canada, 2019. [Google Scholar]
- Walsh, C.R.; Patterson, R.T.; Ralchenko, M.; Patterson, C.W.; Reinhardt, E.G. A 140-Year Paleolimnological Record of Climatically and Anthropogenically Driven Eutrophication in Utikuma Lake, Alberta, Canada; [Dataset], Dryad; Carleton University: Ottawa, ON, Canada, 2024. [Google Scholar] [CrossRef]
- Hurrell, J.; National Center for Atmospheric Research Staff (NCAR) (Eds.) The Climate Data Guide: Hurrell North Atlantic Oscillation (NAO) Index (Station-Based). 2022. Available online: https://climatedataguide.ucar.edu/climate-data/hurrell-north-atlantic-oscillation-nao-index-station-based (accessed on 30 July 2023).
- National Center for Atmospheric Research Staff (NCAR) (Ed.) The Climate Data Guide: Hurrell Wintertime SLP-Based Northern Annular Mode (NAM) Index. 2022. Available online: https://climatedataguide.ucar.edu/climate-data/hurrell-wintertime-slp-based-northern-annular-mode-nam-index (accessed on 30 July 2023).
- Trenberth, K.E.; National Center for Atmospheric Research Staff (NCAR) (Eds.) The Climate Data Guide: Nino SST Indices (Nino 1+2, 3, 3.4, 4; ONI and TNI). 2022. Available online: https://climatedataguide.ucar.edu/climate-data/nino-sst-indices-nino-12-3-34-4-oni-and-tni (accessed on 30 July 2023).


| Utikuma Lake | ||
|---|---|---|
| Date Collected: | 16 June 2022 | |
| Sampling Location: | 55.86914508, −115.42383901 | |
| Sampling Depth (m): | 4.5 | |
| Core ID | Core Length (mm) | Sampling Resolution (mm) |
| BU1 | 459 | 1 |
| BU2 | 355 | 1 |
| BU3 | 345 | 5 |
| BU4 | 370 | 5 |
| Utikuma Lake (BU4) | |||||
|---|---|---|---|---|---|
| Depth (mm) | 210Pb Total Activity (Bq/kg) | 210Pb Activity Error (Bq/kg) | Age (Years BP) | Age Error (Years) | Average Date of Deposition (Years AD) |
| 0-5 | 330.26 | 44.84 | 1.97 | 0.34 | 2020.48 |
| 20–25 | 238.41 | 29.81 | 5.52 | 0.64 | 2016.94 |
| 40–45 | 296.85 | 34.72 | 10.22 | 1.08 | 2012.23 |
| 60–65 | 264.15 | 31.26 | 18.49 | 1.74 | 2003.97 |
| 80–85 | 217.27 | 31.66 | 29.62 | 2.65 | 1992.83 |
| 100–105 | 224.98 | 33.73 | 42.35 | 3.74 | 1980.10 |
| 130–135 | 181.13 | 31.75 | 57.28 | 5.51 | 1965.17 |
| 150–155 | 141.47 | 31.44 | 80.32 | 9.01 | 1942.14 |
| 180–185 | 109.95 | 33.83 | 121.20 | 14.39 | 1901.25 |
| Element or Elemental Ratio | Proxy for: | References |
|---|---|---|
| Ti | Terrigenous/detrital sediment; runoff | [28] |
| Fe | Terrigenous/detrital sediment; runoff | [28] |
| K/Rb | Detrital clay | [22] |
| Ca/Sr | Detrital carbonate | [28] |
| P | Primary productivity | [11] |
| S | Organics; Organic matter decay | [22,27] |
| Si/Ti | Biogenic silica content | [28] |
| Utikuma Lake (BU1) | ||
|---|---|---|
| CONISS Group | Date Range (Years A.D.) | Depth (mm) |
| Zone 1 | pre-1950 | 144–200 |
| Zone 2 | 1950–1973 | 115–144 |
| Zone 3 | 1973–1996 | 79–115 |
| Zone 4 | 1996–2017 | 18–79 |
| Zone 5 | 2017–present | 0–18 |
Disclaimer/Publisher’s Note: The statements, opinions and data contained in all publications are solely those of the individual author(s) and contributor(s) and not of MDPI and/or the editor(s). MDPI and/or the editor(s) disclaim responsibility for any injury to people or property resulting from any ideas, methods, instructions or products referred to in the content. |
© 2025 by the authors. Licensee MDPI, Basel, Switzerland. This article is an open access article distributed under the terms and conditions of the Creative Commons Attribution (CC BY) license (https://creativecommons.org/licenses/by/4.0/).
Share and Cite
Walsh, C.R.; Grey, F.; Patterson, R.T.; Ralchenko, M.; Patterson, C.W.; Reinhardt, E.G.; Grey, D.; Grey, H.; Thunder, D. Late 20th Century Hypereutrophication of Northern Alberta’s Utikuma Lake. Environments 2025, 12, 63. https://doi.org/10.3390/environments12020063
Walsh CR, Grey F, Patterson RT, Ralchenko M, Patterson CW, Reinhardt EG, Grey D, Grey H, Thunder D. Late 20th Century Hypereutrophication of Northern Alberta’s Utikuma Lake. Environments. 2025; 12(2):63. https://doi.org/10.3390/environments12020063
Chicago/Turabian StyleWalsh, Carling R., Fabian Grey, R. Timothy Patterson, Maxim Ralchenko, Calder W. Patterson, Eduard G. Reinhardt, Dennis Grey, Henry Grey, and Dwayne Thunder. 2025. "Late 20th Century Hypereutrophication of Northern Alberta’s Utikuma Lake" Environments 12, no. 2: 63. https://doi.org/10.3390/environments12020063
APA StyleWalsh, C. R., Grey, F., Patterson, R. T., Ralchenko, M., Patterson, C. W., Reinhardt, E. G., Grey, D., Grey, H., & Thunder, D. (2025). Late 20th Century Hypereutrophication of Northern Alberta’s Utikuma Lake. Environments, 12(2), 63. https://doi.org/10.3390/environments12020063