
Ecosystem-Model-Based Valuation of Ecosystem Services in a Baltic Lagoon: Long-Term Human Technical Interventions and Short-Term Variability


Abstract
1. Introduction
2. Study Site and Methods
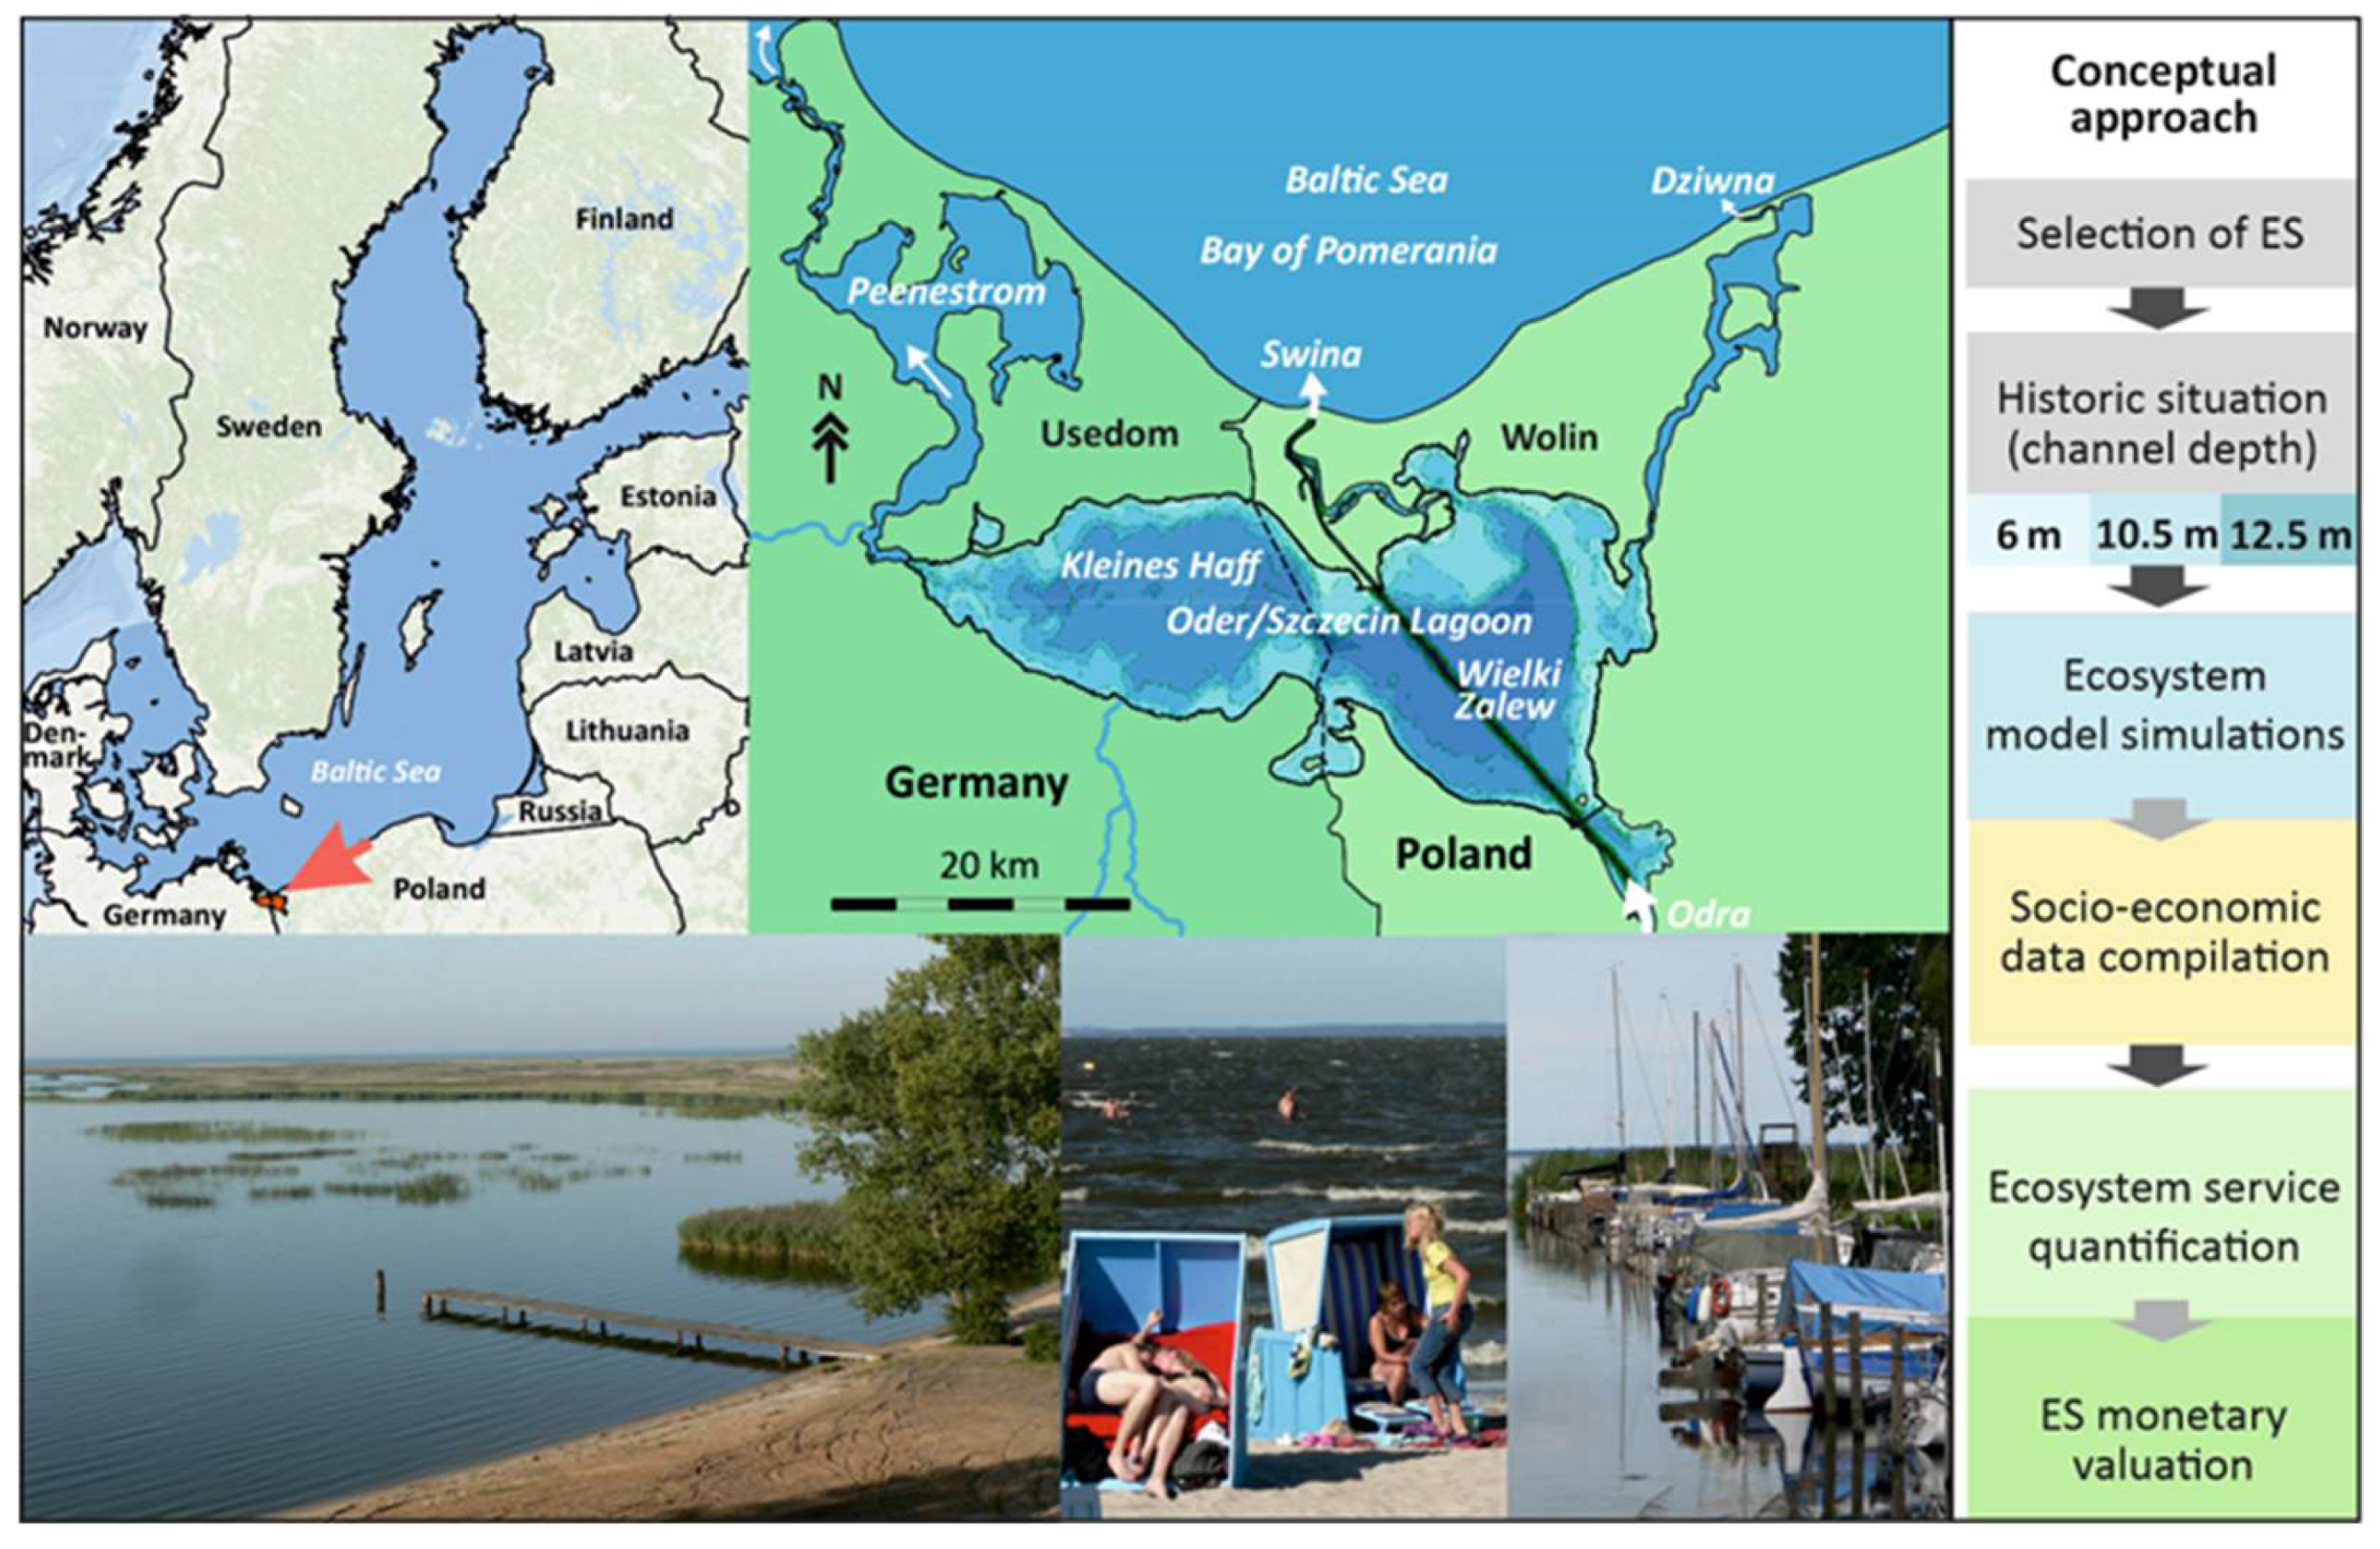
2.1. Oder/Szczecin Lagoon
2.2. Human Interventions—The Navigation Waterway Across the Lagoon
2.3. The 3D Ecosystem Model
2.4. Model Simulations and Scenarios
2.5. Socio-Economic Data Collection
2.6. Ecosystem Service and Assessment Approach
2.7. Provisioning Ecosystem Services
2.8. Cultural Ecosystem Services
2.9. Regulating Ecosystem Services
3. Results
3.1. Model Simulation Data—20-Year Averages
3.2. Socio-Economic Data
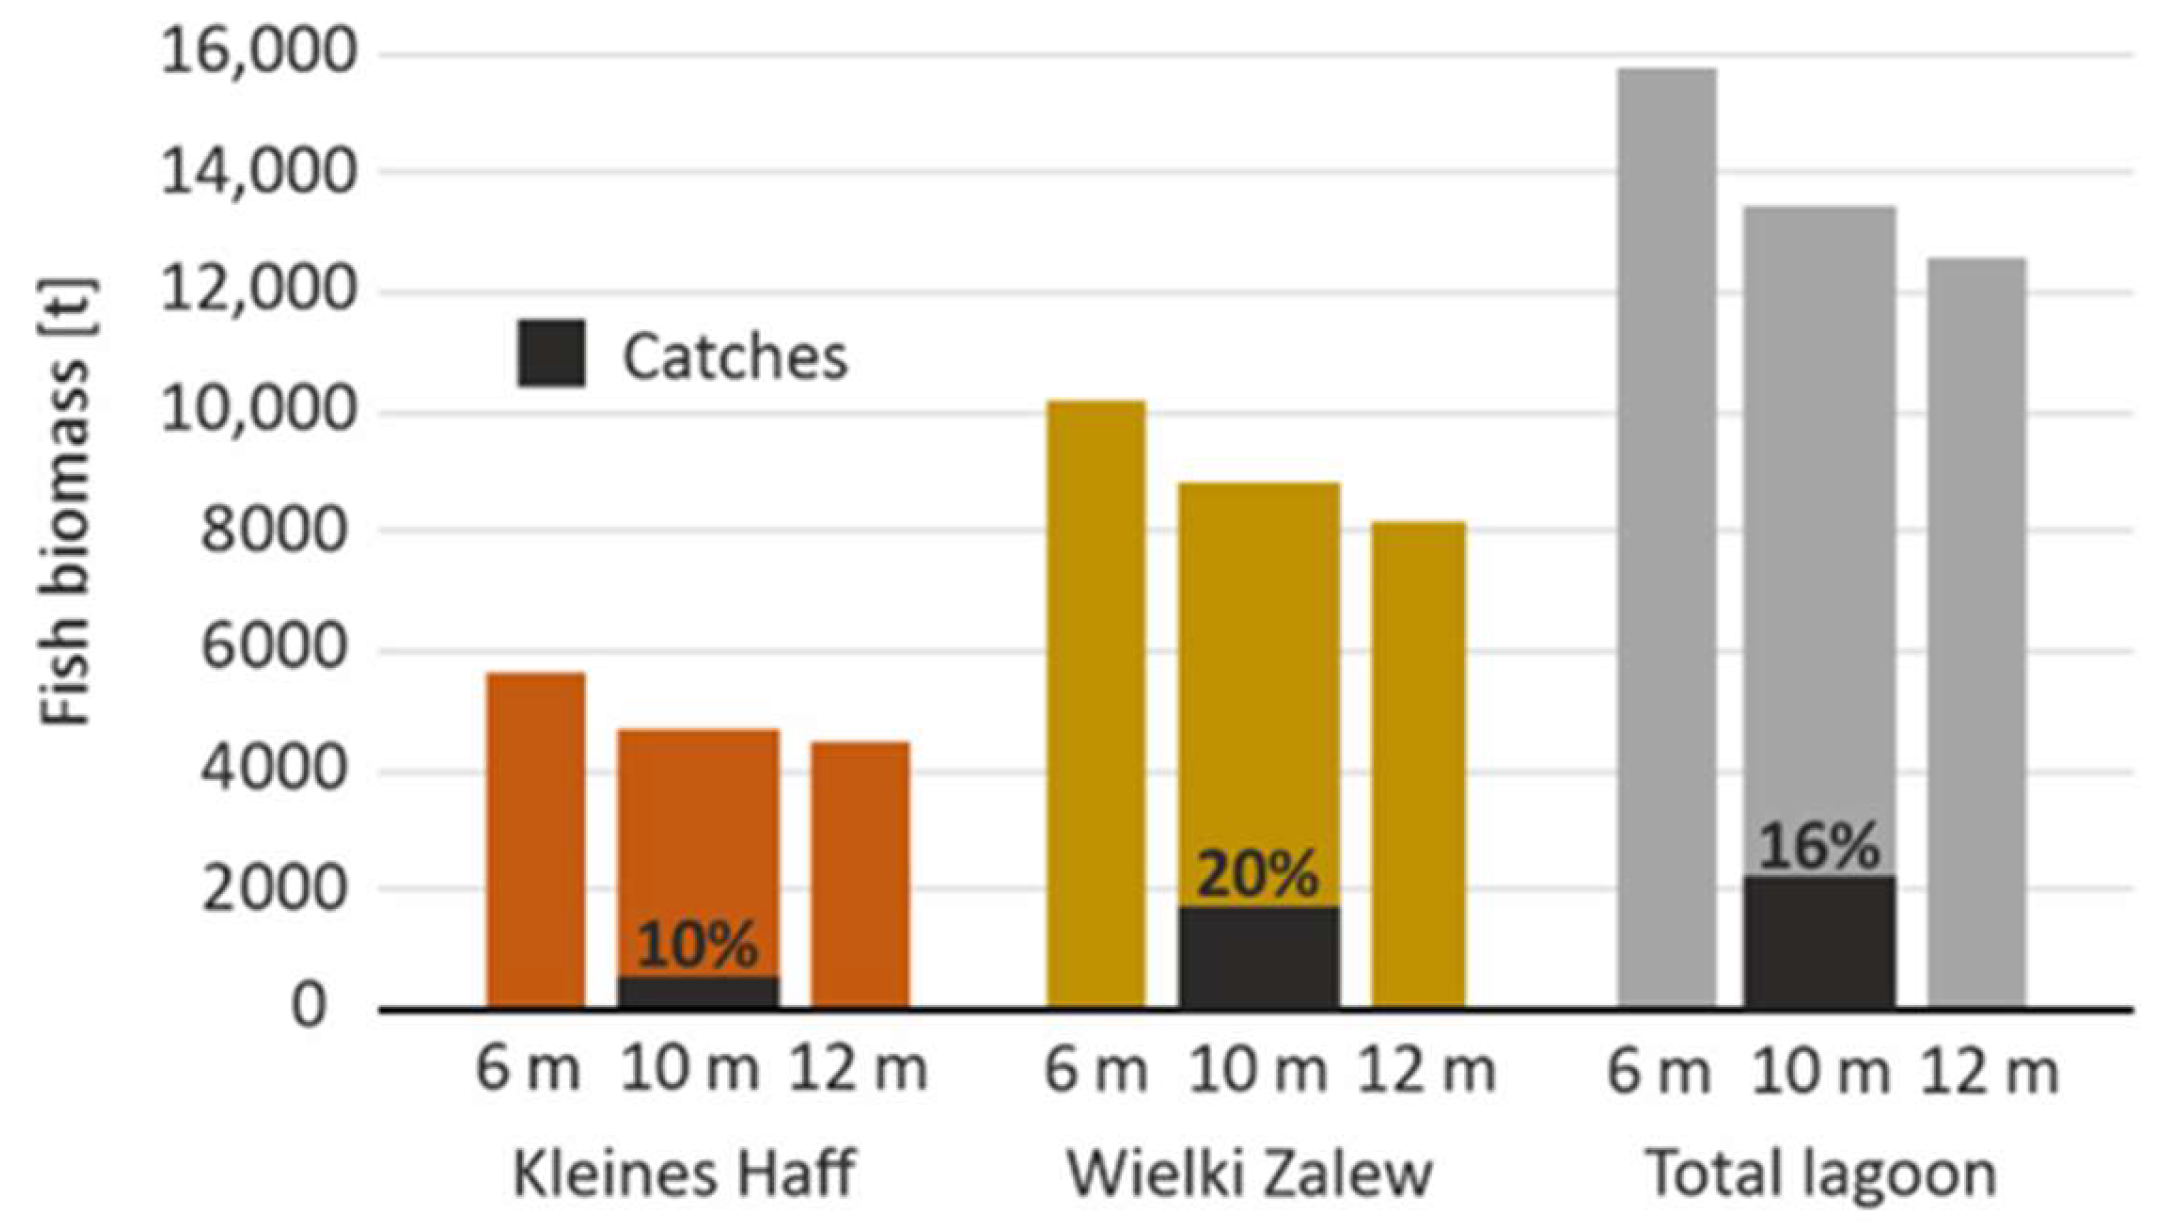
3.3. Provisioning Ecosystem Services—Wild Fish and Plants
3.4. Provisioning Ecosystem Services—Transportation
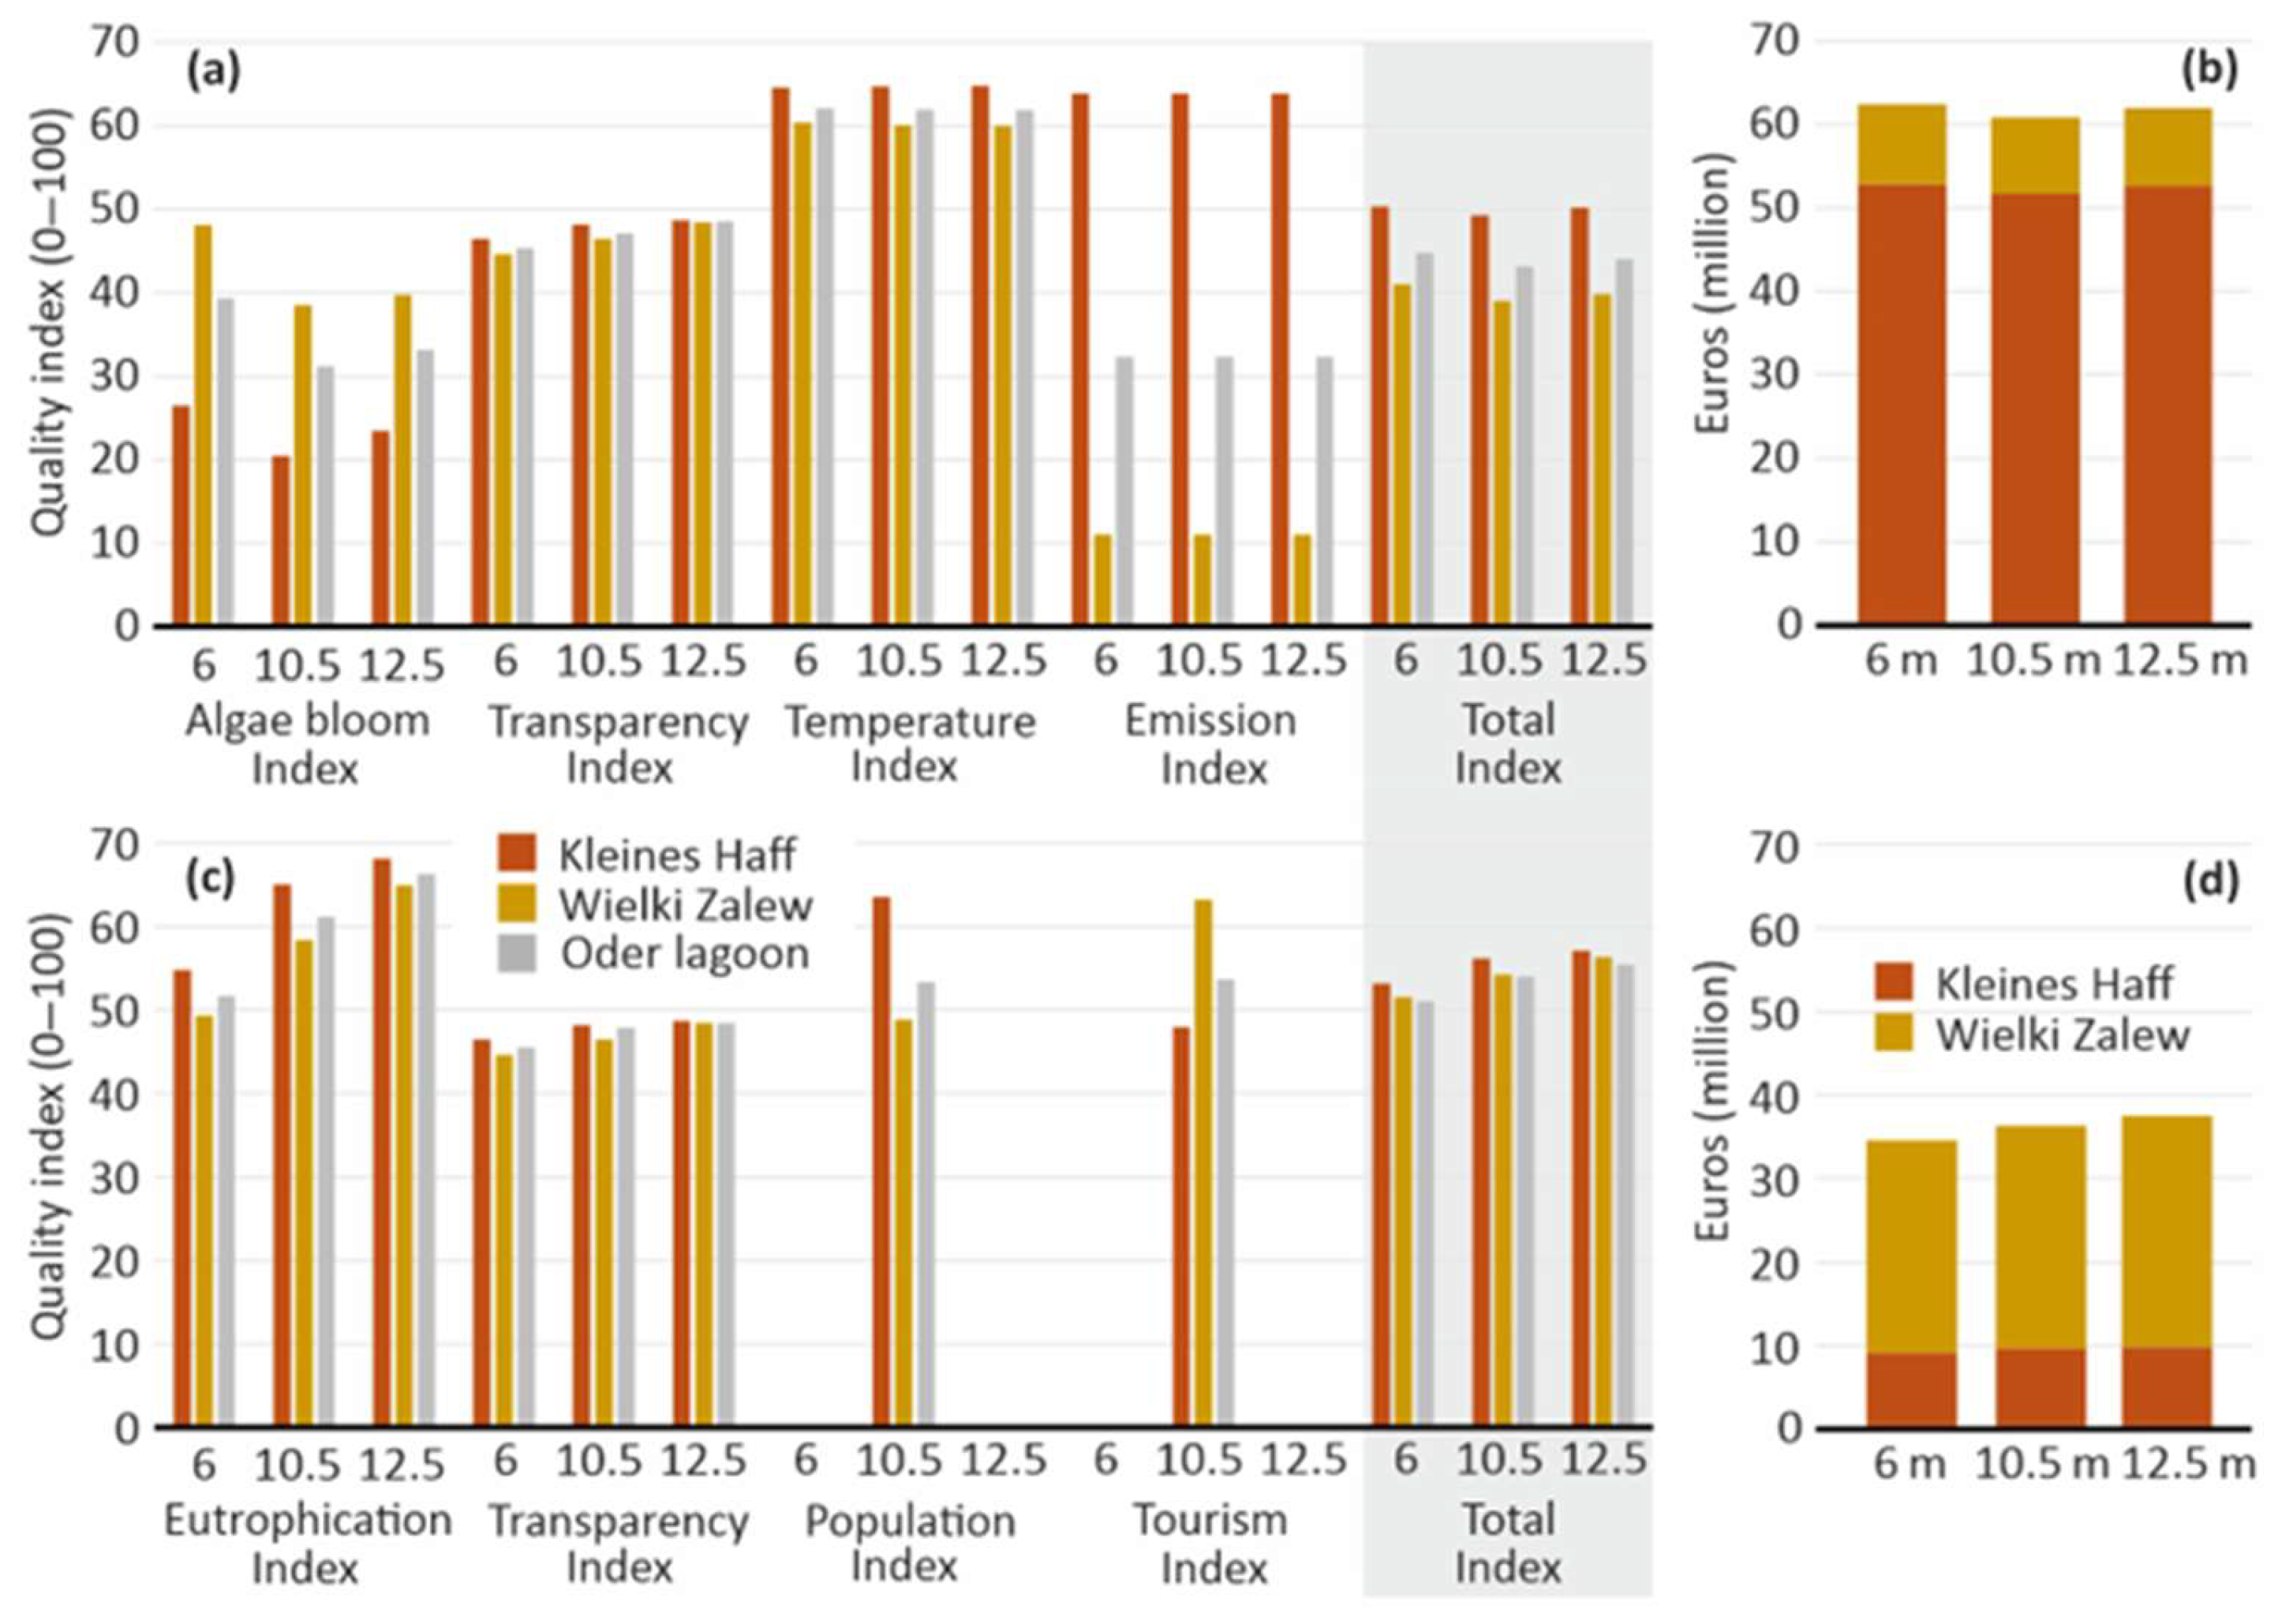
3.5. Cultural Ecosystem Services—Tourism, Recreation, and Aesthetics
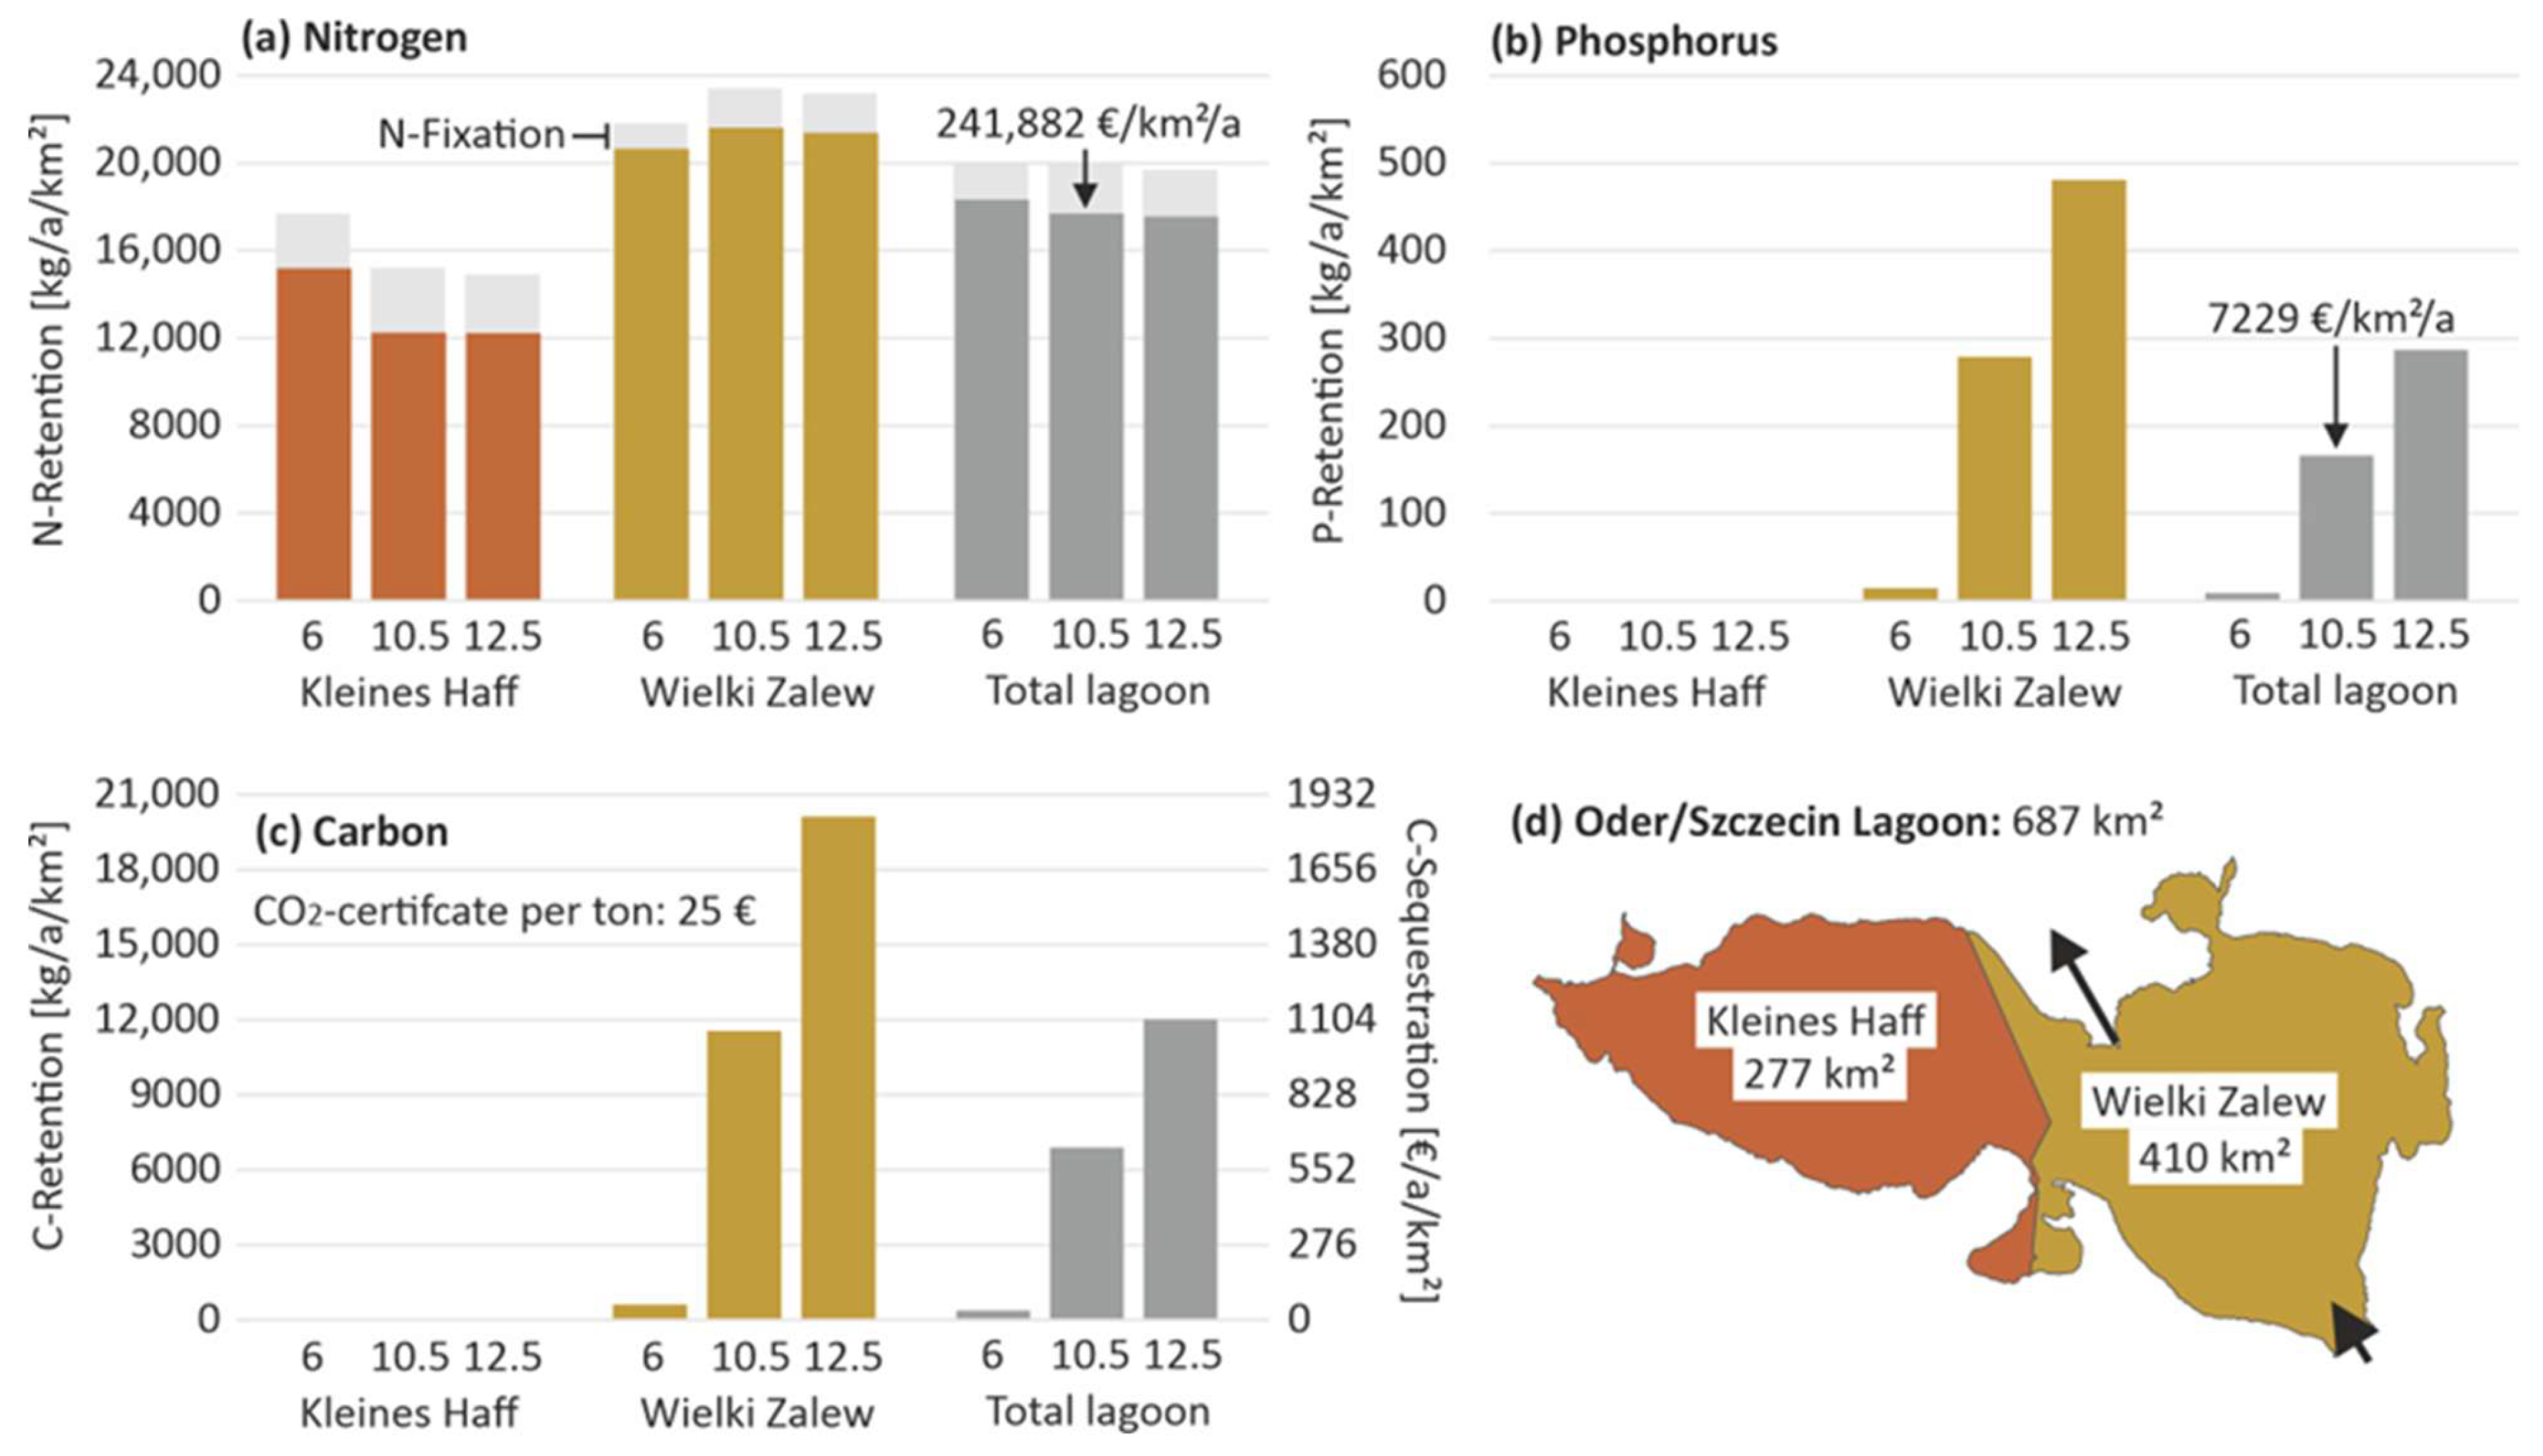
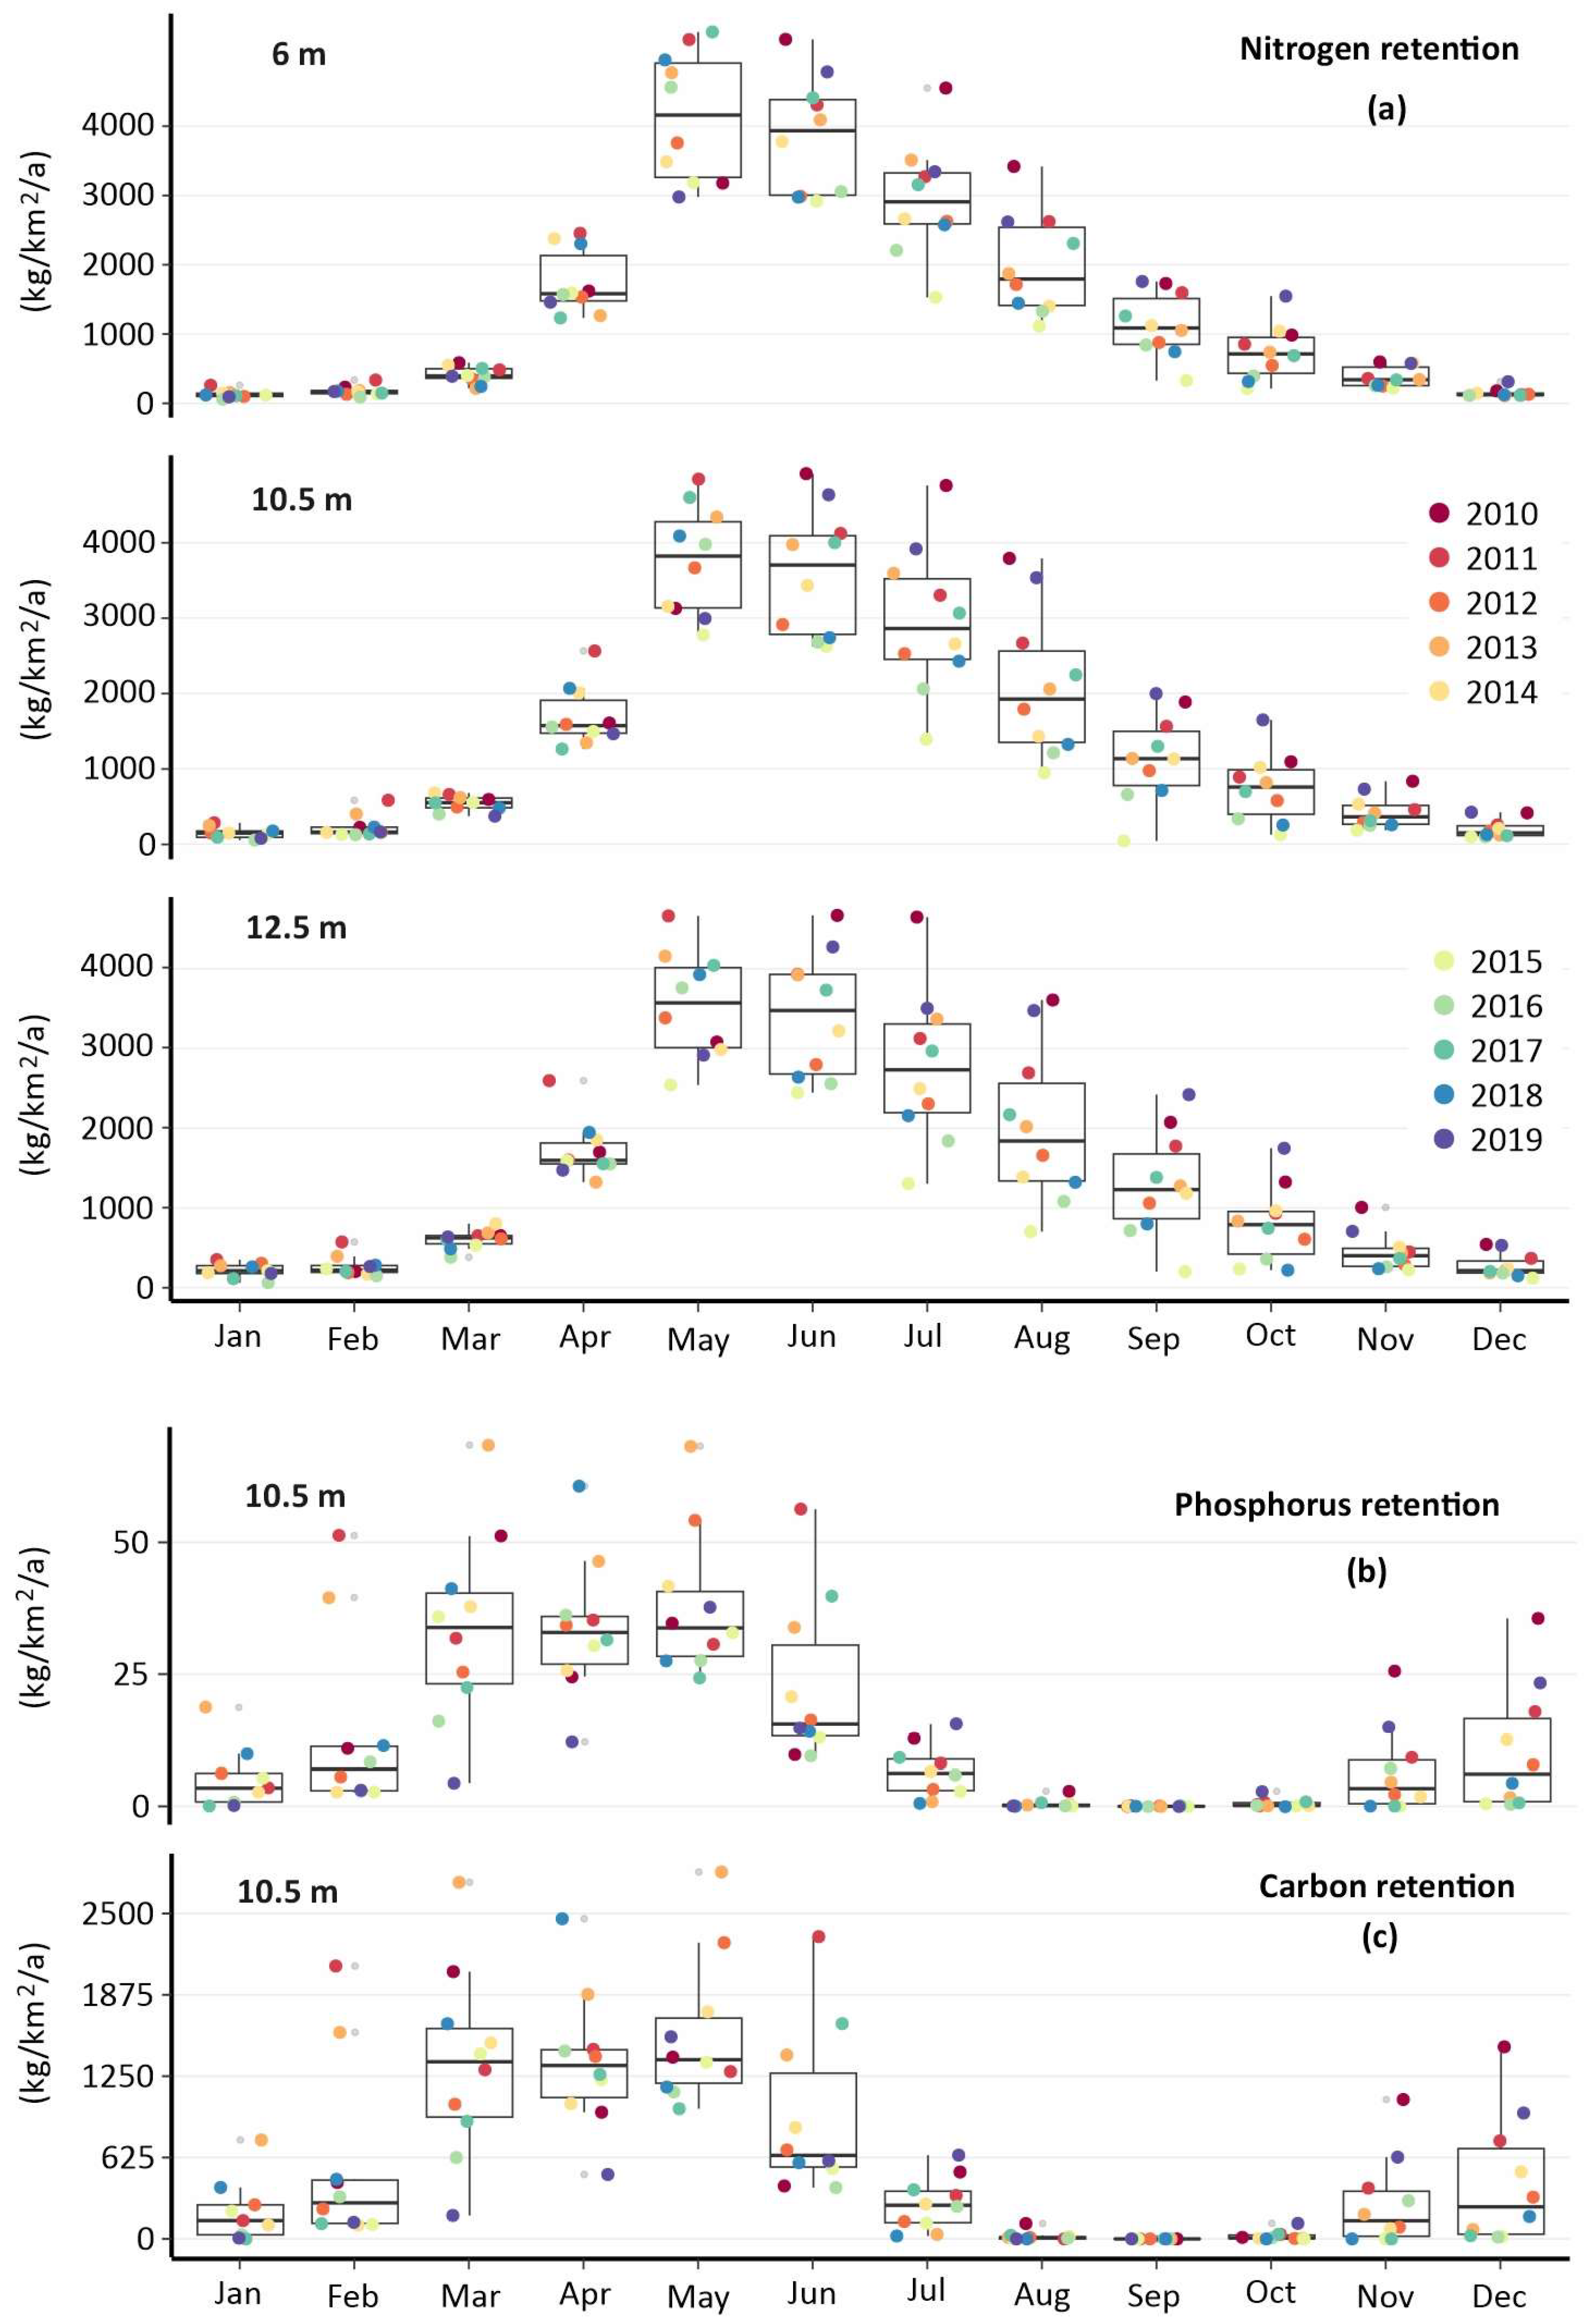
3.6. Regulating Ecosystem Services—Nutrient and Carbon Retention
3.7. Regulating Ecosystem Services—Inter-Annual Variability
3.8. Regulating Ecosystem Services—Seasonality and the Role of Extreme Events
3.9. Synthesis
4. Discussion
4.1. Critical Evaluation of Approach and Quantifications
4.2. Monetarization of Ecosystem Services
4.3. Consequences of Temporal Variabilities
4.4. Relevance, Transferability, and Research Needs
5. Conclusions
Author Contributions
Funding
Data Availability Statement
Acknowledgments
Conflicts of Interest
Appendix A
| Provisioning services | |||||||||||
| Oder Lagoon | Surface area | Coast-line | Wild fish catches | Wild fish biomass | Transportation | ||||||
| (km2) | (km) | (kg wet weight/km2) | (kg wet weight/km2) | ||||||||
| 6 m | 10.5 m | 12.5 m | 6 m | 10.5 m | 12.5 m | 6 m | 10.5 m | 12.5 m | |||
| Kleines Haff | 277 | 89 | 2071 | 1726 | 1647 | 20,358 | 16,965 | 16,186 | |||
| Wielki Zalew | 410 | 120 | 5037 | 4373 | 4031 | 24,910 | 21,624 | 19,933 | |||
| Total lagoon | 687 | 209 | 3861 | 3305 | 3086 | 22,952 | 19,647 | 18,343 | |||
| Regulating services | |||||||||||
| Oder Lagoon | Surface area | Coast-line | Water quality regulation-nitrogen | Water quality regulation-phosphorus | Climate regulation-carbon sequestation | ||||||
| (km2) | (km) | (kg/a/km2) | (kg/a/km2) | (kg/a/km2) | |||||||
| 6 m | 10.5 m | 12.5 m | 6 m | 10.5 m | 12.5 m | 6 m | 10.5 m | 12.5 m | |||
| Kleines Haff | 277 | 89 | 15,199 | 12,249 | 12,229 | 0 | 0 | 0 | 9 | 1 | 0 |
| Wielki Zalew | 410 | 120 | 20,653 | 21,608 | 21,371 | 15 | 279 | 481 | 616 | 11,561 | 20,132 |
| Total lagoon | 687 | 209 | 18,341 | 17,695 | 17,551 | 9 | 166 | 287 | 371 | 6900 | 12,015 |
| Cultural services | |||||||||||
| Oder Lagoon | Surface area | Coast-line | Active recreation-quality index | Landscape aesthetics-quality index | |||||||
| (km2) | (km) | Index (0–100) | Index (0–100) | ||||||||
| 6 m | 10.5 m | 12.5 m | 6 m | 10.5 m | 12.5 m | ||||||
| Kleines Haff | 277 | 89 | 50.3 | 49.3 | 50.2 | 53.2 | 56.2 | 57.1 | |||
| Wielki Zalew | 410 | 120 | 41.0 | 39.0 | 39.8 | 51.5 | 54.2 | 56.4 | |||
| Total lagoon | 687 | 209 | 44.8 | 43.2 | 44.0 | 51.1 | 54.0 | 55.5 | |||
Appendix B
| Provisioning services | |||||||||||
| Oder Lagoon | Surface area | Coast-line | Wild fish catches | Transportation | |||||||
| (km2) | (km) | (EUR/a) | (EUR/a) | ||||||||
| 6 m | 10.5 m | 12.5 m | 6 m | 10.5 m | 12.5 m | ||||||
| Kleines Haff | 277 | 89 | 1,088,718 | 907,286 | 865,627 | 1,605,208 | |||||
| Wielki Zalew | 410 | 120 | 2,609,629 | 2,265,407 | 2,088,212 | 30,498,958 | |||||
| Total lagoon | 687 | 209 | 3,698,347 | 3,172,693 | 2,953,839 | 32,104,167 | |||||
| Provisioning services | |||||||||||
| Oder Lagoon | Surface area | Coast-line | Wild fish catches | Transportation | |||||||
| (km2) | (km) | (EUR/km2/a) | (EUR/a/km2) | ||||||||
| 6 m | 10.5 m | 12.5 m | 6 m | 10.5 m | 12.5 m | ||||||
| Kleines Haff | 277 | 89 | 3930 | 3275 | 3125 | 5795 | |||||
| Wielki Zalew | 410 | 120 | 6365 | 5525 | 5093 | 74,388 | |||||
| Total lagoon | 687 | 209 | 5383 | 4618 | 4300 | 46,731 | |||||
| Regulating services | |||||||||||
| Oder Lagoon | Surface area | Coast-line | Water quality regulation–nitrogen | Water quality regulation–phosphorus | Carbon sequestration | ||||||
| (km2) | (km) | (EUR/a) | (EUR/a) | (EUR/a) | |||||||
| 6 m | 10.5 m | 12.5 m | 6 m | 10.5 m | 12.5 m | 6 m | 10.5 m | 12.5 m | |||
| Kleines Haff | 277 | 89 | 66,601,728 | 53,676,079 | 53,587,648 | 0 | 0 | 0 | 229 | 17 | 10 |
| Wielki Zalew | 410 | 120 | 107,352,392 | 112,320,539 | 111,088,233 | 266,946 | 4,939,794 | 8,521,102 | 23,164 | 434,500 | 756,641 |
| Total lagoon | 687 | 209 | 174,001,191 | 166,173,006 | 164,846,359 | 268,378 | 4,966,300 | 8,566,825 | 23,342 | 434,517 | 756,651 |
| Regulating services | |||||||||||
| Oder Lagoon | Surface area | Coast-line | Water quality regulation–nitrogen | Water quality regulation–phosphorus | Carbon sequestration | ||||||
| (km2) | (km) | (EUR/a/km2) | (EUR/a/km2) | (EUR/a/km2) | |||||||
| 6 m | 10.5 m | 12.5 m | 6 m | 10.5 m | 12.5 m | 6 m | 10.5 m | 12.5 m | |||
| Kleines Haff | 277 | 89 | 240,439 | 193,776 | 193,457 | 0 | 0 | 0 | 1 | 0 | 0 |
| Wielki Zalew | 410 | 120 | 261,835 | 273,953 | 270,947 | 651 | 12,048 | 20,783 | 56 | 1060 | 1845 |
| Total lagoon | 687 | 209 | 253,277 | 241,882 | 239,951 | 391 | 7229 | 12,470 | 34 | 632 | 1101 |
| Cultural services | |||||||||||
| Oder Lagoon | Surface area | Coast-line | Active recreation-quality index | Landscape aesthetics-quality index | |||||||
| (km2) | (km) | (EUR/a) | (EUR/a) | ||||||||
| 6 m | 10.5 m | 12.5 m | 6 m | 10.5 m | 12.5 m | ||||||
| Kleines Haff | 277 | 89 | 52,825,238 | 51,724,004 | 52,678,264 | 9,386,207 | 9,915,370 | 10,075,479 | |||
| Wielki Zalew | 410 | 120 | 9,576,697 | 9,105,768 | 9,290,863 | 25,211,951 | 26,531,460 | 27,581,335 | |||
| Total lagoon | 687 | 209 | 62,401,934 | 60,829,772 | 61,969,126 | 34,598,159 | 36,446,830 | 37,656,814 | |||
| Cultural services | |||||||||||
| Oder Lagoon | Surface area | Coast-line | Active recreation-quality index | Landscape aesthetics-quality index | |||||||
| (km2) | (km) | (EUR/a/km2) | (EUR/a/km2) | ||||||||
| 6 m | 10.5 m | 12.5 m | 6 m | 10.5 m | 12.5 m | ||||||
| Kleines Haff | 277 | 89 | 190,705 | 186,729 | 190,174 | 33,885 | 35,796 | 36,374 | |||
| Wielki Zalew | 410 | 120 | 23,358 | 22,209 | 22,661 | 61,493 | 64,711 | 67,272 | |||
| Total lagoon | 687 | 209 | 90,833 | 88,544 | 90,203 | 50,361 | 53,052 | 54,813 | |||
References
- Wolnomiejski, N.; Witek, Z. The Szczecin Lagoon Ecosystem; De Gruyter Open Poland: Berlin, Germany, 2013. [Google Scholar] [CrossRef]
- Bielecka, M.; Różyński, G. Management conflicts in the Vistula Lagoon area. Ocean. Coast. Manag. 2014, 101, 24–34. [Google Scholar] [CrossRef]
- Schernewski, G.; Baltranaitė, E.; Kataržytė, M.; Balčiūnas, A.; Čerkasova, N.; Mėžinė, J. Establishing new bathing sites at the Curonian Lagoon coast: An ecological-social-economic assessment. J. Coast. Conserv. 2019, 23, 899–911. [Google Scholar] [CrossRef]
- Marcinkevičiūtė, L.; Pranskūnienė, R.; Makutėnienė, D. Opportunities for Ecosystem Services in the Protected Areas in the Coastal–Rural Area of the Nemunas Delta and the Curonian Lagoon (Lithuania). Sustainability 2022, 14, 9647. [Google Scholar] [CrossRef]
- Schernewski, G.; Friedland, R.; Buer, A.-L.; Dahlke, S.; Drews, B.; Höft, S.; Klumpe, T.; Schadach, M.; Schumacher, J.; Zaiko, A. Ecological-social-economic assessment of zebra-mussel cultivation scenarios for the Oder (Szczecin) Lagoon. J. Coast. Conserv. 2019, 23, 913–929. [Google Scholar] [CrossRef]
- Różyński, G.; Bielecka, M.; Schönhofer, J. Application of Systems Approach Framework (SAF) to the Vistula Lagoon case in Poland. Ocean. Coast. Manag. 2019, 168, 90–102. [Google Scholar] [CrossRef]
- Cieśliński, R.; Chlost, I.; Szydłowski, M. Impact of new, navigable canal through the Vistula spit on the hydrologic balance of the Vistula lagoon (Baltic Sea). J. Mar. Syst. 2024, 241, 103908. [Google Scholar] [CrossRef]
- Stakėnienė, R.; Jokšas, K.; Kriaučiūnienė, J.; Jakimavičius, D.; Raudonytė-Svirbutavičienė, E. Nutrient Loadings and Exchange between the Curonian Lagoon and the Baltic Sea: Changes over the Past Two Decades (2001–2020). Water 2023, 15, 4096. [Google Scholar] [CrossRef]
- Chubarenko, B.V.; Zakirov, R.B. Water Exchange of Nontidal Estuarine Coastal Vistula Lagoon with the Baltic Sea. J. Waterw. Port Coast. Ocean Eng. 2021, 147, 4. [Google Scholar] [CrossRef]
- Reckermann, M.; Omstedt, A.; Soomere, T.; Aigars, J.; Akhtar, N.; Bełdowska, M.; Bełdowski, J.; Cronin, T.; Czub, M.; Eero, M.; et al. Human impacts and their interactions in the Baltic Sea region. Earth Syst. Dynam. 2022, 13, 1–80. [Google Scholar] [CrossRef]
- Meier, H.E.M.; Kniebusch, M.; Dieterich, C.; Gröger, M.; Zorita, E.; Elmgren, R.; Myrberg, K.; Ahola, M.P.; Bartosova, A.; Bonsdorff, E.; et al. Climate change in the Baltic Sea region: A summary. Earth Syst. Dynam. 2022, 13, 457–593. [Google Scholar] [CrossRef]
- Rutgersson, A.; Kjellström, E.; Haapala, J.; Stendel, M.; Danilovich, I.; Drews, M.; Jylhä, K.; Kujala, P.; Larsén, X.G.; Halsnæs, K.; et al. Natural hazards and extreme events in the Baltic Sea region. Earth Syst. Dynam. 2022, 13, 251–301. [Google Scholar] [CrossRef]
- World Resources Institute. Millennium Ecosystem Assessment. Ecosystems and Human Well-Being: Synthesis; Island Press: Washington, DC, USA, 2005; Available online: https://www.millenniumassessment.org/documents/document.356.aspx.pdf (accessed on 18. November 2024).
- European Commission. Commission Staff Working Document. EU Guidance on Integrating Ecosystems and Their Services into Decision-Making. SWD (2019) 305 Final. Part 2/3. Available online: https://data.consilium.europa.eu/doc/document/ST-11395-2019-ADD-1/en/pdf (accessed on 9 December 2024).
- Newton, A.; Brito, A.C.; Icely, J.D.; Derolez, V.; Clara, I.; Angus, S.; Schernewski, G.; Inácio, M.; Lillebø, A.I.; Sousa, A.I.; et al. Assessing, quantifying and valuing the ecosystem services of coastal lagoons. J. Nat. Conserv. 2018, 44, 50–65. [Google Scholar] [CrossRef]
- Maki Sy, M.; Rey-Valette, H.; Simier, M.; Pasqualini, V.; Figuières, C.; De Wit, R. Identifying Consensus on Coastal Lagoons Ecosystem Services and Conservation Priorities for an Effective Decision Making: A Q Approach. Ecol. Econ. 2018, 154, 1–13. [Google Scholar] [CrossRef]
- Pérez-Ruzafa, A.; Pérez-Ruzafa, I.M.; Newton, A.; Marcos, C. Coastal Lagoons: Environmental Variability, Ecosystem Complexity, and Goods and Services Uniformity. Coasts Estuaries 2019, 253–276. [Google Scholar] [CrossRef]
- De Wit, R.; Leruste, A.; Le Fur, I.; Sy, M.M.; Bec, B.; Ouisse, V.; Derolez, V.; Rey-Valette, H. A Multidisciplinary Approach for Restoration Ecology of Shallow Coastal Lagoons, a Case Study in South France. Front. Ecol. Evol. 2020, 8, 108. Available online: https://www.frontiersin.org/journals/ecology-and-evolution/articles/10.3389/fevo.2020.00108 (accessed on 9 December 2024). [CrossRef]
- Inácio, M.; Schernewski, G.; Nazemtseva, Y.; Baltranaitė, E.; Friedland, R.; Benz, J. Ecosystem services provision today and in the past: A comparative study in two Baltic lagoons. Ecol. Res. 2018, 33, 1255–1274. [Google Scholar] [CrossRef]
- Schernewski, G.; Inacio, M.; Nazemtseva, Y. Expert Based Ecosystem Service Assessment in Coastal and Marine Planning and Management: A Baltic Lagoon Case Study. Front. Environ. Sci. 2018, 6, 19. Available online: https://www.frontiersin.org/journals/environmental-science/articles/10.3389/fenvs.2018.00019 (accessed on 9 December 2024). [CrossRef]
- Schernewski, G.; Jekat, M.; Kösters, F.; Neumann, T.; Steffen, S.; von Thenen, M. Ecosystem Services Supporting Environmental Impact Assessments (EIAs): Assessments of Navigation Waterways Deepening Based on Data, Experts, and a 3D Ecosystem Model. Land. 2024, 13, 1653. [Google Scholar] [CrossRef]
- Seppelt, R.; Fath, B.; Burkhard, B.; Fisher, J.L.; Grêt-Regamey, A.; Lautenbach, S.; Pert, P.; Hotes, S.; Spangenberg, J.; Verburg, P.H.; et al. Form follows function? Proposing a blueprint for ecosystem service assessments based on reviews and case studies. Ecol. Indic. 2012, 21, 145–154. [Google Scholar] [CrossRef]
- Koundouri, P.; Alamanos, A.; Dellis, K.; Stratopoulou, A. Ecosystem Services into Water Resource Planning and Management 2022. Available online: https://EconPapers.repec.org/RePEc:aue:wpaper:2230 (accessed on 9 December 2024).
- Neumann, T.; Radtke, H.; Cahill, B.; Schmidt, M.; Rehder, G. Non-Redfieldian carbon model for the Baltic Sea (ERGOM version 1.2)—Implementation and budget estimates. Geosci. Model. Dev. 2022, 15, 8473–8540. [Google Scholar] [CrossRef]
- European Commission. Marine Biodiversity Modelling Study. In Publications Office of the European Union; European Comission: Brusells, Belgium, 2022; Available online: https://data.europa.eu/doi/10.2777/213731 (accessed on 9 December 2024).
- Inacio, M.; Karnauskaitė, D.; Baltranaitė, E.; Kalinauskas, M.; Bogdzevič, K.; Gomes, E.; Pereira, P. Ecosystem services of the Baltic Sea: An assessment and mapping perspective. Geogr. Sustain. 2020, 1, 256–265. [Google Scholar] [CrossRef]
- Schernewski, G.; Neumann, T.; Bučas, M.; von Thenen, M. Ecosystem Services of the Baltic Sea—State and Changes during the Last 150 Years. Environments 2024, 11, 200. [Google Scholar] [CrossRef]
- Radziejewska, T.; Schernewski, G. The Szczecin (Oder-) Lagoon. In Ecology of Baltic Coastal Waters; Schiewer, U., Ed.; Springer: Berlin, Germany, 2008; pp. 115–129. [Google Scholar]
- Friedland, R.; Schernewski, G.; Gräwe, U.; Greipsland, I.; Palazzo, D.; Pastuszak, M. Managing Eutrophication in the Szczecin (Oder) Lagoon-Development, Present State and Future Perspectives. Front. Mar. Sci. 2019, 5, 521. [Google Scholar] [CrossRef]
- Neumann, T.; Schernewski, G.; Friedland, R. Transformation Processes in the Oder Lagoon as seen from a Model Perspective. EGUsphere preprint. 2025. [Google Scholar] [CrossRef]
- HELCOM. State of the Baltic Sea. Third HELCOM Holistic Assessment 2016–2021. Baltic Sea Environment Proceedings 194. Available online: https://helcom.fi/wp-content/uploads/2023/10/State-of-the-Baltic-Sea-2023.pdf (accessed on 9 December 2024).
- IKSO. Zweite Aktualisierung des Bewirtschaftungsplans für die Internationale Flussgebietseinheit. Int. Komm. Zum Schutz. Der Oder Gegen Verunreinig. Oder. 2022. Available online: http://www.mkoo.pl/download.php?fid=6996&lang=DE (accessed on 9 December 2024).
- Schernewski, G.; Friedland, R.; Paysen, S.; Bucas, M.; Dahlke, S.; von Weber, M. Macrophytes and water quality in a large Baltic lagoon: Relevance, development and restoration perspectives. Front. Mar. Sci. 2023, 10, 1049181. [Google Scholar] [CrossRef]
- Mohrholz, V.; Lass, H.U. Transports between Oderhaff and Pomeranian Bight—A simple barotropic box model. Ger. J. Hydrogr. 1998, 50, 371–383. [Google Scholar] [CrossRef]
- GDA SK S—SZCZECIN. Modernization Swinoujscie—Szczecin to a Depth of 12.5 m. Volume II 2015. Available online: https://atradiusdutchstatebusiness.nl/nl/documenten/poland_report_tom_ii.pdf (accessed on 19 August 2024).
- Siedlik, K. Changes in the Szczecin Lagoon Shoreline as Determined from Selected Seventeenth and Nineteenth Century Maps. In Coastline Changes of the Baltic Sea from South to East; Harff, J., Furmańczyk, K., von Storch, H., Eds.; Springer: Cham, Switzerland, 2017; p. 19. [Google Scholar] [CrossRef]
- Brandt, K. Ueber das Stettiner Haff. Kommission zur wissenschaftlichen Untersuchung der Deutschen Meere in Kiel und der Biologischen Anstalt auf Helgoland, Kiel und Leipzig. Wiss. Meeresunters. 1896, 2, 105–144. Available online: https://www.zobodat.at/pdf/MON-ALLGEMEIN_0294_0001-0640.pdf (accessed on 9 December 2024).
- Port Szczecin. Summary Statistics. Available online: https://port.szczecin.pl/en/ports/szczecin/summary-statistics/ (accessed on 9 December 2024).
- Filina-Dawidowicz, L.; Durczak, W. Organization of Vessel Traffic on Dredged Świnoujście Szczecin Fairway: VTS Operators’ Viewpoint on the Use of Infrastructure for Ships Passing. Eur. Res. Stud. J. 2023, XXVI, 152–169. [Google Scholar] [CrossRef]
- Geyer, B.; Rockel, B. coastDat-2 COSMOCLM Atmospheric Reconstruction, 2013. Available online: https://www.wdc-climate.de/ui/entry?acronym=coastDat-2_COSMO-CLM (accessed on 9 May 2024).
- MV. UVP-Dokumentation Für den Geplanten Bau Eines Containerterminals im Außenhafen in Swinemünde. Available online: https://www.regierung-mv.de/Landesregierung/wm (accessed on 19 August 2024).
- Statistisches Bundesamt. Available online: https://www.destatis.de/DE/Themen/Laender-Regionen/Regionales/Gemeindeverzeichnis/Administrativ/Archiv/GVAuszugQ/AuszugGV1QAktuell.html (accessed on 9 December 2024).
- Landesamt für innere Verwaltung. Available online: https://www.laiv-mv.de/Statistik/Zahlen-und-Fakten/Gesellschaft-&-Staat/Bevoelkerung/Statistische-Berichte (accessed on 9 December 2024).
- Główny Urząd Statystyczny. Available online: https://bdl.stat.gov.pl/bdl/dane/podgrup/tablica (accessed on 19 August 2024).
- Landesamt für innere Verwaltung. Available online: https://www.laiv-mv.de/Statistik/Ver%C3%B6ffentlichungen/Statistische-Berichte/G/ (accessed on 9 December 2024).
- Statistical Yearbook of Maritime Economy 2023. Available online: https://stat.gov.pl/en/topics/statistical-yearbooks/statistical-yearbooks/statistical-yearbook-of-maritime-economy-2023,8,16.html (accessed on 9 December 2024).
- Landesamt für innere Verwaltung. Available online: https://www.laiv-mv.de/Statistik/Zahlen-und-Fakten/Wirtschaftsbereiche/Verkehr/ (accessed on 9 December 2024).
- Stybel, N.; Kleißler, K.; Schulz, N.; Gruzka, P. Fisheries Management in the Szczecin Lagoon. Coastline Rep. 2014, 22, 1–22. Available online: https://www.researchgate.net/publication/316991505_Fisheries_management_in_the_Szczecin_Lagoon (accessed on 9 December 2024).
- GIOS. Update of the Initial Assessment of The Environmental Status of Marine Waters. Available online: https://rdsm.gios.gov.pl/images/Pliki/Update-of-initial-assessment-of-the-environmental-status-of-marine-waters.pdf (accessed on 9 December 2024).
- Lewin, W.-C.; Weltersbach, M.S.; Haase, K.; Strehlow, H.V. Who travels how far: German Baltic sea anglers’ travel distances as precondition for fisheries management and coastal spatial planning. Ocean. Coast. Manag. 2021, 209, 105640. [Google Scholar] [CrossRef]
- Landesamt für Landwirtschaft, Lebensmittelsicherheit und Fischerei Mecklenburg-Vorpommern. Available online: https://www.lallf.de/fischerei/statistik/fischereidokumente/ (accessed on 9 December 2024).
- Haines-Young, R.; Potschin-Young, M. Revision of the Common International Classification for Ecosystem Services (CICES V5.1): A Policy Brief. One Ecosyst. 2018, 3, e27108. [Google Scholar] [CrossRef]
- Haines-Young, R.; Potschin, M. Common International Classification of Ecosystem Services (CICES) V5.1 and Guidance on the Application of the Revised Structure. 2018. Available online: www.cices.eu (accessed on 9 December 2024).
- Landesamt für Landwirtschaft, Lebensmittelsicherheit und Fischerei Mecklenburg-Vorpommern. Available online: https://www.lallf.de/fischerei/statistik/fangstatistik-kuestengewaesser/ (accessed on 9 December 2024).
- GIOS. Available online: https://rdsm.gios.gov.pl/en/6-year-assessments/second-update-of-the-initial-assessment-2016-2021 (accessed on 9 December 2024).
- Landesamt für Landwirtschaft, Lebensmittelsicherheit und Fischerei Mecklenburg-Vorpommern. Available online: https://www.laiv-mv.de/Statistik/Ver%C3%B6ffentlichungen/Jahrbuecher/ (accessed on 9 December 2024).
- European Commission. Economic and Social Analyses. Available online: https://stecf.ec.europa.eu/reports/economic-and-social-analyses_en (accessed on 9 December 2024).
- Scheffold, M.; Hense, I. Quantifying Contemporary Organic Carbon Stocks of the Baltic Sea Ecosystem. Front. Mar. Sci. 2020, 7, 571956. [Google Scholar] [CrossRef]
- CRESP. Wet to Dry Weight Conversations for Biota from Amchitka to Kiska. 2006. Available online: https://www.cresp.org/Amchitka/Final_WW_DW_3_13_06.pdf (accessed on 25 May 2024).
- Czamanski, M.; Nugraha, A.; Pondaven, P.; Lasbleiz, M.; Masson, A.; Caroff, N.; Bellail, R.; Treguer, P. Carbon, nitrogen and phosphorus elemental stoichiometry in aquacultured and wild-caught fish and consequences for pelagic nutrient dynamics. Mar. Biol. 2011, 158, 2847–2862. [Google Scholar] [CrossRef]
- Thurow, F. Estimation of the total fish biomass in the Baltic Sea during the 20th century. ICES J. Mar. Sci. 1997, 54, 444–461. [Google Scholar] [CrossRef]
- Schiff und Hafen. Available online: https://www.schiffundhafen.de/nachrichten/schifffahrt/detail/industriehafen-bei-ueckermuende-wird-ausgebaut.html (accessed on 25 November 2024).
- Dolch, T.; Schernewski, G. Hat Wasserqualität eine Bedeutung für Touristen? Eine Studie am Beispiel des Oderästuars. In Aktuelle Ergebnisse der Küstenforschung. Berichte aus dem Forschung; Daschkeit, A., Sterr, H., Eds.; Und Technologiezentrum Westküste der: Büsum, Germany, 2003; Volume 28, pp. 197–205. [Google Scholar]
- Preißler, S. Wasserqualität an Europäischen Küsten und ihre Bewertung durch TOURISTEN—Eine Wahrnehmungsgeographische Untersuchung in Hamburg und auf Sylt. In IKZM-Oder Berichte; Universität Hamburg: Hamburg, Germany, 2008; Volume 54, p. 134; ISSN 1614-5968; Available online: https://databases.eucc-d.de/files/documents/00000738_IKZM-Oder_Berichte54.pdf (accessed on 13 September 2024)ISSN 1614-5968.
- Bertram, C.; Ahtiainen, H.; Meyerhoff, J.; Pakalniete, K.; Pouta, E.; Rehdanz, K. Contingent Behavior and Asymmetric Pref-erences for Baltic Sea Coastal Recreation. Environ. Resour. Econ. 2020, 75, 49–78. [Google Scholar] [CrossRef]
- Tourismus in Deutschland im Jahr 2023. Available online: https://www.destatis.de/DE/Presse/Pressemitteilungen/2024/02/PD24_053_45.html#:~:text=Die%20Zahl%20der%20%C3%9Cbernachtungen%20von,%2C9%20%25%20h%C3%B6her%20als%202022 (accessed on 9 December 2024).
- Statistische Ämter. Available online: https://www.statistikportal.de/de/ugrdl/ergebnisse/wirtschaft-und-bevoelkerung/bipbws (accessed on 9 December 2024).
- Bundesministerium für Wirtschaft und Energie (BMWi). Wirtschaftsfaktor Tourismus in Deutschland. Available online: https://www.bmwk.de/Redaktion/DE/Publikationen/Tourismus/wirtschaftsfaktor-tourismus-in-deutschland-lang.pdf?__blob=publicationFile&v=1 (accessed on 9 December 2024).
- Europäische Union. Available online: https://european-union.europa.eu/principles-countries-history/eu-countries/germany_de (accessed on 9 December 2024).
- Europäische Union. Available online: https://european-union.europa.eu/principles-countries-history/eu-countries/poland_de (accessed on 9 December 2024).
- Gren, I.-M.; Jonzon, Y.; Lindqvist, M. Costs of Nutrient Reductions to the Baltic Sea: Technical Report; Department of Economics, Swedish University of Agricultural Sciences: Uppsala, Sweden, 2008; Working Paper. [Google Scholar]
- Umweltbundesamt. Preisentwicklung für Emissionsberechtigungen (EUA) seit 2008. Available online: https://www.umweltbundesamt.de/daten/klima/der-europaeische-emissionshandel#teilnehmer-prinzip-und-umsetzung-des-europaischen-emissionshandels (accessed on 25 May 2024).
- Institut für Binnenfischerei, e.V. Recherche und Analyse der Möglichkeiten der Weißfischverwertung in Nordbrandenburg und Mecklenburg-Vorpommern, Projektabschlussbericht, FFUS-004-2019. Available online: https://chara-seen.de/ (accessed on 9 December 2024).
- Köbbing, J.F.; Thevs, N.; Zerbe, S. The utilisation of reed (Phragmites australis): A review. Mires Peat 2013, 13, 1–14. Available online: http://mires-and-peat.net/media/map13/map_13_01.pdf (accessed on 9 December 2024).
- Copernicus. Available online: https://land.copernicus.eu/en/products/coastal-zones/coastal-zones-2012#download (accessed on 9 December 2024).
- Minning, M. Der Schifffahrtskanal im Oderhaff—Eine Sediment-, Nähr- und Schadstofffalle? Diplomarbeit zur Diplomprüfung im Fach Geographie an der Christian-Albrechts-Universität zu Kiel. 2003. Available online: https://eucc-d-inline.databases.eucc-d.de/files/documents/00000695_Diplomarbeit_Minning2.pdf (accessed on 9 December 2024).
- IADC. Modernisation of the Swinouscie—Szczecin Fairway. Available online: https://www.iadc-dredging.com/article/modernisation-of-the-swinoujscie-szczecin-fairway/#:~:text=With%20more%20approximately%2024%20million,the%20next%20generation%20of%20vessels (accessed on 9 December 2024).
- Interreg Central Europe. The Action Plan for the Implementation of Environmentally Friendly Solutions in Freight Transport of Szczecin and Świnoujście Multimodal Node and Transport Connections. Available online: https://programme2014-20.interreg-central.eu/Content.Node/D.T-2.5.9-Action-Plan-Port-of-Szczecin----winouj-cie---ENERG.pdf (accessed on 9 December 2024).
- Mehvar, S.; Filatova, T.; Dastgheib, A.; De Ruyter van Steveninck, E.; Ranasinghe, R. Quantifying Economic Value of Coastal Ecosystem Services: A Review. J. Mar. Sci. Eng. 2018, 6, 5. [Google Scholar] [CrossRef]
- Sagebiel, J.; Schwartz, C.; Rhozyel, M.; Rajmis, S.; Hirschfeld, J. Economic valuation of Baltic marine ecosystem services: Blind spots and limited consistency. ICES J. Mar. Sci. 2016, 73, 991–1003. [Google Scholar] [CrossRef]
- Czajkowski, M.; Budziński, W.; Zandersen, M.; Zawadzki, W.; Aslam, U.; Angelidis, I.; Zagórska, K. The Recreational Value of the Baltic Sea Coast: A Spatially Explicit Site Choice Model Accounting for Environmental Conditions. Environ. Resour. Econ. 2024, 87, 135–166. [Google Scholar] [CrossRef]
- Kulmala, S.; Haapasaari, P.; Karjalainen, T.P.; Kuikka, S.; Pakarinen, T.; Parkkila, K.; Romakkaniemi, A.; Vuorinen, P. Ecosystem services provided by Baltic salmon: A regional perspective to the socio-economic benefits associated with a keystone species. Econ. Ecosyst. Biodiveristy Nord. Synth. 2013, 266–276. Available online: https://www.teebweb.org/wp-content/uploads/2013/01/TEEB-case_TEEBNordic_Ecosystem-services-provided-by-Baltic-salmon.pdf (accessed on 9 December 2024).
- Liu, S.; Costanza, R.; Farber, S.; Troy, A. Valuing ecosystem services: Theory, practice, and the need for a transdisciplinary synthesis. Ann. N. Y Acad. Sci. 2010, 1185, 54–78. [Google Scholar] [CrossRef] [PubMed]
- De Groot, R.; Brander, L.; Van Der Ploeg, S.; Costanza, R.; Bernard, F.; Braat, L.; Christie, M.; Crossman, N.; Ghermandi, A.; Hein, L.; et al. Global estimates of the value of ecosystems and their services in monetary units. Ecosyst. Serv. 2012, 1, 50–61. [Google Scholar] [CrossRef]
- Homaio. 2030 EUA Price Predictions: Expert Analysis of 3 Scenarios. Available online: https://www.homaio.com/post/2030-eua-price-predictions-expert-analysis-of-3-scenarios (accessed on 20 August 2024).
- HELCOM. Thematic Assessment of Economic and Social Analyses 2016–2021. Baltic Sea Environment Proceedings 188. Available online: https://helcom.fi/wp-content/uploads/2023/03/HELCOM-Thematic-assessment-of-economic-and-social-analyses-2016-2021.pdf (accessed on 25 May 2024).
- Leipe, T.; Eidam, J.; Lampe, R. Das Oderhaff—Beiträge zur Rekonstuktion der holozänen geologischen Entwicklung und anthropogenen Beeinflussung des Oder-Ästuars. Meereswissenschaftliche Berichte 1998, 28, 1–61. [Google Scholar]
- Bouwma, I.; Schleyer, C.; Primmer, E.; Winkler, K.J.; Berry, P.; Young, J.; Preda, E. Adoption of the ecosystem services concept in EU policies. Ecosyst. Serv. 2018, 29, 213–222. [Google Scholar] [CrossRef]
- Bull, J.W.; Jobstvogt, N.; Böhnke-Henrichs, A.; Mascarenhas, A.; Sitas, N.; Baulcomb, C.; Lambini, C.; Rawlins, M.; Baral, H.; Zähringer, J.; et al. Strengths, Weaknesses, Opportunities and Threats: A SWOT analysis of the ecosystem services framework. Ecosyst. Serv. 2016, 17, 99–111. [Google Scholar] [CrossRef]
- Staatliches Amt für Landwirtschaft und Umwelt Vorpommern. Managementplan. Available online: https://www.stalu-mv.de/ms/Themen/Naturschutz-und-Landschaftspflege/NATURA-2000/Managementplanung/?racr=a (accessed on 9 December 2024).
- Smardon, R.C. Ecosystem Services for Scenic Quality Landscape Management: A Review. Land 2021, 10, 1123. [Google Scholar] [CrossRef]
- Hermann, A.; Schleifer, S.; Wrbka, T. The concept of ecosystem services regarding landscape research; A review. Living Rev. Landsc. Res. 2011, 5, 1–37. Available online: http://www.livingreviews.org/lrlr-2011-1 (accessed on 9 December 2024). [CrossRef]
- Garcia Rodrigues, J.; Conides, A.; Rivero Rodriguez, S.; Raicevich, S.; Pita, P.; Kleisner, K.; Pita, C.; Lopes, P.; Roldán, V.A.; Ramos, S.; et al. Marine and Coastal Cultural Ecosystem Services: Knowledge gaps and research priorities. One Ecosyst. 2017, 2, e12290. [Google Scholar] [CrossRef]
- Marcinkeviciute, L.; Pranskuniene, R. Cultural Ecosystem “employing” available natural resources, i.e., the ecosystems. Services: The Case of Coastal-Rural Area (Nemunas Delta and Curonian Lagoon, Lithuania). Sustainability 2021, 13, 123. [Google Scholar] [CrossRef]


| Dissolved Inorganic N (Winter) [µmol/l] | Dissolved Inorganic P (Winter) [µmol/l] | Chlorophyll-a (Summer) [µg/l] | Phytoplankton (Annual Mean) [mmol C/m³] | Cyanobacteria (Summer) [mmol C/m³] | ||||||||||||||||
|---|---|---|---|---|---|---|---|---|---|---|---|---|---|---|---|---|---|---|---|---|
| Subbasin | 6 m | 10.5 m | 12.5 m | ∆ % | 6 m | 10.5 m | 12.5 m | ∆ % | 6 m | 10.5 m | 12.5 m | ∆ % | 6 m | 10.5 m | 12.5 m | ∆ % | 6 m | 10.5 m | 12.5 m | ∆ % |
| Kleines Haff | 64.8 | 61.7 | 64.6 | −0.4 | 1.4 | 2.0 | 2.0 | 40 | 51.2 | 42.9 | 40.5 | −21 | 83.9 | 69.9 | 66.7 | −20 | 15.4 | 18.2 | 16.7 | 9 |
| Wielki Zalew | 120.9 | 121.1 | 121.3 | 0.3 | 1.3 | 1.7 | 1.7 | 33 | 55.5 | 48.3 | 43.1 | −22 | 102.7 | 89.1 | 82.1 | −20 | 8.4 | 11.0 | 10.6 | 26 |
| Total lagoon | 97.3 | 96.3 | 96.9 | −0.5 | 1.4 | 1.8 | 1.8 | 35 | 53.6 | 46.1 | 42.0 | −22 | 94.6 | 81.0 | 75.6 | −20 | 11.3 | 14.0 | 13.1 | 16 |
| N-Fixation [t/a] | Denitrification [t/a] | Salinity [g/kg] | Water temperature (summer) [°C] | Secchi-depth (summer) [m] | ||||||||||||||||
| Subbasin | 6 m | 10.5 m | 12.5 m | ∆ % | 6 m | 10.5 m | 12.5 m | ∆ % | 6 m | 10.5 m | 12.5 m | ∆ % | 6 m | 10.5 m | 12.5 m | ∆ % | 6 m | 10.5 m | 12.5 m | ∆ % |
| Kleines Haff | 676 | 811 | 733 | 8 | 4886 | 4204 | 4121 | −16 | 0.9 | 1.3 | 1.4 | 53 | 21.8 | 21.8 | 21.8 | 0.2 | 0.77 | 0.83 | 0.85 | 10 |
| Wielki Zalew | 498 | 721 | 728 | 46 | 8922 | 8759 | 8092 | −9 | 0.4 | 0.9 | 1.0 | 135 | 20.6 | 20.6 | 20.5 | −0.5 | 0.71 | 0.77 | 0.84 | 18 |
| Total lagoon | 1159 | 1510 | 1438 | 24 | 13716 | 12845 | 12098 | −12 | 0.6 | 1.1 | 1.2 | 89 | 21.1 | 21.1 | 21.1 | −0.2 | 0.74 | 0.82 | 0.84 | 14 |
| Socio-economic data | Kleines Haff | Wielki Zalew | Total lagoon | 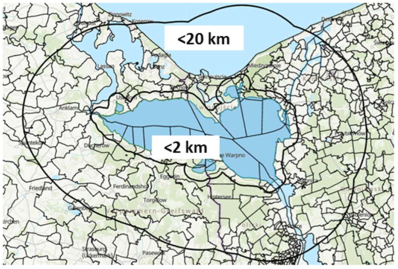 | |
| Population | <2 km | 15,616 | 60,628 | 76,244 | |
| Population | <20 km | 73,223 | 199,803 | 273,026 | |
| Guest overnight stays | <2 km | 239,316 | 61,702 | 301,017 | |
| Beach area | (m2) | 78,387 | 12,263 | 90,650 | |
| Sport boat berths | (no.) | 804 | 520 | 1324 | |
| Ship passengers | (no.) | 7472 | 14,917 | 22,389 | |
| Cargo ship arrivals | (no.) | 50 | 3288 | 3338 | |
| Fishing boats | (no.) | 80 | 126 | 206 | |
| Fishermen | (no.) | 80 | 360 | 440 | |
| Kleines Haff, Germany | Wielki Zalew, Poland | |||||
| Catches | Price | Yield | Catches | Price | Yield | |
| Species | [kg/a] | [EUR/kg] | [EUR/a] | [kg/a] | [EUR/kg] | [EUR/a] |
| Herring | 2115 | 0.66 | 1396 | 46,400 | 0.30 | 14,076 |
| Salmon | 896 | 8.22 | 7368 | 4283 | 6.90 | 29,539 |
| Eel | 3051 | 13.92 | 42,463 | 19,650 | 10.58 | 207,961 |
| Pike perch | 66,636 | 6.29 | 419,138 | 103,483 | 3.86 | 399,275 |
| Pike | 3354 | 2.80 | 9391 | 10,233 | 1.97 | 20,165 |
| Perch | 97,380 | 2.20 | 214,237 | 577,050 | 1.98 | 1,142,006 |
| White fish | 299,421 | 0.70 | 208,098 | 1,009,233 | 0.43 | 436,704 |
| Others | 5196 | 1.00 | 5196 | 22,400 | 0.70 | 15,680 |
| Sum/mean: | 478,049 | 1.90 | 907,286 | 1,792,733 | 1.26 | 2,265,407 |
Disclaimer/Publisher’s Note: The statements, opinions and data contained in all publications are solely those of the individual author(s) and contributor(s) and not of MDPI and/or the editor(s). MDPI and/or the editor(s) disclaim responsibility for any injury to people or property resulting from any ideas, methods, instructions or products referred to in the content. |
© 2025 by the authors. Licensee MDPI, Basel, Switzerland. This article is an open access article distributed under the terms and conditions of the Creative Commons Attribution (CC BY) license (https://creativecommons.org/licenses/by/4.0/).
Share and Cite
Schernewski, G.; Neumann, T.; Piehl, S.; Swer, N.M. Ecosystem-Model-Based Valuation of Ecosystem Services in a Baltic Lagoon: Long-Term Human Technical Interventions and Short-Term Variability. Environments 2025, 12, 35. https://doi.org/10.3390/environments12020035
Schernewski G, Neumann T, Piehl S, Swer NM. Ecosystem-Model-Based Valuation of Ecosystem Services in a Baltic Lagoon: Long-Term Human Technical Interventions and Short-Term Variability. Environments. 2025; 12(2):35. https://doi.org/10.3390/environments12020035
Chicago/Turabian StyleSchernewski, Gerald, Thomas Neumann, Sarah Piehl, and Nicole M. Swer. 2025. "Ecosystem-Model-Based Valuation of Ecosystem Services in a Baltic Lagoon: Long-Term Human Technical Interventions and Short-Term Variability" Environments 12, no. 2: 35. https://doi.org/10.3390/environments12020035
APA StyleSchernewski, G., Neumann, T., Piehl, S., & Swer, N. M. (2025). Ecosystem-Model-Based Valuation of Ecosystem Services in a Baltic Lagoon: Long-Term Human Technical Interventions and Short-Term Variability. Environments, 12(2), 35. https://doi.org/10.3390/environments12020035