Abstract
Diffuse agricultural pollution is one of the greatest challenges to achieving good chemical and ecological status of Scotland’s water bodies. The River Ythan in Aberdeenshire was designated a Nitrate Vulnerable Zone (NVZ) in the year 2000, due to the eutrophication of the Ythan Estuary and rising nitrate trends in Private Water Supply (PWS) groundwater abstractions. The third River Basin Management Plan (RBMP) for Scotland reported the Ellon groundwater body of the River Ythan catchment to be of poor chemical status as of 2021 with respect to nitrate, and forecasted groundwater recovery beyond 2027. Following two decades of NVZ designation, we investigated the drivers of groundwater nitrate across the River Ythan catchment through an analysis of long-term (2009–2018) groundwater quality monitoring data collected by the Scottish Environmental Protection Agency (SEPA) and a recent synoptic groundwater nitrate sampling survey of PWSs. Groundwater nitrate was found to remain elevated across the catchment area, and appeared to be highly sensitive to agricultural practices and meteorological forcing, indicating a high sensitivity of groundwater quality to environmental change. Further hydrogeological characterisation is recommended to better understand the effects of agricultural practices on groundwater quality, and to facilitate achievement of future RBMP goals under a changing climate.
1. Introduction
Anthropogenic nitrogen (N) loadings to the environment have contaminated aquifers worldwide [1,2], resulting in the exposure of human and ecological receptors through drinking water abstractions from aquifers and groundwater discharge to surface water bodies, respectively [3,4,5]. Nitrate consumption in drinking water poses a variety of human health risks [6], and surface water eutrophication is a key driver for biodiversity loss [7]. Furthermore, water treatment for nitrate removal and clearance of algal mats from eutrophicated reservoirs, recreational water bodies and protected habitats present undesirable burdens to water management [8].
In European Union (EU) member states, the European Commission Drinking Water Directive (80/778/EEC) designates the maximum permissible limit for nitrate in water intended for human consumption as 50 mg/L of NO3 (11.3 mg/L of NO3-N), due to the perceived risks of nitrate consumption to human health. This threshold value was adopted in the Nitrates Directive (91/676/EEC) as an environmental water quality threshold, contributing to the chemical status classification of water bodies under the Water Framework Directive (WFD) (2000/60/EC). Under the WFD, the catchment areas supplying water bodies exceeding the regulatory environmental nitrate limit or exhibiting poor ecological status due to the impacts of eutrophication, are designated as Nitrate Vulnerable Zones (NVZs), typically justified by the accompaniment of groundwater vulnerability mapping [9]. Agricultural land managers operating within NVZs are legally obligated to follow Nitrate Action Plans (NAPs) regulating agricultural activities to reduce N loading to water bodies.
Although the original WFD goal for achieving good chemical and ecological status for all European water bodies by 2015 was never realised, the pressure to achieve these environmental targets has ultimately reduced N loadings to water bodies, where NVZ designation has provided a powerful legislative tool [10]. Disregarding socioeconomic and policy implementation challenges, the delayed recovery of water bodies to nitrate pollution has been largely due to the practicality of reducing diffuse agricultural pollution losses from modern agriculture, and the lag times of nitrate removal from catchments due to the groundwater residence times of aquifers, that are often poorly constrained in rural regions [11,12]. In addition, there is a growing risk of current diffuse nutrient management efforts being undermined by climate change impacts to hydrological and biogeochemical cycles that govern water quality [13]. Increased precipitation volume and intensity over the winter is expected to increase the proportion of N lost from agroecosystems to groundwater, coupled with increasing water scarcity over the summer due to droughts are expected to increase the greywater footprint of agriculture [14], a metric representing the volume of freshwater required to dilute contaminants below environmental limits. Increasing water scarcity and temperatures over summer low flow periods will also increase the dependence of aquatic ecosystems on the chemical quality of groundwater-derived baseflows, and increase the severity of the impacts to biodiversity associated with eutrophication events [15].
In Scotland, diffuse nitrate pollution by agriculture represents the most significant water quality pressure, affecting >80% groundwaters bodies by area [16]. NVZ designation and revision is determined by water body chemical and ecological quality monitoring by the Scottish Environmental Protection Agency (SEPA) and groundwater vulnerability mapping supported by the British Geological Survey (BGS) [17,18,19,20]. EU water quality legislation was transposed into Scots law through the Water Environment and Services (Scotland) Act 2003 (WEWS), and has since been retained following withdrawal from the EU [10]. Under the WEWS, SEPA is responsible for the coordination of River Basin Management Plans (RBMPs), which define targets for achieving good chemical and ecological status of water bodies and their implementation, including groundwater quality monitoring on behalf of the Scottish government. The current Scottish RBMP cycle (2021–2027) aims to increase the number of water bodies achieving good water quality status from 87% to 98%, in consideration of a climate emergency and biodiversity crisis [21].
Groundwater bodies with delayed water quality recovery to diffuse nutrient pollution following long-term nutrient management improvements warrant further investigation to validate the effectiveness of current agri-environmental policies [22,23,24]. This study aimed to evaluate the factors limiting the recovery of the Ellon groundwater body of the River Ythan catchment following two decades of NVZ designation. The specific objectives were the following: (1) to relate the spatial distribution of groundwater nitrate to the physiographic factors governing groundwater vulnerability; (2) to assess the relative recovery rates of groundwaters from nitrate pollution observed at different long-term groundwater quality Monitoring Stations (MSs); (3) to identify climate and land use drivers determining groundwater nitrate dynamics; and (4) to use the factors associated with delayed groundwater recovery to define recommendations for nutrient management to ensure achievement of future water quality targets.
2. Materials and Methods
2.1. Case Study Area
The River Ythan catchment is located in the Aberdeenshire, northeast Scotland (Figure 1), discharging into the Ythan Estuary, home to the Newburgh and Sands of Forvie RAMSAR site and Site of Special Scientific Interest (SSSI). Agriculture is the dominant land use (87%), where physiographic factors determine 61% of land capable of supporting mixed agriculture and 38% of land capable of supporting arable agriculture [25]. Post-war agricultural intensification of the catchment was associated with the widespread installation of artificial drainage and conversion of grassland to arable land uses, with the introduction of the Common Agricultural Policy motivating the cultivation and fertilisation of wheat and barley at the expense of less demanding crops [26]. Deteriorating surface water quality and eutrophication of the Ythan Estuary over the 1960s–1990s was concluded by SEPA to be largely associated with agriculture, particularly changes to winter cropping [27]. The River Ythan was finally designated as an NVZ in 2000 on the basis of estuarine eutrophication and rising nitrate trends in surface waters and Private Water Supply (PWS) groundwater abstractions. Subsequent groundwater vulnerability mapping by the British Geological Survey (BGS) and the Macaulay Land Research Institute (now the James Hutton Institute) motivated the expansion of the original NVZ in 2002 to cover the entirety of the coastal lowlands of northeast Scotland [17].
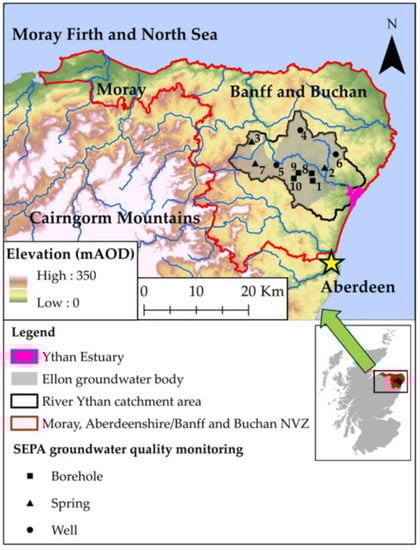
Figure 1.
Map of the River Ythan catchment area and Ellon groundwater body in relation to the wider Moray, Aberdeenshire/Banff and Buchan Nitrate Vulnerable Zone (NVZ). SEPA groundwater quality monitoring stations are labelled 1–10. Sources: Scottish Government 2015; SEPA 2023; Contains Ordnance Survey data © Crown copyright and database right, 2023.
A catchment-based environmental management project, “The Ythan Project” (2001–2005), was sponsored by the European LIFE Environmental fund, resulting in the restoration of a significant tract of riparian zone along the main thalweg, provision of nutrient budgeting tools and training for farmers, in addition to supporting rural stewardship scheme applications resulting in 70 km of buffer strip installation [28]. Despite improvements in environmental management and surface water quality [29,30], the Ellon groundwater body maintains a poor chemical quality status that is not expected to reach good environmental status within the current RBMP (2021–2027) due to persistent groundwater nitrate exceedances above the environmental limit [21,22,23,24,25,26,27,28,29,30].
The basement rocks of the Ellon groundwater body include Precambrian (Dalradian) metasediments and Ordovician igneous intrusions, providing low and very low productivity aquifers, respectively (Figure 2). In the metasedimentary aquifers, the majority of groundwater flow occurs along the upper weathered zone at rock head, formed from Tertiary weathering and/or (peri)glacial processes [17,31,32], with some deeper groundwater flow controlled by complex fracture networks [33]. The igneous intrusions range from granitic to ultrabasic compositions, with the latter typically associated with a deeper degree of preglacial weathering [32]. The Turriff groundwater body is defined as a basin of Devonian sedimentary rocks providing moderate productivity aquifers that supplement a public water supply reservoir in the summer months.
Quaternary geology is mapped at the 1:50,000 scale in the west and at the 1:10,000 scale in the east, resulting in a N–S division in diamicton coverage across the centre of the catchment, creating artefacts within subsequent BGS thematic maps (Figure 2). Overall, diamicton rarely exceeds 3 m in thickness, and is not considered to be a significantly exploitable aquifer, but within an environmental context contributes to baseflow discharges, as well as feeds numerous shallow PWS wells and springs [17]. Moderate productivity heterogeneous alluvial aquifers are distributed throughout the river network, whereas highly permeable glaciofluvial sand and gravel aquifers are restricted to the valley sides of the central thalweg.
The drainage properties of soils are related to their parent materials and position along hillslopes, with well-drained podzols and brown earths occupying hilltops, and poorly drained gleys occupying lower slopes [34]. The high spatial heterogeneity in geology and landscape has favoured the persistence of mixed farming enterprises despite agricultural intensification, where inclusion of grassland into arable rotations is required to maintain soil structure [25,35].

Figure 2.
Spatial distribution of SEPA groundwater quality monitoring stations 1–10 and Private Water Supply (PWS) groundwater sampling points by construction type (well, spring, borehole) overlayed onto BGS aquifer productivity (Scotland) datasets derived from 1:100,000 scale BGS Digital Data under License (2023/007) British Geological Survey. © and Database Right UKRI. All rights reserved [36,37].
2.2. Description of Groundwater Quality Datasets
SEPA established 10 groundwater quality MSs across the River Ythan catchment in 2008 [30]. Their selection of groundwater monitoring points was based on typical land use classes to assess their relative effects on diffuse nitrate loadings to groundwater (Table 1). These monitoring points include five purpose-drilled groundwater environmental monitoring boreholes (n = 4), and farm PWS abstraction sites (n = 6) that include traditional shallow, wide diameter dug wells, and spring collection chambers (the most common PWS construction type in Northeast Scotland) [38]. Following an initial high frequency monitoring during a characterisation stage, groundwater quality monitoring became quarterly post-2013.

Table 1.
Summary of the SEPA Ythan groundwater Monitoring Stations (MSs).
In addition to the SEPA groundwater quality monitoring data, groundwater samples were collected from 27 PWS groundwater abstraction points within the River Ythan catchment between July 2021 and March 2022, representing a mixture of land uses and construction styles (well, spring, borehole). Samples were bottled from the outflow pipes of spring collection chambers, bailed from wells, and from purged, unfiltered borehole taps. These groundwater samples were refrigerated prior to nitrate determination with flow injection analysis (FIA) by the University of Aberdeen School of Biological Sciences Analytical Services Unit. A further 38 groundwater samples from different PWS abstraction sites (2013–2020) were obtained from PWS water quality certificates obtained from the Aberdeenshire Council public access and building register database. These samples were collected and analysed by Aberdeenshire Council Environmental Health in accordance with the Private Water Supplies (Scotland) Regulations 2006, representing unfiltered groundwater samples to establish filtration requirements for safe human consumption. Figure 2 provides the spatial distribution of all groundwater samples plotted overlaying BGS bedrock and superficial aquifer productivity maps for Scotland [36,37].
2.3. Groundwater Vulnerability Assessment
The current BGS groundwater vulnerability map for Scotland uses a decision tree-based approach to evaluate the travel time and attenuation of contaminants reaching the water table [18,19,20]. The conceptual model invokes the concept of recharge acceptance [17], where low recharge rates associated with the low permeability fractured bedrock aquifers that typify Scotland may result in low total contaminant loading rates, but with disproportionate impacts to groundwater quality and loadings to receptors, due to negligible opportunities for contaminant attenuation within fractured matrices [16]. Here, lower groundwater vulnerability ratings may be provided by thick and/or low permeability superficial cover. Where superficial deposits are absent, vulnerability is exclusively determined by soil permeability [18,19,20].
The DRASTIC method [39] precedes the development of the BGS methodology tailored for Scotland, yet remains one of the most widely applied groundwater vulnerability mapping approaches [39,40]. Groundwater vulnerability is determined by the relative weightings of several thematic layers representing the spatial distribution of hydrogeological parameters rated according to their influence on contaminant transport (Depth to groundwater table, Recharge, Aquifer Media, Soil media, Topography (slope), Impact of vadose zone, and hydraulic Conductivity). The conceptual model considers higher permeability media such as glacial sand and gravels to be of higher risk of contaminant transport relative to poorly permeable materials such as fractured crystalline bedrock, due to higher advective transport rates. Likewise, higher recharge rates are associated with greater contaminant fluxes to the saturated zone [39]. A DRASTIC groundwater vulnerability map using the default methodology was developed for the River Ythan catchment to assess the risk of N leaching to groundwater [41]. A comparison of the parameters used for the BGS and DRASTIC groundwater vulnerability maps is provided in Table 2.
Table 2.
Comparison of data sources for BGS and DRASTIC groundwater vulnerability mapping approaches [20,41].
2.4. Groundwater Nitrate Time Series Analyses
All statistical analyses of SEPA groundwater quality monitoring data were completed within the open access trend analysis and equivalence testing of the environmental data software package Time Trends v9.0 [50]. The software provides several statistical analysis tools that are widely applied to the assessment of groundwater quality time series data [51,52,53,54]. Within the Time Trends package, seasonality and trend analyses were applied to the entire time series for each SEPA groundwater quality MS to derive long-term trend and seasonality statistics. The analyses were then repeated for discrete sections of the monitoring period that demonstrated contrasting temporal dynamics, i.e., sub-trends. The latter were screened for using a combination of piecewise linear regression and cumulative sum charts, before iteratively applying trend tests to optimise fits to the data.
The strength of seasonality in groundwater nitrate time series data was evaluated by applying Mann–Whitney U tests (α = 0.05) to observations grouped into four seasons that were defined by the quarterly monitoring frequency towards the end of the monitoring period (January–March, April–June, July–September, October–December). In addition to the seasonality test, effective rainfall (precipitation (P)—potential evapotranspiration (PET)) was plotted alongside time series of SEPA groundwater quality monitoring data to identify seasonal climate drivers to nitrate dynamics. Daily total P and PET at a 1 km2 spatial resolution were obtained from the HadUK-Grid meteorological and the Hydro-PE HadUK-Grid datasets, respectively [54,55].
The significance of potential upward and downward trends was determined using Mann Kendall correlation and Seasonal Kendall tests at the 95% significance level, for time series with non-significant and significant seasonality components, respectively. Sen slope estimation was then applied to all time series data, to provide a magnitude of the trend. The relative slopes of groundwater nitrate trends for comparisons between MSs were derived by expressing the calculated Sen slope as a percentage of median nitrate concentration over the observed trend (% yr−1).
2.5. Determination of Land Use
The local and/or dominant land use upgradient to SEPA groundwater MSs were catalogued over the monitoring period, in order to provide probable explanations to drivers of shallow groundwater nitrate dynamics. Google earth aerial imagery [56] provided the primary determinant of land use due to the high-resolution imagery, whereas lower resolution, satellite-derived Land Cover Maps (LCMs) and multispectral satellite imagery provided secondary sources of land use classification to fill in time gaps between aerial photographs. In aerial photographs, the presence of livestock was indicated by grazed land (pasture), and grass fodder by the homogeneity of vegetative cover. Arable systems were defined by the presence of tramlines and other linear heterogeneities in vegetative cover, as well as seasonal occurrences of bare earth associated with harvest and tillage.
LCMs developed by the UK Centre for Ecology and Hydrology (CEH) from classification of satellite imagery 2007, 2015 and 2017 were obtained from the EDINA Environment Digimap Service [57]. CEH LCMs categorise agricultural land covers into improved grassland (grazing and grass fodder) and arable land uses, with some years providing rough grassland as a separate category (grazing land).
Landsat imagery was viewed on the ArcGIS online Landsat Explorer web application [58], using the agricultural band combination (6,5,2), to distinguish differences in vegetative cover between fields. Under this band combination, vegetation appeared bright green during early growth, becoming dark green at maturity, whereas stressed vegetation associated with heavy grazing or dry grasses prior to cutting appeared a dull or yellowish green. Despite improved grassland and arable systems both appearing green, different shades were apparent between adjacent fields of contrasting land use. In addition, recently tilled or harvested arable land with bare earth appeared brown or magenta.
3. Results
3.1. Spatial Distribution of Nutrients in Groundwater and Groundwater Vulnerability Assignment
Figure 3 provides all groundwater samples plotted as graduated symbols overlaying the BGS and DRASTIC groundwater vulnerability maps for the River Ythan catchment area. The majority of groundwater nitrate concentrations in the River Ythan catchment greatly exceeded natural background levels (>1 mg/L of NO3-N) [59], but ranged from below the analytical detection limit (<0.3 mg/L of NO3-N) towards a maximum of 17.4 mg/L of NO3-N. Figure 4 provides boxplots illustrating the distribution of groundwater nitrate for groundwater monitoring points grouped by construction details, physiographic factors, land use and groundwater vulnerability classifications.
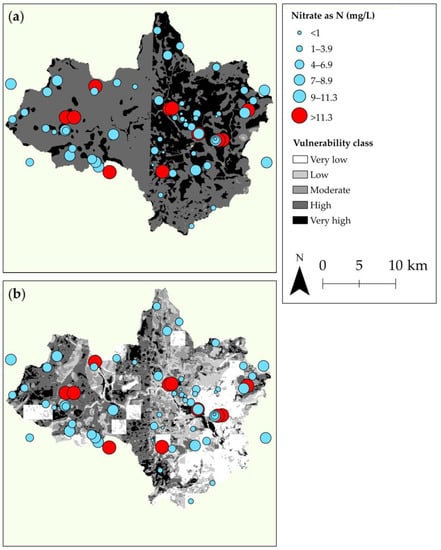
Figure 3.
Spatial distribution of groundwater nitrate concentrations taken from SEPA Ythan monitoring stations and private water supplies, overlayed onto (a) BGS groundwater vulnerability map (Scotland) derived from 1:100,000 scale BGS Digital Data under License (2023/007) British Geological Survey. © and Database Right UKRI. All rights reserved; and (b) DRASTIC groundwater vulnerability map for the River Ythan catchment [41].
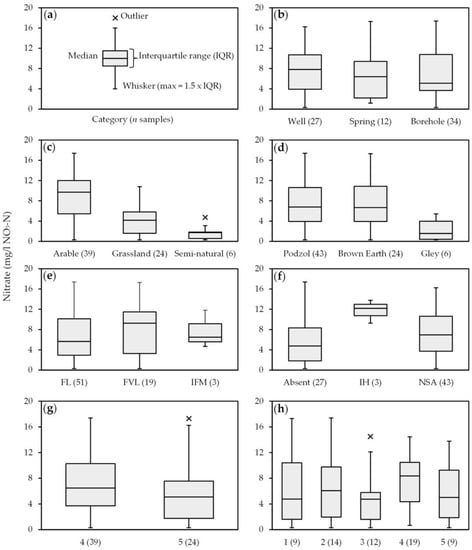
Figure 4.
Box plots of groundwater sample nitrate concentrations in the River Ythan catchment, classified by (a) annotated box plot example; (b) groundwater monitoring point construction details; (c) land use classification; (d) soil type; (e) BGS bedrock aquifer productivity categories (FL) fracture flow low productivity, (FVL) fracture flow very low productivity, (IFM) intergranular and fracture flow moderate productivity; (f) BGS superficial aquifer productivity (Absent) no superficial aquifer present, (IH) intergranular flow high productivity, (NSA) not a significant aquifer; (g) BGS groundwater vulnerability rating; and (h) DRASTIC groundwater vulnerability rating (1) very low risk, (2) low risk, (3) medium risk, (4) high risk, (5) very high risk.
There was no significant difference in groundwater nitrate according to groundwater monitoring point construction details (well, spring, borehole) (Figure 4b). However, groundwater samples collected from three SEPA boreholes screened exclusively in bedrock aquifers (MSs 8–10) were consistently below the analytical detection limit for nitrate. MSs 8 and 10 were located in areas of semi-natural land uses, which are shown by Figure 4c to be associated with lower nitrate concentrations for PWS groundwater abstraction points. MS 9 was located at the foot of a hillslope associated with an improved grassland land use category, contrasting with the remaining SEPA borehole MS 1 where consistently detectable nitrate was located on a hilltop with improved grassland land use. A cluster of PWS groundwater samples featuring low nitrate concentrations in the centre of the catchment was associated with a predominantly residential area with a low proportion of agricultural land uses.
PWS groundwater abstractions from aquifers overlain by poorly drained gley soils were significantly lower than freely drained and imperfectly drained podzols and brown earths (Figure 4d). There was no significant difference in groundwater nitrate for sampling points that were spatially associated with different bedrock aquifer productivity classes (Figure 4e). A small sample size (n = 3) of groundwater samples from intergranular flow, high productivity glaciofluvial aquifers featured higher nitrate concentrations relative to samples collected from areas with diamicton deposits or an absence of superficial cover (Figure 4f).
The BGS groundwater vulnerability map implies that almost the entire River Ythan catchment area is of high risk or very high risk of contaminants leaching to groundwater (Figure 3a), whereas the DRASTIC groundwater vulnerability map provides a larger range of risk ratings (Figure 3b). For the BGS map, all groundwater samples exceeding the regulatory environmental limit (>11.3 mg/L of NO3-N) were directly located on, or <100 m downgradient of very high-risk areas, with the exception of two shallow wells associated with a pig farm. Nevertheless, groundwater nitrate was broadly equivalent between the high and very high-risk areas (Figure 4g) and did not account for the high variability in nitrate distributed across categories, with some samples returning nitrate concentrations <10 mg/L of NO3-N despite being located in areas of agricultural land use, implying lower vulnerability to nitrate pollution. We did not obtain groundwater samples for areas located in the moderate risk class for the BGS map, and so cannot determine whether groundwaters here featured lower nitrate concentrations. For the DRASTIC map, the samples with the highest groundwater nitrate concentrations occurred across risk weightings, with no significant difference in groundwater nitrate between risk categories (Figure 4h).
3.2. Land Use Change of SEPA Groundwater Monitoring Stations
The hilltop featuring Monitoring Station (MS) 1 appeared to have consistently remained a grassland throughout the monitoring period. An aerial photograph taken on 1 January 2007 shows overgrown vegetation and patches of bare earth, contrasting with imagery from 22 March 2012 onwards, where vegetation appears to be regularly cut and the patches of bare earth have been reseeded and possibly tilled. Landsat imagery taken throughout 2012 demonstrates a contrast between a yellowish green towards a seasonal change between brown and vibrant green, suggesting grass fodder production, but poorly constrains the timing of land use change due to periods of cloud cover. Subsequent aerial imagery continues to show characteristics of agricultural management, including homogeneous grass texture and forage harvester tracts. Cattle were present on 28 June 2018, contributing to overgrazing and soil erosion.
Aerial imagery shows most of the fields upgradient of MS 2 were under arable land use at the beginning of the monitoring period; by 22 March 2012, these fields were converted to grass fodder and sheep grazing. The field immediately upgradient to the spring was converted to arable land use by 9 May 2016. LCMs and Landsat data did not provide further constraint on the timing of these land use changes.
The proportion of improved grassland and arable land uses surrounding MS 3 remained largely consistent throughout the monitoring period. Aerial imagery shows that by 27 April 2011, a 0.17 km2 area dedicated to free range chicken runs 56 m upgradient of the spring was replaced by arable land use. In addition, the MS 3 spring was located downgradient of a winter housing shed for chickens, indicating that local (point) source contamination pressures may be evident. Due to the relatively remote area, Landsat data appeared to be of relatively lower resolution, and did not provide further constraint.
The field hosting MS 4 was under an improved grassland for LCM2007, and aerial imagery shows conversion to arable land use by 22 March 2012, which it appears to remain as thereafter. Landsat imagery was unavailable for MS 4 between 2007 and 2012.
Aerial imagery from 1 January 2006 shows the field at the head of the glacial meltwater channel feeding MS 5 was occupied by arable land use, which was then converted to sheep grazing by 22 March 2012. The field containing the well was also converted from cattle grazing to grass fodder production. LCM 2018 shows that the field to the east of the well was converted from grass fodder to arable land use, with Landsat imagery suggesting vegetative contrasts with surrounding fields of grasses by 4 July 2018.
All methods of land use determination consistently showed MS 6 to be surrounded by arable land uses throughout the entire monitoring period.
Aerial imagery and LCM products show that the farmland surrounding the spring MS 7 underwent multiple rotations of improved grassland and arable land use throughout the monitoring period, although one 1.25 km2 field 500 m west of the spring appeared to have consistently remained under cattle grazing.
3.3. Groundwater Nitrate Trends and Seasonality
The results of the time series analyses are presented in Table 3. The seasonality and trend p-values report the statistical significance of seasonality and trend identified by the Mann–Whitney U tests and Mann Kendall/seasonal Kendall tests, respectively. The null hypothesis may be rejected where these statistical tests return p-values < 0.05, but should be interpreted with caution where n < 9. The direction of the trend is followed by ‘?’ where there is low confidence in the significance of the trend. The annual Sen slope provides the magnitude of the identified trend, which is divided by the median groundwater nitrate over the monitoring period trend segment to yield the relative rate of change for comparison between Monitoring Stations (MSs). In previous studies, annual Sen slopes > 0.1 mg/L of N-NO3 yr−1 and relative slopes > 5% yr−1 have been adopted as thresholds representing environmentally relevant changes to groundwater quality corresponding to anthropogenic perturbations [53]. The slope direction likelihood provides a confidence level for the Sen slope [49]. Hyphens in Table 3 indicate there were insufficient data available to perform the Mann–Whitney U-test for seasonality, or where the magnitudes of Sen slope estimates were negligible.
Table 3.
Nitrate trend analysis results for the SEPA Ythan groundwater quality monitoring stations 1–7 (2009–2018).
MSs 1, 2, 5 and 7 featured decreasing long-term trends with reductions in nitrate > 0.15 mg/L of NO3-N yr−1 (>1.5% yr−1) whereas MSs 4 and 6 featured increasing long-term trends > 1.3 mg/L of NO3-N yr−1 (>0.9% yr−1). MS 3 not exhibit a statistically significant long-term trend. The decomposition of long-term trends into sub-trends typically yielded more statistically significant trend (Mann Kendall/seasonal Kendall) and seasonality (Mann–Whitney) statistics and contrasting Sen slope directions and magnitudes relative to the overall long-term trends, albeit at a reduced statistical power owing to the smaller sample size and reduced Sen slope direction likelihoods. Seasonality was determined to be significant (α < 0.05) for MS 1 for the entire monitoring period and the first sub-trend segments of MSs 3 and 4. For the remaining MSs, seasonality defined by the quarterly sampling frequency was not determined to be a significant component of groundwater nitrate time series. However, trend segments at the beginning of the monitoring period consistently featured smaller Mann–Whitney U test p-values relative to trend segments later into the monitoring period for all MSs.
The SEPA groundwater nitrate monitoring data are plotted as time series in Figure 5, accompanied by Sen slopes derived for the sub-trends and dominant land use, and temporal occurrence of severe flood and drought events. Here, the identified trends are classified as increasing, decreasing or nonsignificant on the basis of the Mann Kendall and Seasonal Kendall test results. Peaks in groundwater nitrate preceded the flood events of 2013 and 2016, and consecutive months of high effective rainfall. Likewise, the severe droughts of 2010 and 2018 were associated with groundwater nitrate peaks.
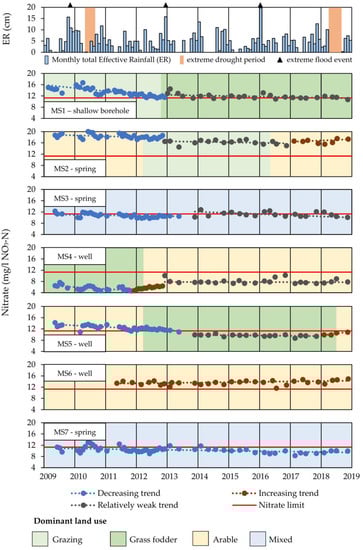
Figure 5.
Time series of monthly total effective rainfall with annotated extreme weather events (top) and groundwater nitrate observations within the SEPA Ythan groundwater quality Monitoring Stations (MS 1–7) (SEPA) annotated with identified sub-trends and interpretations of land use (bottom). Major vertical gridlines indicate the first day of the year.
4. Discussion
4.1. Spatial Distribution of Groundwater Nitrate and Hydrogeological Interpretation
The overall ubiquity of elevated groundwater nitrate was interpreted to reflect the dominance of agricultural land uses combined with widespread high groundwater vulnerability that was most consistent with the BGS groundwater vulnerability map (Figure 3a). The majority of dug well and spring PWS sampling points and SEPA MSs 1–7 were considered to represent groundwater abstractions from shallow aquifers, compromising coarse-textured glacial deposits and/or shallow weathered zones developed above rockhead [38] acting as a composite aquifer [32]. Some proportion of PWS boreholes were known to be screened to these shallow aquifers, as opposed to exclusively representing deeper fractured bedrock [17,38]. The shallow aquifers are reported to be unconfined and dominated by intergranular flow mechanisms [30,31,32], resulting in a high degree of connection with the surface and vulnerability to N loading, also supporting the maintenance of oxic conditions preventative of denitrification [60,61,62,63]. Groundwater flow pathways associated with these shallow aquifers were expected to be short, and discharged locally to streams, ditches and drains adjacent to the recharge areas.
The generally lower, and occasionally negligible groundwater nitrate concentrations associated with fractured bedrock aquifers (MSs 8–10) and PWS sampling points with low nitrate indicated the operation of groundwater flow pathways with higher capacities for denitrification relative to the superficial aquifers represented by dug wells and springs. The length of these flow pathways and role in diffuse nutrient pollution transport are poorly constrained, where the extent of fractured bedrock aquifer groundwater–surface water interaction was, and their hydraulic connection with superficial aquifers could be important in providing some moderation of water quality. Furthermore, the considerable flanks of relatively high-permeability glaciofluvial deposits along the River Ythan thalweg (Figure 2b) were poorly represented by available groundwater quality monitoring data (Figure 4f), which are expected to provide significant nitrate storage and contributions to river baseflow, and possible attenuation [60,64]. The high baseflow index (0.74) of the River Ythan [29,30] combined with the extremely damped streamflow stable isotope composition (2H, 18O) indicate a dominance of well-mixed catchment storage contributions to streamflow [65]. The significant volume of catchment storage is likely to result from a combination of various aquifer types that are not fully represented by current groundwater quality monitoring.
4.2. Groundwater Vulnerability
Both the BGS and DRASTIC groundwater vulnerability assessment methodologies consider the shallow depths to groundwater, and generally thin, permeable glacial deposits with an absence of clay minerals that typify the River Ythan region [32] to be associated with high groundwater vulnerability [17,18,19,20,41]. However, the DRASTIC map underestimates groundwater vulnerability in the River Ythan catchment area due to competing weightings of other physiographic factors in the overall risk calculation that were not considered in the BGS methodology (i.e., recharge, slope). This was most pronounced for the 2 km2 pixels of lower groundwater vulnerability present in Figure 3b corresponding to the resolution of the recharge layer (Table 2). The spatially distributed groundwater potential recharge map [43] used for the DRASTIC recharge layer was derived from the same digital elevation model and BGS products used in the other DRASTIC layers [41], suggesting some degree of parameter interaction may have caused disproportionate influences on the final vulnerability classification. Here, DRASTIC would have benefitted from a recharge layer derived from groundwater level time series or tracers, or substitution of recharge with effective rainfall.
The two maps produced contrasting vulnerability realisations across the N–S divide in diamicton coverage, due to the contrasting conceptual models underpinning their methodologies. The BGS map indicates higher groundwater vulnerability in the east of the catchment due to the absence of protective superficial cover overlying fractured bedrock aquifers with poor contaminant dispersion and dilution characteristics [18,19,20]. Meanwhile, the DRASTIC map indicates a lower groundwater vulnerability relative to the western region, due the assumption of low advective transport rates of contaminants within porosity/permeability crystalline bedrock relative to diamicton [39,40].
The DRASTIC groundwater vulnerability map could be improved by calibrating the layer weightings to the final vulnerability classifications fitted with observed groundwater nitrate concentrations to inform groundwater management at a higher spatial resolution provided by the BGS groundwater vulnerability map. This could assist in the design of PWS risk assessments, assignment of NVZ derogation permits, or spatially targeted nutrient management. Alternatively, the layer property ratings could be adjusted to represent current conceptual models of groundwater vulnerability applicable for Scotland [18,19,20,31].
4.3. Groundwater Nitrate Trends and Relation to Climate and Land Use Changes
The decreasing long-term trends observed at most SEPA groundwater quality MSs were interpreted as the receding limbs of groundwater nitrate peaks associated with pre-NVZ N applications. Likewise, the increasing long-term trend observed at MS 6 could represent the ascending limb of a groundwater nitrate peak, but in the absence of earlier monitoring data and groundwater age determination, it is uncertain as to whether the long-term trend corresponded to pre- or post-NVZ designation nutrient management practices. Nevertheless, a considerable proportion of groundwater nitrate observed at all monitoring points likely originated from post-NVZ N loadings, due to the high dynamicity observed to coincide with land use change and meteorological forcing.
Several of the groundwater quality MSs were typified by strong, decreasing sub-trends at the beginning of the monitoring period (2009–2013). This was interpreted to reflect the depletion of legacy pre-NVZ N in soils and aquifers associated with land manager compliance with NVZ rules, including restrictions in fertiliser applications and, for the River Ythan in particular, reductions in livestock numbers to meet manure storage requirements [66]. The early decreasing sub-trends were interrupted by abrupt trend reversals, step change, or transient increases in groundwater nitrate followed by a new state of dynamics (post 2013) characterised by changes in trend magnitude and seasonality behaviour.
Trend reversals and transient increases in groundwater nitrate were associated with the conversion of grassland systems to arable land uses (MSs 2, 4 and 5). This was interpreted as reflecting higher N fertiliser crop requirements and the ploughing of grassland soils to prepare seedbeds and facilitate drainage [67]. Organic matter may accumulate in soils under long-term grassland land uses, and proceed to be oxidized during ploughing/tilling, resulting in the conversion of immobilised/organic N to higher-mobility N species [68]. The subsequent regime of fertiliser applications, tillage and periods of bare soil cover following harvest may be responsible for the higher median nitrate concentrations for MSs 2, 4 and 6 under arable land uses [69]. A similar, albeit longer term pattern in increased groundwater nitrate loadings from conversion of grassland to cereal crop production was reported for the English Chalk aquifer, associated with a longer delay time due to a relatively thicker unsaturated zone and subsequently greater volume and residence time of N storage [68].
Grassland systems were systematically associated with decreasing groundwater nitrate trends (MSs 1 and 4) and lower median nitrate concentrations (MSs 4 and 5) relative to arable land uses [70]. Conversion of arable land uses to grassland at MSs 2 and 5 resulted in a step change decrease in groundwater nitrate [71], followed by a decreasing, albeit weak sub-trend. Nevertheless, it is important to note that to support livestock diets, cereals need to be grown elsewhere under arable land uses, and manure produced during the winter housing of livestock may be applied to arable crops. In addition, MS 1 demonstrates that groundwater recovery rates are inversely proportional to grassland management intensity [72,73]. MSs 3 and 7 were both springs with source areas dominated by mixed land uses, resulting in more complex N fate and transport behaviour that could not be constrained by the current level of investigation.
Cyclical variation in groundwater nitrate time series is characteristic for shallow groundwaters in temperate agricultural landscapes [68]. Typically, seasonal winter peaks correspond to seasonally high N leaching rates, due to the accumulation of residual/mineralised N in soils in excess of summer crop requirements coupled with low N immobilisation and biological uptake rates [27,68]. Seasonally high water tables, antecedent unsaturated zone moisture and effective rainfall facilitate the transport of residual N in soils and the unsaturated zone to groundwater [74]. Peaks in groundwater nitrate proceeding extreme flood events and periods of consecutive high effective rainfall are likely to be driven by the acceleration of winter N leaching mechanisms [74,75]. On these bases, the data gap following the extreme flood event of 2009 was also be expected to feature a similar peak in groundwater nitrate. The United Kingdom Climate Impacts Program (UKCIP) forecasts increased winter precipitation volume and intensity in northeast Scotland [76], which is expected to increase residual N leaching from soils over the winter. Warmer winter temperatures have been observed to reduce snowfall volume and favor snowmelt in the winter as opposed to spring, additionally contributing to winter recharge [77] further facilitating winter N leaching.
Summer groundwater nitrate peaks were typically associated with periods of extreme droughts, and were interpreted to result from contemporaneous fertiliser applications and N excretion by livestock grazing throughout the summer. Although effective rainfall rates were typically calculated to be negligible in the summer months, SEPA groundwater level monitoring for shallow aquifers demonstrates that groundwater recharge can occur in the summer in response to individual precipitation events [30]. Alternatively, summer groundwater nitrate peaks could also arise from upgradient groundwater flow pathway contributions featuring higher nitrate concentrations. Although groundwater recharge rates are expected to be significantly lower relative to the winter, small N contributions to groundwater may produce disproportionately larger impacts to groundwater quality, resulting from the limited dilutive capacity of aquifers in the summer due to seasonally low recharge rates and poor groundwater storage of diamicton and fractured bedrock aquifers [18,77]. The UKCIP forecasts increased summer temperatures and decreased summer precipitation volumes in northeast Scotland [76], increasing evapotranspiration rates and soil moisture deficits that will likely motivate increased groundwater abstractions for crop irrigation [21,77]. Enhanced N leaching to groundwater associated with irrigation return flows is well-documented [2], and irrigation presents additional stresses to groundwater-dependent ecosystems through reductions in groundwater discharge. Dry summers in Scotland are also associated with lower groundwater tables in subsequent winters [77], which could be interpreted to reduce the dilutive capacity of aquifers or increase opportunities for attenuation in the unsaturated zone, depending on the local hydrogeological setting and appropriate conceptual model [18,19,20,39]. Overall, the impacts of climate change are expected to increase the greywater footprint of agriculture by increasing water scarcity in the summer and the proportion of agricultural N lost from agroecosystems and leached to groundwater [13].
Despite the patterns observed between groundwater nitrate peaks and meteorological forcing, the majority of the Mann–Whitney U tests failed to return significant indications of seasonality defined by the quarterly sampling frequency. Here, dynamic factors such as the timing of nutrient applications and N storage in the unsaturated zone are likely candidates for driving seasonal dynamics that were not accounted for. However, the decreased significance of Mann–Whitney U tests reported for sub-trends later into the monitoring period may correspond to a decrease in seasonality associated with the flushing of pre-NVZ N from soils and the unsaturated zone over time, resulting in less N available for winter leaching [78]. Although some consistent patterns between meteorological events and groundwater nitrate were observed, groundwater nitrate dynamics contrast between monitoring sites, reflecting a combination of site-specific agricultural practices and intrinsic hydrogeological setting and corresponding groundwater vulnerability to contamination. The groundwater quality MSs with the most dynamic groundwater nitrate concentrations are expected to represent relatively younger groundwaters (weeks-months) with thin unsaturated zones, smaller contributory recharge areas and/or shorter groundwater flow pathways (<100 m) [31]; therefore, these MSs are more sensitive to land use and meteorological forcings. Meanwhile, the groundwater quality MSs with more damped nitrate variations may constitute older groundwater and/or feature groundwater flow pathway contributions from multiple recharge areas. It is expected that the most dynamic groundwaters feature higher vulnerability to nitrate contamination, but also demonstrate the greatest recovery rates, and vice versa.
4.4. Implications to Groundwater Management and Limitations of Study
The absence of groundwater quality monitoring data prior to NVZ designation limits our assessment of aquifer recovery to diffuse nitrate pollution, where the timing and magnitude of the groundwater nitrate peak remains unconstrained. Furthermore, the unknown hydrogeological setting and construction details for the individual SEPA PWS groundwater MSs limit interpretations of observed groundwater nitrate dynamics and the ability to draw comparisons between the different monitoring points (Figure 5). Likewise, the limited spatiotemporal resolution of aerial and satellite imagery and the limited accuracy of LCMs can only provide a general timing of land use changes. Regarding the trend analyses, a level of subjectivity was inherent when dividing the time series into discrete segments of contrasting trend and seasonality using semi-quantitative change point detection methods. Despite these shortcomings, the evaluation of groundwater nitrate status of the River Ythan catchment demonstrates a prevalence of groundwater nitrate in exceedance of the regulatory environmental limit, posing risks to human and ecological receptors, validating the current NVZ designation status.
NVZ designation is considered to be responsible for driving the long-term decreasing groundwater nitrate trends in the River Ythan catchment, demonstrated by several of the groundwater quality MSs (Table 3). However, some delay to groundwater recovery is indicated by the persistence of elevated groundwater nitrate throughout the catchment area (Figure 3) and increasing sub-trends at multiple groundwater quality MSs (Figure 5). This delay in groundwater recovery was considered to be associated with intensification of land management upgradient of MSs and the generally high vulnerability of groundwaters within the shallow aquifers (Figure 3).
Variable groundwater recovery rates reported for European NVZs are largely due to inconsistencies in NVZ designation criteria, and the design and enforcement of Nitrate Action Plans (NAPs) [79]. Here, the United Kingdom is relatively unique, due to the groundwater vulnerability mapping approach taken to designate NVZs due to a past scarcity and reliability of groundwater quality MSs that could not effectively represent the chemical status of all groundwater bodies present [17,38]. In contrast, Denmark was designated a national NVZ due to high groundwater nitrate that was evident throughout a pre-existing, high density groundwater quality monitoring network, and the importance of groundwater quality for public water supplies [9,80]. Following the successful implementation of NAPs, Denmark invested significant resources into spatially targeted nutrient management based on advanced groundwater vulnerability mapping approaches relying on conceptual models based on the results of groundwater nutrient management field studies and national, high resolution geophysical characterisation of groundwater systems [9,81,82,83,84].
The projected impacts of climate change on biodiversity and food security will require optimised approaches to nutrient management to achieve a sustainable balance between water quality and food production [80,85,86,87]. Spatially targeted nutrient management strategies may be appropriate for the River Ythan catchment, due to the strong heterogeneity in land use and hydrogeological setting. However, the resolution and accuracy of available environmental mapping products and the level of conceptual understanding for hydrogeological settings in northeast Scotland are unable to guide the required policy development and implementation at present.
In the absence of groundwater nutrient management studies in northeast Scotland, a series of recommendations are provided to support groundwater quality management, although their relative effectiveness will have to be verified in the field. Shallow groundwaters in the River Ythan catchment appear to be susceptible to high rates of N leaching following extreme flooding events and high effective rainfall during the NVZ closed period, regardless of land use (Figure 5). General strategies for reducing winter N leaching from arable land uses include earlier sowing of winter cereals, good post-harvest management practices, and strategic use of catch crops [88,89,90]. Oilseed rape and brassica crops are not represented by the SEPA Ythan groundwater quality monitoring network, thus the impacts of their exclusion from NVZ closed period fertiliser restrictions on groundwater quality are unknown [91].
The consistency of lower groundwater nitrate levels and stronger decreasing trends under grassland systems relative to arable land uses suggests that these are more sustainable land uses within a water quality perspective. The conversion of arable land uses to grassland has been demonstrated to reduce N leaching rates within two years [72], which was observed in MSs 2 and 5 (Figure 5). As grassland N leaching rates are proportional to management intensity [72,73] as indicated by MS 1, environmental subsidies to finance low-intensity grassland should be targeted in areas with the highest vulnerability to groundwater pollution. Otherwise, reseeding and fertiliser applications to grassland should be concentrated earlier into the growing year to minimise winter N losses [73,88,92]. However, this would need to be optimised due to the relatively wet springs in northeast Scotland, due to the seasonally high effective rainfall and higher associated risk of N leaching (Figure 5).
Conversion of grassland to arable agriculture is a likely driver for delayed groundwater recovery in the River Ythan catchment (Figure 5). Direct seed drilling of arable crops into grassland reduces soil organic N mineralisation and subsequent winter N leaching [90], and the ploughing of grassland in spring as opposed to autumn allows for greater uptake of mineralised N over the growing season [69]. The Nitrogen Risk Assessment Model for Scotland (NIRAMS) provides estimates of agricultural N exports to surface waters and groundwaters to support the Scottish government’s review of NVZ designations in addition to SEPA’s water quality monitoring [93]. NIRAMS assumes all organic or immobilised N is mineralised at the end of the growing season, and becomes available for leaching as residual N at a rate that is proportional to hydrological fluxes. Long-term organic N storage and carryover to successive years is unaccounted for [94], and so NIRAMS may overestimate grassland N losses on annual timescales and underestimate N leaching following conversion to arable land use [95]. Therefore, NIRAMS could be improved by incorporating a dynamic organic N compartment into the model structure.
Increased drought frequency and severity in northeast Scotland will increase the greywater footprint of agriculture, due to water scarcity and disproportionate impacts of contaminants on aquatic ecology. Therefore, the observed summer peaks in groundwater nitrate (Figure 5) warrant further investigation due to the heightened risks to receptors, and their discrepancies with traditional conceptual models applied in temperate climates that emphasise peak N leaching over the winter period. Careful consideration of further restrictions to fertiliser applications and irrigation are required to minimise impacts to agricultural enterprises that will be subject to drought-induced crop failure. Limiting tillage and N fertiliser applications to spring to ensure the biological uptake of N prior to drought risk periods is an uncertain strategy for the River Ythan, due to the seasonally high effective rainfall (Figure 5). In the summer of 2022, the SEPA issued emergency suspensions of surface water abstraction licenses to safeguard river flows, and disseminated advice on water-conserving irrigation practices and encouraged water-dependent industries to install boreholes for groundwater abstraction. N leaching and groundwater transport associated with irrigation return flows [2] and migration of shallow groundwater nitrate to deeper fractured bedrock aquifers due to increasing abstraction rates [96] may present future risks to Scottish PWS users and groundwater-dependent ecosystems.
5. Conclusions
Groundwater nitrate concentrations in the River Ythan catchment remain elevated following two decades of Nitrate Vulnerable Zone designation (NVZ). The majority of groundwater quality MSs demonstrated long-term decreasing trends over a ten-year monitoring period (2009–2018), and appear to be approaching equilibrium with the environmental regulatory limit. The strength of seasonality in groundwater nitrate concentrations decreased with median groundwater nitrate concentration associated with reduced N storage in soils and unsaturated zones. Increases in groundwater nitrate concentrations under NVZ rules were associated with intensification of management for grassland systems, and conversion to arable land uses. Seasonal peaks in groundwater nitrate preceded extreme flood events and consecutive months of high effective rainfall, along with prolonged summer droughts. As a result, climate change is expected to increase the greywater footprint of agriculture in northeast Scotland. The highly dynamic response of shallow groundwater chemical quality to environmental change implies high groundwater vulnerability. Further hydrogeological investigation and higher-resolution groundwater vulnerability mapping is recommended to inform agri-environmental management and facilitate the future achievement of water quality targets.
Author Contributions
Conceptualisation, H.J. and J.-C.C.; methodology, H.J., J.-C.C. and E.M.S.; investigation, H.J. and E.M.S.; data curation, H.J.; writing—original draft preparation, H.J.; writing—review and editing, J.-C.C., M.T., U.O., R.C. and C.S.; visualisation, H.J.; supervision, J.-C.C., U.O., R.C., M.T. and C.S.; project administration, H.J. and J.-C.C.; funding acquisition, J.-C.C., U.O. and R.C. All authors have read and agreed to the published version of the manuscript.
Funding
This research was supported by the Natural Environment Research Council and the QUADRAT Doctoral Training Partnership [NE/S007377/1].
Data Availability Statement
Groundwater quality monitoring data for the River Ythan catchment were provided by SEPA. Private Water Supply (PWS) chemical quality compliance certificates were obtained from the Aberdeenshire Council website. PWS groundwater nitrate sample results are not presented here to respect the privacy of PWS owners.
Acknowledgments
We would like to thank SEPA for groundwater quality monitoring and providing these data upon request, and the BGS for developing and providing various mapping products. We would also like to thank the residents of the River Ythan catchment for providing access to their private water supplies, and Michael McGibbon and David Galloway for analytical determination of nitrate for groundwater samples collected during this investigation.
Conflicts of Interest
The authors declare no conflict of interest. The funders had no role in the design of the study; in the collection, analyses, or interpretation of data; in the writing of the manuscript; or in the decision to publish the results.
References
- Singh, B.; Craswell, E. Fertilizers and nitrate pollution of surface and ground water: An increasingly pervasive global problem. SN Appl. Sci. 2021, 3, 518. [Google Scholar] [CrossRef]
- Puckett, L.J.; Tesoriero, A.J.; Dubrovsky, N.M. Nitrogen Contamination of Surficial Aquifers—A Growing Legacy. Environ. Sci. Technol. 2010, 45, 839–844. [Google Scholar] [CrossRef]
- Stayner, L.T.; Schullehner, J.; Semark, B.D.; Jensen, A.S.; Trabjerg, B.B.; Pedersen, M.; Olsen, J.; Hansen, B.; Ward, M.H.; Jones, R.R.; et al. Exposure to nitrate from drinking water and the risk of childhood cancer in Denmark. Environ. Int. 2021, 155, 106613. [Google Scholar] [CrossRef]
- Maier, G.; Nimmo-Smith, R.J.; Glegg, G.A.; Tappin, A.D.; Worsfold, P.J. Estuarine eutrophication in the UK: Current incidence and future trends. Aquat. Conserv. Mar. Freshw. Ecosyst. 2009, 19, 43–56. [Google Scholar] [CrossRef]
- Lloyd, C.E.M.; Johnes, P.J.; Freer, J.E.; Carswell, A.M.; Jones, J.I.; Stirling, M.W.; Hodgkinson, R.A.; Richmond, C.; Collins, A.L. Determining the sources of nutrient flux to water in headwater catchments: Examining the speciation balance to inform the targeting of mitigation measures. Environ. Sci. Technol. 2019, 648, 1179–1200. [Google Scholar] [CrossRef]
- Strachan, N.; Rotariu, O.; Neill, A.; Allan, R.; Avery, L.; Akoumianaki, I.; Coull, M.; Pagaling, E.; Hansraj, F.; McDonald, E.; et al. The Epidemiology and Disease Burden Potential Relating to Private Water Supplies in Scotland; Report CRW2014_08; Scotland’s Centre of Expertise for Waters (CREW): Aberdeen, UK, 2021; Available online: https://www.crew.ac.uk/publication/epidemiology-and-disease-burden-potential-relating-private-water-supplies-scotland (accessed on 2 March 2023).
- Leip, A.; Billen, G.; Garnier, J.; Grizzetti, B.; Lassaletta, L.; Reis, S.; Simpson, D.; Sutton, M.A.; de Vries, W.; Weiss, F.; et al. Impacts of European livestock production: Nitrogen, sulphur, phosphorus and greenhouse gas emissions, land-use, water eutrophication and biodiversity. Environ. Res. Lett. 2015, 10, 115004. [Google Scholar] [CrossRef]
- Pretty, J.N.; Mason, C.F.; Nedwell, D.B.; Hine, R.E.; Leaf, S.; Dils, R. Environmental costs of freshwater eutrophication in England and Wales. Environ. Sci. Technol. 2003, 32, 201–208. [Google Scholar] [CrossRef]
- Thomsen, R.; Søndergaard, V.H.; Sørensen, K.I. Hydrogeological mapping as a basis for establishing site-specific groundwater protection zones in Denmark. Hydrogeol. J. 2004, 12, 550–562. [Google Scholar] [CrossRef]
- De Vito, L.; Fairbrother, M.; Russel, D. Implementing the Water Framework Directive and Tackling Diffuse Pollution from Agriculture: Lessons from England and Scotland. Water 2020, 12, 244. [Google Scholar] [CrossRef]
- Dunn, S.M.; Darling, W.G.; Birkel, C.; Bacon, J.R. The role of groundwater characteristics in catchment recovery from nitrate pollution. Hydrol. Res. 2012, 43, 560–575. [Google Scholar] [CrossRef]
- Worrall, F.; Spencer, E.; Burt, T.P. The effectiveness of nitrate vulnerable zones for limiting surface water nitrate concentrations. J. Hydrol. 2009, 370, 21–28. [Google Scholar] [CrossRef]
- Stuart, M.E.; Gooddy, D.C.; Bloomfield, J.P.; Williams, A.T. A review of the impact of climate change on future nitrate concentrations in groundwater of the UK. Sci. Total. Environ. 2011, 409, 2859–2873. [Google Scholar] [CrossRef]
- Novo, P. Accounting for the Assimilative Capacity of Water Systems in Scotland. J. Water 2017, 9, 559. [Google Scholar] [CrossRef]
- Bowes, M.; Charlton, M.; Hutchins, M.; Bachiller-Jareno, N.; Orr, H. Climate Change and Eutrophication Risk Thresholds in English Rivers; EA Report SC140013/R2; Environment Agency: Bristol, UK, 2019. Available online: https://www.gov.uk/government/publications/eutrophication-risk-in-english-rivers-under-climate-change (accessed on 6 February 2023).
- Scottish Environmental Protection Agency (SEPA). An Introduction to the Significant Water Management Issues in the Scotland River Basin District; Scottish Environmental Protection Agency: Stirling, UK, 2019. Available online: https://www.sepa.org.uk/media/38319/an-introduction-to-the-significant-water-management-issues-in-the-scotland-river-basin-district.pdf (accessed on 6 February 2023).
- Ball, D.F.; MacDonald, A.M. Groundwater Nitrate Vulnerable Zones for Scotland; Commissioned Report, CR/01/250N; British Geological Survey: Nottingham, UK, 2001. Available online: https://nora.nerc.ac.uk/id/eprint/501049/ (accessed on 19 March 2023).
- Ball, D.F.; MacDonald, A.M.; Ó Dochartaigh, B.É.; del Rio, M.; Fitzsimons, V.; Auton, C.A.; Lilly, A. Development of a Groundwater Vulnerability Screening Methodology for the Water Framework Directive; Scotland & Northern Ireland Forum for Environmental Research (SNIFFER) Report; Edinburgh Climate Change Institute: Edinburgh, UK, 2004; Available online: https://www.sniffer.org.uk/wfd28-pdf (accessed on 20 March 2023).
- Ó Dochartaigh, B.É.; Ball, D.F.; MacDonald, A.M.; Lilly, A.; Fitzsimons, V.; del Rio, M.; Auton, C.A. Mapping groundwater vulnerability in Scotland: A new approach for the Water Framework Directive. Scot. J. Geol. 2005, 41, 21–30. [Google Scholar] [CrossRef]
- Ó Dochartaigh, B.É.; Doce, D.D.; Rutter, H.K.; MacDonald, A.M. User Guide: Groundwater Vulnerability (Scotland) GIS Dataset, Version 2; Open Report OR/11/064; British Geological Survey: Nottingham, UK, 2011; 25p. Available online: https://nora.nerc.ac.uk/id/eprint/17084/ (accessed on 2 March 2023).
- Scottish Environmental Protection Agency. The River Basin Management Plan for the Scotland River Basin District 2021–2027; Scottish Environmental Protection Agency: Stirling, UK, 2021. Available online: https://www.sepa.org.uk/media/594088/211222-final-rbmp3-scotland.pdf (accessed on 2 March 2022).
- Arauzo, M.; Valladolid, M.; García, G.; Andries, D.M. N and P behaviour in alluvial aquifers and in the soil solution of their catchment areas: How land use and the physical environment contribute to diffuse pollution. Sci. Total. Environ. 2022, 804, 150056. [Google Scholar] [CrossRef]
- Orellana-Macais, J.M.; Merchán, D.; Causapé, J. Evolution and assessment of a nitrate vulnerable zone over 20 years: Gallocanta groundwater body (Spain). Hydrogeol. J. 2020, 28, 2207–2221. [Google Scholar] [CrossRef]
- Gomes, E.; Antunes, I.M.H.R.; Leitão, B. Groundwater management: Effectiveness of mitigation measures in nitrate vulnerable zones—A Portuguese case study. Groundw. Sustain. Dev. 2023, 21, 100899. [Google Scholar] [CrossRef]
- Bibby, J.S.; Douglas, H.A.; Thomasson, A.J.; Robertson, J.S. Land Capability Classification for Agriculture; Macaulay Institute for Soil Research: Aberdeen, UK, 1982; Available online: https://www.hutton.ac.uk/sites/default/files/files/soils/LAND%20CAPABILITY%20CLASSIFICATION%20FOR%20AGRICULTURE.PDF (accessed on 19 March 2023).
- Raffaelli, D.; Hull, S.; Milne, H. Long-term changes in nutrients, weed mats and shorebirds in an Estuarine System. Cah. Biol. Mar. 1989, 30, 259–270. [Google Scholar]
- MacDonald, A.M.; Edwards, A.C.; Pugh, K.B.; Balls, P.W. Soluble nitrogen and phosphorus in the River Ythan system, U.K.: Annual and seasonal trends. Water Res. 1995, 29, 837–846. [Google Scholar] [CrossRef]
- European Union. The River of LIFE: A Report on the Actions of the Ythan Project 2001–2005. European Commission LIFE Public Database (LIFE00 ENV/UK/00089). 2005. Available online: https://webgate.ec.europa.eu/life/publicWebsite/project/details/1770 (accessed on 19 March 2023).
- Sample, J.; Dunn, S.M. Trend Analysis of Nitrate Concentrations in the Ythan; Report CRW2013/2; Scotland’s Centre of Expertise for Waters (CREW): Aberdeen, UK, 2014. [Google Scholar] [CrossRef]
- SEPA Ythan Project Group. Nitrates and Pesticides Impacts and Pressures in the Ythan Catchment. Volume 2: Technical Report; Scottish Environmental Protection Agency: Stirling, UK, 2011.
- Ó Dochartaigh, B.É.; Macdonald, A.M.; Fitzsimons, V.; Ward, R. Scotland’s Aquifers and Groundwater Bodies; Report (OR/15/028); British Geological Survey Open: Nottingham, UK, 2015; Unpublished. Available online: https://nora.nerc.ac.uk/id/eprint/511413/ (accessed on 19 March 2023).
- Merritt, J.W.; Auton, C.A.; Connell, E.R.; Hall, A.M.; Peacock, J.D. Cainozoic Geology and Landscape Evolution of North-East Scotland; British Geological Survey: Nottingham, UK, 2003. Available online: https://earthwise.bgs.ac.uk/index.php/Cainozoic_geology_and_landscape_evolution_of_north-east_Scotland._Memoir_of_the_British_Geological_Survey,_sheets_66E,_67,_76E,_77,_86E,_87W,_87E,_95,_96W,_96E_and_97_(Scotland) (accessed on 2 March 2023).
- Gunn, A.G.; Mendum, J.R.; Thomas, C.W. Geology of the Huntly and Turriff Districts. Sheet Description for the 1:50,000 Geological Sheets 86W (Huntly) and 86E (Turriff) (Scotland); Open Report (OR/15/026); British Geological Survey: Nottingham, UK, 2015. Available online: https://nora.nerc.ac.uk/id/eprint/512185 (accessed on 19 March 2023).
- Glentworth, R.; Dion, H.G. The association or hydrologic sequence in certain soils of the Podzolic zone of the NE Scotland. Eur. J. Soil. Sci. 1950, 1, 35–49. [Google Scholar] [CrossRef]
- Hay, R.K.M.; Russell, G.; Edwards, T.W. Crop Production in the East of Scotland; Institute for Ecology and Resource Management, University of Edinburgh: Edinburgh, UK, 2000. Available online: https://www.sasa.gov.uk/document-library/crop-production-east-scotland (accessed on 19 March 2023).
- British Geological Survey. Bedrock Aquifer Productivity Scotland Version 2; British Geological Survey: Nottingham, UK, 2015. [CrossRef]
- British Geological Survey. Superficial Aquifer Productivity Scotland Version 2; British Geological Survey: Nottingham, UK, 2015; (Dataset). [CrossRef]
- MacDonald, A.M.; Griffiths, K.J.; Ó Dochartaigh, B.É.; Lilly, A.; Chilton, P.J. Scotland’s Groundwater Monitoring Network: Its Effectiveness for Monitoring Nitrate; Commissioned Report No. CR/05/205N; British Geological Survey: Nottingham, UK, 2005; 63p, Unpublished. Available online: https://nora.nerc.ac.uk/id/eprint/11324/ (accessed on 2 March 2023).
- Aller, L.; Bennett, T.; Lehr, J.H.; Petty, R.J. DRASTIC: A Standardized System for Evaluating Ground Water Pollution Potential Using Hydrogeologic Settings; U.S. Environmental Protection Agency: Oklahoma City, OK, USA, 1987. Available online: https://cfpub.epa.gov/si/si_public_record_report.cfm?Lab=NRMRL&dirEntryId=126933 (accessed on 2 March 2023).
- Luoma, S.; Ikonen, I. Vulnerability Assessment of the Shallow Groundwater in Finland; Geological Survey of Finland Public Report (50403-30112); Geological Survey of Finland: Espoo, Finland, 2020. Available online: https://tupa.gtk.fi/raportti/arkisto/35_2020.pdf (accessed on 20 March 2023).
- Simpson, E.M. Mapping Groundwater Vulnerability of the Ythan Catchment. Bachelor’s Thesis, University of Aberdeen, Aberdeen, UK, January 2022. [Google Scholar]
- Boorman, D.B.; Hollis, J.M.; Lilly, A. Hydrology of Soil Types: A Hydrologically-Based Classification of the Soils of the United Kingdom; Institute of Hydrology Report No. 126; Institute of Hydrology: Wallingford, UK, 1995; Available online: https://nora.nerc.ac.uk/id/eprint/7369/ (accessed on 19 March 2021).
- Mansour, M.M.; Wang, L.; Whiteman, M.; Hughes, A.G. Estimation of spatially distributed groundwater potential recharge for the United Kingdom. Q. J. Eng. Geol. Hydrogeol. 2018, 51, 247–263. [Google Scholar] [CrossRef]
- British Geological Survey. BGS Geology—50k (DiGMapGB-50) Bedrock Version 8; British Geological Survey: Nottingham, UK, 2015. [CrossRef]
- British Geological Survey. BGS Geology—50k (DiGMapGB-50) Superficial Version 8; British Geological Survey: Nottingham, UK, 2015. [CrossRef]
- Soil Survey of Scotland Staff. Digital Soil Map of Scotland, Scale 1:250,000; Macaulay Institute of Soil Research: Aberdeen, Scotland, 1981. Available online: https://soils.environment.gov.scot/maps/soil-maps/national-soil-map-of-scotland/ (accessed on 19 March 2023).
- Ordnance Survey. MasterMap Topography Layer; EDINA Digimap Service; University of Edinburgh: Edinburgh, UK, 2018; Available online: http://digimap.edina.ac.uk/ (accessed on 19 March 2023).
- Lawley, R.; Garcia-Bajo, M. The National Superficial Deposit Thickness Model (SDTM V5): A User Guide; Internal Report (OR/09/049); British Geological Survey: Nottingham, UK, 2010. Available online: https://nora.nerc.ac.uk/id/eprint/8279 (accessed on 21 March 2023).
- British Geological Survey. BGS Permeability Index Version 8; British Geological Survey: Nottingham, UK, 2021. [CrossRef]
- Jowett, I. TimeTrends—Trend Analysis and Equivalence Testing for Environmental Data Version 9.0; Jowett Consulting Ltd.: Tairua, New Zealand, 2022; Available online: https://www.jowettconsulting.co.nz/home/time-1 (accessed on 2 March 2023).
- Frollini, E.; Preziosi, E.; Calace, N.; Guerra, M.; Guyennon, N.; Marcaccio, M.; Ghergo, S. Groundwater quality trend and trend reversal assessment in the European Water Framework Directive context: An example with nitrates in Italy. Environ. Sci. Pollut. Res. 2021, 28, 22092–22104. [Google Scholar] [CrossRef] [PubMed]
- Stuart, M.E.; Chilton, P.J.; Kinniburgh, D.G.; Cooper, D.M. Screening for long-term trends in groundwater nitrate monitoring data. Q. J. Eng. Geol. Hydrogeol. 2007, 40, 361–376. [Google Scholar] [CrossRef]
- Baker, T. Groundwater Nitrate Trend Analysis Report for Data Collected between 2003 and 2016. Greater Wellington Regional Council, New Zealand. 2017. Available online: https://www.gw.govt.nz/assets/Documents/2022/05/Groundwater-Nitrate-Trend-Analysis-Report-2017.pdf (accessed on 6 April 2023).
- Brown, M.J.; Robinson, E.L.; Kay, A.L.; Chapman, R.; Bell, V.A.; Blyth, E.M. Potential Evapotranspiration Derived from HadUK-Grid 1km Gridded Climate Observations 1969–2021; (Hydro-PE HadUK-Grid); NERC EDS Environmental Information Data Centre: Lancaster, UK, 2022. [Google Scholar] [CrossRef]
- Met Office; Hollis, D.; McCarthy, M.; Kendon, M.; Legg, T. HadUK-Grid Gridded Climate Observations on a 1km Grid over the UK, v1.1.0.0 (1836–2021); NERC EDS Centre for Environmental Data Analysis: Chilton, UK, 2022. [Google Scholar] [CrossRef]
- Google Earth v. 7.3.6.9345. 2022. Available online: https://www.google.com/intl/en_uk/earth/versions/ (accessed on 20 March 2023).
- EDINA Environment Digimap Service. Land Cover map of Great Britain 2007, 2015, 2017, 2018. EDINA Environment Digimap Service. 2021. Available online: https://digimap.edina.ac.uk (accessed on 20 March 2023).
- Esri; USGS; AWS; NASA. Landsat Explorer App. ArcGIS Online Web Application (5670f96c2d0d4ad8ac549e092d6c2bd4). 2020. Available online: https://livingatlas2.arcgis.com/landsatexplorer/ (accessed on 19 March 2023).
- Dubrovsky, N.M.; Hamilton, P.A. The Quality of Our Nation’s Water: Nutrients in the Nation’s Streams and Groundwater; National Findings and Implications; National Water-Quality Assessment Program Report USGS; United States Geological Survey (USGS): Reston, VA, USA, 2010. Available online: https://pubs.usgs.gov/fs/2010/3078/ (accessed on 20 March 2023).
- Smedley, P.L.; Ó Dochartaigh, B.É.; MacDonald, A.M.; Darling, W.G. Baseline Scotland: Groundwater chemistry of Aberdeenshire; Open Report OR/09/065; British Geological Survey: Nottingham, UK, 2009; Unpublished. Available online: https://nora.nerc.ac.uk/id/eprint/9161/ (accessed on 2 March 2023).
- Orr, A.; Nitsche, J.; Archbold, M.; Deakin, J.; Ofterdinger, U.; Flynn, R. The influence of bedrock hydrogeology on catchment-scale nitrate fate and transport in fractured aquifers. Sci. Total. Environ. 2016, 569–570, 1040–1052. [Google Scholar] [CrossRef]
- Wolters, T.; Bach, T.; Eisele, M.; Eschenbach, W.; Kunkel, R.; McNamara, I.; Well, R.; Wendland, F. The derivation of denitrification conditions in groundwater: Combined method approach and application for Germany. Ecol. Indic. 2022, 144, 109564. [Google Scholar] [CrossRef]
- Knoll, L.; Häußermann, U.; Breuer, L.; Bach, M. Spatial distribution of integrated nitrate reduction across the unsaturated zone and the groundwater body in Germany. Water 2020, 12, 2456. [Google Scholar] [CrossRef]
- Haslauder, C.P. Hydrogeologic Analysis of a Complex Aquifer System and Impacts of Changes in Agricultural Practices on Nitrate Concentrations in a Municipal Well Field Woodstock, Ontario. Master’s Thesis, University of Waterloo, Waterloo, ON, Canada, 2005. Available online: https://uwspace.uwaterloo.ca/handle/10012/1223 (accessed on 2 March 2023).
- Tetzlaff, D.; Soulsby, C.; Hrachowitz, M.; Speed, M. Relative influence of upland and lowland headwaters on the isotope hydrology and transit times of larger catchments. J. Hydrol. 2011, 400, 438–447. [Google Scholar] [CrossRef]
- Macgregor, C.J.; Warren, C.R. Adopting sustainable farm management practices within a nitrate vulnerable zone in Scotland: The view from the farm. Agric. Ecosyst. Environ. 2006, 113, 108–119. [Google Scholar] [CrossRef]
- Whitmore, A.P.; Bradbury, N.J.; Johnson, P.A. The potential of ploughed grassland to nitrate leaching. Agric. Ecosyst. Environ. 1992, 3–4, 221–223. [Google Scholar] [CrossRef]
- Foster, S.S.D. Assessing and Controlling the Impacts of Agriculture on Groundwater: From Barley Barons to Beef Bans. Q. J. Eng. Geol. Hydrogeol. 2000, 33, 253–280. [Google Scholar] [CrossRef]
- Hatch, D.; Easson, L.; Goulding, K.; Haygarth, P.; Shepherd, M.; Watson, C. Grassland resowing and grass-arable rotations in the United Kingdom: Agricultural and environmental issues. In Crop Rotations, International Workshop on Agricultural and Environmental Issues; Wageningen University: Wageningen, The Netherlands, 2002; pp. 93–104. Available online: https://library.wur.nl/WebQuery/wurpubs/fulltext/22788#page=101 (accessed on 4 April 2023).
- Smit, H.P.J.; Reinsch, T.; Kluß, C.; Loges, R.; Taube, F. Very Low Nitrogen Leaching in Grazed Ley-Arable-Systems in Northwest Europe. Agronomy 2021, 11, 2155. [Google Scholar] [CrossRef]
- Shepherd, M.A.; Hatch, D.J.; Jarvis, S.C.; Bhogal, A. Nitrate leaching from reseeded pasture. Soil Use Manag. 2001, 17, 97–105. [Google Scholar] [CrossRef]
- Trolove, S.; Thomas, S.; van der Klei, G.; Beare, M.; Cichota, R.; Meenken, E. Nitrate leaching losses during pasture renewal—Effects of treading, urine, forages and tillage. Sci. Total. Environ. 2019, 651, 1819–1829. [Google Scholar] [CrossRef] [PubMed]
- Seidal, K.; Kayser, M.; Müller, J.; Isslelstein, J. The effect of grassland renovation on soil mineral nitrogen and on nitrate leaching during winter. J. Plant Nutr. Soil Sci. 2009, 172, 512–519. [Google Scholar] [CrossRef]
- Zheng, W.; Wang, S.; Tan, K.; Lei, Y. Nitrate accumulation and leaching potential is controlled by land-use and extreme precipitation in a headwater catchment in the North China Plain. Sci. Total. Environ. 2020, 707, 136168. [Google Scholar] [CrossRef]
- Zheng, W.; Wang, S. Extreme precipitation accelerates the contribution of nitrate sources from anthropogenetic activities to groundwater in a typical headwater area of the North China Plain. J. Hydrol. 2021, 603, 127110. [Google Scholar] [CrossRef]
- Hulme, M.; Jenkins, G.J.; Lu, X.; Turnpenny, J.R.; Mitchell, T.D.; Jones, R.G.; Low, J.; Murphey, J.M.; Hassell, D.; Boorman, P.; et al. Climate Change Scenarios for the United Kingdom: The UKCIP02 Scientific Report; Centre for Climate Change Research, School of Environmental Sciences, University of East Anglia: Norwich, UK, 2002; 120p, Available online: https://artefacts.ceda.ac.uk/badc_datadocs/link/UKCIP02_tech.pdf (accessed on 2 March 2023).
- Rivington, M.; Akoumianaki, I.; Coill, M. Private Water Supplies and Climate Change the Likely Impacts of Climate Change (Amount, Frequency and Distribution of Precipitation), and the Resilience of Private Water Supplies; CRW2018_05; Scotland’s Centre of Expertise for Waters (CREW): Aberdeen, UK, 2020; Available online: https://www.crew.ac.uk/publication/PWS-water-scarcity (accessed on 2 March 2023).
- Begum, S.; Adnan, M.; McClean, C.J.; Cresser, M.S. A critical re-evaluation of controls on spatial and seasonal variations in nitrate concentrations in river waters throughout the River Derwent catchment in North Yorkshire, UK. Environ. Monit. Assess. 2016, 188, 305. [Google Scholar] [CrossRef]
- European Commission. Report on the Implementation of Council Directive 91/676/EEC Concerning the Protection of Waters against Pollution Caused by Nitrates from Agricultural Sources Based on Member State Reports for the Period 2012–2015. European Commission, Brussels. 2018. Available online: https://eur-lex.europa.eu/legal-content/en/ALL/?uri=CELEX%3A52018DC0257 (accessed on 13 April 2023).
- Ortmeyer, F.; Hansen, B.; Banning, A. Groundwater nitrate problem and countermeasures in strongly affected EU countries—A comparison between Germany, Denmark and Ireland. Grundwasser 2022, 28, 3–22. [Google Scholar] [CrossRef]
- Petersen, R.J.; Blicher-Mathiesen, G.; Rolighed, J.; Andersen, H.E.; Kronvang, B. Three decades of regulation of agricultural nitrogen losses: Experiences from the Danish Agricultural Monitoring Program. Sci. Total. Environ. 2021, 787, 147619. [Google Scholar] [CrossRef]
- Hashemi, F.; Olesen, J.E.; Hansen, A.L.; Børgesen, C.D.; Dalgaard, T. Spatially differentiated strategies for reducing nitrate loads from agriculture in two Danish catchments. J. Environ. Manag. 2018, 208, 77–91. [Google Scholar] [CrossRef]
- Hansen, B.; Thorling, L.; Kim, H.; Blicher-Mathiesen, G. Long-term nitrate response in shallow groundwater to agricultural N regulations in Denmark. J. Environ. Manag. 2019, 240, 66–74. [Google Scholar] [CrossRef] [PubMed]
- Hansen, E.M.; Munkholm, L.J.; Olesen, J.E.; Melander, B. Nitrate Leaching, Yields and Carbon Sequestration after Noninversion Tillage, Catch Crops, and Straw Retention. J. Environ. Qual. 2015, 44, 868–881. [Google Scholar] [CrossRef] [PubMed]
- Kelly, P.; Shalloo, L.; Wallace, M.; Dillon, P. The Irish dairy industry—Recent history and strategy, current state and future challenges. Int. J. Dairy Technol. 2020, 73, 309–323. [Google Scholar] [CrossRef]
- Buckley, C.; Carney, P. The potential to reduce the risk of diffuse pollution from agriculture while improving economic performance at farm level. Environ. Sci. Policy 2013, 25, 118–126. [Google Scholar] [CrossRef]
- van den Berg, L.M.; Dingkuhn, E.L.; Meehan, N.; O’Sullivan, L. Investigating Bottlenecks Hampering the Adoption of Water Quality-Enhancing Practices for Sustainable Land Management in Ireland. 2023. Available online: https://ssrn.com/abstract=4358520 (accessed on 6 April 2023).
- Vogeler, I.; Jensen, J.L.; Thomsen, I.K.; Labouriau, R.; Hansen, E.M. Fertiliser N rates interact with sowing time and catch crops in cereals and affect yield and nitrate leaching. Eur. J. Agron. 2021, 124, 126244. [Google Scholar] [CrossRef]
- De Waele, J.; D’Haene, K.; Salomez, J.; Hofman, G.; De Neve, S. Simulating the environmental performance of post-harvest management measures to comply with the EU Nitrates Directive. J. Environ. Manag. 2017, 187, 513–526. [Google Scholar] [CrossRef]
- Jarvis, S.C. The Coates Farm Study II: Nitrogen Flows in a Changing Mixed Farming System; 1st Annual Report to DEFRA NT1853; Rothamsted Research: Harpenden, UK, 2003; Unpublished; 26p. [Google Scholar]
- Ryan, F.R. The Opportunities to Understand and Improve Nutrient Assessment within a Scottish Nitrate Vulnerable Zone. Ph.D. Thesis, University of Edinburgh, Edinburgh, UK, November 2020. Available online: https://era.ed.ac.uk/handle/1842/38210?show=full (accessed on 3 March 2023).
- Maris, S.C.; Abalos, D.; Capra, F.; Moscatelli, G.; Scaglia, F.; Reyes, G.E.C.; Ardenti, F.; Boselli, R.; Ferrani, A.; Mantovi, P.; et al. Strong potential of slurry application timing and method to reduce N losses in a permanent grassland. Agric. Ecosyst. Environ. 2021, 311, 107329. [Google Scholar] [CrossRef]
- Scottish Environmental Protection Agency. Nitrate Vulnerable Zones in Scotland Review of Designations 2013 Methodology Report; Scottish Environmental Protection Agency: Stirling, UK, 2013.
- Dunn, S.M.; Vinten, A.J.A.; Lilly, A.; DeGroote, J.; Sutton, M.A.; McGechan, M. Nitrogen Risk Assessment Model for Scotland: I. Nitrogen leaching. Hydrol. Earth Syst. Sci. 2004, 8, 191–204. [Google Scholar] [CrossRef]
- Conrad, Y.; Fohrer, N. Modelling of nitrogen leaching under a complex winter wheat and red clover crop rotation in a drained agricultural field. Phys. Chem. Earth 2009, 34, 530–540. [Google Scholar] [CrossRef]
- Landon, M.K.; Green, C.T.; Belitz, K.; Singleton, M.J.; Esser, B.K. Relations of hydrogeologic factors, groundwater reduction-oxidation conditions, and temporal and spatial distributions of nitrate, Central-Eastside San Joaquin Valley, California, USA. Hydrogeol. J. 2011, 19, 1203–1224. [Google Scholar] [CrossRef]
Disclaimer/Publisher’s Note: The statements, opinions and data contained in all publications are solely those of the individual author(s) and contributor(s) and not of MDPI and/or the editor(s). MDPI and/or the editor(s) disclaim responsibility for any injury to people or property resulting from any ideas, methods, instructions or products referred to in the content. |
© 2023 by the authors. Licensee MDPI, Basel, Switzerland. This article is an open access article distributed under the terms and conditions of the Creative Commons Attribution (CC BY) license (https://creativecommons.org/licenses/by/4.0/).