Abstract
The excessive excretion of nitrogen (N) by farm animals can pose severe environmental risks. In this study, near-infrared reflectance (NIR) spectroscopy (NIRS) was used to explore the feasibility of developing a real-time in situ monitoring tool for fecal N excretion in rabbits. A total of 70 feed and 282 fecal samples from an in vivo digestibility experiment were used. Feed and fecal NIR spectra were employed to develop chemometric models using modified partial least squares (MPLS) for feed and feces, and artificial neural networks (ANN) for feces to predict dietary and fecal N content and fecal N digestibility. Very good accuracy was achieved in predicting feed N (R2val = 0.96; standard error of prediction, SEP = 0.15) and fecal N (R2val = 0.88; SEP = 0.44) content, whereas N digestibility models from wet fecal spectra had a relatively low precision (R2val = 0.70; SEP = 0.018) with MPLS methodology. In contrast, ANNs yielded more robust prediction models for fecal (R2val = 0.98; SEP = 0.25) N content and N digestibility (R2val = 0.91; SEP = 0.012) using wet feces. In conclusion, NIRS calibration with ANNs can be a suitable tool for monitoring the environmental load of N with high precision and accuracy.
1. Introduction
Fecal nitrogen (N) excretions from animal farms have significant and far-reaching impacts on the environment. The vast amounts of fecal matter, which are rich in N compounds, may be a major source of environmental damage, particularly in areas with high animal density. When not properly managed, fecal N can leach into groundwater, leading to nitrate contamination of drinking water sources, or other surface waters thereby causing eutrophication, harmful algal blooms, and disruptions to aquatic ecosystems [1]. It can also be a significant source of nitrous oxide emissions [2], which is a potent contributor to global warming [3,4], and can release ammonia into the atmosphere, leading to air quality concerns and potential health risks for both animals and nearby human populations [5].
Several studies have explored the dispersion and determinants of N excretions within livestock chains [6,7,8,9,10]. Taken together, these works point to the fact that feed formulation (and its associated impact on N utilization) is one of the key factors affecting N excretion from animal farms. Formulating diets to improve N utilization is a crucial step to mitigate N-related environmental pollution. Animals fed diets with high N digestibility convert a larger proportion of N into useful protein for growth and reproduction, and this can result in less N being excreted [8], thereby reducing the overall environmental load of N.
Having a rapid method to accurately estimate dietary N digestibility in the farms would be advantageous [11] for monitoring the environmental load of N. Regardless of the formulation, N digestibility can exhibit significant variability from farm to farm owing to a multitude of factors related to the animal itself (genetics, gender, and weight), to management and housing conditions (temperature and stocking density), and to the diet (ingredient and nutrient composition and physical form) [12]. The use of in vivo trials in the determination of digestibility, or of feed tables that provide average digestible N values for each feed ingredient, are not suitable for monitoring N digestibility in situ; the trials are both time-consuming and costly, and the tables are not practically useful if the ingredient composition of a compound feed is not known [13].
A recognized and frequently employed technique for the fast assessment of feed digestibility is near-infrared reflectance spectroscopy (NIRS) [14,15]. Research conducted in poultry [16,17], pigs [13,18,19,20], ruminants [21], and rabbits [11,22] revealed that NIRS calibrations utilizing fecal spectra can effectively predict variations in N digestibility within animals with variable levels of precision. The results of these studies should be handled with care because (a) with minor exceptions [18,20], the quality of the prediction models was based on the calibration and cross-validation statistics only, without carrying out an independent validation and (b) prediction models were developed using the classical multiple linear regression (partial least squares) methodology, which is not always the most suitable option due to extrinsic and intrinsic deviations from the linearity that it is traditionally assumed in NIRS [23]. Approaches based on artificial intelligence, such as artificial neural networks (ANN) can be employed to process NIRS spectra [24] and produce more reliable predictions because they address the frequently observed non-linear relationships between absorption in the near-infrared spectral region and the target analytical parameter [23]. The ANN models have been successfully used in several feedstuff evaluation approaches in animal nutrition [24,25,26,27]. Nonetheless, the use of ANNs in the development of models predicting nutrient digestibility using fecal spectra has not been investigated until now. It must also be underlined that all the techniques developed up to today have employed dried and finely ground fecal samples to minimize light scattering in NIRS instruments.
The objective of the present study was to use near-infrared reflectance (NIR) spectroscopy (NIRS) to explore the feasibility of developing a real-time in situ monitoring method for fecal N excretion using the rabbit as the animal model. Ideally, such a method should be applicable in wet intact feces, which is challenging due to the presence of high moisture and particles of different dimensions and colors in the fecal pellets. For this purpose, we attempted to develop models to predict N digestibility using different physical forms of feces (wet intact, dried intact, and finely ground fecal pellets) and linear (partial least squares) and non-linear approaches (artificial neural networks). Subsequently, we compared the performance of developed models in terms of accuracy and precision, given their produced prediction values.
2. Materials and Methods
2.1. Digestibility Trial
In this study, all procedures were meticulously synchronized with the European Reference Method [28]. Specifically, a total of forty-eight 35-day-old weaned Hyla male rabbits were selected from a commercial breeding farm. The rabbits were individually housed in galvanized wire-mesh digestibility cages (33 cm wide × 42 cm long × 40 cm high) under controlled environmental conditions (temperature range 18–22 °C; humidity range 55–68%) at the Laboratory of Nutritional Physiology and Feeding.
The digestibility trial was carried out in two distinct phases. During Phase 1, six experimental diets labeled A, B, C, D, E, and F were administered to six groups of rabbits, each consisting of 8 rabbits, over a 21-day period, spanning from weaning to 56 days of age. Diets A and F were the main experimental diets, formulated with high (>200 g/kg) and low (150 g/kg) acid detergent fiber (ADF) contents, respectively (Table 1). Diets B, C, D, and E were prepared by blending different proportions of diets A and F, i.e., diet B (80% A + 20% F), diet C (60% A + 40% F), diet D (40% A + 60% F), and diet E (20% A + 80% F).
Subsequently, in Phase 2, three additional experimental diets designated as G, H, and I were formulated by adjusting the proportions of diets A and F, different from those used in Phase 1, i.e., diet G (75% A + 25% F), diet H (50% A + 50% F), and diet I (25% A + 75% F). These diets were provided to three groups of rabbits, each group comprising 16 rabbits, for another 21-day period, from 57 to 77 days of age. During this phase, the rabbits were reassigned to the diets based on their prior diet assignments in Phase 1. Rabbits that were previously fed diets A and B in Phase 1 were now assigned to diet I in Phase 2, those fed diets C and D in Phase 1 were allocated to diet H in Phase 2, and rabbits previously on diets E and F in Phase 1 were now provided with diet G in Phase 2.
The dietary ADF content (as shown in Table 1) was deliberately manipulated because it is known to have an adverse correlation with nutrient digestibility [29]. This manipulation effectively allowed for changes in N digestibility.

Table 1.
Ingredients (g/kg as fed) and chemical composition (g/kg dry matter) of the main (A and F) experimental diets.
2.2. Chemical Analyses
Feed samples were collected from all groups at the onset of fecal collection, as recommended by [28]. Feces were collected on a daily basis over a 4-day interval for each rabbit and were subsequently pooled and preserved at −18 °C until analyzed.
Prior to chemical analyses, feces were subjected to a 48 h air oven drying process (80 °C) to eliminate moisture. Following this, both feed and fecal samples were finely ground through a 1 mm sieve. The analyses were carried out in accordance with methods outlined by the Association of Official Agricultural Chemists [31]. The dry matter (DM; 7.007) content was determined by subjecting samples to a 105 °C air oven for 24 h. The N content was determined using the Kjeldahl method (Kjeltec autoanalyser unit, Foss, Hilleroed, Denmark), and the crude protein was calculated as N × 6.25. Fiber components, namely aNDF and ADF, were determined [32], using the ANKOM220 filter bag system (ANKOM Technology, Macedon, NY, USA), after preliminary treatment with a-amylase.
2.3. NIRS Analysis and Modified Partial Least Squares
To construct the feed calibration dataset, we collected feed samples not only from the digestibility trial but also from commercial units within the Greek region, totaling 70 feed samples. Out of these, 50 samples were randomly selected for calibration, while the remaining 20 were reserved for validation. Regarding the feces derived from the digestibility trial, the spectral database was also randomly split into two subsets. The calibration set encompassed 190 samples, while the validation set comprised 92 samples.
Three different physical forms of fecal samples (i.e., wet intact, dried intact, and dried ground to a particle size of 1 mm) were used, and each form was scanned in triplicate using a NIR instrument (FOSS DS2500 monochromator, Foss Analytica, Hillerød, Denmark) in reflectance mode, covering a wavelength range of 400–2500 nm with a step size of 2 and 0.5 nm. To optimize the calibration models, we applied spectral pretreatments, including scattering correction, and enhancement of linearity between the reference analysis and spectral response. The pretreatment methods included spectrum derivation, smoothing, standard normal variates (SNV), and detrend, following the methods of [33].
Calibration models were developed using modified partial least squares regression (MPLS) via the MPLS procedure of WINISI software (WINSI v4.10, Foss Analytica, Denmark), as detailed by [34]. The selection of the best calibration model was based on the coefficient of determination of calibration (R2cal) and the lowest standard error of cross-validation (SECV) for a given number of latent variables (LV). For feed, the maximum number of LV was limited to 7, while for feces, it was set at 13. Cross-validation techniques were applied to prevent overfitting, with a leave-out-cross-validation method employed for feed samples and grouping for fecal spectra, following the approach of [35]. Any outliers were identified by a studentized t-test (using WINISI v4.10), which determined the difference between the calibration estimated value and the actual reference value for any sample. Outliers were excluded from the validation procedure.
Subsequently, the chosen calibration model was utilized to predict the content of various parameters in both feeds and feces and the coefficient of digestibility of N. The quality and applicability of the NIRS calibration model were assessed using several parameters, including the coefficient of determination of validation (R2val), the standard error of prediction (SEP), the bias (systematic error of linear regression), and the slope of the linear fit of the predictions. Additionally, the residual prediction deviation (RPD) was calculated, representing the ratio of the standard deviation of the validation dataset to the SEP. The data (dietary and fecal N content and N digestibility) distribution was assessed by the Kolmogorov–Smirnov test. The slope and bias of the regression statistics for the external validation set were evaluated using a one-sample t-test to determine if they significantly deviated from 1 and 0, respectively. Slope and bias values that do not statistically differ from 1 and 0, respectively, indicate a strong correlation between the laboratory-analyzed (reference) values and the predicted values obtained through NIRS. The data distribution, slope, and bias were assessed using IBM SPSS Statistics 23.0 [36].
2.4. Artificial Neural Networks
Feed-forward propagation models utilizing artificial neural networks (ANN) were also developed to predict fecal N content and N digestibility using the spectra of the 3 physical forms (wet unground, dried unground, and dried ground to a particle size of 1 mm) of fecal samples. Model development was carried out using MATLAB version 9.14.0 [37].
The architecture of the fully connected feed-forward neural network comprised three layers. In the first layer, the input layer, the number of neurons equaled the variables, specifically corresponding to the absorbances per wavelength for each sample. This resulted in 1050 input neurons for a 2 nm spectral resolution and 4200 for a 0.5 nm spectral resolution. To expedite the training process for each model, the scores from the spectra were employed after being subjected to principal component analysis (PCA) [38], following the preprocessing of NIR spectra involving a standard normal variate (SNV) transformation detrend and the second derivative. Ultimately, 64 components were collected for each form of fecal sample and used in the input layer of the neural network. In the second layer, referred to as the hidden layer, combinations of 1–300 neurons were tested. The third layer is constituted of one output, representing the fecal N content and N digestibility. Various non-linear activation functions were tested for the transfer to the hidden layer, including the rectified linear unit (ReLU), the Tanh, the sigmoid activation functions, and a linear function for the output layer. L-normalization was applied to mitigate overfitting by maintaining low neural network weights.
The ANN model’s performance was optimized through adjustments to hyperparameters, with Bayesian structural optimization used to determine the most effective combination of hyperparameters for enhanced predictive performance. Bayesian structural optimization, guided by Bayes’ theorem, seeks hyperparameters that optimize the neural network’s performance. Additionally, various numbers of iterations (ranging from 30 to 300) were tested to minimize the squared standard error.
Out of the 282 fecal samples collected, 67% (189) were allocated to the training group and were subject to 19-group cross-validation, while the remaining 33% (93) were assigned to the independent validation group. Model performance was assessed based on the regression coefficient for the validation set (R2val) and the standard error of prediction for the validation results (SEP).
3. Results
3.1. Modified Partial Least Squares (MPLS) Methodology
Table 2 provides a statistical summary of the range, mean, coefficient of variation (CV, %), and standard error of laboratory values for the dietary and fecal N content, as well as for the N digestibility within the calibration and validation sets. It is evident from the data that the measured values exhibited variation across all parameters, as indicated by the range (21.07–29.49 and 21.07–41.18 g N/kg dry matter and 0.56–0.81, for dietary and fecal N content and N digestibility, respectively) and the CV (6, 10, and 5.8% for dietary and fecal N content and N digestibility, respectively), and they conformed to a normal distribution according to the Kolmogorov–Smirnov test.
Table 2.
Statistical overview of the dietary and fecal nitrogen content (N, g/kg dry matter) and nitrogen digestibility (coefficient of total tract apparent digestibility, Nd).
The statistical results of calibration, cross-validation, and external validation for the dietary and fecal N content, and the N digestibility for different forms of the samples using NIRS, are presented in Table 3. When using intact and ground feed pellets, the coefficient of determination (R2cal) for the N content was exceptionally high (0.93 and 0.96, respectively). The fecal N content exhibited very good R2cal values (0.89, 0.85, and 0.95 for the wet unground, dried unground, and dried ground samples, respectively. On the other hand, the N digestibility depended on the physical form of the samples (R2cal values of 0.59, 0.72, and 0.86 for the wet unground, dried unground, and dried ground samples, respectively). In terms of the cross-validation statistics, the SECV values closely approximated the SEC for all parameters, the difference between them remaining near 20% (apart from N content for intact pellets where the difference between SEC and SECV was 50%).
Table 3.
Statistics of NIRS calibration, cross-validation, and external (independent) validation for the prediction of dietary and fecal nitrogen (N) content and nitrogen digestibility (coefficient of total tract apparent digestibility, Nd) using the modified partial least square (MPLS) for different physical forms of feed and fecal samples.
To assess the predictive capability of the developed equations, statistical metrics such as SEP, R2val, slope, and bias were employed. For dietary N content, the equations demonstrated a robust regression coefficient, with R2val values of 0.88 and 0.96 for the intact and ground pellets, respectively. The model for N digestibility exhibited acceptable to good predictive power, with the R2val value depending on the physical form of the feces (R2val values of 0.70, 0.81, and 0.85 for the wet unground, dried unground, and dried ground samples, respectively). SEP values for all parameters aligned closely with SECV values and did not exceed twice the SEC values. The regression statistics, slope, and bias, for the external validation set, displayed no significant deviation from 1 and 0, respectively, indicating a strong correlation between laboratory and predicted values for all parameters.
3.2. Artificial Neural Network (ANN) Methodology
The results from the ANN models developed for the prediction of fecal N content and N digestibility for the different physical forms of feces are presented in Table 4.
Table 4.
Statistics of the feed–forward models predicting fecal nitrogen (N) content and N digestibility (Nd) for different physical forms of samples using an artificial neural network.
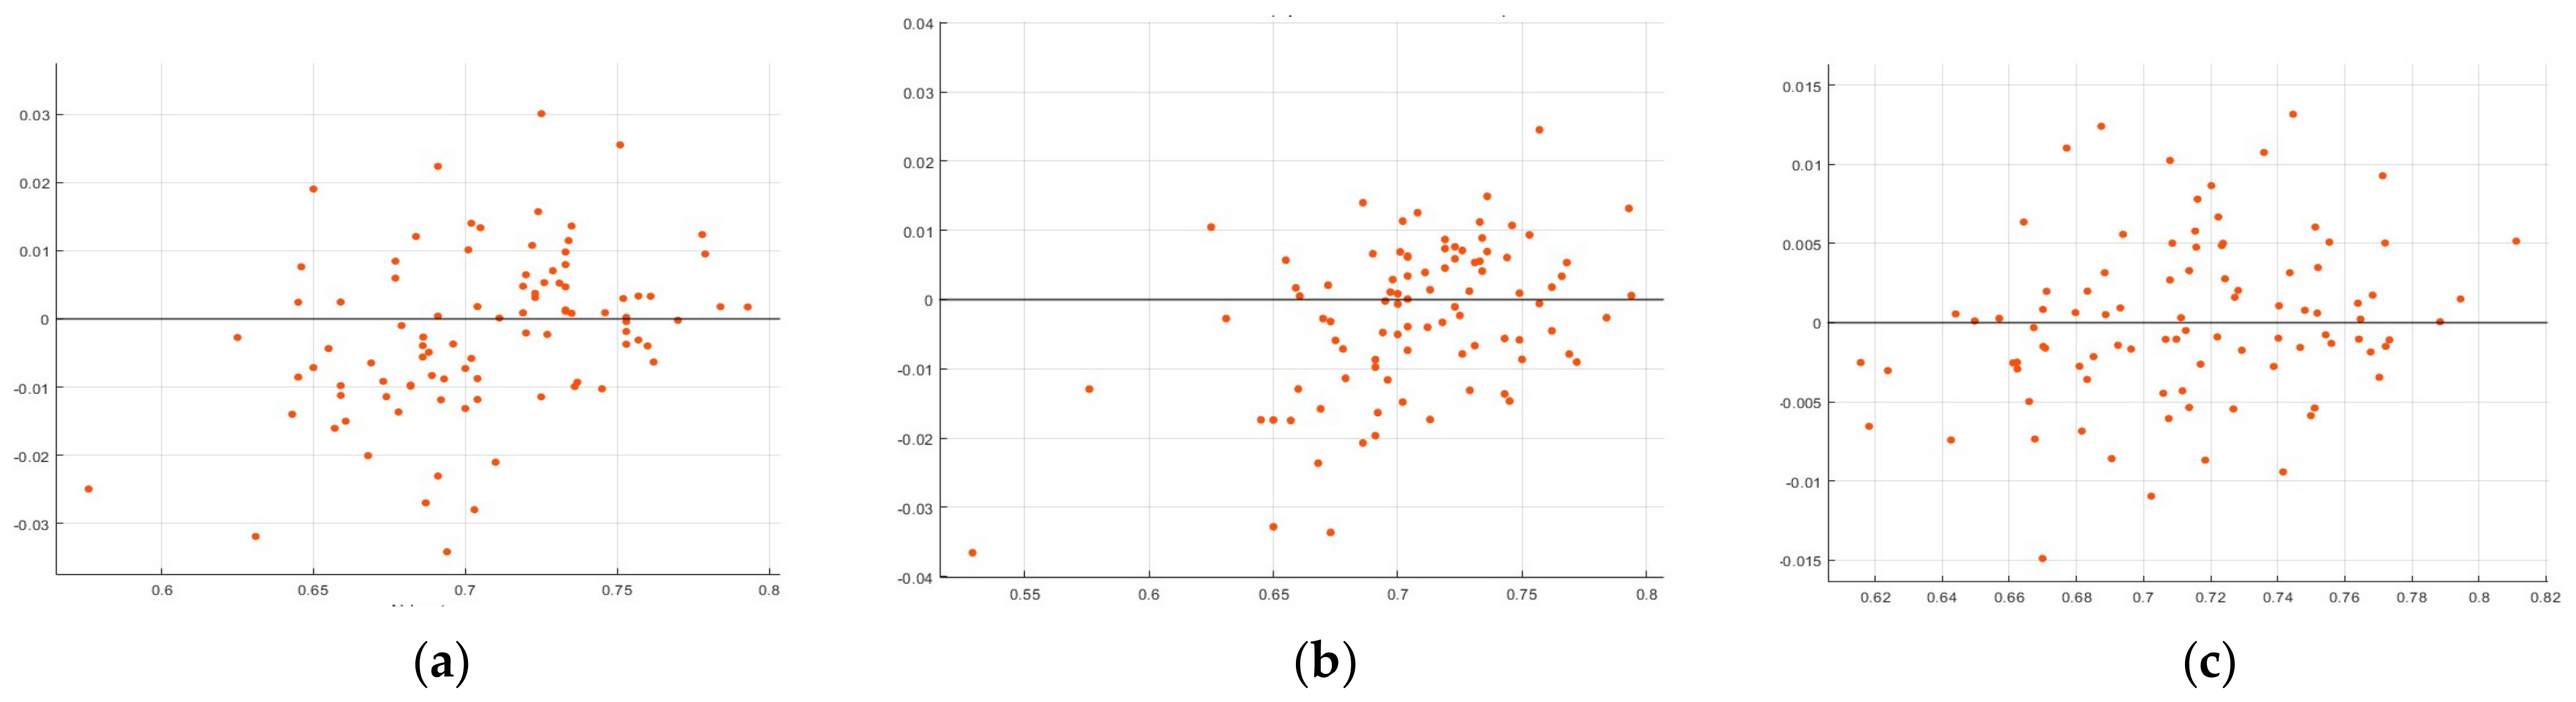
For wet unground feces, the best model (i.e., with the highest R2val and the lowest SEP values) for N digestibility was developed with the use of one neuron in the hidden layer and of a non-linear Tanh activation function. For dried unground feces, 168 neurons in the hidden layer and the use of a non-linear Tanh (tangent hyperbolic) activation function were required to achieve an optimum model. Finally, an optimum model for N digestibility when using dried ground feces was achieved with 23 neurons in the hidden layer and the use of a non-linear sigmoid activation function. The residual plot with reference to the predicted values for N digestibility according to the physical form of fecal samples is given in Figure 1.
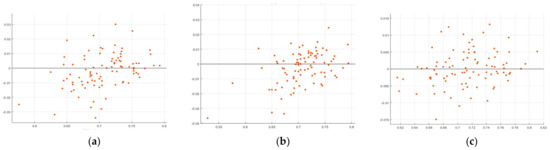
Figure 1.
Residual plot of the predicted values of N digestibility in the independent set after calibration with artificial neural network methodology in (a) wet unground feces, (b) dried unground feces, and (c) dried ground (through 1 mm sieve) feces.
4. Discussion
Near-infrared reflectance (NIR) spectroscopy has been acknowledged as a valuable technique for successfully evaluating feed and fecal composition and nutrient digestibility in cattle [39,40], pigs [13,18,20], and poultry [41]. However, in rabbits there have been relatively few studies to determine digestibility by NIRS, possibly due to the limited variation in feed composition observed in this species [42], and consequently, the small variation in nutrient digestibility. In this study, our primary focus was on predicting the nitrogen (N) digestibility using NIRS fecal spectra. Fecal N content was also predicted but relying solely on such parameters to develop a tool to assess N excretion into the environment is impractical, given the challenges of determining fecal excretion in commercial settings. The N digestibility on the other hand, using NIR spectra of feces, when combined with dietary N content and total feed intake, which can be readily estimated in practical situations, enables monitoring of the environmental N load.
4.1. MPLS Methodology
The equations devised to predict the dietary N content yielded excellent results for both intact and ground feed pellets, with the accuracy being higher for the ground than the intact feed pellets, as indicated by the metrics in the calibration and validation sets (high R2cal, R2val, and RPD values). Similar results were obtained when the N content and the N digestibility were predicted using the NIR spectra of feces presented in three different physical forms: wet intact fecal pellets with a moisture content of 50–55%, dried unground, and dried ground to 1mm (both with a moisture content of approximately 5%). The prediction equations for the N content and digestibility in wet intact feces were quite good and acceptable, respectively, but improved further when using dried unground and dried ground feces, as suggested by the increase in R2cal, R2val, and RPD values. The difference in the prediction accuracy between the intact and ground samples can be attributed to light scattering due to the physical form of the sample. Unground samples have a physical heterogeneity (larger void space between pellets, numerous particles of variable sizes and colors) compared to the more homogeneous dried ground samples. This is an issue that likely induced deviations from linearity [23], which could not be explained and modeled accurately when using the linear calibration methodology in NIRS.
Variable prediction accuracy for dietary and fecal N content [11,43] and N digestibility has been reported in previous works with rabbits [11,22,43]. However, a direct and detailed comparison with our data cannot be performed because of the different approaches and interpretations. The previous works were carried out only with dried ground samples; some used feed [43] or fecal spectra [11] only, whilst others concatenated feed and fecal spectra [22]. A common point between these studies, in contrast to our work, is that they excluded the visible region of spectra from the calibration, which may contain physical evidence that likely maximizes the quantity of information related to digestive processes [18]. In addition, they did not perform an independent validation test; instead, they relied on the cross-validation results, with only one exception [43]. It must be noted that cross-validation does not account for a real test on an independent dataset and could lead to an overly optimistic evaluation of the results [13].
Overall, when using the linear approach in the present study, all calibrations to estimate dietary and fecal N (using intact or ground samples) were of adequate accuracy, as they had R2 values higher than 0.8, SECV values close to SEC values, and generally, RPD values higher than 3, as recommended by [44] to be considered suitable for routine analysis. It is worth noting, however, that the determination of these thresholds lacks a statistical basis and interpretations may vary among authors, as highlighted by other works [45]. On the other hand, the accuracy of the models developed for N digestibility was strongly affected by the physical form of the sample, indicating that the prediction of more complex parameters in untreated fecal samples needs alternative calibration approaches to produce more robust models applicable in commercial settings.
4.2. Artificial Neural Network (ANN) Methodology
To obtain a deeper insight into the need for alternative calibration methods for complex parameters, like N digestibility, we studied the use of ANNs. The primary objective of ANN processing in numerous applications is to discover models that can offer more precise and accurate predictions for output variables. By comparing the actual output values with the predicted ones, we can understand how well the ANN models behave based on the input parameters [24]. The ANN models developed in this study demonstrated remarkable accuracy in predicting fecal N content and N digestibility, irrespective of the physical form of fecal pellets. In the validation dataset, which tested the robustness of the prediction model (and was not used during the training process), the R2val values for the fecal N content were above 0.96 for all physical forms. In the same dataset, the R2val values for N digestibility were 0.91, 0.93, and 0.94 for wet intact, dried intact, and dried ground feces, respectively. Furthermore, the fecal N content and N digestibility models, after training, exhibited relatively consistent statistical performance across both the training and validation subsets. This indicates that the models were effectively trained without overfitting, and they demonstrate robust generalization capabilities, making them suitable for the analysis of entirely new datasets [24,46]. The excellent fit of the model to the data can also be seen in the residual plot (Figure 1), where residuals are randomly scattered around the zero line without showing any distinct pattern.
To assess the performance of the developed models, the R2 value serves as a standard criterion to evaluate the “accuracy” of a particular model based on its predictions, while the SEP (or RMSEP) is commonly employed to gauge the “precision” of a model through residual analysis. Consequently, it is advisable to use a combination of these criteria to draw conclusions and compare the overall performance of the models. In the case of modeling the fecal N content and N digestibility based on the fecal chemical analysis and the coefficient of total tract apparent digestibility derived from in vivo trials, respectively, both R2 and SEP indicated superior accuracy and precision in the predictions performed by the ANN model compared to the MPLS model. Specifically, the R2val values for the fecal N content increased by 12%, 13%, and 4% for wet intact, dried intact, and dried ground feces, respectively, while the SEP increased by approximately 50%. The superiority of the ANN model was more pronounced for N digestibility; the R2val values increased by 30%, 15%, and 10% for wet intact, dried intact, and dried ground feces, respectively, while the SEP showed a general reduction of 50% or more. This result indicates that, indeed, fecal N and N digestibility are better predicted by non-linear models. In numerous applications involving NIR spectroscopic measurements, it is important to acknowledge that the relationship that needs to be established is not always linear. The deviations from linearity can be attributed to well-known extrinsic factors (such as the breakdown of the Lambert–Beer law at elevated analyte concentrations, non-linear detector responses, and light scattering) and/or to non-linear aspects intrinsic to the parameter under consideration [23,47]. Deviations such as light scattering in intact (unground) samples that were used in the present study (this was discussed in the previous section) require the use of special non-linearity adjustment tools, such as ANNs [47,48]. Hence, based on our results, an ANN played an important role in the development of robust models for the fecal N content and N digestibility predictions, when using wet intact feces spectra.
The bibliographic review on the use of ANNs to develop digestibility prediction models did not return any results. The works that have been published as of today mainly concern the prediction of the chemical composition and nutritive value of intact feeds, where ANN models are compared with the models developed with the classical method using the PLS algorithm [24,49,50]. These studies, similar to ours, proved that an ANN was statistically superior to MPLS in building prediction models. In the present study, ANNs were applied for the first time in the development of digestibility prediction models using the spectral data of wet intact feces.
The precision and accuracy of the ANN models for N digestibility may allow NIRS as a rapid tool to monitor fecal N excretion in commercial settings. A simple collection of fresh fecal pellets (e.g., by using a plastic net under cages) followed by immediate scanning in the NIR instrument can give real-time, precise, and very valuable information about N digestibility without the need for separate, time-consuming, and costly trials. This information can be subsequently used to adjust diets (change ingredient composition or, for example, decide on the use of dietary supplements that increase N digestibility) in order to minimize the impact of excreted N on the environment. Additionally, N digestibility can be combined with feed intake data to provide accurate estimations of the fecal N excretion from the farm.
5. Conclusions
The aim of this research was to investigate the feasibility of NIRS in monitoring N digestibility and, subsequently, estimating fecal N excretion with precision in rabbits. The concept was tested using wet intact fecal pellets to develop a simple and rapid methodology that would be applicable in situ. Linear (MPLS) and non-linear (ANN) calibration methodologies were used for this purpose. ANNs had superior performance over MPLS regression for N digestibility, particularly in wet intact feces. The key factor appeared to be the heterogeneity of the intact fecal samples, which is one of the main sources of non-linearity. Regarding the practical use of the models, the improvement obtained in SEP values makes NIR technology combined with the ANN method an important tool for monitoring fecal N excretion accurately in rabbit farms.
Author Contributions
Conceptualization, E.F. and G.P.; methodology, E.F. and G.P.; software, E.F.; validation, E.F., K.C.M. and G.P.; formal analysis, I.H. and K.C.M.; investigation, E.F.; resources, G.P.; data curation, E.F. and G.P.; writing—original draft preparation, E.F. and I.H.; writing—review and editing, E.F., I.H., K.C.M. and G.P.; visualization, K.C.M.; supervision, G.P.; project administration, G.P.; funding acquisition, E.F. All authors have read and agreed to the published version of the manuscript.
Funding
This research was co-financed by Greece and the European Union (European Social Fund-ESF) through the Operational Program “Human Resources Development, Education and Lifelong Learning” in the context of the project “Strengthening Human Resources Research Potential via Doctorate Research” (funding number: MIS-5000432), implemented by the State Scholarships Foundation (IKΥ, Athens, Greece).
Data Availability Statement
The data presented in this study are available on request from the corresponding author. The data are not publicly available due to privacy.
Acknowledgments
Authors are grateful to Maria Tsafou and Anna Vitoraki for their assistance with the experimental and analytical procedures.
Conflicts of Interest
The authors declare no conflict of interest.
References
- Beeckman, F.; Motte, H.; Beeckman, T. Nitrification in agricultural soils: Impact, actors and mitigation. Curr. Opin. Biotechnol. 2018, 50, 166–173. [Google Scholar] [CrossRef]
- Van der Weerden, T.J.; Luo, J.; Di, H.J.; Podolyan, A.; Phillips, R.L.; Saggar, S.; de Klein, C.A.M.; Cox, N.; Ettema, P.; Rys, G. Nitrous oxide emissions from urea fertiliser and effluent with and without inhibitors applied to pasture. Agric. Ecosyst. Environ. 2016, 219, 58–70. [Google Scholar] [CrossRef]
- Kanter, D.R.; Zhang, X.; Mauzerall, D.L.; Malyshev, S.; Shevliakova, E. The importance of climate change and nitrogen use efficiency for future nitrous oxide emissions from agriculture. Environ. Res. Lett. 2016, 11, 094003. [Google Scholar] [CrossRef]
- Sharma, L.K.; Bali, S.K. A review of methods to improve nitrogen use efficiency in agriculture. Sustain. Times 2017, 10, 51. [Google Scholar] [CrossRef]
- Prapaspongsa, T.; Christensen, P.; Schmidt, J.H.; Thrane, M. LCA of comprehensive pig manure management incorporating integrated technology systems. J. Clean. Prod. 2010, 18, 1413–1422. [Google Scholar] [CrossRef]
- Philippe, F.X.; Cabaraux, J.F.; Nicks, B. Ammonia emissions from pig houses: Influencing factors and mitigation techniques. Agric. Ecosyst. Environ. 2011, 141, 245–260. [Google Scholar] [CrossRef]
- Liu, Z.; Powers, W.; Mukhtar, S. A review of practices and technologies for odor control in swine production facilities. Appl. Eng. Agric. 2014, 30, 477–492. [Google Scholar] [CrossRef]
- Leinonen, I.; Kyriazakis, I. How can we improve the environmental sustainability of poultry production? Proc. Nutr. Soc. 2016, 75, 265–273. [Google Scholar] [CrossRef]
- Pelletier, N. Life cycle assessment of Canadian egg products, with differentiation by hen housing system type. J. Clean. Prod. 2017, 152, 167–180. [Google Scholar] [CrossRef]
- Asem-Hiablie, S.; Battagliese, T.; Stackhouse-Lawson, K.R.; Alan Rotz, C. A life cycle assessment of the environmental impacts of a beef system in the USA. Int. J. Life Cycle Assess. 2019, 24, 441–455. [Google Scholar] [CrossRef]
- Núñez-Sánchez, N.; Martínez Marín, A.L.; Hernández, M.P.; Carrion, D.; Castro, G.G.; Pérez Alba, L.M. Faecal near infrared spectroscopy (NIRS) as a tool to asses rabbit’s feed digestibility. Livest. Sci. 2012, 150, 386–390. [Google Scholar] [CrossRef]
- Patience, J.F.; Rossoni-Serão, M.C.; Gutiérrez, N.A. A review of feed efficiency in swine: Biology and application. J. Anim. Sci. Biotechnol. 2015, 6, 33. [Google Scholar] [CrossRef] [PubMed]
- Paternostre, L.; Baeten, V.; Ampe, B.; Millet, S.; De Boever, J. The usefulness of NIRS calibrations based on feed and feces spectra to predict nutrient content, digestibility and net energy of pig feeds. Anim. Feed Sci. Technol. 2021, 281, 115091. [Google Scholar] [CrossRef]
- Aufrère, J.; Graviou, D.; Demarquilly, C.; Perez, J.M.; Andrieu, J. Near infrared reflectance spectroscopy to predict energy value of compound feeds for swine and ruminants. Anim. Feed Sci. Technol. 1996, 62, 77–90. [Google Scholar] [CrossRef]
- Baeten, V.; Dardenne, P. Application of NIR in agriculture. In Near-Infrared Spectroscopy; Ozaki, Y., Huck, C., Tsuchikawa, S., Engelsen, S.B., Eds.; Springer: Singapore, 2020; pp. 347–360. [Google Scholar]
- Bastianelli, D.; Carré, B.; Mignon-Grasteau, S.; Bonnal, L.; Davrieux, F. Direct prediction of energy digestibility from poultry faeces using near infrared spectroscopy-Agritrop. In Near Infrared Spectroscopy, Proceedings of the 12th International Conference, Auckland, New Zealand, 9–15 April 2005; Burling-Claridge, G.R., Holroyd, S.E., Sumner, R.M.W., Eds.; NZ NIRS Society Inc.: Hamilton, New Zealand, 2007; pp. 626–629. [Google Scholar]
- Coulibaly, I.; Métayer, J.P.; Chartrin, P.; Mahaut, B.; Bouvarel, I.; Hogrel, P.; Bastianelli, D. La combinaison des informations issues des aliments et des fientes améliore la prédiction par SPIR de la digestibilité chez le poulet: JRA-JRFG. In Proceedings of the Dixièmes Journées de la Recherche Avicole et Palmipèdes à Foie Gras (JRFG), La Rochelle, France, 26–28 March 2013; p. 165. [Google Scholar]
- Bastianelli, D.; Bonnal, L.; Jaguelin-Peyraud, Y.; Noblet, J. Predicting feed digestibility from NIRS analysis of pig faeces. Animal 2015, 9, 781–786. [Google Scholar] [CrossRef] [PubMed]
- Schiborra, A.; Bulang, M.; Berk, A.; Susenbeth, A.; Schlecht, E. Using faecal near-infrared spectroscopy (FNIRS) to estimate nutrient digestibility and chemical composition of diets and faeces of growing pigs. Anim. Feed Sci. Technol. 2015, 210, 234–242. [Google Scholar] [CrossRef]
- Nirea, K.G.; de Nanclares, M.P.; Skugor, A.; Afseth, N.K.; Meuwissen, T.H.E.; Hansen, J.; Mydland, L.T.; Øverland, M. Assessment of fecal near-infrared spectroscopy to predict feces chemical composition and apparent total-tract digestibility of nutrients in pigs. J. Anim. Sci. 2018, 96, 2826–2837. [Google Scholar] [CrossRef]
- Decruyenaere, V.; Lecomte, P.; Demarquilly, C.; Aufrere, J.; Dardenne, P.; Stilmant, D.; Buldgen, A. Evaluation of green forage intake and digestibility in ruminants using near infrared reflectance spectroscopy (NIRS): Developing a global calibration. Anim. Feed Sci. Technol. 2009, 148, 138–156. [Google Scholar] [CrossRef]
- Meineri, G.; Peiretti, P.G.; Masoero, G. Appraisal of ingestion and digestibility in growing rabbits using near infrared reflectance spectroscopy (NIRS) of feeds and faeces. Ital. J. Anim. Sci. 2009, 8, 75–82. [Google Scholar] [CrossRef]
- Pérez-Márín, D.; Garrido-Varo, A.; Guerrero, J.E. Non-linear regression methods in NIRS quantitative analysis. Talanta 2007, 72, 28–42. [Google Scholar] [CrossRef]
- Ahmadi, H.; Rodehutscord, M. Application of artificial neural network and support vector machines in predicting metabolizable energy in compound feeds for pigs. Front. Nutr. 2017, 4, 27. [Google Scholar] [CrossRef]
- Roush, W.B.; Cravener, T.L. Artificial neural network prediction of amino acid levels in feed ingredients. Poult. Sci. 1997, 76, 721–727. [Google Scholar] [CrossRef]
- Cravener, T.L.; Roush, W.R. Prediction of amino acid profiles in feed ingredients: Genetic algorithm calibration of artificial neural networks. Anim. Feed Sci. Technol. 2001, 90, 131–141. [Google Scholar] [CrossRef]
- Ahmadi, H.; Golian, A.; Mottaghitalab, M.; Nariman Zadeh, N. Prediction model for true metabolizable energy of feather meal and poultry offal meal using group method of data handling-type neural network. Poult. Sci. 2008, 87, 1909–1912. [Google Scholar] [CrossRef]
- Perez, J.M.; Lebas, F.; Gidenne, T.; Maertens, L.; Xiccato, G.; Parigi-Bini, R.; Dalle Zotte, A.E.; Carazzolo, A.; Villamide, M.J.; Carabaño, R.; et al. European reference method for in vivo determination of diet digestibility in rabbits. World Rabbit Sci. 1995, 3, 41–43. [Google Scholar] [CrossRef]
- Gidenne, T. Dietary fibres in the nutrition of the growing rabbit and recommendations to preserve digestive health: A review. Animal 2015, 9, 227–242. [Google Scholar] [CrossRef] [PubMed]
- Fundación Española para el Desarrollo de la Nutrición Animal. Tablas FEDNA de Composición y Valor Nutritivo de Alimentos Para la Fabricación de Piensos, 2nd ed.; De Blas, C., Mateos, G.G., Rebollar, P.G., Eds.; FEDNA: Madrid, Spain, 2003. [Google Scholar]
- AOAC. Official Methods of Analysis, 14th ed.; Association of Official Analytical Chemists: Washington, DC, USA, 1984. [Google Scholar]
- Van Soest, P.J.; Robertson, J.B.; Lewis, B.A. Methods for dietary fiber, neutral detergent fiber, and non starch polysaccharides in relation to animal nutrition. J. Dairy Sci. 1991, 74, 3583–3597. [Google Scholar] [CrossRef]
- Barnes, R.J.; Dhanoa, M.S.; Lister, S.J. Standard normal variate transformation and de-trending of near-infrared diffuse reflectance spectra. Appl. Spectrosc. 1989, 43, 772–777. [Google Scholar] [CrossRef]
- Wold, S.; Sjöström, M.; Eriksson, L. PLS-regression: A basic tool of chemometrics. Chemom. Intell. Lab. Syst. 2001, 58, 109–130. [Google Scholar] [CrossRef]
- Williams, P.; Dardenne, P.; Flinn, P. Tutorial: Items to be included in a report on a near infrared spectroscopy project. J. Near Infrared Spectrosc. 2017, 25, 85–90. [Google Scholar] [CrossRef]
- IBM Corp. Released, IBM SPSS Statistics for Windows, Version 23.0; IBM Corp.: Armonk, NY, USA, 2015. [Google Scholar]
- The MathWorks Inc. MATLAB, Version: 9.14.0 (R2023a); The MathWorks Inc.: Natick, MA, USA, 2023; Available online: https://www.mathworks.com (accessed on 5 September 2023).
- Gojun, M.; Valinger, D.; Šalíc, A.; Zelíc, B. Development of NIR-Based ANN models for on-line monitoring of glycerol concentration during biodiesel production in a microreactor. Micromachines 2022, 13, 1590. [Google Scholar] [CrossRef]
- Jancewicz, L.J.; Swift, M.L.; Penner, G.B.; Beauchemin, K.A.; Koenig, K.M.; Chibisa, G.E.; He, M.L.; McKinnon, J.J.; Yang, W.Z.; McAllister, T.A. Development of near-infrared spectroscopy calibrations to estimate fecal composition and nutrient digestibility in beef cattle. Can. J. Anim. Sci. 2017, 97, 51–64. [Google Scholar] [CrossRef]
- Mehtiö, T.; Rinne, M.; Nyholm, L.; Mäntysaari, P.; Sairanen, A.; Mäntysaari, E.A.; Pitkänen, T.; Lidauer, M.H. Cow-specific diet digestibility predictions based on near-infrared reflectance spectroscopy scans of faecal samples. J. Anim. Breed. Genet. 2016, 133, 115–125. [Google Scholar] [CrossRef]
- Cruz-Conesa, A.; Ferré, J.; Pérez-Vendrell, A.M.; Callao, M.P.; Rui Sánchez, I. Use of visible-near infrared spectroscopy to predict nutrient composition of poultry excreta. Anim. Feed Sci. Technol. 2022, 283, 115169. [Google Scholar] [CrossRef]
- Gidenne, T.; Garreau, H.; Drouilhet, L.; Aubert, C.; Maertens, L. Improving feed efficiency in rabbit production, a review on nutritional, technico-economical, genetic and environmental aspects. Anim. Feed Sci. Technol. 2017, 225, 109–122. [Google Scholar] [CrossRef]
- Xiccato, G.; Trocino, A.; De Boever, J.L.; Maertens, L.; Carabaño, R.; Pascual, J.J.; Perez, J.M.; Gidenne, T.; Falcao-E-Cunha, L. Prediction of chemical composition, nutritive value and ingredient composition of European compound feeds for rabbits by near infrared reflectance spectroscopy (NIRS). Anim. Feed Sci. Technol. 2003, 104, 153–168. [Google Scholar] [CrossRef]
- Williams, P.C. Implementation of near-infrared technology. In Near-Infrared Technology in the Agricultural and Food Industries; Williams, P.C., Norris, K.H., Eds.; AACC Inc.: St. Paul, MN, USA, 2001; pp. 145–169. ISBN 978-1891127243. [Google Scholar]
- Minasny, B.; McBratney, A. Why you don’t need to use RPD. Pedometron 2013, 33, 14–15. [Google Scholar]
- Lou, W.; Nakai, S. Artificial neural network-based predictive model for bacterial growth in a simulated medium of modified-atmosphere-packed cooked meat products. J. Agric. Food Chem. 2001, 49, 1799–1804. [Google Scholar] [CrossRef]
- Bertran, E.; Blanco, M.; Maspoch, S.; Ortiz, M.C.; Sánchez, M.S.; Sarabia, L.A. Handling intrinsic non-linearity in near-infrared reflectancespectroscopy. Chemometr. Intell. Lab. Syst. 1999, 49, 215–224. [Google Scholar] [CrossRef]
- Stordrange, L.; Kvalheim, O.M.; Hazle, P.A.; Malthe-Srenssen, D.; Libnau, F.O. A comparison of techniques for modelling data with non-linear structure. J. Near Infrared Spectrosc. 2003, 11, 55–70. [Google Scholar] [CrossRef]
- Fernandez-Ahumada, E.; Fearn, T.; Gomez, A.; Vallesquino, P.; Guerrero, J.E.; Pérez-Márín, D.; Garrido-Varo, A. Reducing NIR prediction errors with nonlinear methods and large populations of intact compound feedstuffs. Meas. Sci. Technol. 2008, 19, 085601. [Google Scholar] [CrossRef]
- Pérez-Marín, D.; Garrido-Varo, A.; Guerrero, J.E.; Gutiérrez-Estrada, J.C. Use of artificial neural networks in near-infrared reflectance spectroscopy calibrations for predicting the inclusion percentages of wheat and sunflower meal in compound feedingstuffs. Appl. Spectrosc. 2006, 60, 1062–1069. [Google Scholar] [CrossRef] [PubMed]
Disclaimer/Publisher’s Note: The statements, opinions and data contained in all publications are solely those of the individual author(s) and contributor(s) and not of MDPI and/or the editor(s). MDPI and/or the editor(s) disclaim responsibility for any injury to people or property resulting from any ideas, methods, instructions or products referred to in the content. |
© 2023 by the authors. Licensee MDPI, Basel, Switzerland. This article is an open access article distributed under the terms and conditions of the Creative Commons Attribution (CC BY) license (https://creativecommons.org/licenses/by/4.0/).