Article

Sedimentation Rate and Contamination Levels Profile of Potentially Toxic Elements in the Limoncocha Lagoon RAMSAR Wetland in the Ecuadorian Amazon

by
Katty Coral-Carrillo
1,
Gema Ruiz-Gutiérrez
2,
José Gómez-Arozamena
3 and
Javier R. Viguri
2,*
1
Facultad de Ingeniería y Ciencias Aplicadas, Universidad Internacional SEK, Alberto Einstein y 5a Transversal, Quito 170134, Ecuador
2
Green Engineering & Resources Research Group (GER), Departamento de Química e Ingeniería de Procesos y Recursos, ETSIIT, Universidad de Cantabria, Avda. de los Castros 46, Cantabria, 39005 Santander, Spain
3
Departamento de Ciencias Médicas y Quirúrgicas, Universidad de Cantabria UC, Avenida Herrera Oria s/n, 39011 Santander, Spain
*
Author to whom correspondence should be addressed.
Environments 2023, 10(1), 2; https://doi.org/10.3390/environments10010002
Submission received: 14 November 2022 / Revised: 13 December 2022 / Accepted: 18 December 2022 / Published: 21 December 2022

Abstract

:
The aim of this study is to analyze the recent sedimentation rate in the center of the Limoncocha lagoon, a Ramsar site in the Ecuadorian Amazon, using the 210Pb dating method and identifying the potentially toxic elements along a 50 cm sediment core. A strategy based on the application of three single and four integrated indices is used to evaluate trace element contamination with depth. Single indices show mainly As and Mo, and Cu, Ba, Cd, Ni, and Pb to a lesser extent, as responsible elements of a minor enrichment between −10 and −40 cm. The multielement slight pollution shows a mixture of potential contamination sources, probably due to agricultural, oil activities, and urban wastewater discharges. However, integrated indices applied, classify the complete core as without potential risk. The 210Pbexcess profile shows three differentiated sections. A surface section where new materials with lower concentrations have been found, probably due to the underground currents that connect the lagoon and the nearby Napo River; a central section where CF-CS model and mass accumulation rate calculations provide a sediment accumulation rate of 0.56 ± 0.03 cm y−1; finally, a deeper section with a constant 210Pbexces profile, showing sediment reworking probably due to local flooding’s.

Graphical Abstract

1. Introduction

Lake sediments provide an objective record of sedimentation history, and the study of heavy metals and trace elements in vertical sediment cores is an important method of tracing the pollution history of the study area. Several authors have used this study approach, some of them incorporating both the evolution of trace elements along the core [1,2,3,4,5,6,7,8,9,10], as well as the combined analysis of the elements using pollution indicators throughout the in-depth core, allowing the determination of historical evolutions of potential impacts [11,12,13,14,15,16,17,18,19,20,21,22,23,24,25].
Pollution indices are widely considered to estimate the contamination level and the potential ecological risk of the potentially toxic elements in surface and core sediments, being a useful tool in monitoring and management of environmental programs [26,27,28]. Single indices, which refer to one single pollutant, are based on the concentration of the reference element or/and the background or baseline concentration. Integrated pollution indices, which refer to a group of pollutants, are based on background or baseline values, based on the reference element in combination with the background concentration, based on the toxic response, and based on the sediment quality guidelines. Approaches based on the application of a combination of single and integrated indices have been shown to be effective to assess the area under study [28,29,30].
Many sediment pollution indices require the assessment of a geochemical background or geochemical baseline and/or the selection of a conservative reference element. Several methods to determine the geochemical background values of elements in sediments have been used. In particular, direct methods use mean or median concentrations measured in sediments collected in pristine areas at a certain distance from any source of anthropogenic contamination [31], or concentrations in deep core sediment samples. In the first case, it is necessary that the entire study area have very similar lithological characteristics to avoid erroneous conclusions. In the second case, many authors have used the low stable values of element concentrations obtained in the lower, uncontaminated section of the depth sediment core as geochemical background concentrations [7,10,21,22,23,24,28,32,33,34,35,36,37,38,39,40,41,42,43,44,45,46].
The use of sediment cores allows for establishing a “local baseline concentration” or “regional background concentration” considering the average of the values of lower concentration selected from the deepest layers, less affected by anthropic activities (industrial, agricultural and urban). However, authors such as Hernandez-Crespo and Martín [13] propose integrated methods based on direct geochemical analysis and statistical analysis, to determine the geochemical background of the sediments.
In addition to the use of sediment cores to determine the depth profile evolution of the studied trace elements and the geochemical background determination, the sediment cores allow estimation of sedimentation and dating rates through the analysis of radionuclides present in the different layers of sediment. The study of the isotopic variations with depth allows the historical record of the activities of the studied area.
Since the 1970s, 210Pb concentrations have been used extensively to date sediment deposits in a wide variety of natural environments, such as lakes and wetlands, being able to obtain sedimentation rates to the last 100–150 years, a period in which could have produced the greatest anthropic influences [6,20,38,47,48,49,50,51,52,53,54].
210Pb can be found in sediment samples both by its atmospheric deposition and by the disintegration of 226Ra present in the sedimentary material. This last fraction will be in radioactive equilibrium with 226Ra and will decay with its half-life (1600 years). This fraction is known as 210Pb in equilibrium or supported (210Pbsupported) while the deposited fraction is known as 210Pb in excess (210Pbexcess) or not supported by 226Ra. From the measured concentration of the depositional fraction (210Pbexcess) in the different layers of a sediment core, it is possible to estimate the sedimentation rate and date the different sediment layers. The concentration of 210Pb in equilibrium (210Pbsupported), can be known through 226Ra and the concentration of total 210Pb can be measured directly so that its difference provides the 210Pb in excess, that is, 210Pbexcess = 210Pbtotal226Ra. From the 210Pbexcess concentrations profile with depth and under fulfilling certain hypotheses, different models have been developed which allow estimating a chronology for the sediment. Models such as the CF-CS (Constant Flux and Constant Sedimentation Rate), CF-CIC (Constant Flux and Constant Initial Concentration), and the CRS (Constant Rate of Supply) are widely used in the scientific literature for sediment dating [6,22,23,39,46,52,55,56,57,58,59,60,61,62,63,64]
The Limoncocha lagoon is the largest water body in the Limoncocha Biological Reserve identified as a Ramsar site since 1998 [65] The reserve has abundant biodiversity and is a source of natural human food base. Two small rivers and the runoff of the area reaches the lagoon. This area is influenced by oil well drilling and exploitation activities with an increasing population and human activities such as ecotourism, fisheries, and agriculture around the body of water [66,67]. The lagoon in particular is the main tourist attraction in the reserve area, and facilities are being developed for ecotourism as a driver of change in the Amazonian ecosystem [68]. In addition, storm rainfall events which lead to the rising water level of the nearby Napo River causing flood events on the lagoon, would be a long-term secondary source of sediment pollution. The monitoring of contaminants and the environmental risk assessment are essential for the environmental protection of the Limoncocha lagoon.
Recent studies conducted by Carrillo et al. [69,70] have shown the potentially toxic elements in the soils and surface sediments and estimated baseline values based on the statistical methods in the Limoncocha Biological Reserve. However, none of them deals with the study of sediment cores.
In order to contribute to improving the geochemical knowledge of the Limoncocha lagoon and to provide more comprehensive information about the potentially toxic trace elements, this study investigated the vertical distribution of trace elements As, Ba, Cd, Co, Cr, Cu, Mo, Ni, Pb, V, Zn and major elements Al, Fe, Mn, P and Si in a core sediment of Limoncocha lagoon, assessing the pollution degree and ecological risk using three single pollution indices, contamination factor (Cf), geo-accumulation index (Igeo), enrichment factor (EF) and four integrated indices as the modified degree of contamination (mCd), mean enrichment quotient (MEQ), potential ecological risk index (RI) and toxic-risk index (TRI). Another major objective was to determine the natural radionuclides 210Pb, 226Ra, 232Th, and 40K concentration profiles and estimate the sedimentation rate and deposition time of sediment by measuring the 210Pbexcess in the core. The scarcity of geochronological data on sedimentary profiles in the lake and its characteristic ability to act as a potential sink of multiple contributions of potentially toxic elements motivated the development of this study.

2. Materials and Methods

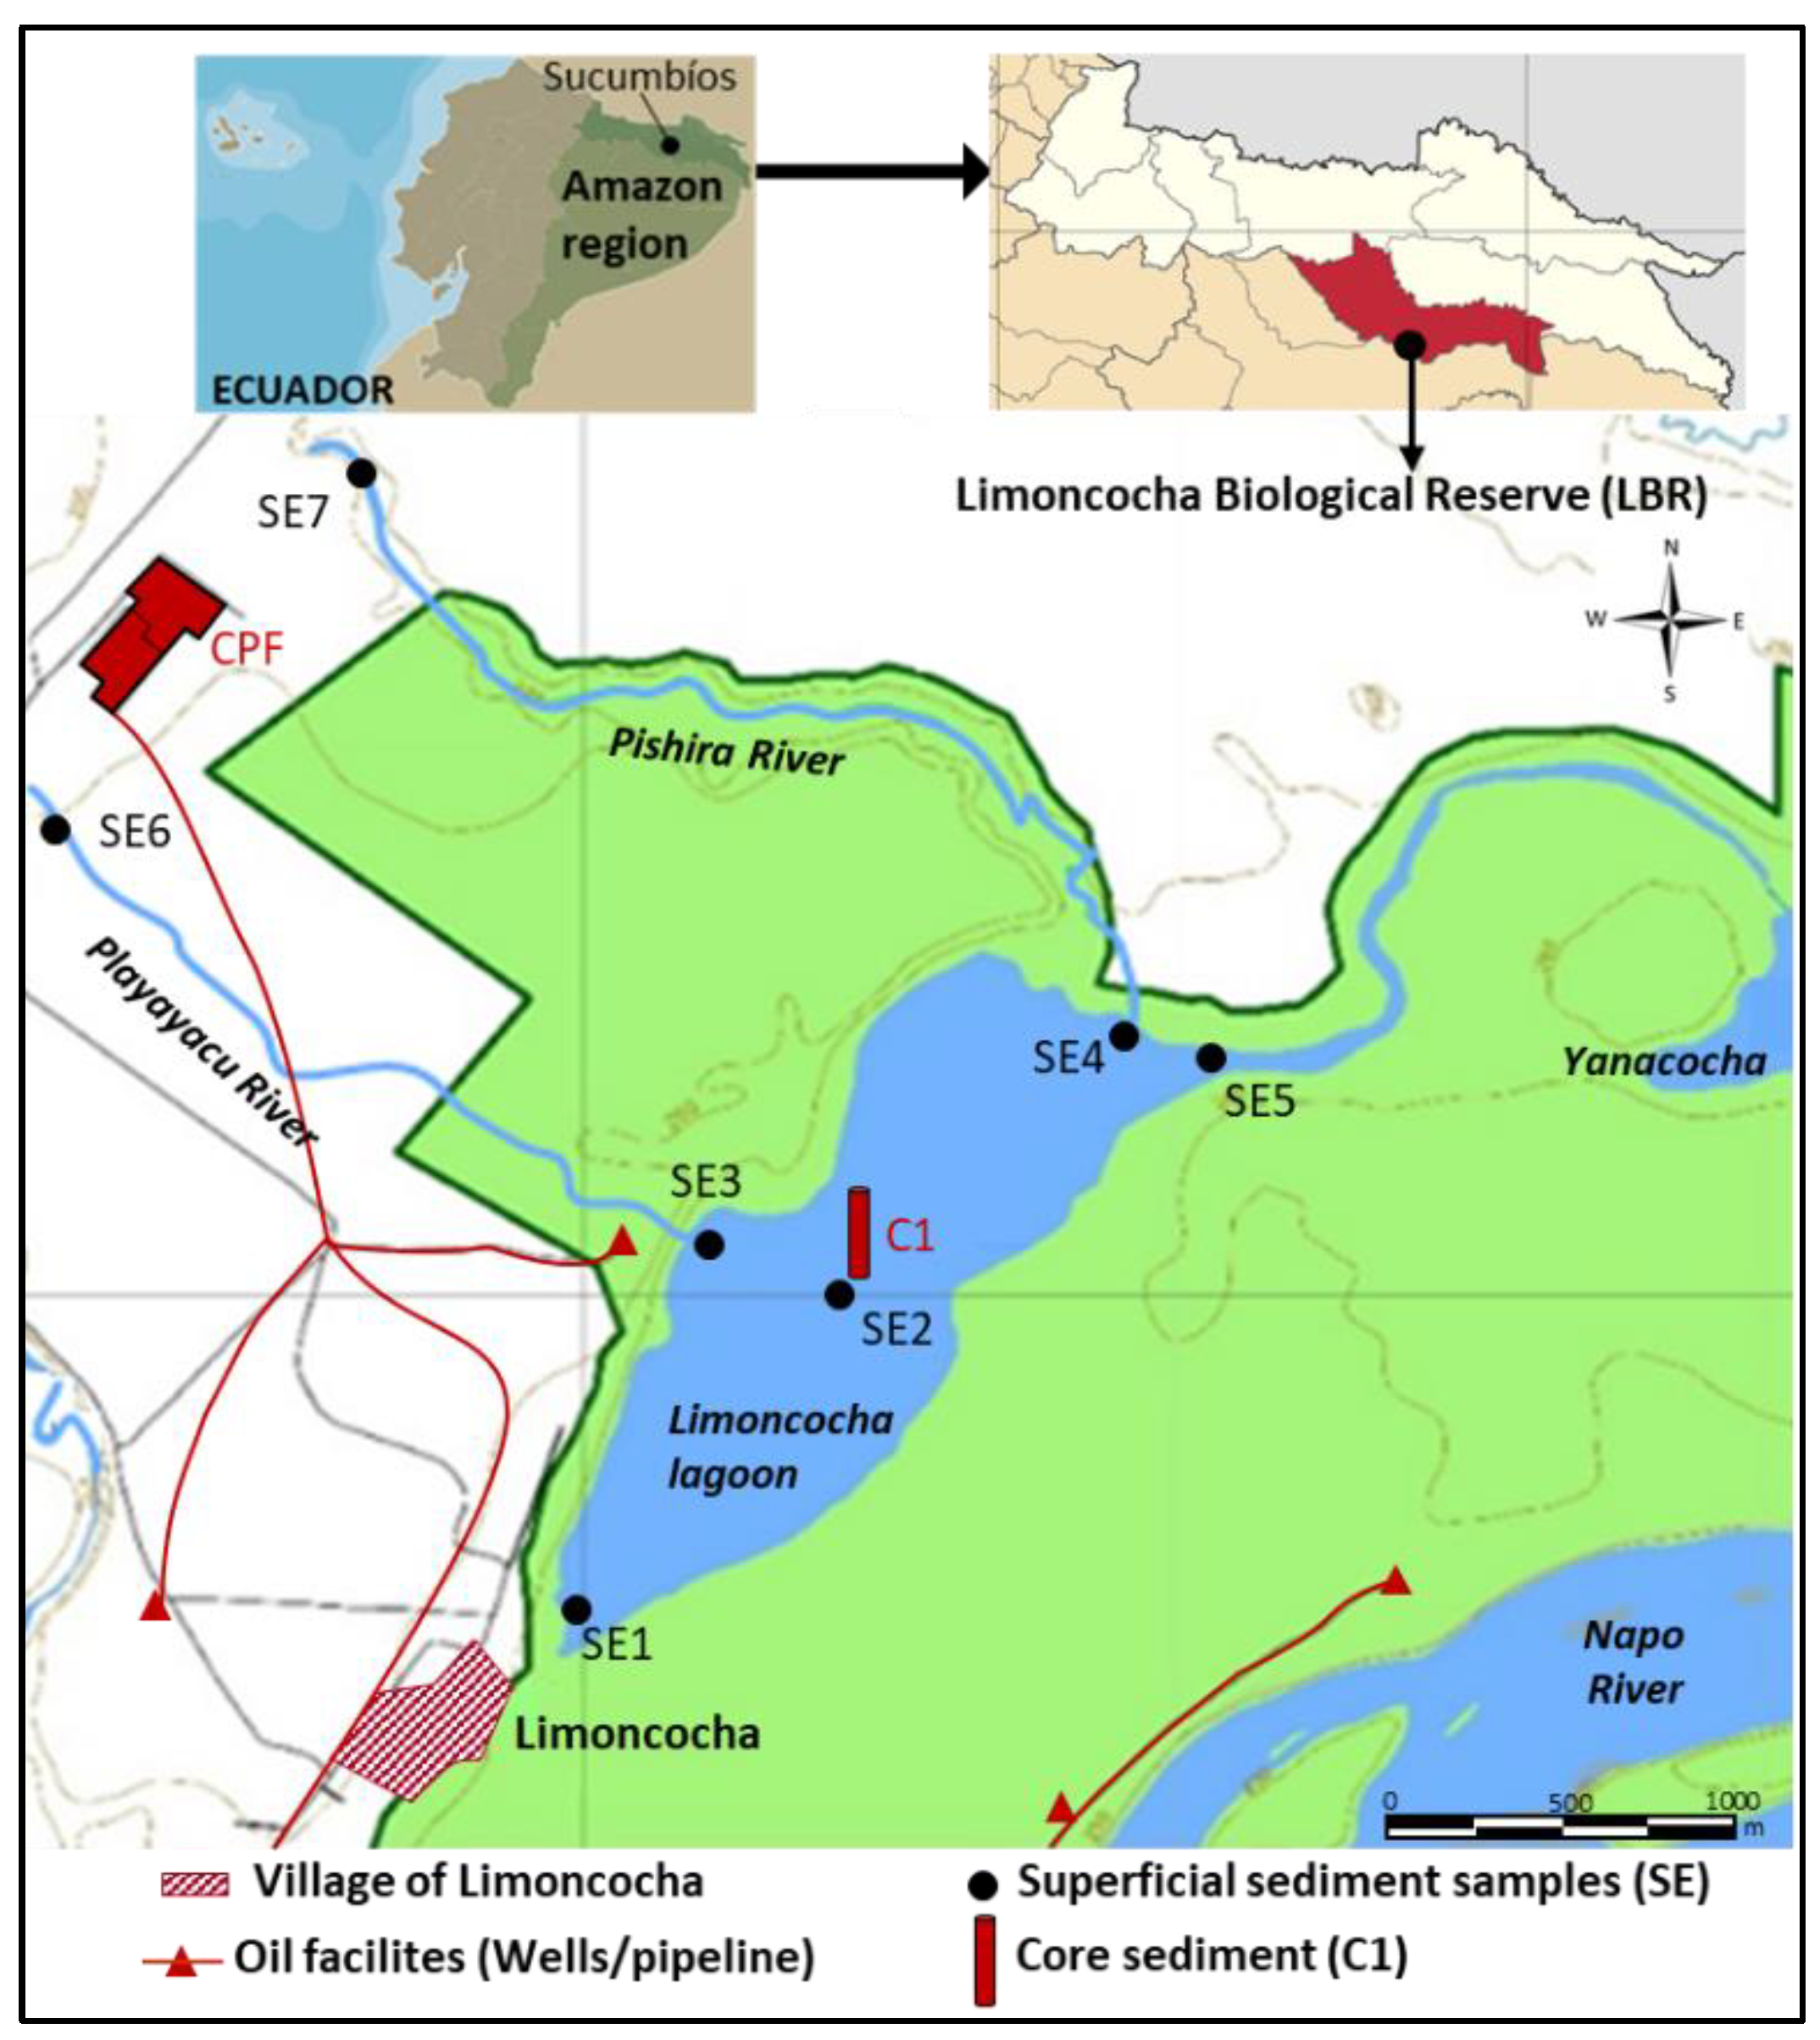
2.1. Study Area: The Limoncocha Lagoon

The Limoncocha Biological Reserve (RBL), is a 4613.3 ha Ramsar site located on the northeastern side of the Ecuadorian Amazon, in the southwestern region of the province of Sucumbíos at a height of 220 m above sea level (Figure 1). The reserve is characterized by its abundant biodiversity with several ecosystems such as permanent wetlands, floodable forests, dry forests, and aquatic habitats. The Biological Reserve contains eight different plant formations, holding 144 bird species, 74 mammal species, 53 amphibian species, 39 reptile species, and 93 fish species. In 2006, four species of mammals and one species of bird were listed in the “red books” published by the World Union for Conservation of Nature in Ecuador [71,72]. The black caiman (Melanosuchus niger), the largest predator in the Neotropics, with individuals exceeding five meters, is considered the emblematic species of the Limoncocha lagoon [73].
The Limoncocha lagoon (2.3 km2) is the main body of water in the RBL. The Pishira and Playayacu small rivers flow into the Limoncocha lagoon, which is connected to the small, inaccessible body of water called Yanacocha. The lagoon is currently a “dead arm” of the nearby Napo River located south of the lagoon.
The Limoncocha village, which is located at the eastern end of the lagoon and had 6817 inhabitants in 2019, depends mainly on biodiversity for survival. Of the eight ancestral ethnic groups that make up the indigenous peoples of the Ecuadorian Amazon, the Kichwa population is the predominant one in the Limoncocha area [74]. A central production facility (CPF) of the Petroamazonas oil company is located to the northwest of the lagoon between the mouths of the Playayacu and Pishira rivers (Figure 1).

2.2. Sampling and Analytical Methods

Sediment core (0–50 cm) was collected in the subtidal central area (3.5 m depth) of the Limoncocha lagoon (0°23′58.5″ S; 76°36′45.4″ W) in September 2018 using a PVC tube of 50 cm long and 45 cm diameter. The core was sampled down by means of a percussion drill with various steel extensions. After driving the core tube into the sediment, it was extracted manually. On return to the laboratory, the core was opened, described, and photographed before being cut into 1-cm increments for analysis. Samples were placed into polyethylene bags previously washed with 1:1 HNO3 and rinsed with distilled water, sealed, transported to the laboratory, and stored at 4 ºC until further analysis.
The density of the samples was determined on twenty-three composite 1-cm-thick samples by the pycnometer method [75]. Six selected sediment samples from 1 cm-thick intervals were used to determine major and trace elements. The analysis of the major elements Al, Fe, Mn, and Ti, was carried out at Activation Laboratories Ltd., in Canada using the Major Elements Fusion ICP package (Code WRA/ICPOES-4B). The rest of the metals (Ba, Cd, Co, Cr, Cu, Mo, Ni, Pb, V, and Zn) and metalloids (As) concentrations were determined by ICP-MS (Thermo iCAP-Q) in our laboratories. Metals were extracted with a microwave acid digestion system (CEM model Mars 5) according to the SW-846 EPA Method 3051 A. Complete procedural details are described in previous works of the authors [69,70].
Activity concentrations of radionuclides have been determined at the University of Cantabria (Spain) by gamma spectrometry, using a low-background high-purity HPGe detector. Thirteen composite sediment samples from 4 cm or 5 cm-thick intervals, in order to obtain a minimum mass of 50 g-dw in all the samples were homogenized, hermetically sealed, and stored for at least 25 days to ensure secular equilibrium between 226Ra, 222Rn and the short-lived daughter radionuclides of the latter. The analytical procedures used have been discussed in former contributions by some of the authors [48,49,76]

2.3. Contamination Assessment Methodology

A large number of contamination indices can be applied to assess the quality of sediments. However, the results of the evaluation have shown to be highly dependent on the reference values used [77,78]. Therefore, the use of a strategy found on the application of a combination of indices based on different and site-specific criteria has been widely used to obtain a more precise evaluation of the studied area [28,29,30].
Among the numerous indices available for ranking sediment samples for contamination by potentially toxic elements, a combination of individual and integrated risk assessment indices was used in this study to estimate the pollution degree. The same criteria have been followed in choosing the individual and integrated indices: indices that depend only on the reference values and indices that also consider a reference element. The contamination factor (Cfi,j), the geoaccumulation index (Igeoi,j), and the enrichment factor (Efi,j) are used as individual indices to calculate the degree of contamination of each potentially toxic element (i) in a particular site (j). The modified degree of pollution (mCdj), the mean enrichment quotient (MEQj), and the potential ecological risk index (RIj) are used as integrated indices to determine the degree of pollution of the set of pollutants in a given site (j). In addition, the assessment of sediment quality for potentially toxic elements can be determined by indices based on freshwater sediment quality guidelines (SQGs). In this sense, the toxic risk index, TRIj, as an integral index is considered.
Table 1 shows a detailed description of the indices considered in this study to estimate the level of contamination and the potential ecological risk of potentially toxic elements in the sediments of the Limoncocha lagoon.

3. Results and Discussion

3.1. Density Profile

The geological formations present in the surface sediments around the Limoncocha lagoon are mainly shale and, to a lesser degree, sandy shale. As surface soil deposits, there are fluvial sandstones, especially in the southern part of the lagoon (corresponding to old flood areas associated with the Napo River) [86,87].
The 40K and 232Th are mostly found in clays and shales, while shale-free sandstones and carbonates (of lower density) have low concentrations of radioactive material. Therefore, in the core under study, the last layer deposited, the most recent, may have incorporated soil material rich in sandstone with lower concentrations of radioactive isotopes due to increased runoff as a consequence of the increased deforestation and human activity (urbanization, agricultural land, oil exploitation) as well as by the contribution of fluvial sandstones from the Napo River during flooding events (Figure 2a,b). The evolution of the densities (Figure 2c) shows an increase in density at greater depths, starting at 38 cm, which remains at high values (2.1 ± 0.01 g cm−3) until the deepest cm, compared to the first 10 cm with values of (2.0 ± 0.03 g cm−3).

3.2. Trace Elements Concentration Profiles

Figure 3 shows the concentration profiles of studied minor elements (As, Ba, Cd, Co, Cr, Cu, Mo, Ni, Pb, V, Zn) and major elements (Al, Fe, Mn, P, and Si) of interest. Six samples of layers (0–1 cm, 10–12 cm, 20–21 cm, 30–31 cm, 40–41 cm, 47–50 cm) of different size, from 1 to 3 cm in length depending on the availability of material, have been analyzed.
The first analysis of Figure 3, shows a generalized behavior in which the concentrations decrease between −10 cm and the core surface. Figure 4 shows the concentration profiles of each element studied together with the evolution of the 210Pbexcess value, allowing establish potential correlations between elements’ concentrations and chronology of human actions and natural events. The dashed lines envelop the values with differences of ±10% related to the 50 cm depth value, which include the lower values obtained at the bottom of the core. Two different trends can be considered in the evolution of the studied elements.
The majority of studied elements (Figure 4-Type A) show their highest values in the depth range of −10 cm and −30 cm, with sharp declines at −40 cm of Al, As, Fe, Mn, and Mo but moderate decreases of Ba, Cd, Cr, Ni, Pb and Zn at the same depth. From this depth (−40 cm) the concentrations remain practically constant at low values with a similar behavior to the observed 210Pbexcess concentration profile. Although Ni shows this trend, the entire profile concentrations differ only by ±23.3%. In the case of Co, Cu, P, Si, and V, no defined trend is observed in the concentration profiles with maximum variation in concentrations throughout the entire profile between ±12% for Cu and ±22.5% for V (Figure 4-Type B).
In the upper scale of Figure 4, the concentration values of the surface sediments analyzed in previous works [69,70] have been included, highlighting in red the one corresponding to the surface sample called “Centre of the Lagoon” (SE2). Some of the surface sediments analyzed exhibit element concentration values lower than the minimum values reached at a core depth of 50 cm as it is summarized in Table 2. This fact indicates that, in this case, with data obtained from a single core, the concentrations of trace elements in the deeper samples cannot be considered as values to establish geochemical background values.

3.3. Pollution Indices Profiles

In order to determine the level of contamination and evaluate the ecological risk of the sediment core, both individual and integrated pollution indices are applied to each of the sections analyzed in the core.

3.3.1. Selection of Geochemical Baseline and Reference Element

To determine the pollution indices, it is necessary to establish both a geochemical baseline and a reference element. On the one hand, Carrillo et al. [70] established the geochemical baseline of As, Ba, Cd, Co, Cr, Cu, Mo, Ni, Pb, V, and Zn in the surface sediments of the Limoncocha lagoon, using four different statistical methods as relative cumulative frequency method, iterative 2σ-technique, 4σ-outlier-technique and normalization method to a “conservative” element. This work concludes that the relative cumulative frequency method leads to the best performance of the geochemical baselines. Given the impossibility of using the deep layers concentrations of the studied sediment core as the geochemical baseline, the values in mg kg−1 of As: 3.09; Ba: 311; Cd: 0.352; Co: 18.8; Cr: 36.0; Cu: 80.4; Mo: 2.36; Ni: 21.6; Pb: 13.4; V: 129 and Zn: 102 provided by Carrillo et al. [70], will be considered as the geochemical baseline for the determination of the pollution indices in the present work.
On the other hand, the previous work of Carrillo et al. [69] considers Al as the conservative element with a value of 99,078 mg kg−1 that serves to normalize the concentration of the studied elements in the core. The selection was based on the low values (6.75%) of the robust nonparametric estimator CV*(%) = (MAD/Median) × 100, where MAD = Median [|Ci-median (Ci)|] with Ci the concentration of element i obtained from surface sediments samples in the Limoncocha lagoon.

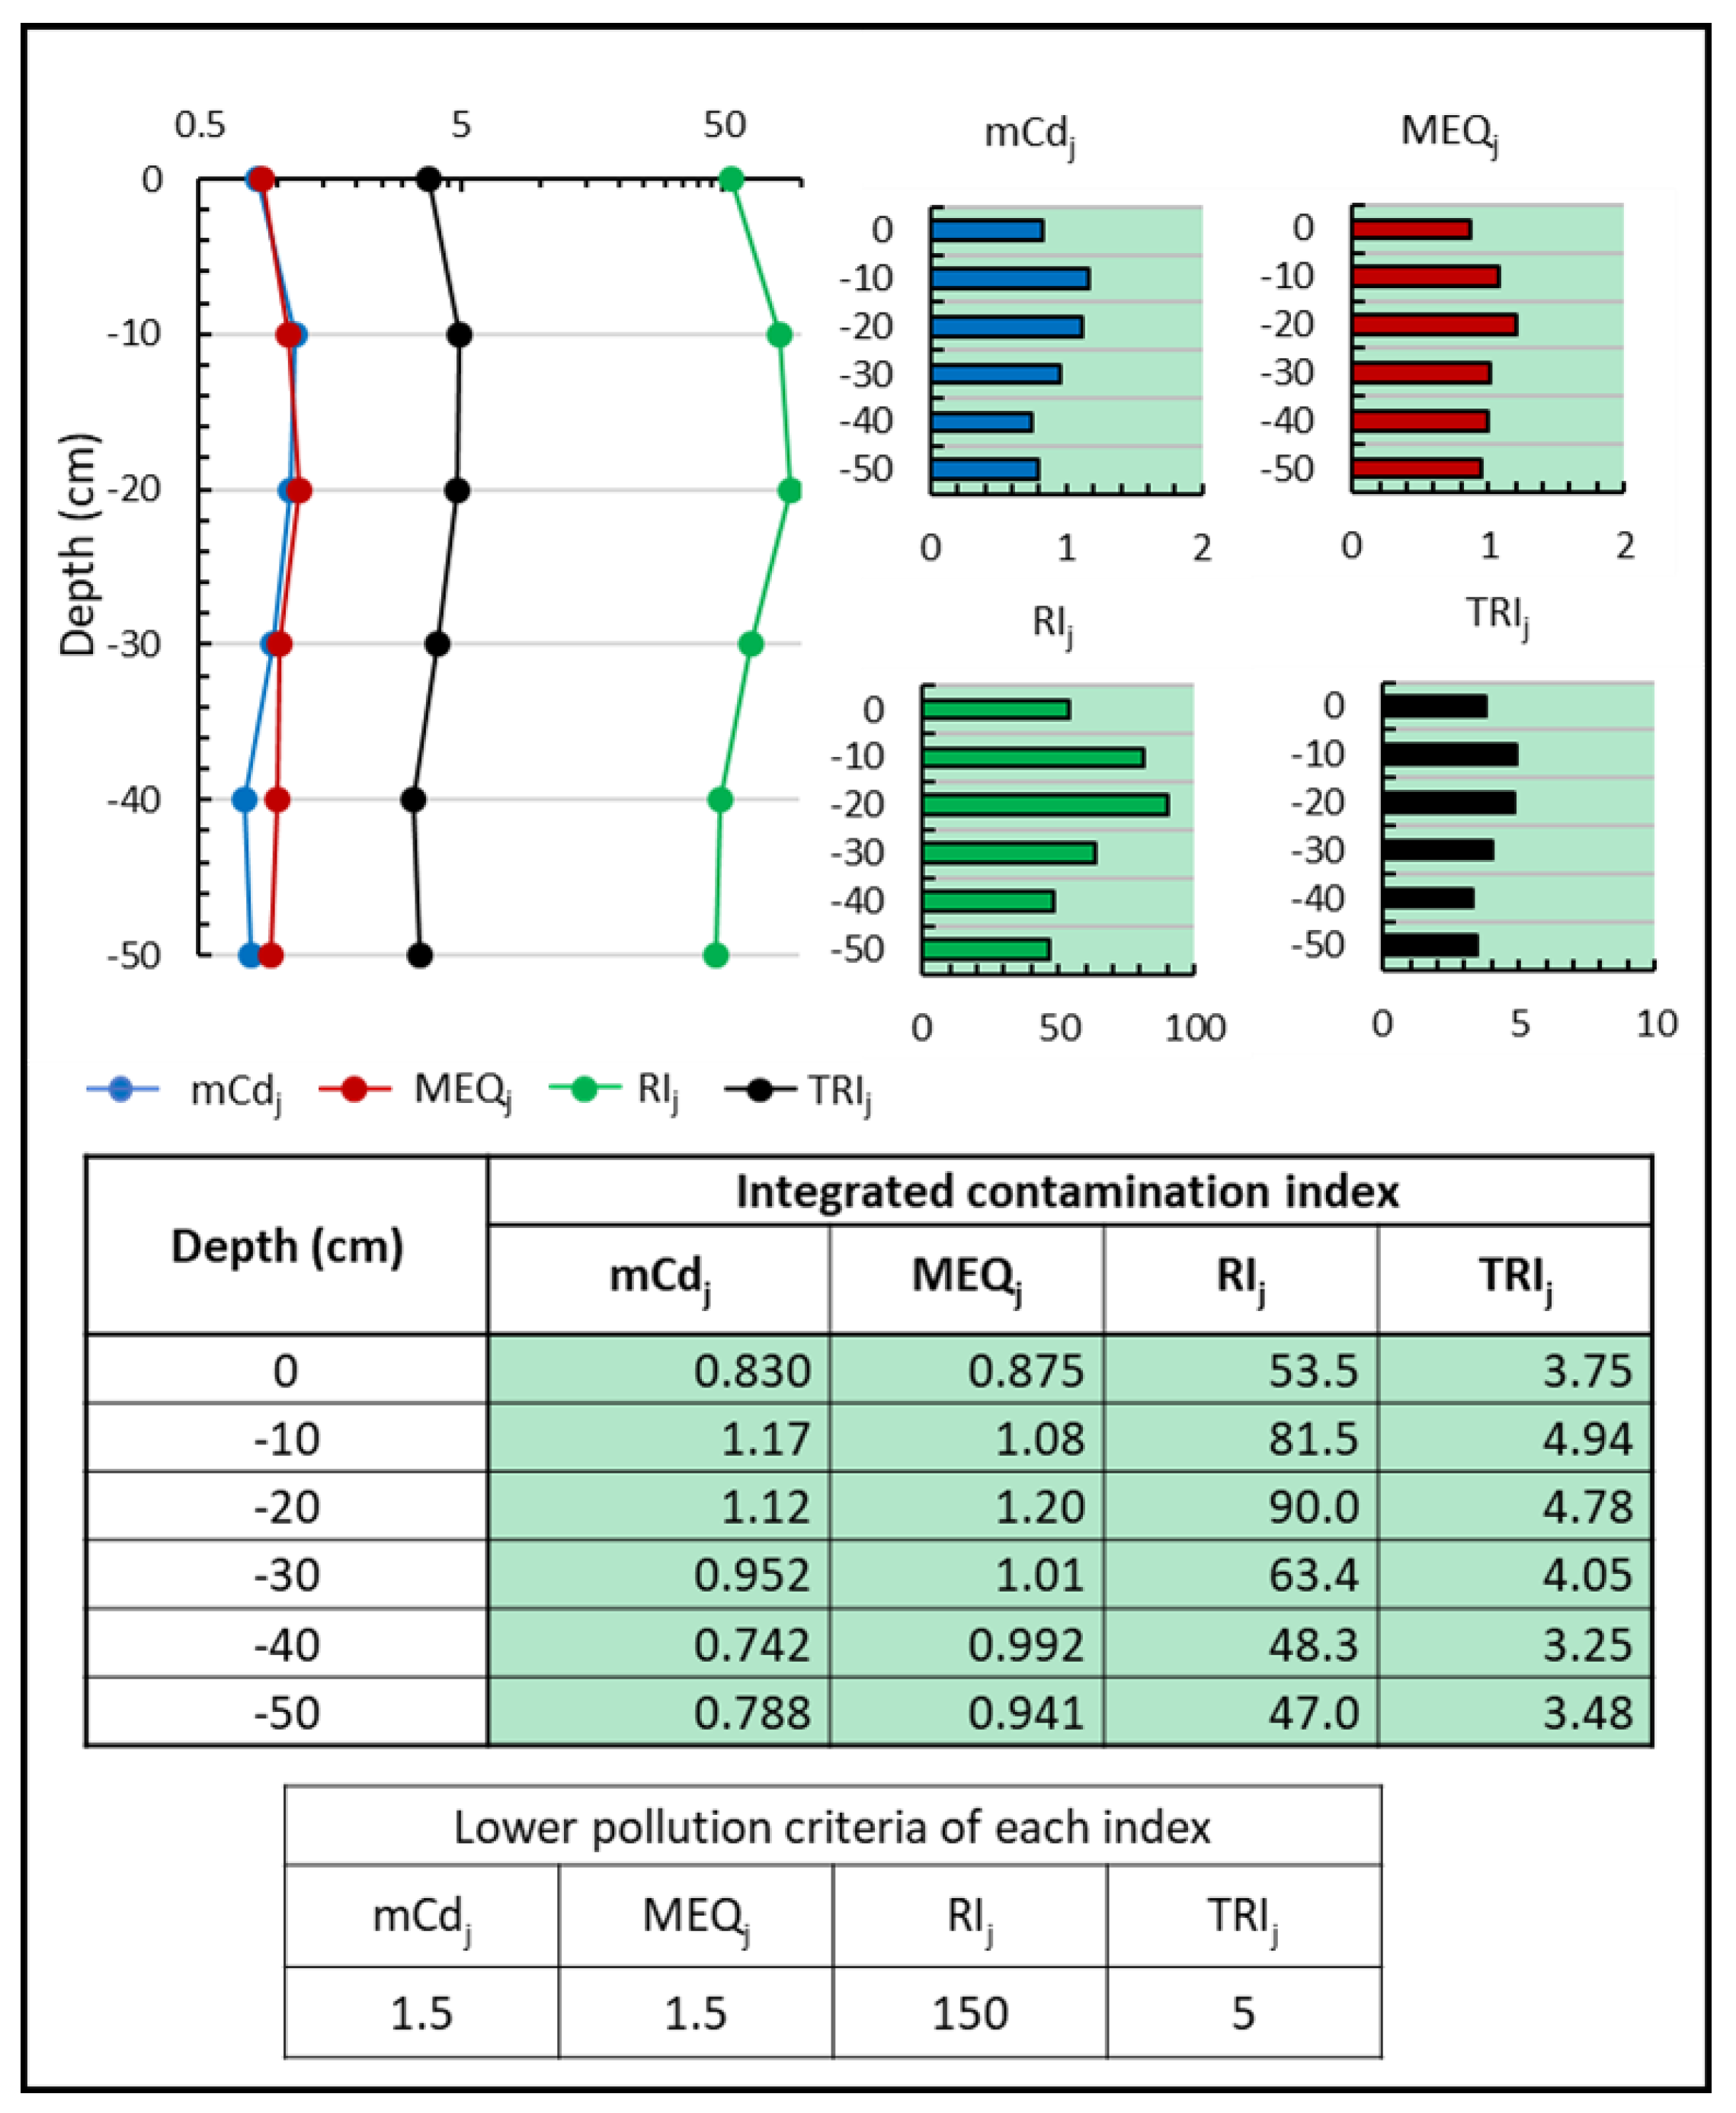
3.3.2. Contamination and Potential Risk Assessment Based on Pollution Indices

Figure 5 shows the profiles of the individual indices, Cfi,j, Igeoi,j and Efi,j, for all the studied elements. A bar graph is shown with the values of the individual indices obtained at the different depths of 1 cm, 10 cm, 20 cm, 30 cm, 40 cm, and 50 cm. Obtained values are compared with each index criterion (Table 1) with the easy capturing of the pollution level through a color code. Figure S1 of the supplementary information shows the numerical values of each index for all potential contaminants.
A general trend of Cfi,j values is observed (Figure 5 and Figure S1), with the highest values between −10 cm and −30 cm, and a slight decrease at the surficial layer. Cfi,j values are lower than 2 for all elements and depths, showing moderate contamination (1< Cfi,j <2) due to As and Mo at all depths. Cu up to −30 cm; Ba, Cd and Pb at −10 cm and −20 cm and Ni at −10 cm exceed the value of Cfi,j = 1, providing a classification of “moderate contamination” at these depths. The Igeoi,j index only classifies as pollution class 1, “between polluted and moderately polluted” the depths −10, −20, and −30 cm due to As, −20 cm due to Cd and −10 cm due to Mo. The remaining potential contaminants are classified in class 0 as “uncontaminated”. Obtained Efi,j values are lower than 2 for all elements and depths, except for As at −10 cm and −30 cm with Efi,j = 2.04 and Efi,j = 2.10 respectively, showing “low enrichment”. As, Cu and Mo at all depths, Ba at −10 to −50 cm depth, Ni at −10, −20, −40, and −50 cm depth, Cd at −10, −20 and −40 cm depth and Pb at −20 and −40 cm depth show Efi,j > 1 (“less enrichment”). In addition, it is observed that Pb and Cd exhibit irregular behaviour in relation to the Efi,j index.
The individual indices show As and Mo and to a lesser extent Cu, Ba, Cd, Ni, and Pb, as elements with concentrations greater than the reference values, classifying some depths with a certain degree of contamination and enrichment with respect to the geochemical baseline and reference element; however, in all cases, only the lowest values indicative of certain contamination and enrichment is reached. Such contamination is multi-element due to several trace elements that probably come from potential wastewater discharges from oil exploration and exploitation activities (Ba, Ni, Mo) [2,15,54,88,89,90,91,92] and domestic, agricultural, and industrial activities as aquaculture, all of them potential sources of As, Cu, Cd and Pb [93,94,95,96,97]. Additionally, there are keep in mind that this sampling point, the center of the Limoncocha lagoon, collects all the runoff from the area which is influenced by human activity.
Since the Limoncocha lagoon is an important source of food for the community, its health and wellness may be compromised by toxic substances in the lagoon’s sediments. Additionally, sediment pollution will have a negative effect on the environmental conservation and the preservation of the area as a tourist center, generating elements associated with the community identity and its link with the Kichwa culture. The meanings and relationships established with the biological reserve in general and with the lagoon in particular, are being strengthened through community tourism activities as well as conservation and care of the environment, especially among children and young people. Mestanza et al. [98], found that among the community there are different appreciation regarding the importance of the lagoon: while some value the reserve as a source of food, others value it as a source of work through tourism and recreation. In both cases, the incidence of toxic substances in sediments will jeopardize the sustainability of the area and, in any case, will harm the native inhabitants and visitors of Limoncocha.
As a complement to the individual indices, the following integrated pollution indices have been applied to the sediment core: (i) Modified contamination degree, mCdj, based on background values since it integrates Cfi,j; (ii) Mean Enrichment Quotient, MEQj, based on Efi,j which considers a reference element; (iii) Potential ecological risk index, RIj, which takes into account the toxic response of each element studied, and (iv) Toxic risk index, TRIj based on sediment quality guidelines (SQGs). Figure 6 shows the vertical distribution and the values obtained for each of the integrated indices at the different depths of the sediment core. The four applied indices indicate “zero or very low degree of contamination” considering the limit values of each indices (Table 1). In all cases, mCdj < 1.5 so it is classified as “Without pollution”, MEQj < 1.5 corresponds to category 1 (“No enrichment”), RIj < 150 corresponding to “no toxic risk” and TRIj < 5 classified as “no toxic risk”. The indices’ s depth profiles are similar, showing the highest values at depths between −20 cm and −30 cm and minimum values at depths of −40 cm.

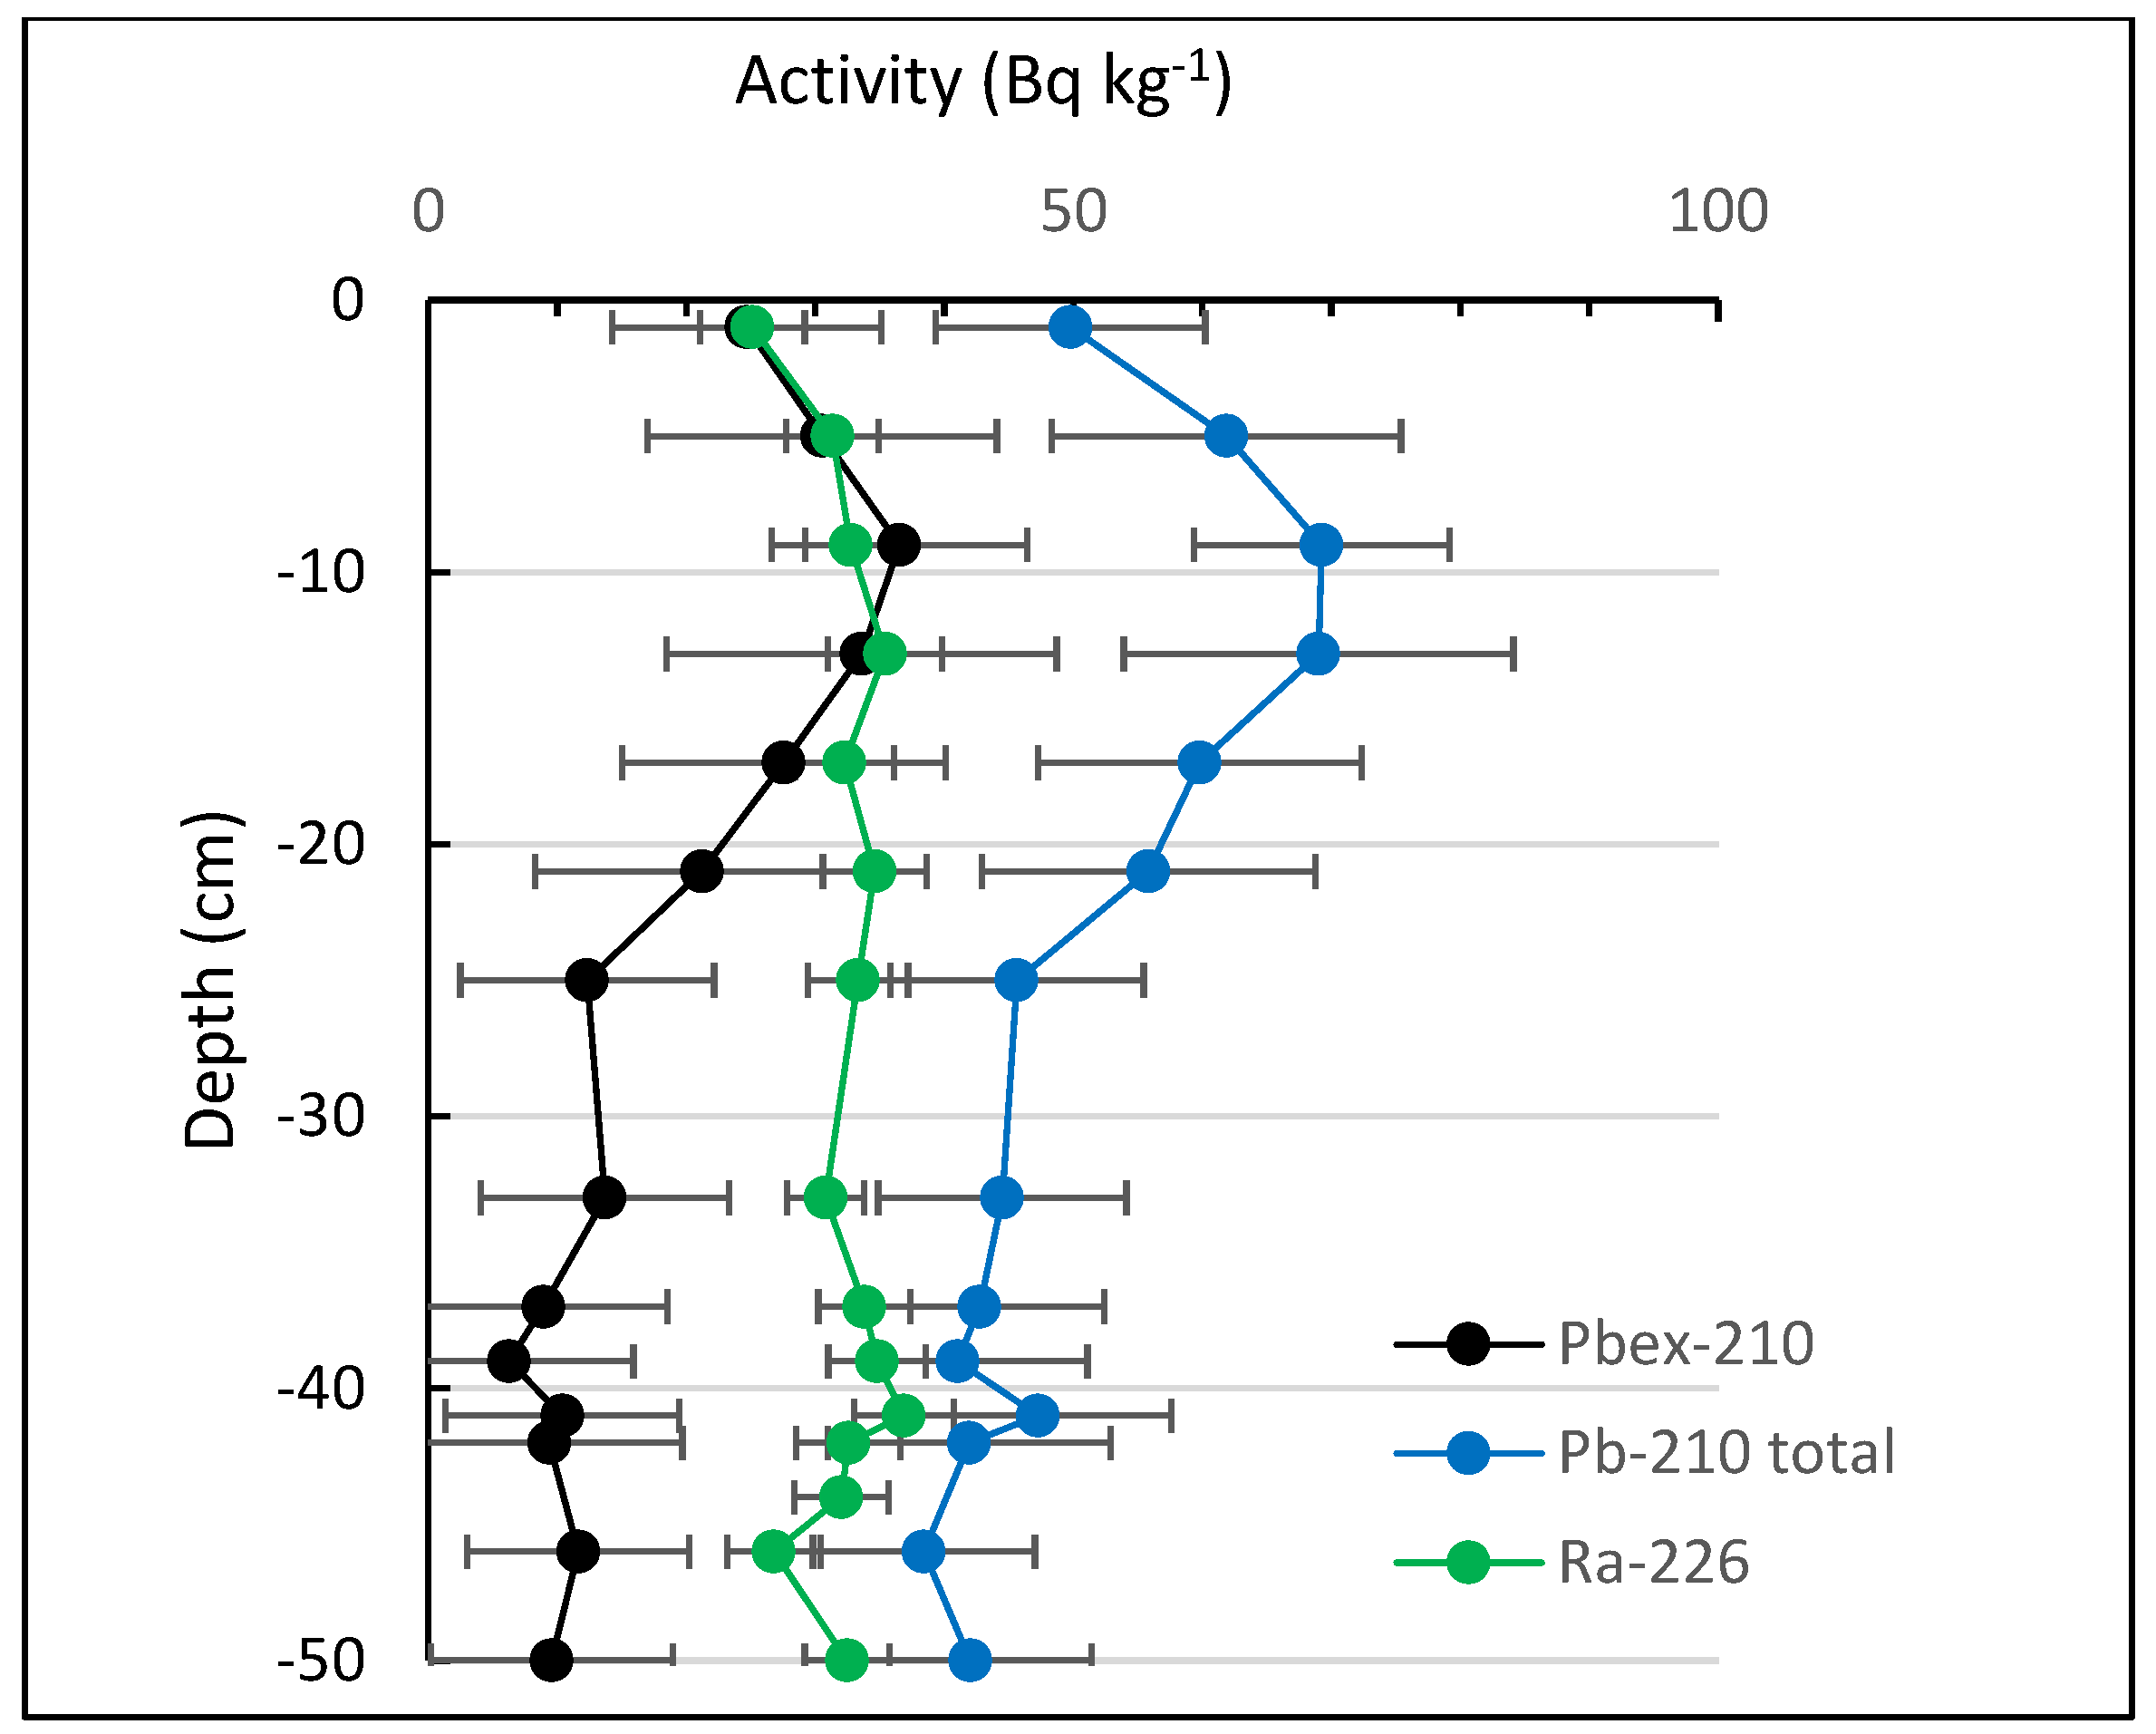
3.4. Radionuclides and Sedimentation Rate in the Sediment Core

The activity concentration in sediment core slice samples is shown in Table 3. The activity concentrations of 226Ra, 232Th, and 40K are within the ranges given by UNSCEAR [99,100], World Soil [101], and UCC [102].
The results of 210Pbtotal, 226Ra, and 210Pbexcess concentrations (Figure 7) show slight variations of 226Ra (32.2 ± 3 Bq kg−1) and that secular equilibrium has not been reached at the studied depth. The 210Pbexcess profile does not show an exponential decrease with depth in the 50 cm sampled that would be expected in a simple radioactive decay. The 210Pbexcess profile obtained in the present work can be subdivided into three sections: one up to 9 cm in which the concentration decreases towards the surface, another central section, in which the concentration decreases with depth following an exponential curve, and a third section in which the concentration remains practically constant.
In the superficial section of the core (0–9 cm), there is an increase in 210Pbexcess concentration to −9 cm. This corresponds to the incorporation of new material rich in sandstone with lower concentrations of radioactive isotopes, due to either punctual or periodic floods with different materials. It might think that from that depth to the surface, a material with lower concentrations of all analyzed elements has been dragged. 40K is present in terrestrial material in a fixed ratio of 0.0115% of total K depending on the type of material.
Therefore, the first 9 cm can be made of a different material than the rest of the core. Most of the elements have the same evolution as the radionuclides with a decrease in concentration from −10 cm to the surface of As, Ba, Co, Cr, Cu, Mo, Ni, Pb, V and a decrease from −20 cm of Cd and Zn (Figure 4). There may have been a continuous phenomenon that has taken place cyclically with other material (the profile is descending and not flat), caused probably by the groundwater connections between the Napo River and the Limoncocha lagoon. After relevant flooding events, every approximately 2 years, the waters of the lagoon rise about three meters, but without flooding the lagoon as in previous periods, recovering the level of the water to its normal state. Several reasons can be put forward for that behavior. On the one hand, the oil infrastructures, mainly highways, have been able to act as screens against possible avenues of the river. On the other hand, the water of the Napo River has decreased in flow, and there have been sandbanks making the river in certain places no longer navigable. As a consequence, when the river flow rises, it drags the sandbanks that accumulate on the banks, acting as containment barriers for the overflow of the river water. Finally, the Lagoon has underground currents that keep the river and Lagoon connected, so that in recent decades, the lagoon’s water mirror rises to 3 m above normal, without there being a visible direct connection between the two bodies of water. Jarrin et al. [86] show that in the entire southern part of the lagoon, up to the left bank of the Napo River, the groundwater is less than 5 m deep and may constitute the connection between the river and the lagoon in times of great rains and avenues. These cyclical flooding events, together with bioturbation processes, may have caused remobilization and resuspension of sediments, providing the radionuclides and elements profiles obtained. Several authors such as [103,104,105,106,107,108] among others, have discarded the data of the most superficial layers of the cores to obtain the graphical solution of the sediment mass flow. The main arguments put forward by those researchers to justify the presentation and treatment of their data included the invalidity of steady-state accumulation caused by bioturbation, turbulent flow, and sediment core sampling,
In the deeper section (39 cm−50 cm), the 210Pbexcess is constant and everything measured for radionuclides and elements is constant, but not zero. The constant 210Pbexcess would indicate a process of mixing and/or resuspension of the same material so that in those centimeters it is always the same. This final section seems mixed and the balance between 226Ra and 210Pb is not reached. Authors such as Mabit et al. [58], San Miguel et al. [109], and Harb [110] indicate similar situations, either because the core is too short to reach the equilibrium depth (depth at which the total 210Pb is in equilibrium with the supported 226Ra) or because the analytical uncertainties are very large. Although there are only two element concentration data in this core section (−39 cm and −50 cm), a slight increase in the elements Cr, Ni, Zn, Co, P and V is observed at −50 cm, as well as the conservative elements Al and Fe which may indicate an entry of terrigenous material; additionally, these last layers present a higher density with respect to the more superficial layers.
Hydrological and climatological local events of natural origin as flooding may be related to the observed remobilization which leads flat 210Pbexcess profiles (see [111,112]). Since there are no written records of processes related to hydrological changes in the lagoon, interviews were conducted with people from the Limoncocha Community. Apart to the episodes of El Niño in Ecuador [113,114] verbal contacts with the inhabitants of the area confirm the cyclic flooding of the lagoon in ancient times.
Considering the intermediate section [9–39 cm] of the studied core, the 210Pbexcess concentrations decrease at a constant rate (See Figure 8a). The application of the constant flux/constant sedimentation rate (CF-CS) model provides a good fitting (R2 = 0.95) of the 210Pbexcess exponential decrease with depth and a sedimentation accumulation rate (SAR) of 0.56 ± 0.03 cm y−1 (Figure 8b,c). In this section, trace elements reach the highest values along the core (Figure 4) with a minor enrichment of As, Mo, Cu, Ba, Cd, Ni and Pb respect to the geochemical baseline (Figure 5).
In order to validate the sedimentation rate obtained and reduce the uncertainty introduced when applying the CF-CS model to a single section of the core, the evolution of the mass accumulation with depth has been verified, obtaining a linear profile throughout the entire core (Figure 9a). The profile of ln (210Pbexcess) respect to the accumulated mass (g cm–2) shows a good linear fit (Figure 9b) allowing to obtain a value of accumulated mass sediment rate (MAR) of 1.17 ± 0.04 g cm−2 y−1 in the intermediate section (9–39 cm) of the core. Assuming this MAR value constant in the initial and final sections of the core, that is, throughout the entire core, their application to the three differentiated sections allows to estimate the ages of the layers and the sediment rate in each of them, as a function of the mass depth reached in each layer, as shown in Figure 9c. The sediment accumulation rates (SAR) obtained from the accumulated mass sediment rate (MAR) match the sedimentation rate obtained by the CF-CS model in the intermediate section of the core.
As a summary of the three studied sections, Figure 10 shows the most plausible dating with the possible events that occurred in the sections under study. Values of the individual and integrated pollution indices compared with the indicative limits of contamination in each case are included in Figure 10. As has been mentioned, the uncertainty in the radionuclide data, as well as the mixed compositions of the studied samples, makes the uncertainty dating high. However, the values obtained show referenced and observed phenomena in the area that allow to estimate the events that occurred in the Limoncocha lagoon.

4. Conclusions

Trace elements concentration profiles in the core of the center of the Limoncocha lagoon allows us to differentiate two trends. On the one hand, Al, As, Ba, Cd, Cr, Fe, Mn, Mo, Ni, Pb and Zn with minimum concentrations at −40 cm which remain constant down to −50 cm. On the other hand, Co, Cu, P, Si and V with a non-defined concentration trend with depth and concentration variation between ±12% and ±22.5% throughout the profile. However, in all of the studied elements, concentrations decrease between −10 cm and the surface and maximum values are between −10 cm and −30 cm. The minimum values reached at a depth of −50 cm are greater than the concentration values of superficial sediments analyzed previously, so the concentrations of trace elements in the deeper samples cannot be considered as the geochemical background of the lake.
Individual pollution indices Ef, Cf and Igeo show As and Mo as well as Cu, Ba, Cd, Ni and Pb to a lesser extent, as elements with concentrations greater than the reference values. This implies a certain degree of contamination and enrichment with respect to the baseline, although in all cases they only reach the lowest values indicative of certain contamination. Detected anthropogenic contamination can come from potential wastewater discharges from petroleum, domestic, agricultural and industrial aquaculture activities. The four integrated indices applied mCd, MEQ, RI, and TRI indicate “zero or very low degree of contamination”, “category 1 non-enrichment”, “low-risk potential” and “no toxic risk” respectively.
The 210Pbexcess profile obtained can be subdivided into three sections that may be due to different natural and/or anthropogenic processes. Superficial section (0–9 cm) with an increase in 210Pbexcess up to −9 cm where a contribution of material of less density could have been produced due to the underground avenues of the nearby Napo River. A deeper section (39–50 cm) with a 210Pbexcess profile, radionuclides and studied trace elements constant, where reworking and resuspension due to floods could have taken place. The intermediate section (9–39 cm) with a 210Pbexcess exponential decrease with depth allows to apply CF-CS model to obtain an average sediment ratio of 0.56 ± 0.03 cm y−1. Analysis of the accumulated mass sediment rate confirms this ratio and allows a dating estimate of the sediment profile.
The results obtained will be useful data to feed mechanistic models applied to the mobility and transport of metals in water masses; they may also improve estimations of the contribution to sediment pollution and provide insight into mechanistic explanations of sediment-water interactions.
A sampling of sediment profiles in different locations of the Limoncocha lagoon is proposed, both near and far from the possible sources of contaminant input such as tributary rivers or near the population in order to corroborate the obtained results.

Supplementary Materials

The following supporting information can be downloaded at: https://www.mdpi.com/article/10.3390/environments10010002/s1, Figure S1: Profile of individual contamination indices and their classification. Table embedded show the index values at different depths.

Author Contributions

Conceptualization, J.R.V.; methodology, G.R.-G., J.G.-A. and J.R.V.; validation, J.G.-A. and J.R.V.; formal analysis, J.R.V.; investigation, K.C.-C., G.R.-G. and J.G.-A.; writing—original draft preparation, J.R.V.; writing—review and editing, K.C.-C., G.R.-G., J.G.-A. and J.R.V.; visualization, J.G.-A. and J.R.V.; supervision, J.R.V. All authors have read and agreed to the published version of the manuscript.

Funding

This research received no external funding.

Data Availability Statement

Not applicable.

Conflicts of Interest

The authors declare no conflict of interest.

References

  1. Audry, S.; Schäfer, J.; Blanc, G.; Bossy, C.; Lavaux, G. Anthropogenic Components of Heavy Metal (Cd, Zn, Cu, Pb) Budgets in the Lot-Garonne Fluvial System (France). Appl. Geochem. 2004, 19, 769–786. [Google Scholar] [CrossRef]
  2. Chatterjee, M.; Silva Filho, E.V.; Sarkar, S.K.; Sella, S.M.; Bhattacharya, A.; Satpathy, K.K.; Prasad, M.V.R.; Chakraborty, S.; Bhattacharya, B.D. Distribution and Possible Source of Trace Elements in the Sediment Cores of a Tropical Macrotidal Estuary and Their Ecotoxicological Significance. Environ. Int. 2007, 33, 346–356. [Google Scholar] [CrossRef]
  3. Torres, E.; Ayora, C.; Canovas, C.R.; García-Robledo, E.; Galván, L.; Sarmiento, A.M. Metal Cycling during Sediment Early Diagenesis in a Water Reservoir Affected by Acid Mine Drainage. Sci. Total Environ. 2013, 461–462, 416–429. [Google Scholar] [CrossRef] [PubMed]
  4. Arcega-Cabrera, F.; Noreña-Barroso, E.; Oceguera-Vargas, I. Lead from Hunting Activities and Its Potential Environmental Threat to Wildlife in a Protected Wetland in Yucatan, Mexico. Ecotoxicol. Environ. Saf. 2014, 100, 251–257. [Google Scholar] [CrossRef] [PubMed]
  5. Zaaboub, N.; Martins, M.V.A.; Dhib, A.; Béjaoui, B.; Galgani, F.; el Bour, M.; Aleya, L. Accumulation of Trace Metals in Sediments in a Mediterranean Lagoon: Usefulness of Metal Sediment Fractionation and Elutriate Toxicity Assessment. Environ. Pollut. 2015, 207, 226–237. [Google Scholar] [CrossRef]
  6. López-Blanco, C.; Kenney, W.F.; Varas, A. Recent Flood Management Efforts Obscure the Climate Signal in a Sediment Record from a Tropical Lake. J. Paleolimnol. 2017, 58, 467–478. [Google Scholar] [CrossRef]
  7. Kutlu, B. Dissemination of Heavy-Metal Contamination in Surface Sediments of the Uzunçayır Dam Lake, Tunceli, Turkey. Hum. Ecol. Risk Assess. 2018, 24, 2182–2194. [Google Scholar] [CrossRef]
  8. Aghadadashi, V.; Neyestani, M.R.; Mehdinia, A.; Riyahi Bakhtiari, A.; Molaei, S.; Farhangi, M.; Esmaili, M.; Rezai Marnani, H.; Gerivani, H. Spatial Distribution and Vertical Profile of Heavy Metals in Marine Sediments around Iran’s Special Economic Energy Zone; Arsenic as an Enriched Contaminant. Mar. Pollut. Bull. 2019, 138, 437–450. [Google Scholar] [CrossRef]
  9. Chai, M.; Li, R.; Ding, H.; Zan, Q. Occurrence and Contamination of Heavy Metals in Urban Mangroves: A Case Study in Shenzhen, China. Chemosphere 2019, 219, 165–173. [Google Scholar] [CrossRef]
  10. Mao, L.; Ye, H.; Li, F.; Yang, M.; Tao, H.; Wen, H. Enrichment Assessment of Sb and Trace Metals in Sediments with Significant Variability of Background Concentration in Detailed Scale. Environ. Sci. Pollut. Res. 2019, 26, 2794–2805. [Google Scholar] [CrossRef]
  11. Skowronek, F.; Sagemann, J.; Stenzel Schulz, F.H. Evolution of Heavy-Metal Profiles in River Weser Estuary Sediments, Germany; Springer: Berlin/Heidelberg, Germany, 1994; Volume 24. [Google Scholar]
  12. Hamzeh, M.; Ouddane, B.; El-Daye, M.; Halwani, J. Profile of Trace Metals Accumulation in Core Sediment from Seine River Estuary (Docks Basin). Environ. Technol 2013, 34, 1107–1116. [Google Scholar] [CrossRef] [PubMed]
  13. Hernández-Crespo, C.; Martín, M. Determination of Background Levels and Pollution Assessment for Seven Metals (Cd, Cu, Ni, Pb, Zn, Fe, Mn) in Sediments of a Mediterranean Coastal Lagoon. Catena 2015, 133, 206–214. [Google Scholar] [CrossRef]
  14. Bárcena, J.F.; Claramunt, I.; García-Alba, J.; Pérez, M.L.; García, A. A Method to Assess the Evolution and Recovery of Heavy Metal Pollution in Estuarine Sediments: Past History, Present Situation and Future Perspectives. Mar. Pollut. Bull. 2017, 124, 421–434. [Google Scholar] [CrossRef] [PubMed]
  15. Davoodi, H.; Gharibreza, M.; Negarestan, H.; Mortazavi, M.S.; Lak, R. Ecological Risk Assessment of the Assaluyeh and Bassatin Estuaries (Northern Persian Gulf) Using Sediment Quality Indices. Estuar. Coast. Shelf Sci. 2017, 192, 17–28. [Google Scholar] [CrossRef]
  16. Wang, G.; Hu, X.; Zhu, Y.; Jiang, H.; Wang, H. Historical Accumulation and Ecological Risk Assessment of Heavy Metals in Sediments of a Drinking Water Lake. Environ. Sci. Pollut. Res. 2018, 25, 24882–24894. [Google Scholar] [CrossRef]
  17. Bai, J.; Zhao, Q.; Wang, W.; Wang, X.; Jia, J.; Cui, B.; Liu, X. Arsenic and Heavy Metals Pollution along a Salinity Gradient in Drained Coastal Wetland Soils: Depth Distributions, Sources and Toxic Risks. Ecol. Indic. 2019, 96, 91–98. [Google Scholar] [CrossRef]
  18. Fernandes, F.; Poleto, C. Geochemistry in Sediment Core for Zinc and Nickel Metals and Comparison between Indexes of Environmental References. J. Environ. Eng. 2019, 145, 04018146. [Google Scholar] [CrossRef]
  19. Huang, B.; Guo, Z.; Xiao, X.; Zeng, P.; Peng, C. Changes in Chemical Fractions and Ecological Risk Prediction of Heavy Metals in Estuarine Sediments of Chunfeng Lake Estuary, China. Mar. Pollut. Bull. 2019, 138, 575–583. [Google Scholar] [CrossRef]
  20. Li, R.; Tang, C.; Li, X.; Jiang, T.; Shi, Y.; Cao, Y. Reconstructing the Historical Pollution Levels and Ecological Risks over the Past Sixty Years in Sediments of the Beijiang River, South China. Sci. Total Environ. 2019, 649, 448–460. [Google Scholar] [CrossRef]
  21. Meng, K.; Xu, M.; Zhao, Y.; Li, F.; Xu, W.; Chen, Y. Accumulation, Sources and Pollution of Heavy Metals in the Sediments of Coastal Tidal Flats in the North Jiangsu Radial Sand Ridges, China. Environ. Earth Sci. 2019, 78, 128. [Google Scholar] [CrossRef]
  22. Orani, A.M.; Vassileva, E.; Renac, C.; Schmidt, S.; Angelidis, M.O.; Rozmaric, M.; Louw, D. First Assessment on Trace Elements in Sediment Cores from Namibian Coast and Pollution Sources Evaluation. Sci. Total Environ. 2019, 669, 668–682. [Google Scholar] [CrossRef] [PubMed]
  23. Vieira, L.M.; Rizzi, J.; do Couto, E.V.; Souza, D.C.; Ferreira, P.A.L.; Figueira, R.; Froehner, S. Historical Pollution of an Urban Watershed Based in Geochemical, Geoacumulation, and EROD Activity in PLHC-1 Analyses in Sediment Cores. Arch. Environ. Contam. Toxicol. 2019, 76, 191–205. [Google Scholar] [CrossRef] [PubMed]
  24. Fural, Ş.; Kükrer, S.; Cürebal, İ. Geographical Information Systems Based Ecological Risk Analysis of Metal Accumulation in Sediments of İkizcetepeler Dam Lake (Turkey). Ecol. Indic. 2020, 119, 106784. [Google Scholar] [CrossRef]
  25. Li, J.; Zuo, Q.; Feng, F.; Jia, H. Occurrence and Ecological Risk Assessment of Heavy Metals from Wuliangsuhai Lake, Yellow River Basin, China. Water 2022, 14, 1264. [Google Scholar] [CrossRef]
  26. Alvarez-Guerra, M.; Viguri, J.R.; Casado-Martínez, M.C.; DelValls, T.A. Sediment quality assessment and dredged material management in Spain: Part I, application of sediment quality guidelines in the bay of Santander. Integr. Environ. Assess. 2007, 3, 529–538. [Google Scholar] [CrossRef] [PubMed]
  27. Alvarez-Guerra, M.; Viguri, J.R.; Casado-Martínez, M.C.; DelValls, T.A. Sediment quality assessment and dredged material management in Spain: Part II, analysis of action levels for dredged material management and application to the bay of Cadiz. Integr. Environ. Assess 2007, 3, 539–551. [Google Scholar] [CrossRef]
  28. Dung, T.T.T.; Cappuyns, V.; Swennen, R.; Phung, N.K. From Geochemical Background Determination to Pollution Assessment of Heavy Metals in Sediments and Soils. Rev. Environ. Sci. Biotechnol. 2013, 12, 335–353. [Google Scholar] [CrossRef]
  29. Sakan, S.; Dević, G.; Relić, D.; Anđelković, I.; Sakan, N.; Đorđević, D. Evaluation of Sediment Contamination with Heavy Metals: The Importance of Determining Appropriate Background Content and Suitable Element for Normalization. Environ. Geochem. Health 2015, 37, 97–113. [Google Scholar] [CrossRef]
  30. Saddik, M.; Fadili, A.; Makan, A. Assessment of Heavy Metal Contamination in Surface Sediments along the Mediterranean Coast of Morocco. Environ. Monit. Assess. 2019, 191, 197. [Google Scholar] [CrossRef]
  31. Cáceres Choque, L.F.; Ramos Ramos, O.E.; Valdez Castro, S.N.; Choque Aspiazu, R.R.; Choque Mamani, R.G.; Fernández Alcazar, S.G.; Sracek, O.; Bhattacharya, P. Fractionation of Heavy Metals and Assessment of Contamination of the Sediments of Lake Titicaca. Environ. Monit. Assess. 2013, 185, 9979–9994. [Google Scholar] [CrossRef]
  32. Colizza, E.; Fontolan, G.; Brambati, A. Impact of a Coastal Disposal Site for Inert Wastes on the Physical Marine Environment, Barcola, Bovedo, Trieste, Italy. Environ. Geol. 1996, 27, 270–285. [Google Scholar] [CrossRef]
  33. Adamo, P.; Arienzo, M.; Imperato, M.; Naimo, D.; Nardi, G.; Stanzione, D. Distribution and Partition of Heavy Metals in Surface and Sub-Surface Sediments of Naples City Port. Chemosphere 2005, 61, 800–809. [Google Scholar] [CrossRef] [PubMed]
  34. Abrahim, G.M.S.; Parker, R.J. Assessment of Heavy Metal Enrichment Factors and the Degree of Contamination in Marine Sediments from Tamaki Estuary, Auckland, New Zealand. Environ Monit Assess. 2008, 136, 227–238. [Google Scholar] [CrossRef] [PubMed]
  35. Irabien, M.J.; Cearreta, A.; Leorri, E.; Gómez, J.; Viguri, J. A 130 Year Record of Pollution in the Suances Estuary (Southern Bay of Biscay): Implications for Environmental Management. Mar. Pollut. Bull. 2008, 56, 1719–1727. [Google Scholar] [CrossRef] [PubMed]
  36. Gałuszka, A.; Migaszewski, Z. Geochemical Background-an Environmental Perspective. Mineralogia 2011, 42, 7–17. [Google Scholar] [CrossRef]
  37. Wei, C.; Wen, H. Geochemical Baselines of Heavy Metals in the Sediments of Two Large Freshwater Lakes in China: Implications for Contamination Character and History. Environ. Geochem. Health 2012, 34, 737–748. [Google Scholar] [CrossRef]
  38. Viguri, J.R.; Irabien, M.J.; Yusta, I.; Soto, J.; Gómez, J.; Rodriguez, P.; Martinez-Madrid, M.; Irabien, J.A.; Coz, A. Physico-Chemical and Toxicological Characterization of the Historic Estuarine Sediments: A Multidisciplinary Approach. Environ. Int. 2007, 33, 436–444. [Google Scholar] [CrossRef]
  39. Costa, E.S.; Grilo, C.F.; Wolff, G.A.; Thompson, A.; Figueira, R.C.L.; Sá, F.; Neto, R.R. Geochemical Records in Sediments of a Tropical Estuary (Southeastern Coast of Brazil). Reg. Stud. Mar. Sci. 2016, 6, 49–61. [Google Scholar] [CrossRef]
  40. Birch, G.F. Determination of Sediment Metal Background Concentrations and Enrichment in Marine Environments—A Critical Review. Sci. Total Environ. 2017, 580, 813–831. [Google Scholar] [CrossRef]
  41. Dung, T.T.T.; Linh, T.M.; Chau, T.B.; Hoang, T.M.; Swennen, R.; Cappuyns, V. Contamination Status and Potential Release of Trace Metals in a Mangrove Forest Sediment in Ho Chi Minh City, Vietnam. Environ. Sci. Pollut. Res. 2019, 26, 9536–9551. [Google Scholar] [CrossRef]
  42. Guzmán, H.M.; Gómez-Álvarez, A.; Valenzuela-García, J.L.; Encinas-Romero, M.A.; Villalba-Atondo, A.I.; Encinas-Soto, K.K. Assessment of the Impact on Sediment Quality from Abandoned Artisanal Mine Runoffs in a Semi-Arid Environment (the Sonora River Basin—Northwestern Mexico). Environ. Earth Sci. 2019, 78, 145. [Google Scholar] [CrossRef]
  43. Wang, W.; Wang, S.; Chen, J.; Jiang, X.; Zheng, B. Combined Use of Diffusive Gradients in Thin Film, High-Resolution Dialysis Technique and Traditional Methods to Assess Pollution and Bioavailability of Sediment Metals of Lake Wetlands in Taihu Lake Basin. Sci. Total Environ. 2019, 671, 28–40. [Google Scholar] [CrossRef] [PubMed]
  44. Birch, G.; Lee, J.H. The Use of Sedimentary Metal Data in Predictive Modelling of Estuarine Contamination, Assessment of Environmental Condition and Pollutant Source Identification (Narrabeen Lagoon, Sydney, Australia). Environ. Sci. Pollut. Res. 2020, 27, 43685–43699. [Google Scholar] [CrossRef] [PubMed]
  45. Tnoumi, A.; Angelone, M.; Armiento, G.; Caprioli, R.; Crovato, C.; de Cassan, M.; Montereali, M.R.; Nardi, E.; Parrella, L.; Proposito, M.; et al. Heavy Metal Content and Potential Ecological Risk Assessment of Sediments from Khnifiss Lagoon National Park (Morocco). Environ. Monit. Assess. 2022, 194, 356. [Google Scholar] [CrossRef] [PubMed]
  46. Wu, H.; Wang, J.; Guo, J.; Hu, X.; Bao, H.; Chen, J. Record of Heavy Metals in Huguangyan Maar Lake Sediments: Response to Anthropogenic Atmospheric Pollution in Southern China. Sci. Total Environ. 2022, 831, 154829. [Google Scholar] [CrossRef]
  47. Meybeck, M.; Lestel, L.; Bonté, P.; Moilleron, R.; Colin, J.L.; Rousselot, O.; Hervé, D.; de Pontevès, C.; Grosbois, C.; Thévenot, D.R. Historical Perspective of Heavy Metals Contamination (Cd, Cr, Cu, Hg, Pb, Zn) in the Seine River Basin (France) Following a DPSIR Approach (1950-2005). Sci. Total Environ. 2007, 375, 204–231. [Google Scholar] [CrossRef]
  48. Soto-Torres, J.; Soto-Velloso, J.A.; Ródenas, G.; Gelen, A.; Díaz, O.; Viguri, J. Estimación de las tasas de erosión en torno a la bahía de Santander, España. Cienc Tierra Espacio 2007, 7, 1031–1036. [Google Scholar]
  49. Irabien, M.J.; Rada, M.; Gómez, J.; Soto, J.; Mañanes, A.; Viguri, J. An Assessment of Anthropogenic Impact in a Nature Reserve: The Santoña Marshes (Northern Spain). J. Iber. Geol. 2008, 34, 235–242. [Google Scholar]
  50. Bonachea, J.; Bruschi, V.M.; Hurtado, M.A.; Forte, L.M.; da Silva, M.; Etcheverry, R.; Cavallotto, J.L.; Dantas, M.F.; Pejon, O.J.; Zuquette, L.V.; et al. Natural and Human Forcing in Recent Geomorphic Change; Case Studies in the Rio de La Plata Basin. Sci. Total Environ. 2010, 408, 2674–2695. [Google Scholar] [CrossRef]
  51. Navas, A.; Valero-Garcés, B.; Gaspar, L.; Palazón, L. Radionuclides and Stable Elements in the Sediments of the Yesa Reservoir, Central Spanish Pyrenees. J. Soils Sediments 2011, 11, 1082–1098. [Google Scholar] [CrossRef] [Green Version]
  52. Song, Y.; Choi, M.S.; Lee, J.Y.; Jang, D.J. Regional Background Concentrations of Heavy Metals (Cr, Co, Ni, Cu, Zn, Pb) in Coastal Sediments of the South Sea of Korea. Sci. Total Environ. 2014, 482–483, 80–91. [Google Scholar] [CrossRef] [PubMed]
  53. Machado, K.S.; Ferreira, P.A.; Rizzi, J.; Figueira, R.; Froehner, S. Spatial and Temporal Variation of Heavy Metals Contamination in Recent Sediments from Barigui River Basin, South Brazil. Environ. Pollut. Clim. Change 2017, 1, 1–9. [Google Scholar] [CrossRef]
  54. Pratte, S.; Bao, K.; Shen, J.; de Vleeschouwer, F.; le Roux, G. Centennial Records of Cadmium and Lead in NE China Lake Sediments. Sci. Total Environ. 2019, 657, 548–557. [Google Scholar] [CrossRef] [PubMed]
  55. Appleby, P.G.; Oldfieldz, F. The Assessment of 210Pb Data from Sites with Varying Sediment Accumulation Rates. Hydrobiologia 1983, 103, 29–35. [Google Scholar] [CrossRef]
  56. Appleby, P.G.; Nolan, P.J.; Oldfield, F.; Richardson, N.; Higgitt, S.R. 210Pb Dating of Lake Sediments and Ombrotrophic Peats by Gamma Essay. Sci. Total Environ. 1988, 69, 157–177. [Google Scholar] [CrossRef]
  57. Appleby, P.G.; Oldfield, F. The Calculation of Lead-210 Dates Assuming a Constant Rate of Supply of Unsupported 210Pb to the Sediment. Catena 1978, 5, 1–8. [Google Scholar] [CrossRef]
  58. Mabit, L.; Benmansour, M.; Abril, J.M.; Walling, D.E.; Meusburger, K.; Iurian, A.R.; Bernard, C.; Tarján, S.; Owens, P.N.; Blake, W.H.; et al. Fallout 210Pb as a Soil and Sediment Tracer in Catchment Sediment Budget Investigations: A Review. Earth Sci. Rev. 2014, 138, 335–351. [Google Scholar] [CrossRef]
  59. Sha, Z.; Wang, Q.; Wang, J.; Du, J.; Hu, J.; Ma, Y.; Kong, F.; Wang, Z. Regional Environmental Change and Human Activity over the Past Hundred Years Recorded in the Sedimentary Record of Lake Qinghai, China. Environ. Sci. Pollut. Res. 2017, 24, 9662–9674. [Google Scholar] [CrossRef]
  60. Du, J.; Wang, Z.; Du, J.; Lin, W.; Lu, B.; Qi, Y.; Gao, H.; Wang, Y.; Yao, Z. Radionuclides in Sediment as Tracers for Evolution of Modern Sedimentary Processes in the Bohai Sea. Reg. Stud. Mar. Sci. 2021, 48, 102061. [Google Scholar] [CrossRef]
  61. Luo, M.; Kang, X.; Liu, Q.; Yu, H.; Tao, Y.; Wang, H.; Niu, Y.; Niu, Y. Research on the Geochemical Background Values and Evolution Rules of Lake Sediments for Heavy Metals and Nutrients in the Eastern China Plain from 1937 to 2017. J. Hazard. Mater. 2022, 436, 129136. [Google Scholar] [CrossRef]
  62. Krishnaswamy, S.; Lal, D.; Martin, J.M.; Meybeck, M. Geochronology of lake sediments. Earth Planet. Sci. Lett. 1971, 11, 407–414. [Google Scholar] [CrossRef]
  63. Robbins, J.; Edgington, D.; Kemp, A. Comparative 210Pb, 137Cs, and Pollen Geochronologies of Sediments from Lakes Ontario and Erie. Quat. Res. 1978, 10, 256–278. [Google Scholar] [CrossRef]
  64. Sanchez-Cabeza, J.A.; Ruiz-Fernández, A.C. 210Pb sediment radiochronology: An integrated formulation and classification of dating models. Geochim. Cosmochim. Acta 2012, 82, 183–200. [Google Scholar] [CrossRef]
  65. Ramsar The List of Wetlands of International Importance. p. 55. Available online: https://www.Ramsar.Org/Sites/Default/Files/Documents/Library/Sitelist.Pdf. (accessed on 2 February 2020).
  66. Lessmann, J.; Fajardo, J.; Muñoz, J.; Bonaccorso, E. Large Expansion of Oil Industry in the Ecuadorian Amazon: Biodiversity Vulnerability and Conservation Alternatives. Ecol. Evol. 2016, 6, 4997–5012. [Google Scholar] [CrossRef] [Green Version]
  67. Valdiviezo-Rivera, J.; Carrillo-Moreno, C.; Gea-Izquierdo, E. Annotated List of Freshwater Fishes of the Limoncocha Lagoon, Napo River Basin, Northern Amazon Region of Ecuador. Check List 2018, 14, 55–75. [Google Scholar] [CrossRef] [Green Version]
  68. Anderson, E.P.; Osborne, T.; Maldonado-Ocampo, J.A.; Mills-Novoa, M.; Castello, L.; Montoya, M.; Encalada, A.C.; Jenkins, C.N. Energy Development Reveals Blind Spots for Ecosystem Conservation in the Amazon Basin. Front. Ecol. Environ. 2019, 17, 521–529. [Google Scholar] [CrossRef] [Green Version]
  69. Carrillo, K.C.; Drouet, J.C.; Rodríguez-Romero, A.; Tovar-Sánchez, A.; Ruiz-Gutiérrez, G.; Viguri Fuente, J.R. Spatial Distribution and Level of Contamination of Potentially Toxic Elements in Sediments and Soils of a Biological Reserve Wetland, Northern Amazon Region of Ecuador. J. Environ. Manag. 2021, 289, 112495. [Google Scholar] [CrossRef]
  70. Carrillo, K.C.; Rodríguez-Romero, A.; Tovar-Sánchez, A.; Ruiz-Gutiérrez, G.; Fuente, J.R.V. Geochemical Baseline Establishment, Contamination Level and Ecological Risk Assessment of Metals and As in the Limoncocha Lagoon Sediments, Ecuadorian Amazon Region. J. Soils Sediments 2022, 22, 293–315. [Google Scholar] [CrossRef]
  71. Neira, F.; Gómez, S.; Pérez, G. Sostenibilidad de los usos de subsistencia de la biodiversidad en un Área Protegida de la Amazonia Ecuatoriana: Un análisis biofísico. Ecuad. Debate 2006, 67, 155–164. [Google Scholar]
  72. Neira, F.; Younes, N. Evaluación multicriterial de los usos de subsistencia de la biodiversidad por parte de una comunidad kichwa en la Reserva Biológica Limoncocha. In Amenazas y Retos en la Gestión de la Reserva de Biosfera Yasuní, 1st ed.; Krainer, A., Mora, M.F., Eds.; FLACSO-Sede Ecuador: Quito, Ecuador, 2011; pp. 137–152. ISBN 978-9978-67-304-1. [Google Scholar]
  73. Neira, F.; Suza, M.; Robles, K. Usos sostenibles de la biodiversidad en un área protegida de laAmazonía ecuatoriana (2006-2011) (Sustainable uses of biodiversity in a protected area of Ecuadorian Amazonia (2006–2011)). Let. Verdes. Rev. Latinoam. De Estud. Socioambientales 2013, 14, 338–357. [Google Scholar]
  74. GAD, Gobierno Autonomo Descrentralizado Limoncocha (Autonomous Government Decrentralized Limoncocha). Actualización del plan de desarrollo y ordenamiento territorial de la parroquia Limoncocha (Updating of the development plan and territorial ordering of the Limoncocha parish). Available online: https://gadlimoncocha.gob.ec (accessed on 4 June 2022).
  75. ISO 17892-3:2015; Geotechnical Investigation and Testing—Laboratory Testing of Soil—Part 3: Determination of Particle Density. ISO: Geneva, Switzerland.
  76. Gelen, A.; Soto, J.; Gómez, J.; Díaz, O. Sediment dating of Santander Bay, Spain. J. Radioanal. Nucl. Chem. 2004, 261, 437–441. [Google Scholar] [CrossRef]
  77. Maanan, M.; Saddik, M.; Maanan, M.; Chaibi, M.; Assobhei, O.; Zourarah, B. Environmental and ecological risk assessment of heavy metals in sediments of Nador lagoon, Morocco. Ecol. Indic. 2015, 48, 616–626. [Google Scholar] [CrossRef]
  78. Kowalska, J.B.; Mazurek, R.; Gąsiorek, M.; Zaleski, T. Pollution indices as useful tools for the comprehensive evaluation of the degree of soil contamination—A review. Environ. Geochem. Health 2018, 40, 2395–2420. [Google Scholar] [CrossRef] [PubMed] [Green Version]
  79. Håkanson, L. An ecological risk index for aquatic pollution control. A sedimentological approach. Water Res. 1980, 14, 975–1001. [Google Scholar] [CrossRef]
  80. Müller, G. Index of geo-accumulation in sediments of the Rhine River. GeoJournal 1969, 2, 108–118. [Google Scholar]
  81. Chen, C.W.; Kao, C.M.; Chen, C.F.; Di, D.C. Distribution and accumulation of heavy metals in the sediments of Kaohsiung Harbor, Taiwan. Chemosphere 2007, 66, 1431–1440. [Google Scholar] [CrossRef]
  82. Birch, G.F.; Olmos, M.A. Sediment-bound heavy metals as indicators of human influence and biological risk in coastal water bodies. ICES J. Mar. Sci. 2008, 65, 1407–1413. [Google Scholar] [CrossRef]
  83. Birch, G.F.; Gunns, T.J.; Olmos, M. Sediment-bound metals as indicators of anthropogenic change in estuarine environments. Mar. Pollut. Bull. 2015, 101, 243–257. [Google Scholar] [CrossRef]
  84. Gao, L.; Wang, Z.; Li, S.; Chen, J. Bioavailability and toxicity of trace metals (Cd, Cr, Cu, Ni, and Zn) in sediment cores from the Shima River, South China. Chemosphere 2018, 192, 31–42. [Google Scholar] [CrossRef]
  85. Zhang, G.; Bai, J.; Zhao, Q. Heavy metals in wetland soils along a wetland forming chronosequence in the Yellow River Delta of China: Levels, sources and toxic risks. Ecol. Indic 2016, 69, 331–339. [Google Scholar] [CrossRef] [Green Version]
  86. Jarrín, A.E.; Salazar, J.G.; Martínez-Fresneda, M. Pollution risk evaluation of the aquifers of the Limoncocha Biological Reserve, Ecuadorian Amazon. Rev. Ambient. Agua 2017, 12, 652–665. (In Spanish) [Google Scholar] [CrossRef] [Green Version]
  87. Wittmann, H.; von Blanckenburg, F.; Guyot, J.L.; Laraque, A.; Bernal, C.; Kubik, P.W. Sediment production and transport from in situ-produced cosmogenic 10Be and river loads in the Napo River basin, an upper Amazon tributary of Ecuador and Peru. J. South Am. Earth Sci. 2011, 31, 45–53. [Google Scholar] [CrossRef]
  88. Agah, H.; Hashtroudi, M.S.; Baeyens, W. Trace metals and major elements in sediments of the northern Persian gulf. J. Persian Gulf 2012, 3, 45–58. [Google Scholar]
  89. Yang, J.; Wang, W.; Zhao, M. Spatial distribution and historical trends of heavy metals in the sediments of petroleum producing regions of the Beibu Gulf, China. Mar. Pollut. Bull. 2015, 91, 87–95. [Google Scholar] [CrossRef]
  90. Sadeghi, P.; Loghmani, M.; Afsa, E. Trace element concentrations, ecological and health risk assessment in sediment and marine fish Otolithes ruber in Oman Sea. Iran Mar Pollut Bull 2019, 140, 248–254. [Google Scholar] [CrossRef]
  91. Ogunlaja, A.; Ogunlaja, O.O.; Okewole, D.M.; Morenikeji, O.A. Risk assessment and source identification of heavy metal contamination by multivariate and hazard index analyses of a pipeline vandalised area in Lagos State, Nigeria. Sci. Total Environ. 2019, 651, 2943–2952. [Google Scholar] [CrossRef]
  92. Ghanavati, N.; Nazarpour, A.; De Vivo, B. Ecological and human health risk assessment of toxic metals in street dusts and surface soils in Ahvaz, Iran. Environ. Geochem. Health 2019, 41, 875–891. [Google Scholar] [CrossRef]
  93. Bissen, M.; Frimmel, F.H. Arsenic—A Review. Part I: Occurrence, Toxicity, Speciation, Mobility. Acta Hydroch. Hydrob. 2003, 31, 9–18. [Google Scholar] [CrossRef]
  94. Chavez, E.; He, Z.L.; Stoffella, P.J.; Mylavarapu, R.; Li, Y.; Baligar, V.C. Evaluation of soil amendments as a remediation alternative for cadmium-contaminated soils under cacao plantations. Environ. Sci. Pollut. Res. 2016, 23, 17571–17580. [Google Scholar] [CrossRef]
  95. Hu, Y.; Wang, D.; Li, Y. Environmental behaviors and potential ecological risks of heavy metals (Cd, Cr, Cu, Pb, and Zn) in multimedia in an oilfield in China. Environ. Sci. Pollut. Res. 2016, 23, 13964–13972. [Google Scholar] [CrossRef]
  96. Marrugo-Negrete, J.; Pinedo-Hernández, J.; Díez, S. Assessment of heavy metal pollution, spatial distribution and origin in agricultural soils along the Sinú River Basin, Colombia. Environ. Res. 2017, 154, 380–388. [Google Scholar] [CrossRef] [PubMed]
  97. Dai, L.; Wang, L.; Liang, T.; Zhang, Y.; Li, J.; Xiao, J.; Dong, L.; Zhang, H. Geostatistical analyses and co-occurrence correlations of heavy metals distribution with various types of land use within a watershed in eastern QingHai-Tibet Plateau, China. Sci. Total Environ. 2019, 653, 849–859. [Google Scholar] [CrossRef] [PubMed]
  98. Mestanza, C.; Ubidia, M.; Figueroa, H.; Logroño, S.; Pozo, E.; Vizuete, M. Limoncocha Biological Reserve lagoon: Meanings from an anthropic perspective. Int. J. Eng. Sci. Res. Technol. 2019, 6, 137–142. [Google Scholar] [CrossRef]
  99. United Nations Scientific Committee on the Effects of Atomic Radiation (UNSCEAR). Report to the General Assembly: Sources and Effects of Ionizing Radiation—Exposures from Natural Radiation Sources, Annex B; United Nations: New York, NY, USA, 2000.
  100. United Nations Scientific Committee on the Effects of Atomic Radiation (UNSCEAR). Report to General Assembly, with Scientific Annexes. Exposure of the Public and Workers from Various Sources of Radiation; United Nations: New York, NY, USA, 2008.
  101. Bowen, H.J.M. Environmental Chemistry of the Elements; Academic Press: London, UK, 1979. [Google Scholar]
  102. Rudnik, R.L.; Gao, S. Composition of the continental crust. In Treatise on Geochemistry, 2nd ed.; Holland, H.D., Turekian, K.K., Eds.; Elsevier: Amsterdam, The Netherlands, 2014; Volume 4. [Google Scholar]
  103. Koide, M.; Bruland, K.W.; Goldberg, E.D. Th-228/Th-232 and Pb-210 geochronologies in marine and lake sediments. Geochim. Cosmochim. Ac 1973, 37, 1171–1187. [Google Scholar] [CrossRef]
  104. Robbins, J.A.; Edgington, D. Determination of Recent Sedimentation Rates in Lake Michigan Using Pb-210 and Cs-137. Geochim. Cosmochim. Ac 1975, 39, 285–304. [Google Scholar] [CrossRef] [Green Version]
  105. Eakins, J.A.; Morrison, R.T. A new procedure for the determination of lead-210 in lake and marine sediments. The International J. Appl. Radiat. Isot. 1978, 29, 531–536. [Google Scholar] [CrossRef]
  106. Baskaran, M.; Naidu, A.S. 210Pb-derived chronology and the fluxes of 210Pb and 137Cs isotopes into continental shelf sediments, East Chukchi Sea, Alaskan Arctic. Geochim. Cosmochim. Acta 1995, 59, 4435–4448. [Google Scholar] [CrossRef]
  107. Turner, L.J.; Delorme, L.D. Assessment of 210Pb data from Canadian lakes using the CIC and CRS models. Environ. Geol. 1996, 28, 78–87. [Google Scholar] [CrossRef]
  108. Santschi, P.H.; Presley, B.J.; Wade, T.L.; Garcia-Romero, B.; Baskaran, M. Historical contamination of PAHs, PCBs, DDTs, and heavy metals in Mississippi River Delta, Galveston Bay and Tampa Bay sediment cores. Mar. Environ. Res. 2001, 52, 51–79. [Google Scholar] [CrossRef]
  109. San Miguel, E.G.; Bolívar, J.P.; Garcia-Tenorio, R. Vertical distribution of Th-isotope ratios, 210Pb, 226Ra and 137Cs in sediment cores from an estuary affected by anthropogenic releases. Sci. Total Environ. 2004, 318, 143–157. [Google Scholar] [CrossRef]
  110. Harb, S. Natural radioactivity and external gamma radiation exposure at the coastal Red Sea in Egypt. Radiat. Prot. Dosim. 2008, 130, 376–384. [Google Scholar] [CrossRef] [PubMed]
  111. Matamet, F.R.M.; Bonotto, D.M. Identifying sedimentation processes in the Coata River, Altiplano of the Puno department, Peru, by the 210Pb method. Environ. Earth Sci. 2019, 78, 641. [Google Scholar] [CrossRef]
  112. Cigagna, C.; Bonotto, D.M.; Camargo, A.F.M. Sedimentation rates by the 210Pb chronological method in Itanhaém river watershed, southeast Brazil. Environ. Monit. Assess. 2021, 193, 819. [Google Scholar] [CrossRef] [PubMed]
  113. Pesantes, A.A.; Carpio, E.P.; Vitvar, T.; Lopez, M.M.M.; Menendez-Aguado, J.M.M. A multi-index analysis approach to heavy metal pollution assessment in river sediments in the Ponce Enriquez area, Ecuador. Water 2019, 11, 590. [Google Scholar] [CrossRef] [Green Version]
  114. Garreaud, R.D.; Vuille, M.; Compagnucci, R.; Marengo, J. Present-day South American climate. Palaeogeogr. Palaeocl. 2009, 281, 180–195. [Google Scholar] [CrossRef]
Figure 1. Limoncocha lagoon with the location of the core sediment (C1) and surface sediments (SE).
Environments 10 00002 g001
Figure 2. Vertical distribution of (a) 40K; (b) 232Th and (c) Density (g cm−3) in the sediment core of the Limoncocha lagoon.
Environments 10 00002 g002
Figure 3. Vertical distribution of minor and major elements concentration in the Limoncocha lagoon core.
Environments 10 00002 g003
Figure 4. Profile of major, minor elements and 210Pbexcess from a sediment core in Limoncocha lagoon and comparison to the superficial sediment concentrations (ο).
Environments 10 00002 g004
Figure 5. Profile of single contamination indices and their classification. Cf: Environments 10 00002 i001 Cf < 1 low pollution, Environments 10 00002 i002 1 < Cf < 3 moderate contamination; Igeo: Environments 10 00002 i001 Igeo < 0 uncontaminated, Environments 10 00002 i002 0 < Igeo < 1 uncontaminated-moderately contaminated; Ef: Environments 10 00002 i001 Ef < 1 no enrichment, Environments 10 00002 i002 1 < Ef < 3 minor enrichment. Pollutants: Environments 10 00002 i003 As, Environments 10 00002 i004 Ba, Environments 10 00002 i005 Cd, Environments 10 00002 i006 Co, Environments 10 00002 i007 Cr, Environments 10 00002 i008 Cu, Environments 10 00002 i009 Mo, Environments 10 00002 i010 Ni, Environments 10 00002 i011 Pb, Environments 10 00002 i012 V, Environments 10 00002 i013 Zn. At each depth, the bar graph is shown with the values of each element. The same color code has been used to represent the studied elements.
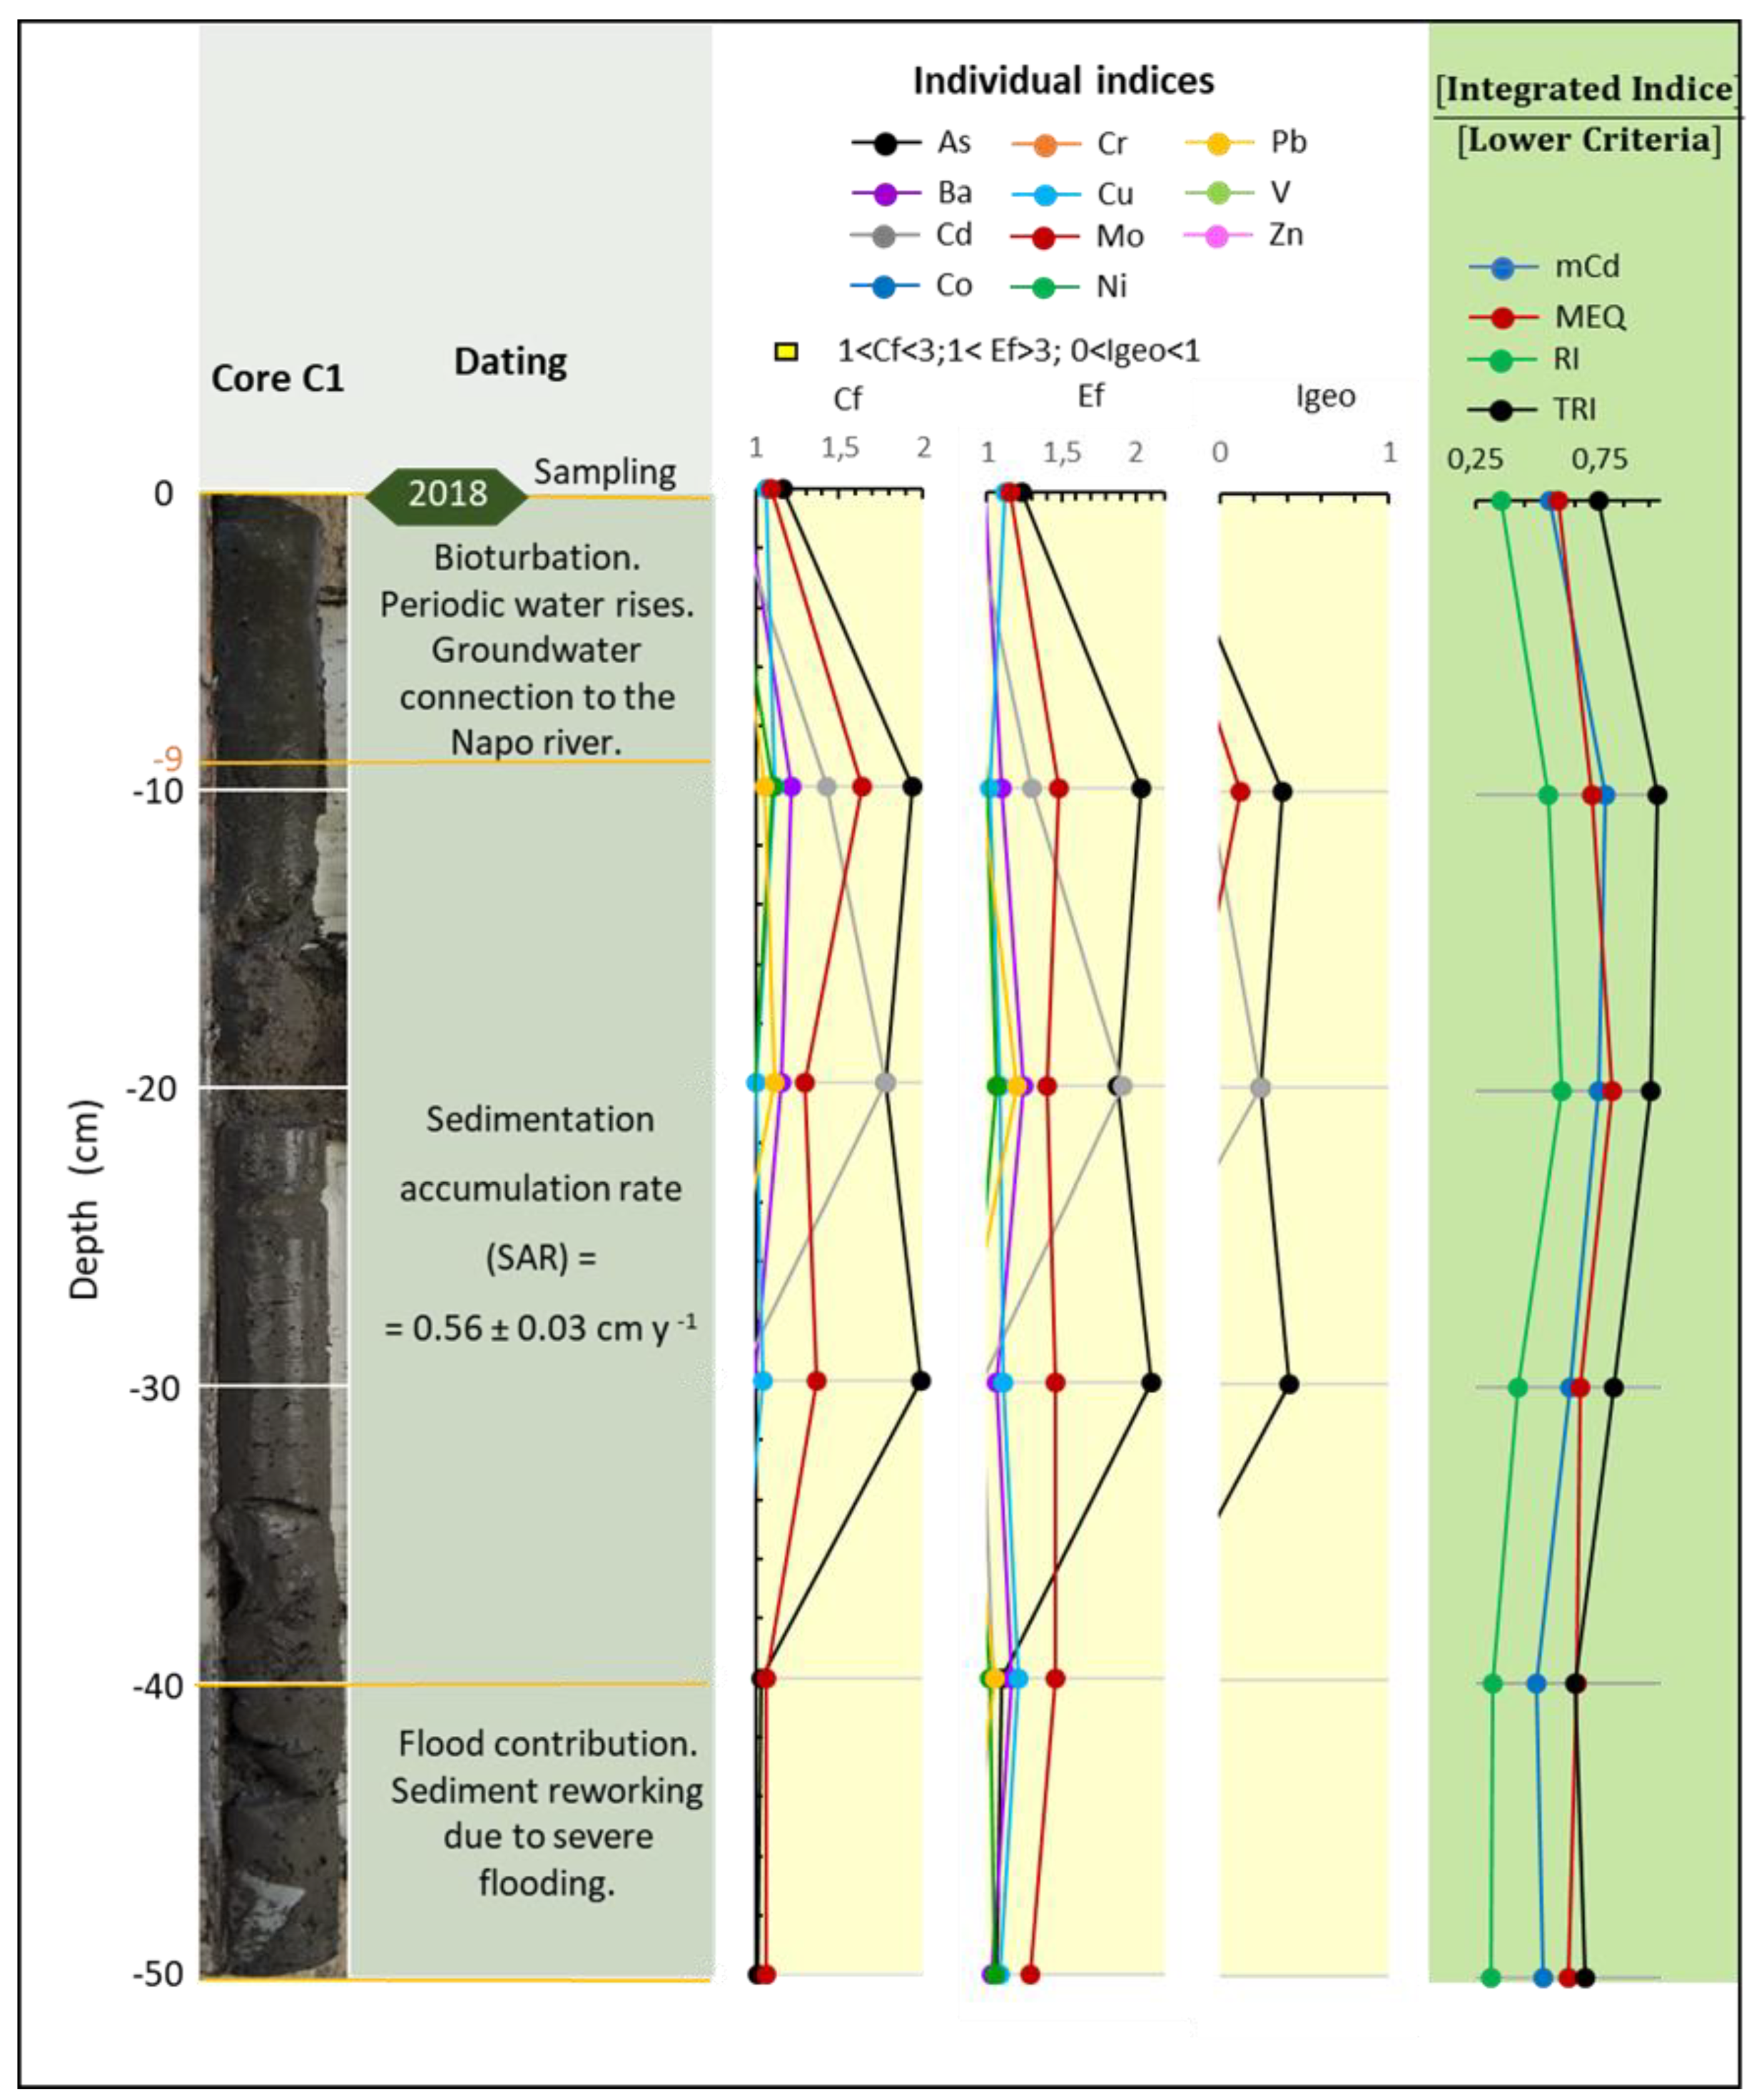
Environments 10 00002 g005
Figure 6. Profile and values of the integrated pollution indices mCdj, MEQj, RIj, and TRIj.
Environments 10 00002 g006
Figure 7. Depth profile of 210Pbtotal, 226Ra and 210Pbexcess in the core sediment of the Limoncocha lagoon.
Environments 10 00002 g007
Figure 8. (a) 210Pbexcess profile in the entire core, (b) 210Pbexcess plotted against the core depth in the Section 9–39 cm and, (c) experimental data fitting to the CF-CS model to obtain the sedimentation rate in the intermediate section of the core.
Environments 10 00002 g008
Figure 9. (a) Mass accumulation profile in the entire core, (b) ln 210Pbexcess plotted against the mass accumulation in the Section 9–39 cm, and (c) calculated SAR in each core section.
Environments 10 00002 g009
Figure 10. Dating together with plausible events that occurred in the sections under study and the values of the individual and integrated pollution indices compared with the lower indicative limits of contamination in each case.
Environments 10 00002 g010
Table 1. Sediment contamination assessment index. Definition and classification criteria considered in this study.
IndexesEquationsCriteriaClassification
Contamination factor, Cf i , j
[79]
Cf i ,   j = C i , j Cb i  
C i , j   is   the   concentration   of   element   i   in   sample   j   and   Cb i contaminant baseline concentration i
Cf i , j < 1Low contamination
1 < Cf i ,   j < 3Moderate contamination
3 < Cf i ,   j < 6Considerable contamination
6 < Cf i ,   j < 12Very high contamination
Cf i ,   j > 12Extreme contamination
Geoaccumul-ation index, Igeo i , j
[80]
Igeo i , j = log 2 C i , j 1.5   Cb i
C i , j   concentration   of   element   i   in   sample   j ,   Cb i contaminant baseline concentration i and 1.5 is the correction factor of the bottom matrix due to lithogenic effects
Igeo i , j 0 Class 0, uncontaminated
0 < Igeo i , j < 1 Class 1, uncontaminated to moderately contaminated
1 > Igeo i , j > 2 Class 2, moderately polluted
2 < Igeo i , j < 3 Class 3, moderately polluting to heavily polluted
3 > Igeo i , j > 4 Class 4, heavily polluted
4 < Igeo i , j < 5 Class 5, heavily polluted to extremely polluted
Igeo i , j > 5 Class 6, extremely polluted
Enrichment factor, EF i ,   j
[81]
EF i ,   j = C i , j C R , j Cb i Cb R  
C i , j   concentration   of   element   i   in   sample   j ,   C R , j concentration of the reference element (R) in sample j, Cb i   baseline   concentration   i ,   Cb R baseline concentration of reference element
EF i ,   j < 1 not enriched
1 < EF i ,   j <3slightly enriched
3 < EF i ,   j <5moderately enriched
5 < EF i ,   j < 10 Moderately to severely enriched
10 < EF i ,   j < 25 severely enriched
25 < EF i ,   j < 50 very severely spiked
EF i ,   j < 50 extremely enriched
Modified
pollution degree, mCd j
[34]
mCd j = i = 1 n Cf i , j n
Cf i , j is the contamination factor i at site j and n is the number of contaminants studied
mCd j < 1.5 Without pollution
1.5 mCd j < 2 Low pollution
2 mCd j < 4 Moderate pollution
4 mCd j < 8 High pollution
8 mCd j < 16 Very high pollution
16 mCd j < 32 Extremely high pollution
mCd j 32 Ultra-high pollution
Average
enrichment
ratio, MEQ j
[82,83]
MEQ j = i = 1 n EF i ,   j n
EF i ,   j is the enrichment factor of element i at site j and n the number of contaminants.
MEQ j < 1.5 Category 1 (No enrichment)
1.5 < MEQ j < 3 Category 2 (Minor Enrichment)
3 < MEQ j < 5 Category 3 (Moderate Enrichment)
5 < MEQ j < 10 Category 4 (Extensive Enrichment)
MEQ j > 10 Category 5 (Severe Enrichment)
Potential
ecological risk index, RI j
[79]
RI j = i = 1 n Er i , j
Er i , j = Tr i · Cf i , j
Er i , j is the ecological risk factor of element i at site j, n number of elements and Tr i the toxic response factor for element i. Tri has a value of 30 for Cd, 10 for As, 5 for Cu, Ni, and Pb, 2 for Cr and 1 for Zn.
RI j <150
Er i , j <40
Low potential risk
150< RI j <300
40< Er i , j <80
Moderate potential risk
300< RI j <600
80< Er i , j <160
Considerable potential risk
RI j >600
160< Er i , j <320
High potential risk
Er i , j >320Very high potential risk
Toxic risk index ( TRI j ).
[84,85]
TRI j = i = 1 n TRI i , j =
= 1 = 1 n ( C i , j TEL i ) 2 + ( C i , j PEL i ) 2 2
C i , j is the concentration of elements i at site j, PEL i is the likely effect level of item i, TEL i is the threshold effect level of element i and   TRI i , j is the toxic risk index of element i at site j.
TRI j < 5 No toxic risk
5 TRI j < 10 Low toxic risk
10 TRI j < 15 Moderate toxic risk
15 TRI j < 20 Considerable toxic risk
TRI j 20 Very high toxic risk
Table 2. Minimum concentrations of minor and major analyzed elements in the sediment core of the center of the lagoon in comparison to surface sediment concentrations.
ElementMinimum Concentration (mg kg−1)Sampling Point of Surface
Sediment
Core in the Centre of the LagoonSurface Sediment Samples [69,70]
As3.121.92S3-Mouth of the Playayacu river
Ba263188S5-Caño
Cd0.2530.118S5-Caño
Co11.310.7S5-Caño
Cr15.511.4S5-Caño
Cu70.850.6S3-Mouth of the Playayacu river
Mo2.51.65S3-Mouth of the Playayacu river
Ni16.013.2S5-Caño
Pb8.74.62S3-Mouth of the Playayacu river
V71.261.8S5-Caño
Zn51.648.4S5-Caño
Al7188789600S4-Mouth of the Pishira river
Fe2899034800S5-Caño
Mn532643S7-Pishira River
P1221961S6-Playayacu River
Table 3. Activity concentration in Bq kg−1 in sediment core slices with uncertainties given as 1σ and global average and ranges of natural background radiation concentration in soils.
Depth
cm
210PbTotal226Ra210Pbexcess40K232Th
Bq kg−1
149.8 ± 10.425.1 ± 4.124.7 ± 10.4293.9 ± 23.820.9 ± 1.8
561.9 ± 13.531.3 ± 3.630.5 ± 13.5445.1 ± 35.926.0 ± 2.2
969.3 ± 9.932.7 ± 3.636.5 ± 9.9525.0 ± 42.530.2 ± 2.7
1369.0 ± 15.135.4 ± 4.433.6 ± 15.1442.4 ± 35.729.4 ± 2.5
1759.8 ±12.632.3 ± 3.827.6 ± 12.6402.7 ± 32.425.7 ± 2.2
2155.8 ± 12.934.6 ± 4.021.2 ± 12.9426.8 ± 34.425.0 ± 2.2
2545.6 ± 9.833.3 ± 3.912.3 ± 9.8395.7 ± 31.922.9 ± 2.0
3344.5 ± 9.630.8 ± 3.613.7 ± 9.6408.8 ± 32.920.9 ± 1.8
3742.7 ± 9.633.8 ± 3.88.9 ± 9.6403.8 ± 32.525.1 ± 2.1
3941.0 ± 10.134.8 ± 3.96.3 ± 9.6398.6 ± 32.122.1 ± 1.9
4147.3 ± 10.336.9 ± 4.010.4 ± 9.399.9 ± 32.225.0 ± 2.1
4241.9 ± 10.932.6 ± 3.79.4 ± 10.3407.7 ± 32.821.5 ± 1.9
44--- 32.0 ± 3.6---386.9 ± 31.220.2 ± 1.8
4638.4 ± 8.626.8 ± 3.311.6 ± 8.6397.3 ± 32.019.7 ± 1.7
5042.0 ± 9.432.5 ± 3.49.6 ± 9.4379.1 ± 30.522.9 ± 2.0
Range this work38.4–6925–37---294–52520–30
Average this work47.832.3---407.623.8
World average [99,100]---32 (17–60)---420 (140–850)45 (11–64)
World soil [101]---30 (7–180)---440 (0.2–1200)37 (4–78)
UCC [102]---33---72043
Disclaimer/Publisher’s Note: The statements, opinions and data contained in all publications are solely those of the individual author(s) and contributor(s) and not of MDPI and/or the editor(s). MDPI and/or the editor(s) disclaim responsibility for any injury to people or property resulting from any ideas, methods, instructions or products referred to in the content.

