
Trajectories of Cognitive Change and Their Association with All-Cause Mortality Among Chinese Older Adults: Results from the Chinese Longitudinal Healthy Longevity Survey

 ,
,  , ,
, ,  , , and
Abstract
1. Introduction
2. Materials and Methods
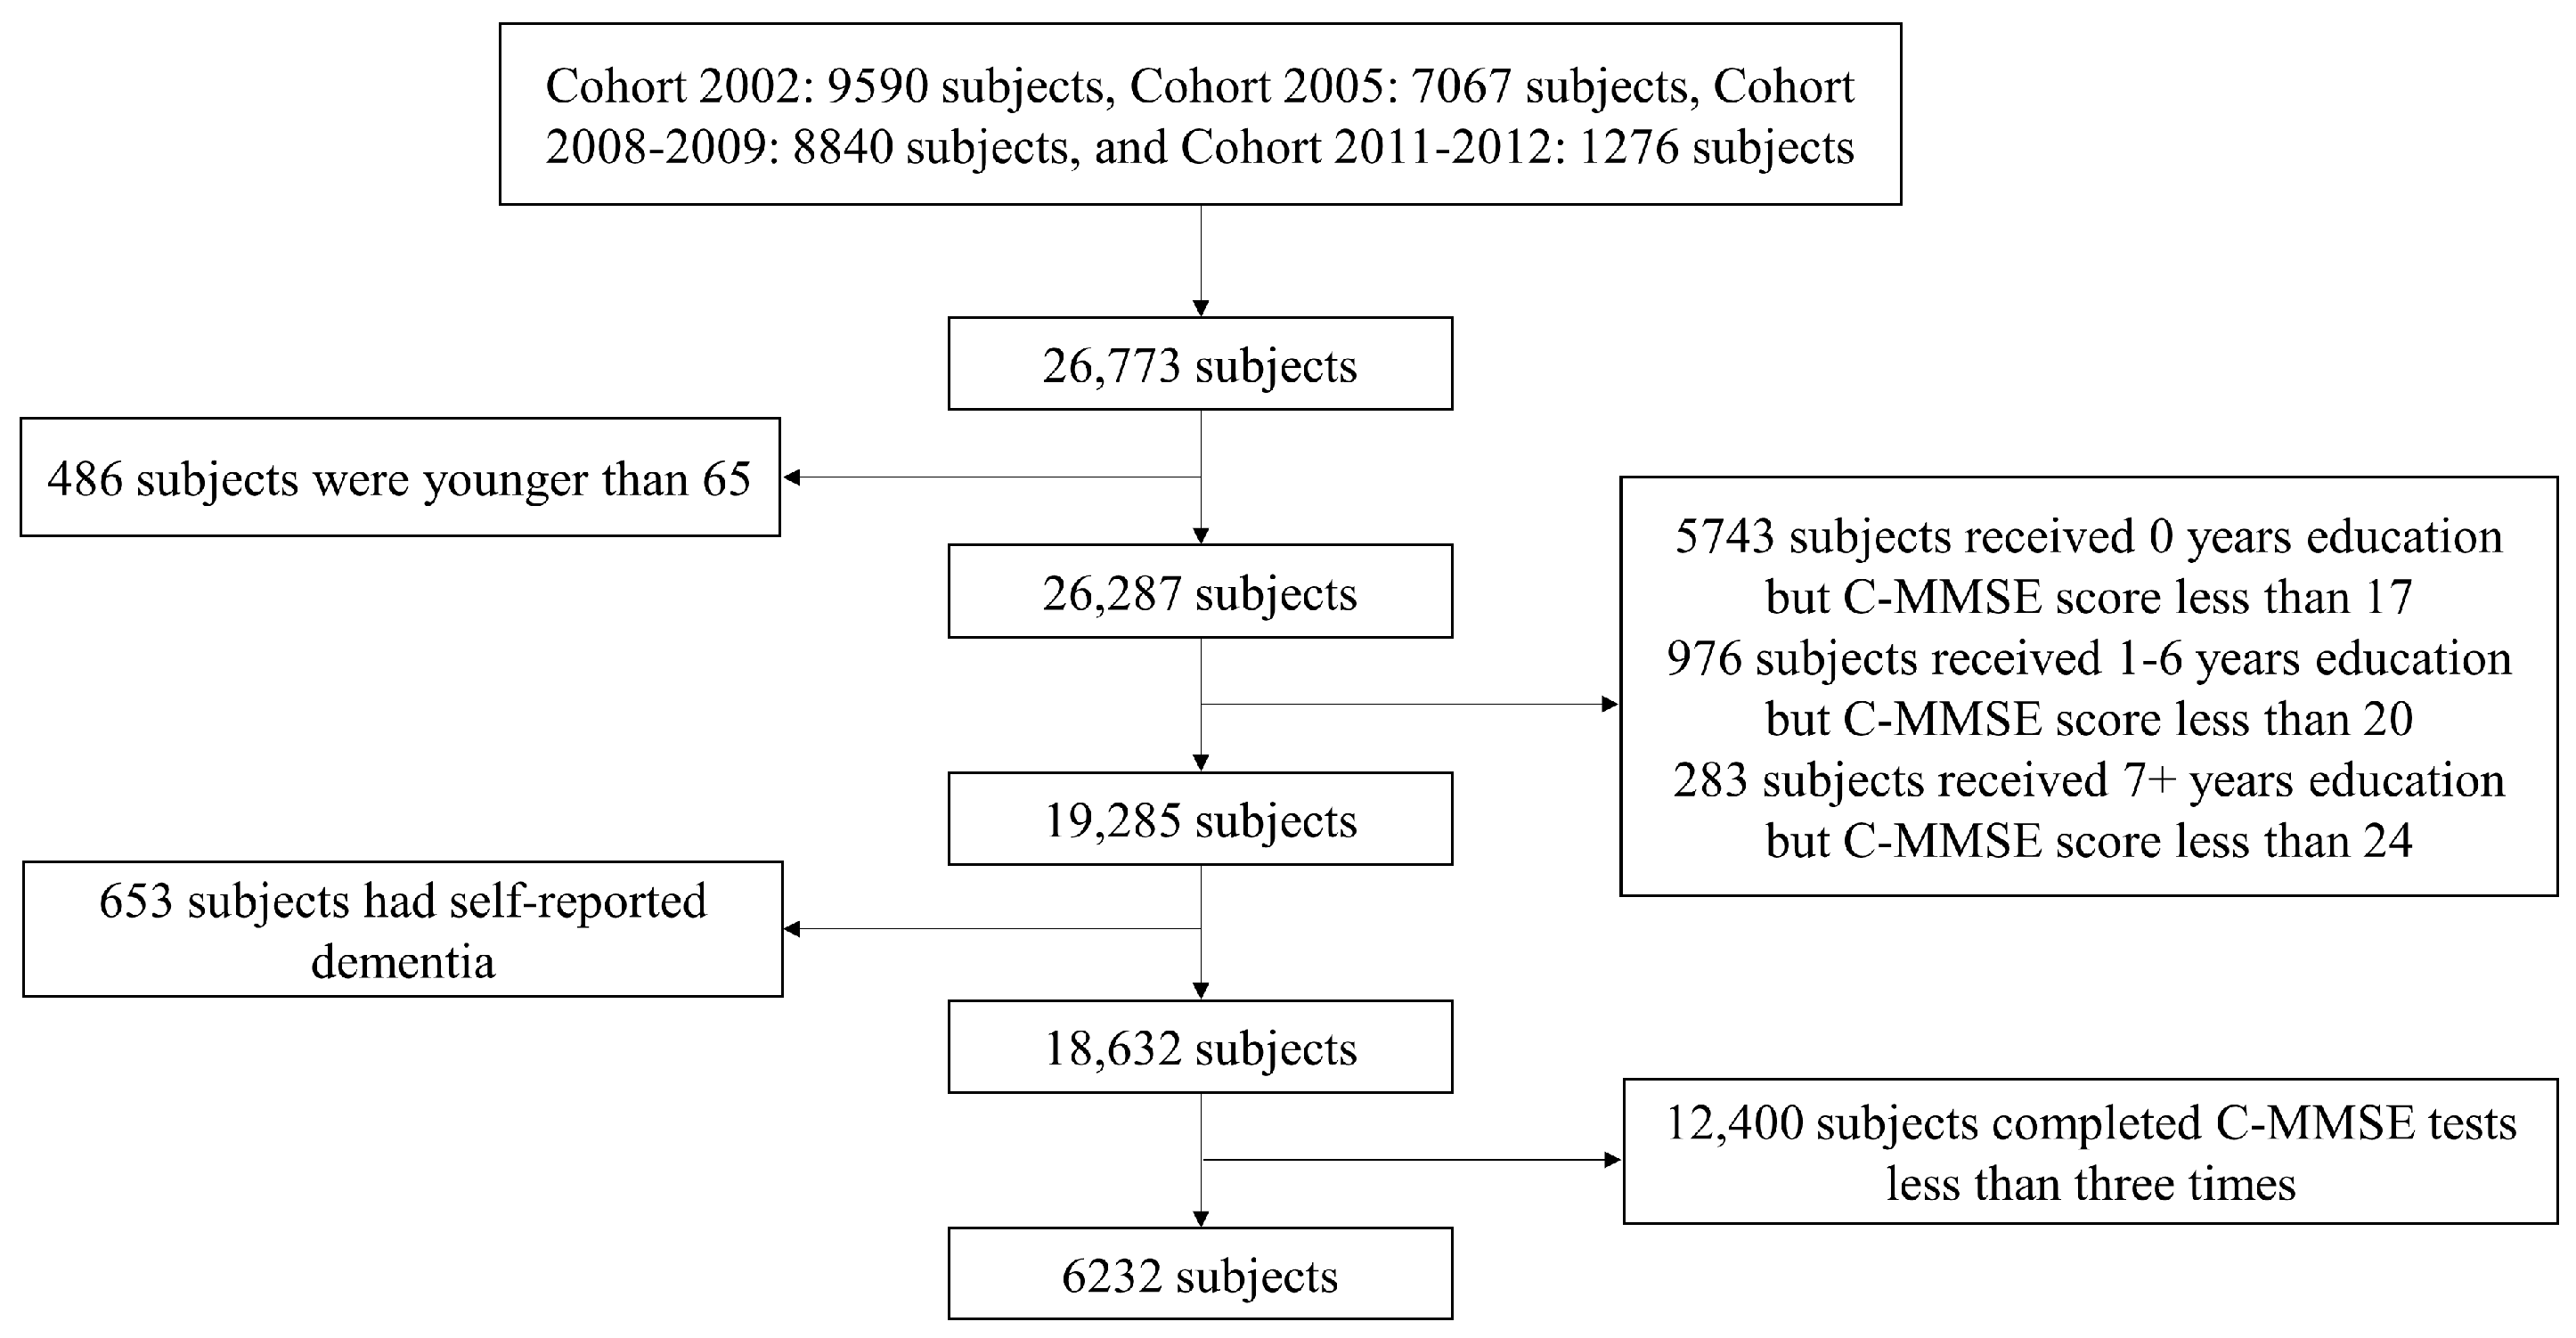
2.1. Study Design and Subjects
2.2. Cognitive Assessment
2.3. Assessment of All-Cause Mortality
2.4. Covariates
2.5. Statistical Analysis
3. Results
3.1. Characteristics of Study Sample
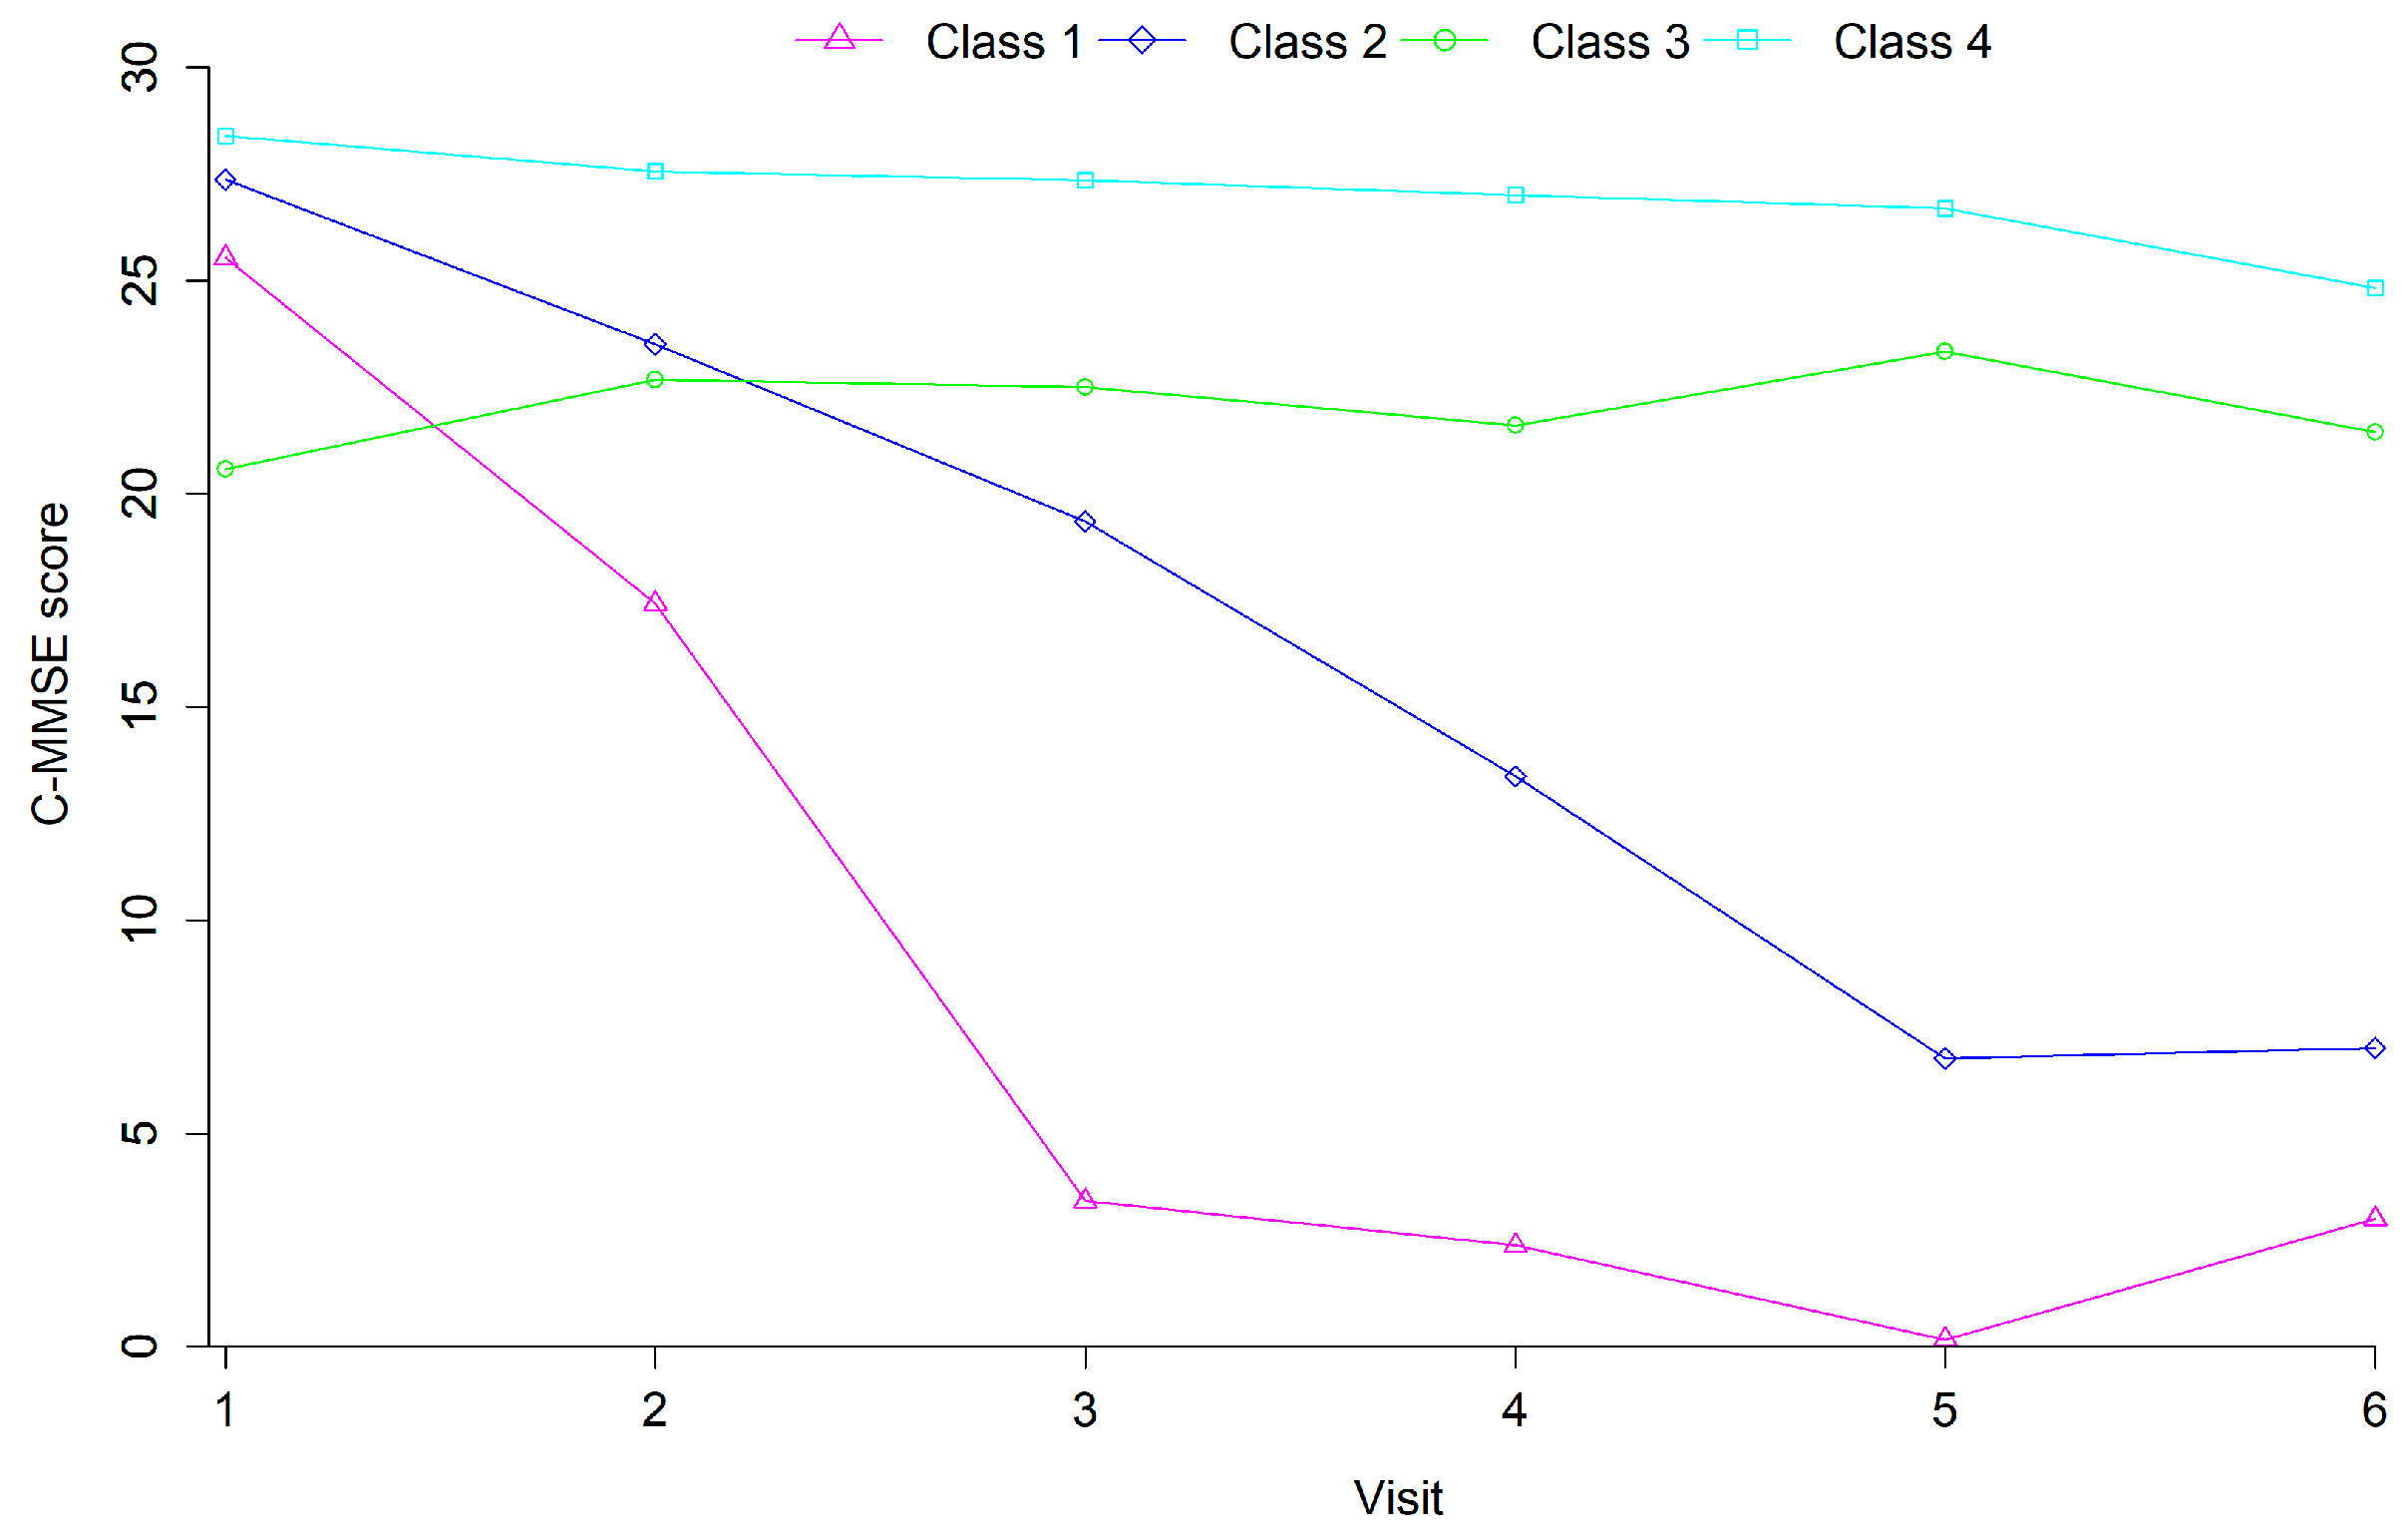
3.2. Cognitive Trajectories
3.3. Impact of Covariates on Cognitive Trajectory Classes
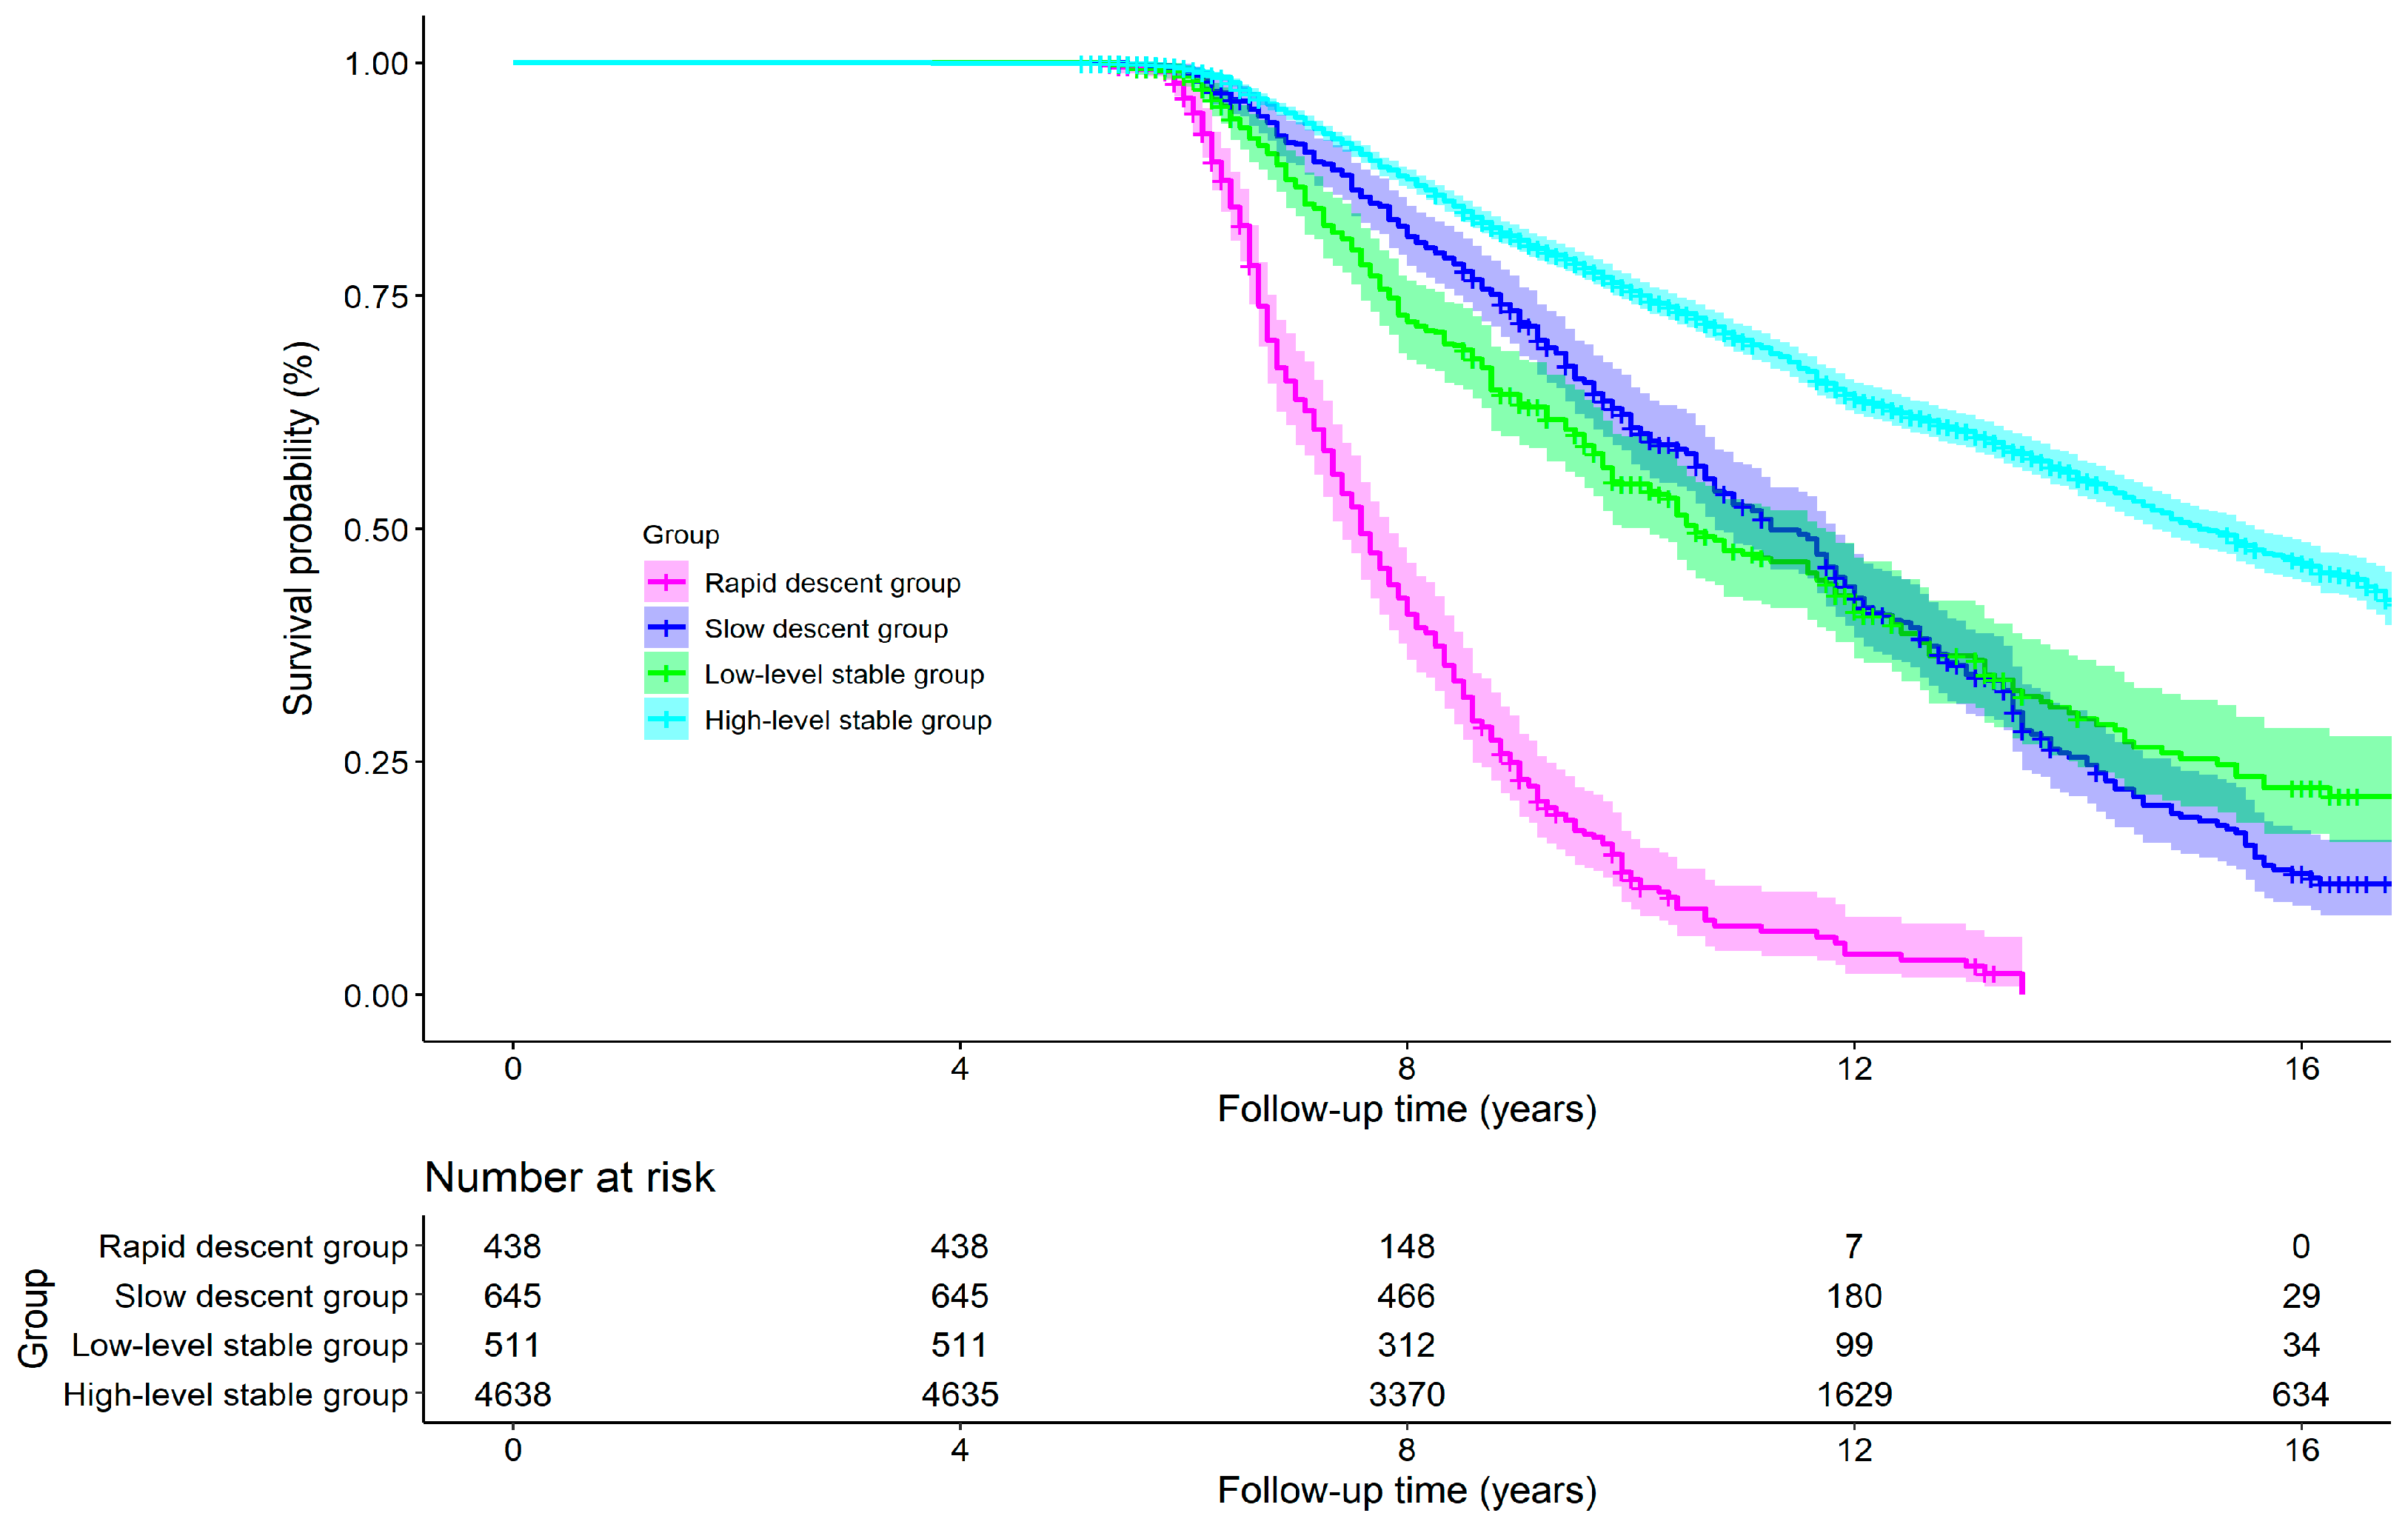
3.4. Effects of Cognitive Trajectory on All-Cause Mortality
4. Discussion
5. Conclusions
Supplementary Materials
Author Contributions
Funding
Institutional Review Board Statement
Informed Consent Statement
Data Availability Statement
Acknowledgments
Conflicts of Interest
References
- Ablett, A. D., McCarthy, K., Carter, B., Pearce, L., Stechman, M., Moug, S., Hewitt, J., & Myint, P. K. (2019). Cognitive impairment is associated with mortality in older adults in the emergency surgical setting: Findings from the Older Persons Surgical Outcomes Collaboration (OPSOC): A prospective cohort study. Surgery, 165(5), 978–984. [Google Scholar] [CrossRef] [PubMed]
- Akimov, A. V., Gemueva, K. A., & Semenova, N. K. (2021). The seventh population census in the PRC: Results and prospects of the country’s demographic development. Herald of the Russian Academy of Sciences, 91(6), 724–735. [Google Scholar] [CrossRef] [PubMed]
- An, R., & Liu, G. G. (2016). Cognitive impairment and mortality among the oldest-old Chinese. International Journal of Geriatric Psychiatry, 31(12), 1345–1353. [Google Scholar] [CrossRef] [PubMed]
- Arevalo-Rodriguez, I., Smailagic, N., Roque-Figuls, M., Ciapponi, A., Sanchez-Perez, E., Giannakou, A., Pedraza, O. L., Bonfill, C. X., & Cullum, S. (2021). Mini-Mental State Examination (MMSE) for the early detection of dementia in people with mild cognitive impairment (MCI). Cochrane Database of Systematic Reviews, 7(7), CD10783. [Google Scholar] [CrossRef]
- Arvanitakis, Z., Capuano, A. W., Leurgans, S. E., Bennett, D. A., & Schneider, J. A. (2016). Relation of cerebral vessel disease to Alzheimer’s disease dementia and cognitive function in elderly people: A cross-sectional study. Lancet Neurology, 15(9), 934–943. [Google Scholar] [CrossRef]
- Batterham, P. J., Mackinnon, A. J., & Christensen, H. (2012). The association between change in cognitive ability and cause-specific mortality in a community sample of older adults. Psychology and Aging, 27(1), 229–236. [Google Scholar] [CrossRef]
- Batty, G. D., Deary, I. J., & Zaninotto, P. (2016). Association of cognitive function with cause-specific mortality in middle and older age: Follow-up of participants in the English Longitudinal Study of Ageing. American Journal of Epidemiology, 183(3), 183–190. [Google Scholar] [CrossRef]
- Beller, J., Kuhlmann, B. G., Sperlich, S., & Geyer, S. (2022). Secular improvements in cognitive aging: Contribution of education, health, and routine activities. Journal of Aging and Health, 34(6–8), 807–817. [Google Scholar] [CrossRef]
- Beydoun, M. A., Beydoun, H. A., Gamaldo, A. A., Teel, A., Zonderman, A. B., & Wang, Y. (2014). Epidemiologic studies of modifiable factors associated with cognition and dementia: Systematic review and meta-analysis. BMC Public Health, 14, 643. [Google Scholar] [CrossRef]
- Buckley, R. F., Mormino, E. C., Amariglio, R. E., Properzi, M. J., Rabin, J. S., Lim, Y. Y., Papp, K. V., Jacobs, H., Burnham, S., Hanseeuw, B. J., Dore, V., Dobson, A., Masters, C. L., Waller, M., Rowe, C. C., Maruff, P., Donohue, M. C., Rentz, D. M., Kirn, D., Hedden, T., … Sperling, R. A. (2018). Sex, amyloid, and APOE epsilon4 and risk of cognitive decline in preclinical Alzheimer’s disease: Findings from three well-characterized cohorts. Alzheimers & Dementia, 14(9), 1193–1203. [Google Scholar] [CrossRef]
- Center for Healthy Aging and Development Studies. (2020). The Chinese longitudinal healthy longevity survey (CLHLS)-Longitudinal data (1998–2018). Peking University Open Research Data Platform. [Google Scholar] [CrossRef]
- Clemmensen, F. K., Hoffmann, K., Siersma, V., Sobol, N., Beyer, N., Andersen, B. B., Vogel, A., Lolk, A., Gottrup, H., Hogh, P., Waldemar, G., Hasselbalch, S. G., & Frederiksen, K. S. (2020). The role of physical and cognitive function in performance of activities of daily living in patients with mild-to-moderate Alzheimer’s disease—A cross-sectional study. BMC Geriatrics, 20(1), 513. [Google Scholar] [CrossRef] [PubMed]
- Connors, M. H., Sachdev, P. S., Kochan, N. A., Xu, J., Draper, B., & Brodaty, H. (2015). Cognition and mortality in older people: The Sydney Memory and Ageing Study. Age and Ageing, 44(6), 1049–1054. [Google Scholar] [CrossRef] [PubMed]
- Crystal, S., & Shea, D. (1990). Cumulative advantage, cumulative disadvantage, and inequality among elderly people. Gerontologist, 30(4), 437–443. [Google Scholar] [CrossRef] [PubMed]
- Deng, X., Geng, Z., Yu, J., Dai, X., Kuang, X., Chen, X., Li, R., Liu, T., & Li, C. (2023). The Association between cataract and cognitive functions in older adults: A longitudinal cohort study. Journal of Alzheimers Disease, 91(3), 1097–1105. [Google Scholar] [CrossRef]
- Dewey, M. E., & Saz, P. (2001). Dementia, cognitive impairment and mortality in persons aged 65 and over living in the community: A systematic review of the literature. International Journal of Geriatric Psychiatry, 16(8), 751–761. [Google Scholar] [CrossRef]
- Ding, M., Ouyang, H., Zhang, C., Jiang, L., Zhuang, R., Dong, X., Chen, X., Yang, H., & Tao, Q. (2022). Mahjong playing and leisure physical activity alleviate cognitive symptoms in older community residents. Journal of Aging and Physical Activity, 30(1), 89–97. [Google Scholar] [CrossRef]
- Downer, B., Al, S. S., Howrey, B. T., Raji, M. A., Markides, K. S., & Ottenbacher, K. J. (2019). Combined effects of cognitive impairment and pre-frailty on future frailty and death in older Mexican Americans. Aging & Mental Health, 23(10), 1405–1412. [Google Scholar] [CrossRef]
- Duan, J., Lv, Y. B., Gao, X., Zhou, J. H., Kraus, V. B., Zeng, Y., Su, H., & Shi, X. M. (2020). Association of cognitive impairment and elderly mortality: Differences between two cohorts ascertained 6-years apart in China. BMC Geriatrics, 20(1), 29. [Google Scholar] [CrossRef]
- Frankfurt, S., Frazier, P., Syed, M., & Jung, K. R. (2016). Using group-based trajectory and growth mixture modeling to identify classes of change trajectories. The Counseling Psychologist, 44(5), 622–660. [Google Scholar] [CrossRef]
- Fu, C., Chute, D. J., Farag, E. S., Garakian, J., Cummings, J. L., & Vinters, H. V. (2004). Comorbidity in dementia: An autopsy study. Archives of Pathology & Laboratory Medicine, 128(1), 32–38. [Google Scholar] [CrossRef]
- Gaertner, B., Buttery, A. K., Finger, J. D., Wolfsgruber, S., Wagner, M., & Busch, M. A. (2018). Physical exercise and cognitive function across the life span: Results of a nationwide population-based study. Journal of Science and Medicine in Sport, 21(5), 489–494. [Google Scholar] [CrossRef]
- Gao, M., Kuang, W., Qiu, P., Wang, H., Lv, X., & Yang, M. (2017). The time trends of cognitive impairment incidence among older Chinese people in the community: Based on the CLHLS cohorts from 1998 to 2014. Age and Ageing, 46(5), 787–793. [Google Scholar] [CrossRef] [PubMed]
- Gao, S., Jin, Y., Unverzagt, F. W., Cheng, Y., Su, L., Wang, C., Ma, F., Hake, A. M., Kettler, C., Chen, C., Liu, J., Bian, J., Li, P., Murrell, J. R., Clark, D. O., & Hendrie, H. C. (2014). Cognitive function, body mass index and mortality in a rural elderly Chinese cohort. Archives of Public Health, 72(1), 9. [Google Scholar] [CrossRef] [PubMed]
- Gardeniers, M., van Groenou, M., Meijboom, E. J., & Huisman, M. (2022). Three-year trajectories in functional limitations and cognitive decline among Dutch 75+ year olds, using nine-month intervals. BMC Geriatrics, 22(1), 89. [Google Scholar] [CrossRef] [PubMed]
- Georgakis, M. K., Papadopoulos, F. C., Protogerou, A. D., Pagonari, I., Sarigianni, F., Biniaris-Georgallis, S. I., Kalogirou, E., Thomopoulos, T. P., Kapaki, E., Papageorgiou, C., Papageorgiou, S. G., Tousoulis, D., & Petridou, E. T. (2016). Comorbidity of cognitive impairment and late-life depression increase mortality: Results from a cohort of community-dwelling elderly individuals in Rural Greece. Journal of Geriatric Psychiatry and Neurology, 29(4), 195–204. [Google Scholar] [CrossRef]
- Gombojav, B., Yi, S. W., Sull, J. W., Nam, C. M., & Ohrr, H. (2011). Combined effects of cognitive impairment and hypertension on total mortality in elderly people: The Kangwha Cohort study. Gerontology, 57(6), 490–496. [Google Scholar] [CrossRef]
- Griva, K., Stygall, J., Hankins, M., Davenport, A., Harrison, M., & Newman, S. P. (2010). Cognitive impairment and 7-year mortality in dialysis patients. American Journal of Kidney Diseases, 56(4), 693–703. [Google Scholar] [CrossRef]
- Guehne, U., Angermeyer, M. C., & Riedel-Heller, S. (2006). Is mortality increased in mildly cognitively impaired individuals? A systematic literature review. Dementia and Geriatric Cognitive Disorders, 21(5–6), 403–410. [Google Scholar] [CrossRef]
- Han, L., Gill, T. M., Jones, B. L., & Allore, H. G. (2016). Cognitive aging trajectories and burdens of disability, hospitalization and nursing home admission among community-living older persons. Journals of Gerontology Series A-Biological Sciences and Medical Sciences, 71(6), 766–771. [Google Scholar] [CrossRef]
- Hao, L., Wang, X., Zhang, L., Xing, Y., Guo, Q., Hu, X., Mu, B., Chen, Y., Chen, G., Cao, J., Zhi, X., Liu, J., Li, X., Yang, L., Li, J., Du, W., Sun, Y., Wang, T., Liu, Z., Liu, Z., … Han, Y. (2017). Prevalence, risk factors, and complaints screening tool exploration of subjective cognitive decline in a large cohort of the chinese population. Journal of Alzheimers Disease, 60(2), 371–388. [Google Scholar] [CrossRef]
- Hapca, S., Guthrie, B., Cvoro, V., Bu, F., Rutherford, A. C., Reynish, E., & Donnan, P. T. (2018). Mortality in people with dementia, delirium, and unspecified cognitive impairment in the general hospital: Prospective cohort study of 6,724 patients with 2 years follow-up. Clinical Epidemiology, 10, 1743–1753. [Google Scholar] [CrossRef]
- Hsu, H. C., & Bai, C. H. (2022). Individual and environmental factors associated with cognitive function in older people: A longitudinal multilevel analysis. BMC Geriatrics, 22(1), 243. [Google Scholar] [CrossRef] [PubMed]
- Hu, M., Shu, X., Yu, G., Wu, X., Valimaki, M., & Feng, H. (2021). A risk prediction model based on machine learning for cognitive impairment among chinese community-dwelling elderly people with normal cognition: Development and validation study. Journal of Medical Internet Research, 23(2), e20298. [Google Scholar] [CrossRef] [PubMed]
- Hu, X., Gu, S., Sun, X., Gu, Y., Zhen, X., Li, Y., Huang, M., Wei, J., & Dong, H. (2019). Cognitive ageing trajectories and mortality of Chinese oldest-old. Archives of Gerontology And Geriatrics, 82, 81–87. [Google Scholar] [CrossRef]
- Hu, X., Zeng, Y., Zhen, X., Zhang, H., Li, Y., Gu, S., & Dong, H. (2018). Cognitive and physical function of people older than 80 years in China from 1998 to 2014. Journal of International Medical Research, 46(7), 2810–2827. [Google Scholar] [CrossRef]
- Humphreys, G. (2012). The health-care challenges posed by population ageing. Bulletin of the World Health Organization, 90(2), 82–83. [Google Scholar] [CrossRef] [PubMed]
- Jefferis, J. M., Mosimann, U. P., & Clarke, M. P. (2011). Cataract and cognitive impairment: A review of the literature. British Journal of Ophthalmology, 95(1), 17–23. [Google Scholar] [CrossRef]
- Jia, J., Wang, F., Wei, C., Zhou, A., Jia, X., Li, F., Tang, M., Chu, L., Zhou, Y., Zhou, C., Cui, Y., Wang, Q., Wang, W., Yin, P., Hu, N., Zuo, X., Song, H., Qin, W., Wu, L., Li, D., … Dong, X. (2014). The prevalence of dementia in urban and rural areas of China. Alzheimers & Dementia, 10(1), 1–9. [Google Scholar] [CrossRef]
- Jia, R. X., Liang, J. H., Xu, Y., & Wang, Y. Q. (2019). Effects of physical activity and exercise on the cognitive function of patients with Alzheimer disease: A meta-analysis. BMC Geriatrics, 19(1), 181. [Google Scholar] [CrossRef]
- Jia, W., Han, K., Wang, S., Song, Y., Yang, S., Cao, W., He, Y., & Liu, M. (2021). Associations between anemia, cognitive impairment, and all-cause mortality in oldest-old adults: A prospective population-based cohort study. Frontiers in Medicine, 8, 613426. [Google Scholar] [CrossRef]
- Jonas, J. B., Wei, W. B., Zhu, L. P., Xu, L., & Wang, Y. X. (2018). Cognitive function and ophthalmological diseases: The Beijing eye study. Scientific Reports, 8(1), 4816. [Google Scholar] [CrossRef] [PubMed]
- Kim, D., Arai, H., & Kim, S. (2017). Social activities are associated with cognitive decline in older Koreans. Geriatrics & Gerontology International, 17(8), 1191–1196. [Google Scholar] [CrossRef]
- Kim, J. H., & Kim, J. M. (2019). Association of cognitive impairment and grip strength trajectories with mortality among middle-aged and elderly adults. International Psychogeriatrics, 31(5), 723–734. [Google Scholar] [CrossRef] [PubMed]
- Kim, M., & Park, J. M. (2017). Factors affecting cognitive function according to gender in community-dwelling elderly individuals. Epidemiology and Health, 39, e2017054. [Google Scholar] [CrossRef]
- Kulesh, A., Drobakha, V., Kuklina, E., Nekrasova, I., & Shestakov, V. (2018). Cytokine response, tract-specific fractional anisotropy, and brain morphometry in post-stroke cognitive impairment. Journal of Stroke & Cerebrovascular Diseases, 27(7), 1752–1759. [Google Scholar] [CrossRef]
- Kuzma, E., Lourida, I., Moore, S. F., Levine, D. A., Ukoumunne, O. C., & Llewellyn, D. J. (2018). Stroke and dementia risk: A systematic review and meta-analysis. Alzheimers & Dementia, 14(11), 1416–1426. [Google Scholar] [CrossRef]
- Lavery, L. L., Dodge, H. H., Snitz, B., & Ganguli, M. (2009). Cognitive decline and mortality in a community-based cohort: The Monongahela Valley Independent Elders Survey. Journal of the American Geriatrics Society, 57(1), 94–100. [Google Scholar] [CrossRef] [PubMed]
- Lee, Y., Chi, I., & A. Palinkas, L. (2019). Widowhood, leisure activity engagement, and cognitive function among older adults. Aging & Mental Health, 23(6), 771–780. [Google Scholar] [CrossRef]
- Lee, Y., & Cho, C. C. (2021). Examining the effects of multiple chronic conditions on cognitive decline and potential moderators among older Koreans: Findings from the Korean Longitudinal Study of Ageing 2006–2016. Archives of Gerontology and Geriatrics, 95, 104424. [Google Scholar] [CrossRef]
- Li, G., Larson, E. B., Shofer, J. B., Crane, P. K., Gibbons, L. E., McCormick, W., Bowen, J. D., & Thompson, M. L. (2017a). Cognitive trajectory changes over 20 years before dementia diagnosis: A large cohort study. Journal of the American Geriatrics Society, 65(12), 2627–2633. [Google Scholar] [CrossRef]
- Li, L. W., Ding, D., Wu, B., & Dong, X. (2017b). Change of cognitive function in U.S. Chinese older adults: A population-based study. Journals of Gerontology Series A-Biological Sciences and Medical Sciences, 72(Suppl. 1), S5–S10. [Google Scholar] [CrossRef]
- Li, R., & Singh, M. (2014). Sex differences in cognitive impairment and Alzheimer’s disease. Frontiers in Neuroendocrinology, 35(3), 385–403. [Google Scholar] [CrossRef] [PubMed]
- Lin, L. H., Wang, S. B., Xu, W. Q., Hu, Q., Zhang, P., Ke, Y. F., Huang, J. H., Ding, K. R., Li, X. L., Hou, C. L., & Jia, F. J. (2022). Subjective cognitive decline symptoms and its association with socio-demographic characteristics and common chronic diseases in the southern Chinese older adults. BMC Public Health, 22(1), 127. [Google Scholar] [CrossRef] [PubMed]
- Liu, T., & Sun, L. (2015). An apocalyptic vision of ageing in China: Old age care for the largest elderly population in the world. Zeitschrift fur Gerontologie und Geriatrie, 48(4), 354–364. [Google Scholar] [CrossRef]
- Lv, X., Li, W., Ma, Y., Chen, H., Zeng, Y., Yu, X., Hofman, A., & Wang, H. (2019). Cognitive decline and mortality among community-dwelling Chinese older people. BMC Medicine, 17(1), 63. [Google Scholar] [CrossRef]
- Maharani, A., Dawes, P., Nazroo, J., Tampubolon, G., & Pendleton, N. (2018). Cataract surgery and age-related cognitive decline: A 13-year follow-up of the English Longitudinal Study of Ageing. PLoS ONE, 13(10), e204833. [Google Scholar] [CrossRef]
- Mao, C., Li, Z. H., Lv, Y. B., Gao, X., Kraus, V. B., Zhou, J. H., Wu, X. B., Shi, W. Y., Li, F. R., Liu, S. M., Yin, Z. X., Zeng, Y., & Shi, X. M. (2020). Specific leisure activities and cognitive functions among the oldest-old: The Chinese Longitudinal Healthy Longevity Survey. Journals of Gerontology Series A-Biological Sciences and Medical Sciences, 75(4), 739–746. [Google Scholar] [CrossRef]
- Marioni, R. E., Proust-Lima, C., Amieva, H., Brayne, C., Matthews, F. E., Dartigues, J. F., & Jacqmin-Gadda, H. (2014). Cognitive lifestyle jointly predicts longitudinal cognitive decline and mortality risk. European Journal of Epidemiology, 29(3), 211–219. [Google Scholar] [CrossRef]
- Matthews, F. E., Arthur, A., Barnes, L. E., Bond, J., Jagger, C., Robinson, L., & Brayne, C. (2013). A two-decade comparison of prevalence of dementia in individuals aged 65 years and older from three geographical areas of England: Results of the Cognitive Function and Ageing Study I and II. Lancet, 382(9902), 1405–1412. [Google Scholar] [CrossRef]
- McGrath, R., Vincent, B. M., Hackney, K. J., Al, S. S., Graham, J., Thomas, L., Ehlers, D. K., & Clark, B. C. (2020). Weakness and cognitive impairment are independently and jointly associated with functional decline in aging Americans. Aging Clinical and Experimental Research, 32(9), 1723–1730. [Google Scholar] [CrossRef]
- Mehta, K. M., Yaffe, K., & Covinsky, K. E. (2002). Cognitive impairment, depressive symptoms, and functional decline in older people. Journal of the American Geriatrics Society, 50(6), 1045–1050. [Google Scholar] [CrossRef] [PubMed]
- Meredith, W., & Tisak, J. (1990). Latent curve analysis. Psychometrika, 55(1), 107–122. [Google Scholar] [CrossRef]
- Min, J. W. (2018). A longitudinal study of cognitive trajectories and its factors for Koreans aged 60 and over: A latent growth mixture model. International Journal of Geriatric Psychiatry, 33(5), 755–762. [Google Scholar] [CrossRef]
- Muniz-Terrera, G., Matthews, F. E., Stephan, B., & Brayne, C. (2011). Are terminal decline and its potential indicators detectable in population studies of the oldest old? International Journal of Geriatric Psychiatry, 26(6), 584–592. [Google Scholar] [CrossRef] [PubMed]
- Nagin, D. S., & Odgers, C. L. (2010). Group-based trajectory modeling in clinical research. Annual Review of Clinical Psychology, 6, 109–138. [Google Scholar] [CrossRef] [PubMed]
- Nasreddine, Z. S., Phillips, N. A., Bedirian, V., Charbonneau, S., Whitehead, V., Collin, I., Cummings, J. L., & Chertkow, H. (2005). The Montreal Cognitive Assessment, MoCA: A brief screening tool for mild cognitive impairment. Journal of the American Geriatrics Society, 53(4), 695–699. [Google Scholar] [CrossRef]
- Olaya, B., Bobak, M., Haro, J. M., & Demakakos, P. (2017). Trajectories of verbal episodic memory in middle-aged and older adults: Evidence from the English Longitudinal Study of Ageing. Journal of the American Geriatrics Society, 65(6), 1274–1281. [Google Scholar] [CrossRef]
- Park, S., Kwon, E., & Lee, H. (2017). Life course trajectories of later-life cognitive functions: Does social engagement in old age matter? International Journal of Environmental Research and Public Health, 14(4), 393. [Google Scholar] [CrossRef]
- Pei, Z., Zhang, J., Qin, W., Hu, F., Zhao, Y., Zhang, X., Cong, X., Liu, C., & Xu, L. (2022). Association between dietary patterns and depression in Chinese Older Adults: A longitudinal study based on CLHLS. Nutrients, 14(24), 5230. [Google Scholar] [CrossRef]
- Perna, L., Wahl, H. W., Mons, U., Saum, K. U., Holleczek, B., & Brenner, H. (2015). Cognitive impairment, all-cause and cause-specific mortality among non-demented older adults. Age and Ageing, 44(3), 445–451. [Google Scholar] [CrossRef]
- Qiu, J., Sun, H., Zhong, C., Ma, Q., Wang, C., Zhou, X., & Ma, Y. (2019). Reclassified cognitive leisure activity and risk of cognitive impairment in Chinese older adults aged ≥80 years: A 16-year prospective cohort study. Geriatrics & Gerontology International, 19(10), 1041–1047. [Google Scholar] [CrossRef]
- Qiu, P., Zeng, M., Kuang, W., Meng, S. S., Cai, Y., Wang, H., & Wan, Y. (2020). Heterogeneity in the dynamic change of cognitive function among older Chinese people: A growth mixture model. International Journal of Geriatric Psychiatry, 35(10), 1123–1133. [Google Scholar] [CrossRef] [PubMed]
- Rajan, K. B., Aggarwal, N. T., Wilson, R. S., Everson-Rose, S. A., & Evans, D. A. (2014). Association of cognitive functioning, incident stroke, and mortality in older adults. Stroke, 45(9), 2563–2567. [Google Scholar] [CrossRef] [PubMed]
- Ram, N., & Grimm, K. J. (2009). Growth mixture modeling: A Method for identifying differences in longitudinal change among unobserved groups. International Journal of Behavioral Development, 33(6), 565–576. [Google Scholar] [CrossRef]
- Rocca, W. A., Petersen, R. C., Knopman, D. S., Hebert, L. E., Evans, D. A., Hall, K. S., Gao, S., Unverzagt, F. W., Langa, K. M., Larson, E. B., & White, L. R. (2011). Trends in the incidence and prevalence of Alzheimer’s disease, dementia, and cognitive impairment in the United States. Alzheimers & Dementia, 7(1), 80–93. [Google Scholar] [CrossRef]
- Roher, A. E., Tyas, S. L., Maarouf, C. L., Daugs, I. D., Kokjohn, T. A., Emmerling, M. R., Garami, Z., Belohlavek, M., Sabbagh, M. N., Sue, L. I., & Beach, T. G. (2011). Intracranial atherosclerosis as a contributing factor to Alzheimer’s disease dementia. Alzheimers & Dementia, 7(4), 436–444. [Google Scholar] [CrossRef]
- Ruxton, K., Woodman, R. J., & Mangoni, A. A. (2015). Drugs with anticholinergic effects and cognitive impairment, falls and all-cause mortality in older adults: A systematic review and meta-analysis. British Journal of Clinical Pharmacology, 80(2), 209–220. [Google Scholar] [CrossRef]
- Savva, G. M., & Stephan, B. C. (2010). Epidemiological studies of the effect of stroke on incident dementia: A systematic review. Stroke, 41(1), e41–e46. [Google Scholar] [CrossRef]
- Schupf, N., Tang, M. X., Albert, S. M., Costa, R., Andrews, H., Lee, J. H., & Mayeux, R. (2005). Decline in cognitive and functional skills increases mortality risk in nondemented elderly. Neurology, 65(8), 1218–1226. [Google Scholar] [CrossRef]
- Shipley, B. A., Der, G., Taylor, M. D., & Deary, I. J. (2007). Association between mortality and cognitive change over 7 years in a large representative sample of UK residents. Psychosomatic Medicine, 69(7), 640–650. [Google Scholar] [CrossRef]
- Singham, T., Bell, G., Saunders, R., & Stott, J. (2021). Widowhood and cognitive decline in adults aged 50 and over: A systematic review and meta-analysis. Ageing Research Reviews, 71, 101461. [Google Scholar] [CrossRef] [PubMed]
- Smith, S. G., Jackson, S. E., Kobayashi, L. C., & Steptoe, A. (2018). Social isolation, health literacy, and mortality risk: Findings from the English Longitudinal Study of Ageing. Health Psychology, 37(2), 160–169. [Google Scholar] [CrossRef]
- Song, Y., & Bian, Y. (2014). Gender differences in the use of health care in China: Cross-sectional analysis. International Journal for Equity in Health, 13, 8. [Google Scholar] [CrossRef] [PubMed]
- Su, J., & Xiao, X. (2022). Factors leading to the trajectory of cognitive decline in middle-aged and older adults using group-based trajectory modeling: A cohort study. Medicine, 101(47), e31817. [Google Scholar] [CrossRef]
- Tai, C. J., Tseng, T. G., Yeh, C. J., Liao, W. C., Hsiao, Y. H., Lee, S. H., Kuo, T. A., Liang, F. W., & Lee, M. C. (2022). The association between visual trajectories and cognitive impairment: Insights from the Taiwan Longitudinal Study on Aging. Aging Clinical and Experimental Research, 34(9), 2129–2137. [Google Scholar] [CrossRef] [PubMed]
- Tampubolon, G. (2015). Cognitive ageing in Great Britain in the New Century: Cohort differences in episodic memory. PLoS ONE, 10(12), e144907. [Google Scholar] [CrossRef]
- Taniguchi, Y., Kitamura, A., Ishizaki, T., Fujiwara, Y., Shinozaki, T., Seino, S., Mitsutake, S., Suzuki, H., Yokoyama, Y., Abe, T., Ikeuchi, T., Yokota, I., Matsuyama, Y., & Shinkai, S. (2019). Association of trajectories of cognitive function with cause-specific mortality and medical and long-term care costs. Geriatrics & Gerontology International, 19(12), 1236–1242. [Google Scholar] [CrossRef]
- Taniguchi, Y., Kitamura, A., Murayama, H., Amano, H., Shinozaki, T., Yokota, I., Seino, S., Nofuji, Y., Nishi, M., Yokoyama, Y., Matsuyama, Y., Fujiwara, Y., & Shinkai, S. (2017). Mini-Mental State Examination score trajectories and incident disabling dementia among community-dwelling older Japanese adults. Geriatrics & Gerontology International, 17(11), 1928–1935. [Google Scholar] [CrossRef]
- Taylor, C. A., Bouldin, E. D., & McGuire, L. C. (2018). Subjective cognitive decline among adults aged ≥45 years—United States, 2015–2016. MMWR-Morbidity and Mortality Weekly Report, 67(27), 753–757. [Google Scholar] [CrossRef]
- Taylor, S., Furness, P., Ashe, S., Haywood-Small, S., & Lawson, K. (2021). Comorbid conditions, mental health and cognitive functions in adults with fibromyalgia. Western Journal of Nursing Research, 43(2), 115–122. [Google Scholar] [CrossRef]
- Tu, L., Lv, X., Yuan, C., Zhang, M., Fan, Z., Xu, X., Zeng, Y., Yu, X., & Wang, H. (2020). Trajectories of cognitive function and their determinants in older people: 12 years of follow-up in the Chinese Longitudinal Healthy Longevity Survey. International Psychogeriatrics, 32(6), 765–775. [Google Scholar] [CrossRef] [PubMed]
- Wang, J., Liu, N., & Zhao, X. (2022). Association of playing cards or mahjong with cognitive function in Chinese Older Adults. International Journal of Environmental Research and Public Health, 19(15), 9249. [Google Scholar] [CrossRef] [PubMed]
- Wendell, C. R., Waldstein, S. R., Ferrucci, L., O’Brien, R. J., Strait, J. B., & Zonderman, A. B. (2012). Carotid atherosclerosis and prospective risk of dementia. Stroke, 43(12), 3319–3324. [Google Scholar] [CrossRef]
- White, L., Petrovitch, H., Hardman, J., Nelson, J., Davis, D. G., Ross, G. W., Masaki, K., Launer, L., & Markesbery, W. R. (2002). Cerebrovascular pathology and dementia in autopsied Honolulu-Asia Aging Study participants. Annals of the New York Academy of Sciences, 977, 9–23. [Google Scholar] [CrossRef] [PubMed]
- WHO. (2019). Risk reduction of cognitive decline and dementia: WHO guidelines. World Health Organization. Available online: https://www.ncbi.nlm.nih.gov/books/NBK542796 (accessed on 1 April 2023).
- Wilson, R. S., Yu, L., Trojanowski, J. Q., Chen, E. Y., Boyle, P. A., Bennett, D. A., & Schneider, J. A. (2013). TDP-43 pathology, cognitive decline, and dementia in old age. JAMA Neurology, 70(11), 1418–1424. [Google Scholar] [CrossRef]
- Wu, Z., Woods, R. L., Chong, T., Orchard, S. G., Shah, R. C., Wolfe, R., Storey, E., Sheets, K. M., Murray, A. M., McNeil, J. J., & Ryan, J. (2022). Cognitive trajectories in community-dwelling older adults and incident dementia, disability and death: A 10-Year longitudinal study. Frontiers in Medicine, 9, 917254. [Google Scholar] [CrossRef]
- Yaffe, K., Lindquist, K., Vittinghoff, E., Barnes, D., Simonsick, E. M., Newman, A., Satterfield, S., Rosano, C., Rubin, S. M., Ayonayon, H. N., & Harris, T. (2010). The effect of maintaining cognition on risk of disability and death. Journal of the American Geriatrics Society, 58(5), 889–894. [Google Scholar] [CrossRef]
- Yaffe, K., Peltz, C. B., Ewing, S. K., McCulloch, C. E., Cummings, S. R., Cauley, J. A., Hillier, T. A., & Ensrud, K. E. (2016). Long-term cognitive trajectories and mortality in older women. Journals of Gerontology Series A-Biological Sciences and Medical Sciences, 71(8), 1074–1080. [Google Scholar] [CrossRef]
- Yang, L., Martikainen, P., Silventoinen, K., & Konttinen, H. (2016). Association of socioeconomic status and cognitive functioning change among elderly Chinese people. Age and Ageing, 45(5), 674–680. [Google Scholar] [CrossRef]
- Ye, L., Luo, J., Shia, B. C., & Fang, Y. (2020a). Heterogeneous health classes for older adults and their regional disparities in China: Based on multidimensional health. Public Health, 178, 15–22. [Google Scholar] [CrossRef]
- Ye, L., Xiao, J., & Fang, Y. (2020b). Heterogeneous trajectory classes of social engagement and sex differences for Older Adults in China. International Journal of Environmental Research and Public Health, 17(22), 8322. [Google Scholar] [CrossRef] [PubMed]
- Yohannes, A. M., Chen, W., Moga, A. M., Leroi, I., & Connolly, M. J. (2017). Cognitive impairment in chronic obstructive pulmonary disease and chronic heart failure: A systematic review and meta-analysis of observational studies. Journal of the American Medical Directors Association, 18(5), 451. [Google Scholar] [CrossRef]
- Yu, J., Feng, Q., Yu, J., Zeng, Y., & Feng, L. (2020). Late-Life cognitive trajectories and their associated lifestyle factors. Journal of Alzheimers Disease, 73(4), 1555–1563. [Google Scholar] [CrossRef] [PubMed]
- Yu, W., Chen, R., Zhang, M., Li, Z., Gao, F., Yu, S., & Zhang, X. (2021). Cognitive decline trajectories and influencing factors in China: A non-normal growth mixture model analysis. Archives of Gerontology and Geriatrics, 95, 104381. [Google Scholar] [CrossRef] [PubMed]
- Zahodne, L. B., Schupf, N., Brickman, A. M., Mayeux, R., Wall, M. M., Stern, Y., & Manly, J. J. (2016). Dementia risk and protective factors differ in the context of memory trajectory groups. Journal of Alzheimers Disease, 52(3), 1013–1020. [Google Scholar] [CrossRef]
- Zaninotto, P., Batty, G. D., Allerhand, M., & Deary, I. J. (2018). Cognitive function trajectories and their determinants in older people: 8 years of follow-up in the English Longitudinal Study of Ageing. Journal of Epidemiology and Community Health, 72(8), 685–694. [Google Scholar] [CrossRef] [PubMed]
- Zeng, Y., Feng, Q., Hesketh, T., Christensen, K., & Vaupel, J. W. (2017). Survival, disabilities in activities of daily living, and physical and cognitive functioning among the oldest-old in China: A cohort study. Lancet, 389(10079), 1619–1629. [Google Scholar] [CrossRef]
- Zhang, Z. (2006). Gender differentials in cognitive impairment and decline of the oldest old in China. Journals of Gerontology Series B-Psychological Sciences and Social Sciences, 61(2), S107–S115. [Google Scholar] [CrossRef] [PubMed]
- Zhang, Z., Gu, D., & Hayward, M. D. (2008). Early life influences on cognitive impairment among oldest old Chinese. Journals of Gerontology Series B-Psychological Sciences and Social Sciences, 63(1), S25–S33. [Google Scholar] [CrossRef]
- Zhou, D. F., Wu, C. S., Qi, H., Fan, J. H., Sun, X. D., Como, P., Qiao, Y. L., Zhang, L., & Kieburtz, K. (2006). Prevalence of dementia in rural China: Impact of age, gender and education. Acta Neurologica Scandinavica, 114(4), 273–280. [Google Scholar] [CrossRef]
- Zimmerman, B., Rypma, B., Gratton, G., & Fabiani, M. (2021). Age-related changes in cerebrovascular health and their effects on neural function and cognition: A comprehensive review. Psychophysiology, 58(7), e13796. [Google Scholar] [CrossRef] [PubMed]

| Characteristic | Total Sample (n = 6232) | Class 1 (n = 438) | Class 2 (n = 645) | Class 3 (n = 511) | Class 4 (n = 4638) |
|---|---|---|---|---|---|
| C-MMSE score, mean ± SD | 27.44 ± 2.96 | 25.53 ± 3.56 | 27.36 ± 2.32 | 20.58 ± 2.18 | 28.39 ± 1.70 |
| Cohort | |||||
| 2002, No. (%) | 2962 (47.53) | 143 (32.65) | 314 (48.68) | 206 (40.31) | 2299 (49.57) |
| 2005, No. (%) | 1319 (21.16) | 109 (24.89) | 154 (23.88) | 85 (16.64) | 971 (20.94) |
| 2008–2009, No. (%) | 1677 (26.91) | 175 (39.95) | 155 (24.03) | 202 (39.53) | 1145 (24.69) |
| 2011–2012, No. (%) | 274 (4.40) | 11 (2.51) | 22 (3.41) | 18 (3.52) | 223 (4.80) |
| Age | |||||
| 65–80, No. (%) | 4511 (72.38) | 107 (24.43) | 325 (50.39) | 220 (43.05) | 3859 (83.20) |
| >80, No. (%) | 1721 (27.62) | 331 (75.57) | 320 (49.61) | 291 (56.95) | 779 (16.80) |
| Sex | |||||
| Female, No. (%) | 3204 (51.41) | 287 (65.53) | 414 (64.19) | 371 (72.60) | 2132 (45.97) |
| Male, No. (%) | 3028 (48.59) | 151 (34.47) | 231 (35.81) | 140 (27.40) | 2506 (54.03) |
| Education | |||||
| 0 years, No. (%) | 3217 (51.77) | 320 (73.23) | 446 (69.36) | 445 (88.29) | 2006 (43.33) |
| 1–6 years, No. (%) | 2201 (35.42) | 94 (21.51) | 156 (24.26) | 59 (11.71) | 1892 (40.86) |
| 7+ years, No. (%) | 796 (12.81) | 23 (5.26) | 41 (6.38) | 0 (0.00) | 732 (15.81) |
| Place of residence | |||||
| City, No. (%) | 2220 (36.62) | 164 (37.44) | 207 (32.09) | 136 (26.61) | 1713 (36.93) |
| Countryside, No. (%) | 4012 (64.38) | 274 (62.56) | 438 (67.91) | 375 (73.39) | 2925 (63.07) |
| Economic status | |||||
| Rich, No. (%) | 1006 (16.17) | 73 (16.67) | 106 (16.43) | 49 (9.59) | 778 (16.81) |
| Ordinary, No. (%) | 4322 (69.45) | 287 (65.53) | 417 (64.65) | 336 (65.75) | 3282 (70.90) |
| Poor, No. (%) | 895 (14.38) | 78 (17.80) | 122 (18.92) | 126 (24.66) | 569 (12.29) |
| Marital status | |||||
| Without spouse, No. (%) | 2644 (42.44) | 323 (73.74) | 380 (58.91) | 333 (65.17) | 1608 (34.69) |
| With spouse, No. (%) | 3586 (57.56) | 115 (26.26) | 265 (41.09) | 178 (34.83) | 3028 (65.31) |
| Smoking | |||||
| No, No. (%) | 4641 (74.48) | 374 (85.39) | 521 (80.78) | 415 (81.37) | 3331 (71.82) |
| Yes, No. (%) | 1590 (25.52) | 64 (14.61) | 124 (19.22) | 95 (18.63) | 1307 (28.18) |
| Drinking | |||||
| No, No. (%) | 4745 (76.16) | 364 (83.11) | 506 (78.45) | 423 (82.78) | 3452 (74.46) |
| Yes, No. (%) | 1485 (23.84) | 74 (16.89) | 139 (21.55) | 88 (17.22) | 1184 (25.54) |
| Exercise | |||||
| No, No. (%) | 4097 (65.79) | 306 (69.86) | 467 (72.52) | 405 (79.26) | 2919 (62.99) |
| Yes, No. (%) | 2130 (34.21) | 132 (30.14) | 177 (27.48) | 106 (20.74) | 1715 (37.01) |
| Garden work | |||||
| No, No. (%) | 4970 (79.75) | 393 (89.73) | 556 (86.20) | 448 (87.67) | 3573 (77.04) |
| Yes, No. (%) | 1262 (20.25) | 45 (10.27) | 89 (13.80) | 63 (12.33) | 1065 (22.96) |
| Read newspapers/books | |||||
| No, No. (%) | 4576 (73.43) | 375 (85.62) | 544 (84.34) | 490 (95.89) | 3167 (68.28) |
| Yes, No. (%) | 1656 (26.57) | 63 (14.38) | 101 (15.66) | 21 (4.11) | 1471 (31.72) |
| Raise domestic animals | |||||
| No, No. (%) | 3641 (58.42) | 319 (72.83) | 407 (63.10) | 296 (57.93) | 2619 (56.47) |
| Yes, No. (%) | 2591 (41.58) | 119 (27.17) | 238 (36.90) | 215 (42.07) | 2019 (43.53) |
| Play cards/mahjong | |||||
| No, No. (%) | 4731 (75.91) | 378 (86.30) | 528 (81.86) | 465 (91.00) | 3360 (72.45) |
| Yes, No. (%) | 1501 (24.09) | 60 (13.70) | 117 (18.14) | 46 (9.00) | 1278 (27.55) |
| Watch TV/listen to radio | |||||
| No, No. (%) | 1030 (16.53) | 136 (31.05) | 164 (25.43) | 172 (33.66) | 558 (12.03) |
| Yes, No. (%) | 5202 (83.47) | 302 (68.95) | 481 (74.57) | 339 (66.34) | 4080 (87.97) |
| Social activities | |||||
| No, No. (%) | 5086 (81.61) | 400 (91.32) | 557 (86.36) | 474 (92.76) | 3655 (78.81) |
| Yes, No. (%) | 1146 (18.39) | 38 (8.68) | 88 (13.64) | 37 (7.24) | 983 (21.19) |
| Physical labor regularly | |||||
| No, No. (%) | 944 (15.22) | 66 (15.14) | 80 (12.46) | 61 (12.03) | 737 (15.96) |
| Yes, No. (%) | 5258 (84.78) | 370 (84.86) | 562 (87.54) | 446 (87.97) | 3880 (84.04) |
| Hypertension | |||||
| No, No. (%) | 4982 (80.99) | 355 (82.37) | 516 (80.88) | 404 (80.64) | 3707 (80.92) |
| Yes, No. (%) | 1169 (19.01) | 76 (17.63) | 122 (19.12) | 97 (19.36) | 874 (19.08) |
| Diabetes | |||||
| No, No. (%) | 6008 (97.47) | 428 (98.39) | 627 (97.82) | 497 (98.42) | 4456 (97.23) |
| Yes, No. (%) | 156 (2.53) | 7 (1.61) | 14 (2.18) | 8 (1.58) | 127 (2.77) |
| Stroke/CVD | |||||
| No, No. (%) | 5900 (95.44) | 417 (95.42) | 609 (94.71) | 481 (94.87) | 4393 (95.60) |
| Yes, No. (%) | 282 (4.56) | 20 (4.58) | 34 (5.29) | 26 (5.13) | 202 (4.40) |
| Cataract | |||||
| No, No. (%) | 5698 (92.29) | 371 (85.48) | 573 (90.24) | 458 (91.23) | 4296 (93.33) |
| Yes, No. (%) | 476 (7.71) | 63 (14.52) | 62 (9.76) | 44 (8.77) | 307 (6.67) |
| No. of Classes | Model | AIC | BIC | ABIC | Entropy | VLRT | Class Size (%) |
|---|---|---|---|---|---|---|---|
| 2 | Linear | 146,471 | 146,565 | 146,520 | 0.931 | <0.001 | 86.78%/13.22% |
| Quadratic | 146,400 | 146,508 | 146,457 | 0.934 | <0.001 | 86.71%/13.29% | |
| Freely estimated | 146,411 | 146,526 | 146,471 | 0.931 | <0.001 | 86.52%/13.48% | |
| 3 | Linear | 145,317 | 145,418 | 145,370 | 0.917 | <0.001 | 78.66%/11.78%/9.56% |
| Quadratic | 144,937 | 145,071 | 145,008 | 0.923 | 0.018 | 79.43%/10.72%/9.85% | |
| Freely estimated | 145,167 | 145,288 | 145,231 | 0.920 | <0.001 | 78.72%/11.81%/9.47% | |
| 4 | Linear | 144,187 | 144,308 | 144,251 | 0.897 | <0.001 | 74.37%/10.27%/8.41%/6.95% |
| Quadratic | 143,736 | 143,898 | 143,821 | 0.923 | <0.001 | 77.44%/10.25%/9.42%/2.89% | |
| Freely estimated | 144,150 | 144,292 | 144,225 | 0.892 | <0.001 | 74.42%/10.35%/8.20%/7.03% | |
| 5 | Linear | 143,246 | 143,387 | 143,320 | 0.908 | 0.004 | 72.27%/9.90%/9.42%/4.93%/3.48% |
| Quadratic | 142,728 | 142,917 | 142,828 | 0.899 | <0.001 | 73.68%/9.92%/7.99%/5.12%/3.29% | |
| Freely estimated | 143,235 | 143,396 | 143,320 | 0.909 | 0.037 | 72.24%/9.97%/9.45%/4.96%/3.38% |
| Covariate | Rapid Decline Group | Slow Decline Group | Low-Level Stable Group | |||
|---|---|---|---|---|---|---|
| OR (95% CI) | p-Value | OR (95% CI) | p-Value | OR (95% CI) | p-Value | |
| Cohort | ||||||
| 2002 (ref.) | ||||||
| 2005 | 1.00 (0.74, 1.35) | 0.999 | 0.85 (0.68, 1.07) | 0.175 | 0.74 (0.55, 1.01) | 0.053 |
| 2008–2009 | 0.91 (0.69, 1.21) | 0.515 | 0.54 (0.43, 0.69) | <0.001 | 1.09 (0.84, 1.40) | 0.535 |
| 2011–2012 | 0.31 (0.15, 0.63) | 0.001 | 0.39 (0.23, 0.65) | <0.001 | 0.45 (0.25, 0.81) | 0.008 |
| Age | ||||||
| 65–80 (ref.) | ||||||
| >80 | 9.90 (7.50, 13.07) | <0.001 | 4.62 (3.73, 5.72) | <0.001 | 4.55 (3.56, 5.82) | <0.001 |
| Sex | ||||||
| Female (ref.) | ||||||
| Male | 0.84 (0.63, 1.12) | 0.245 | 0.69 (0.54, 0.87) | 0.002 | 0.72 (0.55, 0.95) | 0.021 |
| Education | ||||||
| 0 years (ref.) | ||||||
| 1–6 years | 0.56 (0.41, 0.76) | <0.001 | 0.60 (0.47, 0.75) | <0.001 | 0.27 (0.19, 0.37) | <0.001 |
| 7+ years | 0.51 (0.29, 0.89) | 0.017 | 0.55 (0.36, 0.83) | 0.004 | NA | NA |
| Place of residence | ||||||
| City (ref.) | ||||||
| Countryside | 0.92 (0.72, 1.18) | 0.520 | 1.06 (0.86, 1.31) | 0.573 | 1.19 (0.93, 1.52) | 0.169 |
| Economic status | ||||||
| Rich (ref.) | ||||||
| Ordinal | 0.90 (0.66, 1.21) | 0.479 | 0.88 (0.69, 1.12) | 0.286 | 1.27 (0.91, 1.78) | 0.163 |
| Poor | 1.13 (0.77, 1.67) | 0.537 | 1.25 (0.91, 1.70) | 0.168 | 1.91 (1.30, 2.81) | 0.001 |
| Marital status | ||||||
| Without spouse (ref.) | ||||||
| With spouse | 0.50 (0.39, 0.65) | <0.001 | 0.74 (0.61, 0.90) | 0.002 | 0.67 (0.54, 0.84) | 0.001 |
| Smoking | ||||||
| No (ref.) | ||||||
| Yes | 0.89 (0.64, 1.23) | 0.463 | 0.99 (0.77, 1.27) | 0.934 | 1.30 (0.97, 1.75) | 0.078 |
| Drinking | ||||||
| No (ref.) | ||||||
| Yes | 0.98 (0.72, 1.34) | 0.906 | 1.19 (0.94, 1.50) | 0.149 | 1.08 (0.81, 1.44) | 0.607 |
| Exercise | ||||||
| No (ref.) | ||||||
| Yes | 1.04 (0.81, 1.34) | 0.764 | 0.81 (0.66, 1.01) | 0.057 | 0.79 (0.61, 1.02) | 0.066 |
| Garden work | ||||||
| No (ref.) | ||||||
| Yes | 0.68 (0.48, 0.98) | 0.038 | 0.82 (0.63, 1.06) | 0.134 | 1.09 (0.80, 1.49) | 0.588 |
| Read newspapers/books | ||||||
| No (ref.) | ||||||
| Yes | 1.01 (0.69, 1.47) | 0.980 | 0.96 (0.72, 1.30) | 0.808 | 0.59 (0.35, 0.97) | 0.038 |
| Raise domestic animals | ||||||
| No (ref.) | ||||||
| Yes | 0.65 (0.51, 0.84) | 0.001 | 0.78 (0.64, 0.95) | 0.013 | 0.99 (0.80, 1.24) | 0.939 |
| Play cards/mahjong | ||||||
| No (ref.) | ||||||
| Yes | 0.65 (0.47, 0.89) | 0.007 | 0.82 (0.65, 1.03) | 0.086 | 0.52 (0.37, 0.72) | <0.001 |
| Watch TV/listen to radio | ||||||
| No (ref.) | ||||||
| Yes | 0.77 (0.59, 0.99) | 0.046 | 0.81 (0.65, 1.02) | 0.070 | 0.67 (0.53, 0.85) | 0.001 |
| Social activities | ||||||
| No (ref.) | ||||||
| Yes | 0.55 (0.38, 0.82) | 0.003 | 0.92 (0.71, 1.20) | 0.544 | 0.60 (0.41, 0.89) | 0.010 |
| Physical labor regularly | ||||||
| No (ref.) | ||||||
| Yes | 1.11 (0.79, 1.54) | 0.551 | 1.20 (0.90, 1.59) | 0.218 | 0.85 (0.61, 1.19) | 0.344 |
| Hypertension | ||||||
| No (ref.) | ||||||
| Yes | 1.03 (0.77, 1.38) | 0.846 | 1.15 (0.91, 1.45) | 0.243 | 1.15 (0.88, 1.51) | 0.295 |
| Diabetes | ||||||
| No (ref.) | ||||||
| Yes | 1.00 (0.43, 2.30) | 0.992 | 1.07 (0.58, 1.97) | 0.832 | 1.06 (0.48, 2.34) | 0.881 |
| Stroke/CVD | ||||||
| No (ref.) | ||||||
| Yes | 1.53 (0.91, 2.59) | 0.112 | 1.56 (1.04, 2.33) | 0.031 | 1.66 (1.03, 2.69) | 0.037 |
| Cataract | ||||||
| No (ref.) | ||||||
| Yes | 1.58 (1.12, 2.21) | 0.008 | 1.18 (0.87, 1.61) | 0.294 | 1.15 (0.80, 1.66) | 0.453 |
| Model 1 | Model 2 | Model 3 | Model 4 | |||||
|---|---|---|---|---|---|---|---|---|
| HR (95% CI) | p-Value | HR (95% CI) | p-Value | HR (95% CI) | p-Value | HR (95% CI) | p-Value | |
| High-level stable group | 1.00 (ref.) | 1.00 (ref.) | 1.00 (ref.) | 1.00 (ref.) | ||||
| Rapid descent group | 7.20 (6.35, 8.17) | <0.001 | 3.92 (3.40, 4.52) | <0.001 | 3.88 (3.36, 4.47) | <0.001 | 3.87 (3.35, 4.48) | <0.001 |
| Slow descent group | 2.03 (1.81, 2.27) | <0.001 | 1.43 (1.27, 1.62) | <0.001 | 1.42 (1.26, 1.61) | <0.001 | 1.41 (1.24, 1.59) | <0.001 |
| Low-level stable group | 2.07 (1.81, 2.36) | <0.001 | 1.40 (1.21, 1.61) | <0.001 | 1.39 (1.20, 1.60) | <0.001 | 1.37 (1.18, 1.58) | <0.001 |
| Cohort | ||||||||
| 2002 (ref.) | ||||||||
| 2005 | 0.79 (0.71, 0.88) | <0.001 | 0.79 (0.71, 0.88) | <0.001 | 0.78 (0.70, 0.87) | <0.001 | ||
| 2008–2009 | 0.82 (0.73, 0.92) | <0.001 | 0.82 (0.73, 0.93) | 0.002 | 0.83 (0.73, 0.94) | 0.002 | ||
| 2011–2012 | 5.08 (1.54, 16.79) | 0.008 | 3.79 (0.90, 15.96) | 0.070 | 3.69 (0.87, 15.59) | 0.076 | ||
| Age | ||||||||
| 65–80 (ref.) | ||||||||
| >80 | 3.01 (2.71, 3.35) | <0.001 | 2.95 (2.65, 3.28) | <0.001 | 2.98 (3.67, 3.32) | <0.001 | ||
| Sex | ||||||||
| Female (ref.) | ||||||||
| Male | 1.58 (1.44, 1.73) | <0.001 | 1.54 (1.39, 1.71) | <0.001 | 1.54 (1.39, 1.72) | <0.001 | ||
| Education | ||||||||
| 0 years (ref.) | ||||||||
| 1–6 years | 0.97 (0.88, 1.07) | 0.561 | 0.98 (0.88, 1.09) | 0.748 | 0.98 (0.88, 1.09) | 0.750 | ||
| 7+ years | 0.81 (0.69, 0.95) | 0.009 | 0.83 (0.70, 0.99) | 0.046 | 0.83 (0.69, 0.99) | 0.044 | ||
| Place of residence | ||||||||
| City (ref.) | ||||||||
| Countryside | 1.02 (0.93, 1.11) | 0.727 | 1.01 (0.92, 1.11) | 0.776 | 1.00 (0.91, 1.11) | 0.897 | ||
| Economic status | ||||||||
| Rich (ref.) | ||||||||
| Ordinal | 0.99 (0.88, 1.10) | 0.789 | 0.98 (0.88, 1.10) | 0.745 | 0.97 (0.86, 1.08) | 0.559 | ||
| Poor | 1.16 (1.01, 1.33) | 0.042 | 1.13 (0.98, 1.31) | 0.086 | 1.10 (0.95, 1.27) | 0.205 | ||
| Marital status | ||||||||
| Without spouse (ref.) | ||||||||
| With spouse | 0.78 (0.71, 0.85) | <0.001 | 0.79 (0.72, 0.87) | <0.001 | 0.79 (0.72, 0.87) | <0.001 | ||
| Smoking | ||||||||
| No (ref.) | ||||||||
| Yes | 1.08 (0.97, 1.19) | 0.157 | 1.08 (0.98, 1.20) | 0.127 | ||||
| Drinking | ||||||||
| No (ref.) | ||||||||
| Yes | 0.98 (0.89, 1.09) | 0.074 | 1.00 (0.91, 1.10) | 0.942 | ||||
| Exercise | ||||||||
| No (ref.) | ||||||||
| Yes | 1.00 (0.91, 1.10) | 0.927 | 0.99 (0.90, 1.09) | 0.840 | ||||
| Garden work | ||||||||
| No (ref.) | ||||||||
| Yes | 0.95 (0.85, 1.07) | 0.415 | 0.94 (0.84, 1.06) | 0.345 | ||||
| Read newspapers/books | ||||||||
| No (ref.) | ||||||||
| Yes | 0.99 (0.88, 1.12) | 0.900 | 1.00 (0.88, 1.13) | 0.954 | ||||
| Raise domestic animals | ||||||||
| No (ref.) | ||||||||
| Yes | 0.94 (0.86, 1.02) | 0.141 | 0.95 (0.87, 1.04) | 0.296 | ||||
| Play cards/mahjong | ||||||||
| No (ref.) | ||||||||
| Yes | 1.10 (0.99, 1.21) | 0.073 | 1.09 (0.98, 1.20) | 0.113 | ||||
| Watch TV/listen to radio | ||||||||
| No (ref.) | ||||||||
| Yes | 0.86 (0.78, 0.95) | 0.004 | 0.86 (0.77, 0.95) | 0.003 | ||||
| Social activities | ||||||||
| No (ref.) | ||||||||
| Yes | 0.93 (0.83, 1.04) | 0.198 | 0.92 (0.82, 1.03) | 0.152 | ||||
| Physical labor regularly | ||||||||
| No (ref.) | ||||||||
| Yes | 0.99 (0.87, 1.12) | 0.879 | 0.98 (0.87, 1.12) | 0.800 | ||||
| Hypertension | ||||||||
| No (ref.) | ||||||||
| Yes | 1.07 (0.96, 1.20) | 0.224 | ||||||
| Diabetes | ||||||||
| No (ref.) | ||||||||
| Yes | 1.01 (0.73, 1.38) | 0.964 | ||||||
| Stroke/CVD | ||||||||
| No (ref.) | ||||||||
| Yes | 1.42 (1.17, 1.72) | <0.001 | ||||||
| Cataract | ||||||||
| No (ref.) | ||||||||
| Yes | 1.02 (0.88, 1.19) | 0.774 |
Disclaimer/Publisher’s Note: The statements, opinions and data contained in all publications are solely those of the individual author(s) and contributor(s) and not of MDPI and/or the editor(s). MDPI and/or the editor(s) disclaim responsibility for any injury to people or property resulting from any ideas, methods, instructions or products referred to in the content. |
© 2025 by the authors. Licensee MDPI, Basel, Switzerland. This article is an open access article distributed under the terms and conditions of the Creative Commons Attribution (CC BY) license (https://creativecommons.org/licenses/by/4.0/).
Share and Cite
Wei, Y.; Zhang, Y.; Li, Y.; Meng, F.; Zhang, R.; You, Z.; Xie, C.; Zhou, J. Trajectories of Cognitive Change and Their Association with All-Cause Mortality Among Chinese Older Adults: Results from the Chinese Longitudinal Healthy Longevity Survey. Behav. Sci. 2025, 15, 365. https://doi.org/10.3390/bs15030365
Wei Y, Zhang Y, Li Y, Meng F, Zhang R, You Z, Xie C, Zhou J. Trajectories of Cognitive Change and Their Association with All-Cause Mortality Among Chinese Older Adults: Results from the Chinese Longitudinal Healthy Longevity Survey. Behavioral Sciences. 2025; 15(3):365. https://doi.org/10.3390/bs15030365
Chicago/Turabian StyleWei, Yifang, Yi Zhang, Yuansheng Li, Fanshuo Meng, Ruixiang Zhang, Zuming You, Chenxi Xie, and Jiyuan Zhou. 2025. "Trajectories of Cognitive Change and Their Association with All-Cause Mortality Among Chinese Older Adults: Results from the Chinese Longitudinal Healthy Longevity Survey" Behavioral Sciences 15, no. 3: 365. https://doi.org/10.3390/bs15030365
APA StyleWei, Y., Zhang, Y., Li, Y., Meng, F., Zhang, R., You, Z., Xie, C., & Zhou, J. (2025). Trajectories of Cognitive Change and Their Association with All-Cause Mortality Among Chinese Older Adults: Results from the Chinese Longitudinal Healthy Longevity Survey. Behavioral Sciences, 15(3), 365. https://doi.org/10.3390/bs15030365