Article

Analyzing the Effect of Factors on Individuals’ Subjective Well-Being with Quantile Bayesian Structural Equation Modeling Approach

by
Zübeyde Çiçek
1,* and
Nuran Bayram Arlı
2
1
Department of Statistics, Faculty of Engineering and Natural Sciences, Suleyman Demirel University, Isparta 32200, Türkiye
2
Department of Econometrics, Faculty of Economics and Administrative Sciences, Bursa Uludag University, Bursa 16059, Türkiye
*
Author to whom correspondence should be addressed.
Behav. Sci. 2024, 14(12), 1170; https://doi.org/10.3390/bs14121170
Submission received: 3 October 2024 / Revised: 30 November 2024 / Accepted: 4 December 2024 / Published: 6 December 2024
(This article belongs to the Section Social Psychology)

Abstract

:
This study investigates factors influencing individuals’ levels of subjective well-being by examining fundamental variables, called life domains, such as satisfaction with health, education, marriage, housing district, work life, social life, relationships, and public services. The aim is to understand how these domains affect various quantile values of subjective well-being. To achieve this, the Life Satisfaction Survey dataset for 2020, obtained from the Turkish Statistical Institute, was utilized, and Bayesian Quantile Structural Equation Modeling and Bayesian Structural Equation Modeling methods were applied. The empirical study indicates that all life domains were found to have a positive impact on subjective well-being, except for housing-district satisfaction and education satisfaction. In particular, for individuals with low subjective well-being, satisfaction with work life, relationships, and public services has a stronger effect on subjective well-being compared to those in higher quantiles. Conversely, marriage satisfaction has a stronger effect on subjective well-being among individuals in the higher quantiles. This study’s unique contribution is that examining subjective well-being according to quantile values provides detailed information on how the factors influencing individuals’ subjective well-being vary across different levels.

1. Introduction

Studies on subjective well-being’s presence, causes, and connections are rapidly increasing, garnering significant interest across various disciplines. Major disciplines that investigate subjective well-being include psychology, political science, economics, health science, education science, and social sciences [1,2,3,4,5,6]. Research conducted in these disciplines focuses on different dimensions of subjective well-being, providing essential information to improve human well-being and to make effective decisions for policymakers. For example, while psychology research examines individuals’ emotional states and personal happiness levels and attempts to understand the psychological factors that affect subjective well-being, economics research analyzes the relationship between individuals’ income levels and subjective well-being [7,8,9,10]. The effect of physical and mental health on subjective well-being is investigated in the field of health [11,12]. Studies in education examine the contributions of individuals’ educational levels and educational systems to subjective well-being; research in social sciences analyzes the effects of social activities, social relations, and social structure on subjective well-being [1,13,14,15,16]. All these studies provide crucial data for understanding and improving subjective well-being. However, more research is needed to gain a more comprehensive and in-depth understanding of subjective well-being. Research on subjective well-being provides essential clues for developing strategies that play a critical role in increasing the overall welfare of societies, and the implementation of these strategies is crucial for enhancing societal well-being.
The literature defines subjective well-being, happiness, life satisfaction, and quality of life concepts in very different ways. In some sources, these concepts have the same meaning, while in others, they are defined as subcomponents of each other [14,17]. Although there are studies showing that the concept of subjective well-being is used instead of quality of life, the lack of a full consensus in the literature on this significant subject underscores its importance. However, Diener [4] states that subjective well-being is a broader phenomenon that includes quality of life. In this context, subjective well-being can be described as a multidimensional concept that provides for overall life satisfaction, positive and negative emotional experiences, and the general quality of life.
To explain life satisfaction, happiness, and subjective well-being, which are concepts that are often used interchangeably, individuals’ objective conditions or subjective satisfaction variables are considered. Many studies in the literature are based on the approach that life satisfaction is primarily determined by objective conditions such as income, health, age, and education [1,14,18] etc. These factors are objective elements that are not shaped by individuals’ perceptions. In contrast, the second approach bases its explanation on satisfaction in different domains of life. This approach argues that individuals’ satisfaction levels are based on their personal perceptions, expectations, and values. These elements express individuals’ satisfaction in different domains of life, such as health satisfaction, financial satisfaction, job satisfaction, and marriage satisfaction, and are considered subjectively [19,20,21,22,23] etc. One of the limited studies in this field, by van Praag, Frijters, and Ferrer-i-Carbonell [24], provides a comprehensive analysis of the factors influencing general satisfaction, using German panel data from the years 1992 to 1997. The authors investigate various life domains, such as health, financial, job, leisure, housing, and environmental satisfaction, to understand their impact on individual general satisfaction. Additionally, the effects of objective factors such as age, income, gender, and education on individuals’ satisfaction levels across different life domains have been examined. Similarly, Easterlin and Swanga [25] examine the relationship between happiness and satisfaction across various life domains, using data from the General Social Survey for the years 1973 and 1994 in the United States. Their research analyzes the effects of the objective conditions (age, education, etc.) that influence individuals’ happiness and satisfaction levels, along with satisfaction levels in various life areas, including financial situation, family life, job, and health, on overall happiness.
In the context of similar studies conducted in Türkiye, the Turkish Life Satisfaction Survey (TLSS) is the most widely utilized data source, including in the present study. This survey offers a comprehensive dataset for analyzing subjective well-being across various life domains. For instance, Köksal, Uçak, and Şahin [26] examined the impact of satisfaction in diverse life domains on happiness at the micro level, using data from the 2008–2012 TLSS. Their analysis consistently identified income, marriage, and health satisfaction as the top predictors of happiness over the years. Similarly, Eren and Aşıcı [27] employed TLSS data from 2004 to 2013 to explain happiness through both objective and subjective indicators, such as income and job satisfaction. More recently, Güzel and Görmüş [28] utilized data from the 2019 TLSS to investigate the relationship between happiness and various satisfaction indicators. Their findings revealed that all factors, with the exception of education satisfaction, had a positive impact on happiness, including satisfaction with health, marital life, income, and other domains. Furthermore, Çakmak and Emirhan [29] used microdata from the 2014–2017 TLSS to investigate overall life satisfaction through six different domains, highlighting the significant influence of financial and marriage satisfaction, while also analyzing the effects of objective indicators such as gender and education on satisfaction levels.
As previously noted, despite the interchangeable use of terms like happiness, overall life satisfaction, and subjective well-being, it is essential to elucidate the concept of subjective well-being, which is central to our study. Subjective well-being consists of three subcomponents: life satisfaction, positive affect, and negative affect. While life satisfaction constitutes the cognitive component, the positive-negative affect component constitutes the affective component [14,30]. Life satisfaction, the cognitive component, refers to how individuals evaluate their lives as a whole. The affective component addresses whether individuals experience positive or negative moods. On the other hand, quality of life is generally expressed as ‘objective’ and describes a person’s living conditions rather than their response to these conditions [4]. According to many studies conducted since the 1980s, subjective well-being has been shown to consist of a cognitive component (life satisfaction) and an affective factor (happiness) [18,19,30]. Happiness has various definitions in literature and popular culture. It can refer to a positive mood at any given moment, living a good life, a general evaluation of life satisfaction, or the reasons that make a person happy. Therefore, some researchers prefer words with more specific meanings instead of using this term in its simple form. On the other hand, life satisfaction shows how an individual evaluates their life as a whole [4,30].
Among these scales, those developed by Diener [31] and Emmons and Diener [30], which have been validated in different languages, stand out and are widely used in various studies (for example, see [32,33,34,35,36]). In addition, subjective well-being can be measured with general satisfaction and happiness questions, as used in the World Values Survey [37]. Therefore, many studies in the literature explain the concept of subjective well-being with the concepts of life satisfaction and happiness (for example, see [5,7,38,39]). For instance, Lin and Yeh [40] used the Satisfaction with Life Scale [41] and the Long Term Affect Scale [42] in their study to measure well-being. In this context, measuring subjective well-being requires considering a latent variable structure. Therefore, the use of Structural Equation Modeling (SEM) instead of classical regression models has become more popular in the literature over time in explaining subjective well-being. Whether classical regression or SEM, results are obtained through the mean value. On the other hand, researchers use quantile regression analysis to measure the effects of explanatory variables at different quantile levels of subjective well-being. For example, as stated in Binder and Coad [43], income, health, social index, and education variables have been found to have a more substantial effect on life satisfaction at lower quantile levels. Similarly, Yuan and Golpelwar [44] tested the effects of the four domains of Social Quality—socioeconomic security, social inclusion, social cohesion, and social empowerment—on subjective well-being at different quantile values. Additionally, Neira et al. [39] examined the effects of different dimensions of social capital on individual-level subjective well-being.
However, although the quantile regression approach has found its place in the literature, it is essential to consider the SEM structure in this context. Indeed, a new group of studies in the psychology literature has started to use the quantile approach within the SEM framework, although in different fields. For example, in the study conducted by Zhang and Tang [45] using the World Values Survey data, they interpreted the latent variables of job satisfaction and religious belief, which are thought to affect life satisfaction, for different quantile values of life satisfaction. Similarly, in the study by Yazdi et al. [46], they used the Bayesian Quantile Structural Equation Modeling (BQSEM) method to analyze a psychological problems profile obtained through scales containing latent variables. They examined the effects of socioeconomic and personal stress on the psychological problems profile at different quantile values.
In studies examining the impact of different satisfaction domains on subjective well-being, general life satisfaction, or happiness, regression, logit, or probit models are typically employed for statistical analysis [2,24,25,26,27,28,29]. The existing literature has largely focused on investigating the effects of individual life domains on subjective well-being, life satisfaction, or happiness separately. In contrast, our research takes a different approach by utilizing latent variables to group similar factors, allowing for an examination of their combined effect on subjective well-being. To extend the literature, we employed a Quantile Structural Equation Model (QSEM) to assess how satisfaction in various domains affects subjective well-being across different quantile levels. This introduces a key question for discussion: How do the effects of different satisfaction domains on subjective well-being vary across each quantile level?
To address this, our study used life satisfaction and happiness variables from the Turkish Statistical Institute’s (TURKSTAT) 2020 Life Satisfaction Survey (LSS) dataset, making it the first study in the literature to apply the QSEM approach in this context. The findings offer valuable insights into the factors influencing individuals’ subjective well-being at various quantile levels and contribute to strategies for enhancing overall quality of life. The remainder of the study is organized as follows: the second section details the methodology, the third section presents and interprets the results from Bayesian Structural Equation Modeling (BSEM) and BQSEM using the WinBUGS (Windows version of Bayesian inference Using Gibbs Sampling) and R programs, and the final section concludes with a discussion and conclusion.

2. Materials and Methods

2.1. Study Sample

The purpose of the LSS, which has been regularly conducted by TURKSTAT every year since 2003, is to measure individuals’ perceptions of happiness and their general satisfaction levels in public and basic life areas [47]. This study utilizes the 2020 Türkiye LSS micro dataset obtained from TURKSTAT. Given the analysis of work life satisfaction, the estimates are restricted to working individuals. Additionally, only married individuals were included in the analysis for the marriage satisfaction variable. After performing necessary adjustments, the final sample consists of 2426 individuals.

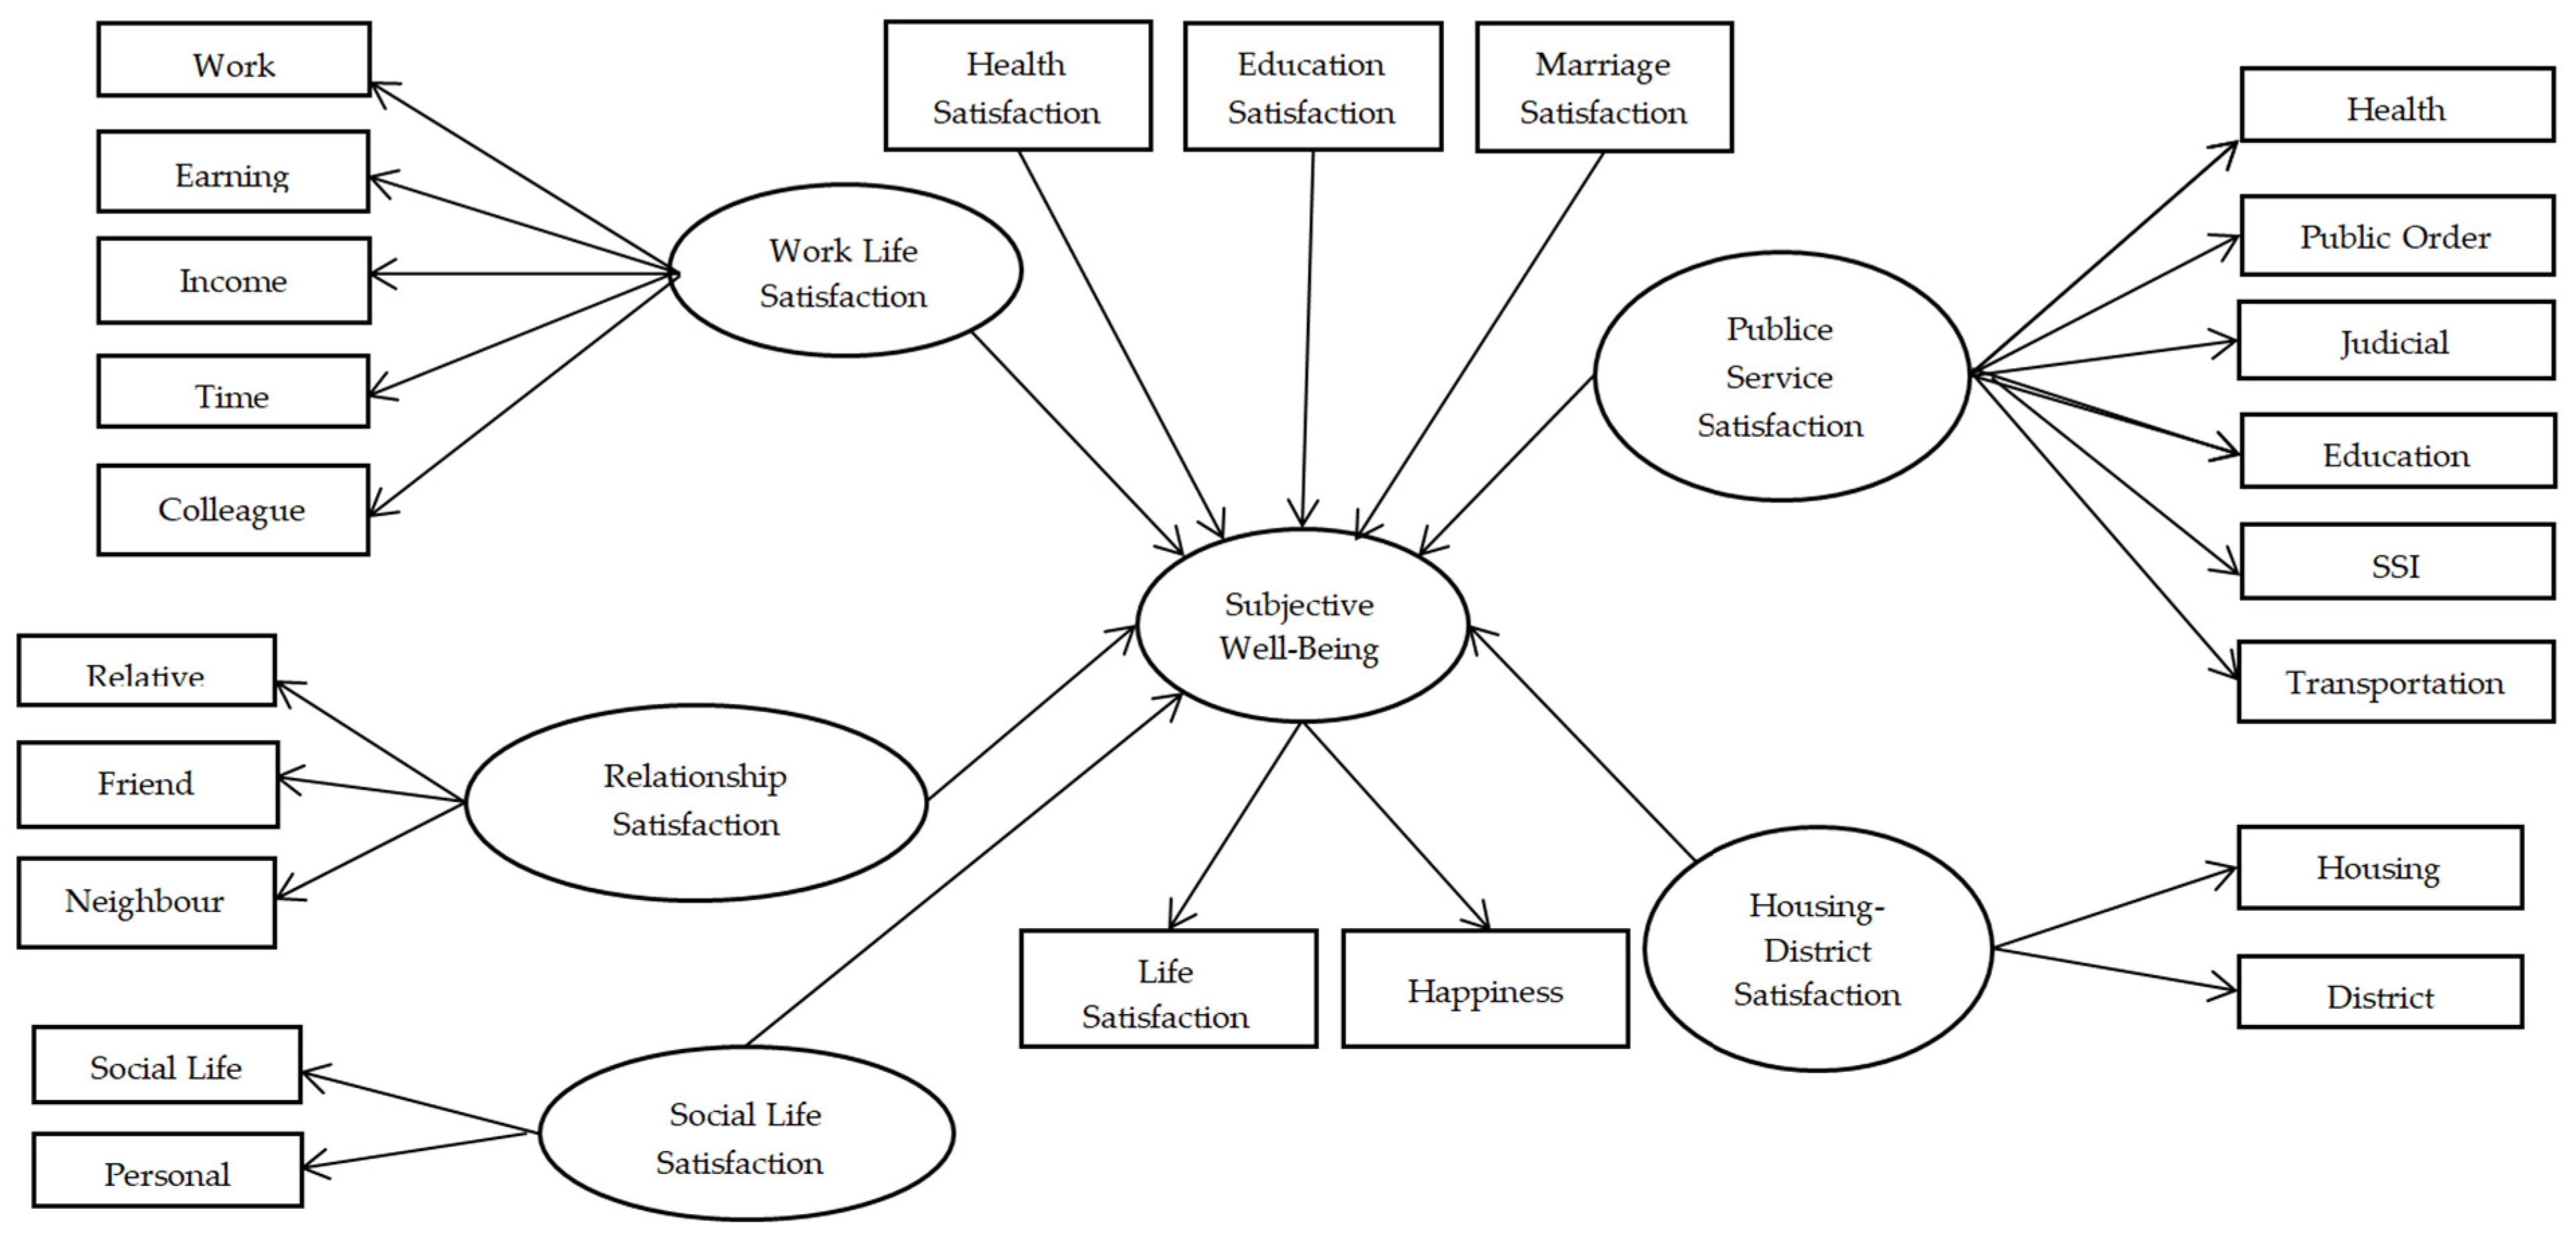
2.2. Variable Description

The concept of subjective well-being is considered an endogenous variable in the study. The happiness (y1) and life satisfaction (y2) variables, which are included in the dataset of the LSS, constitute the latent variable “Subjective Well-Being” (η).
Latent variables and observed variables explaining these latent variables utilized in this study are presented in Table 1 with the questions in the survey.
Housing (y3) and District (y4) satisfactions that are included in the LSS constitute the “Housing-District Satisfaction” (ξ1) exogenous variable, Work (y5), Earning (y6), Income (y7), Time (y8), and Colleague (y9) satisfactions constitute the “Work Life Satisfaction” (ξ2) exogenous variable, and Social Life (y10) and Personal Time (y11) satisfactions constitute the “Social Life Satisfaction” (ξ3) exogenous variable. In addition, the satisfaction of Relative (y12), Friend (y13), and Neighbor (y14) constitutes the “Relationship Satisfaction” (ξ4) exogenous variable; satisfaction with “Health” (y15), “Public Order” (y16), “Judicial” (y17), “Education” (y18), “Social Security Institution (SSI)” (y19), and “Transportation” (y20) constitute the “Public Service Satisfaction” (ξ5) exogenous variable. “Health Satisfaction” (d1), “Education Satisfaction” (d2), and “Marriage Satisfaction” (d3) have been added to the model as a covariate variable. The research model indicating the structure between latent variables is given in Figure 1.
This study examined the factors affecting individuals’ subjective well-being levels comprehensively. Subjective well-being is a concept that expresses individuals’ satisfaction with their lives and their general level of happiness. This study analyzed the effects of various life domains such as health satisfaction, education satisfaction, marriage satisfaction, housing-district satisfaction, work life satisfaction, social life satisfaction, relationship satisfaction, and public policy satisfaction on individuals’ subjective well-being. The following hypotheses form the basis of this study. They are tested to understand the effects of individuals’ satisfaction in different areas of their lives on subjective well-being.
Hypothesis 1 (H1):
There is a positive effect of health satisfaction on subjective well-being.
Hypothesis 2 (H2):
There is a positive effect of education satisfaction on subjective well-being.
Hypothesis 3 (H3):
There is a positive effect of marriage satisfaction on subjective well-being.
Hypothesis 4 (H4):
There is a positive effect of housing-district satisfaction on subjective well-being.
Hypothesis 5 (H5):
There is a positive effect of work life satisfaction on subjective well-being.
Hypothesis 6 (H6):
There is a positive effect of social life satisfaction on subjective well-being.
Hypothesis 7 (H7):
There is a positive effect of relationship satisfaction on subjective well-being.
Hypothesis 8 (H8):
There is a positive effect of public policy satisfaction on subjective well-being.

2.3. Statistical Methods

The classical SEM includes measurement equations to explain latent variables by utilizing more than one observed variable. Furthermore, structural equations which are essentially regression models based on the mean have been used to investigate how exogenous latent variables affect the outcomes of interest. In other words, the classical SEM does not merely provide a comprehensive analysis of the relationship between latent variables since it is built solely on the mean value. In QSEM, conditional quantile values of the endogenous latent variable are examined when exogenous latent variables and covariate variables are considered. Thus, the effect of exogenous variables can be compared for each level of the endogenous latent variable [48,49].
Where yi = (yi1, …, yip)T (p × 1) represents the i observed variables vector with a sample size of n, and ωi = (ωi1, …, ωiq)T (q × 1) (q < p) represents the latent variables vector with a dimension, the measurement model showing the relationship between yi and ωi is as follows:
y i = A c i + Λ ω i + ε i
Here, Α (p × r1) and Λ (p × q) are the unknown coefficients matrix, ci (r1 × 1) is the fixed variables vector, and εi (p × 1) is the error terms vector. In Equation (1), ωi = (ηiT, ξiT)T, ηi is the (q1 × 1) dimensional endogenous latent variables vector, and ξi is the (q2 × 1) dimensional exogenous latent variables vector. The primary objective of SEMs is to analyze the variability of ηi given the information contained in ξi. In classical SEM, when ηi, ξi, and the control variable di (r2 × 1) are given, the conditional mean of ηi is as follows.
E η İ | ξ i ,   d i = Β d i + Γ ξ i
Here, Β (q1 × r2) and Γ (q1 × q2) are the matrices of estimated unknown coefficients. This conditional mean does not provide a comprehensive description of the relationship between latent variables. To obtain a more comprehensive result, the conditional quantile values of ηi for different quantile (τ) values (0 < τ < 1) can be considered. The conditional quantile value θτii, di) is:
θ τ η i | ξ i , d i = Β τ d i + Γ τ ξ i
Here, the values of Βτ and Γτ are obtained differently for each quantile value. Thus, the structural model for QSEM is obtained as follows:
η i = Β τ d i + Γ τ ξ i + δ i
The measurement model equation defining QSEM is provided in Equation (1), and the structural model is given in Equation (4). Unlike the classical SEM, the distribution of δi is not specified in QSEM. The only assumption in QSEM is that the τ-quantile of the δi value is 0 to ensure the validity of Equation (4). While the structural model varies for different quantile values, the measurement model is limited to the median value. This is because the primary purpose of the measurement model is to link the observed variables with the latent factors; thus, quantile regression is meaningless in this context [45,49,50].
In conclusion, while the measurement model in QSEM is limited to the median regression model, the structural model can be constructed for different quantile values. Thus, QSEM provides more comprehensive results than classical SEM. In this study, the Bayesian estimation method, frequently preferred in the literature, was used for QSEM estimation. The Bayesian estimations conducted in this study were performed using the methodology and estimation methods developed by Wang in 2016 (see [50]).
The measurement equation of the model established with the observed variables Y = (y1, y2, …, y20)T of the research model shown in Figure 1 is y i = Λ ω i + ε i . Here, ωi = (η1, ξ1, ξ2, ξ3, ξ4, ξ5)T represents the latent variable and Λ denotes the factor loading matrix. η represents the endogenous latent variable, ξ1–ξ6 represents the exogenous latent variables, and d1, d2 and d3 represent the control variables, the structural equation is as follows:
η 1 = b 0 τ + b 1 τ d i 1 + b 2 τ d i 2 + b 3 τ d i 3 + γ 1 τ ξ i 1 + γ 2 τ ξ i 2 + γ 3 τ ξ i 3 + γ 4 τ ξ i 4 + γ 5 τ ξ i 5 + γ 6 τ ξ i 6 + δ i
As a result, the research model given in Figure 1 is parametrized as shown in Figure 2 within the context of the structural equation provided in Equation (5).
Here, b0τ, b1τ, b2τ, b3τ, γ1τ, γ2τ, γ3τ, γ4τ, γ5τ, and γ6τ show the unknown coefficients varying according to τ-quantile values (Figure 2). The quantile values are 5%, 10%, 25%, 50%, 75%, 90%, and 95%.

2.4. Prior Distribution

The prior distributions of the hyperparameters included in the models must be determined through Bayesian analyses. For BQSEM, the prior means of Λyk have a conjugate normal distribution with Λ0yk = 1 ve H0yk matrix with diagonal elements of 10,000. All values of prior means of Λωk are taken as Λ = 1, and the H covariance matrix is also taken as 10,000 times the unit matrix. The other hyperparameters are α0yk = α = 9 and β0yk = β = 4 for the conjugate inverse Gamma distribution of σyk and ση, and ρ0 = 6 and R0 = 15*I5 for the inverse Wishart distribution of Φ. Given the absence of models with latent structures in the Turkish literature on subjective well-being, the standard prior structure typically employed in BQSEM models was applied here to maintain methodological consistency and ensure reliable inference (see, [45,49]). Furthermore, robustness checks were conducted with alternative prior estimates, underscoring the stability and robustness of the chosen prior settings within this modeling framework.

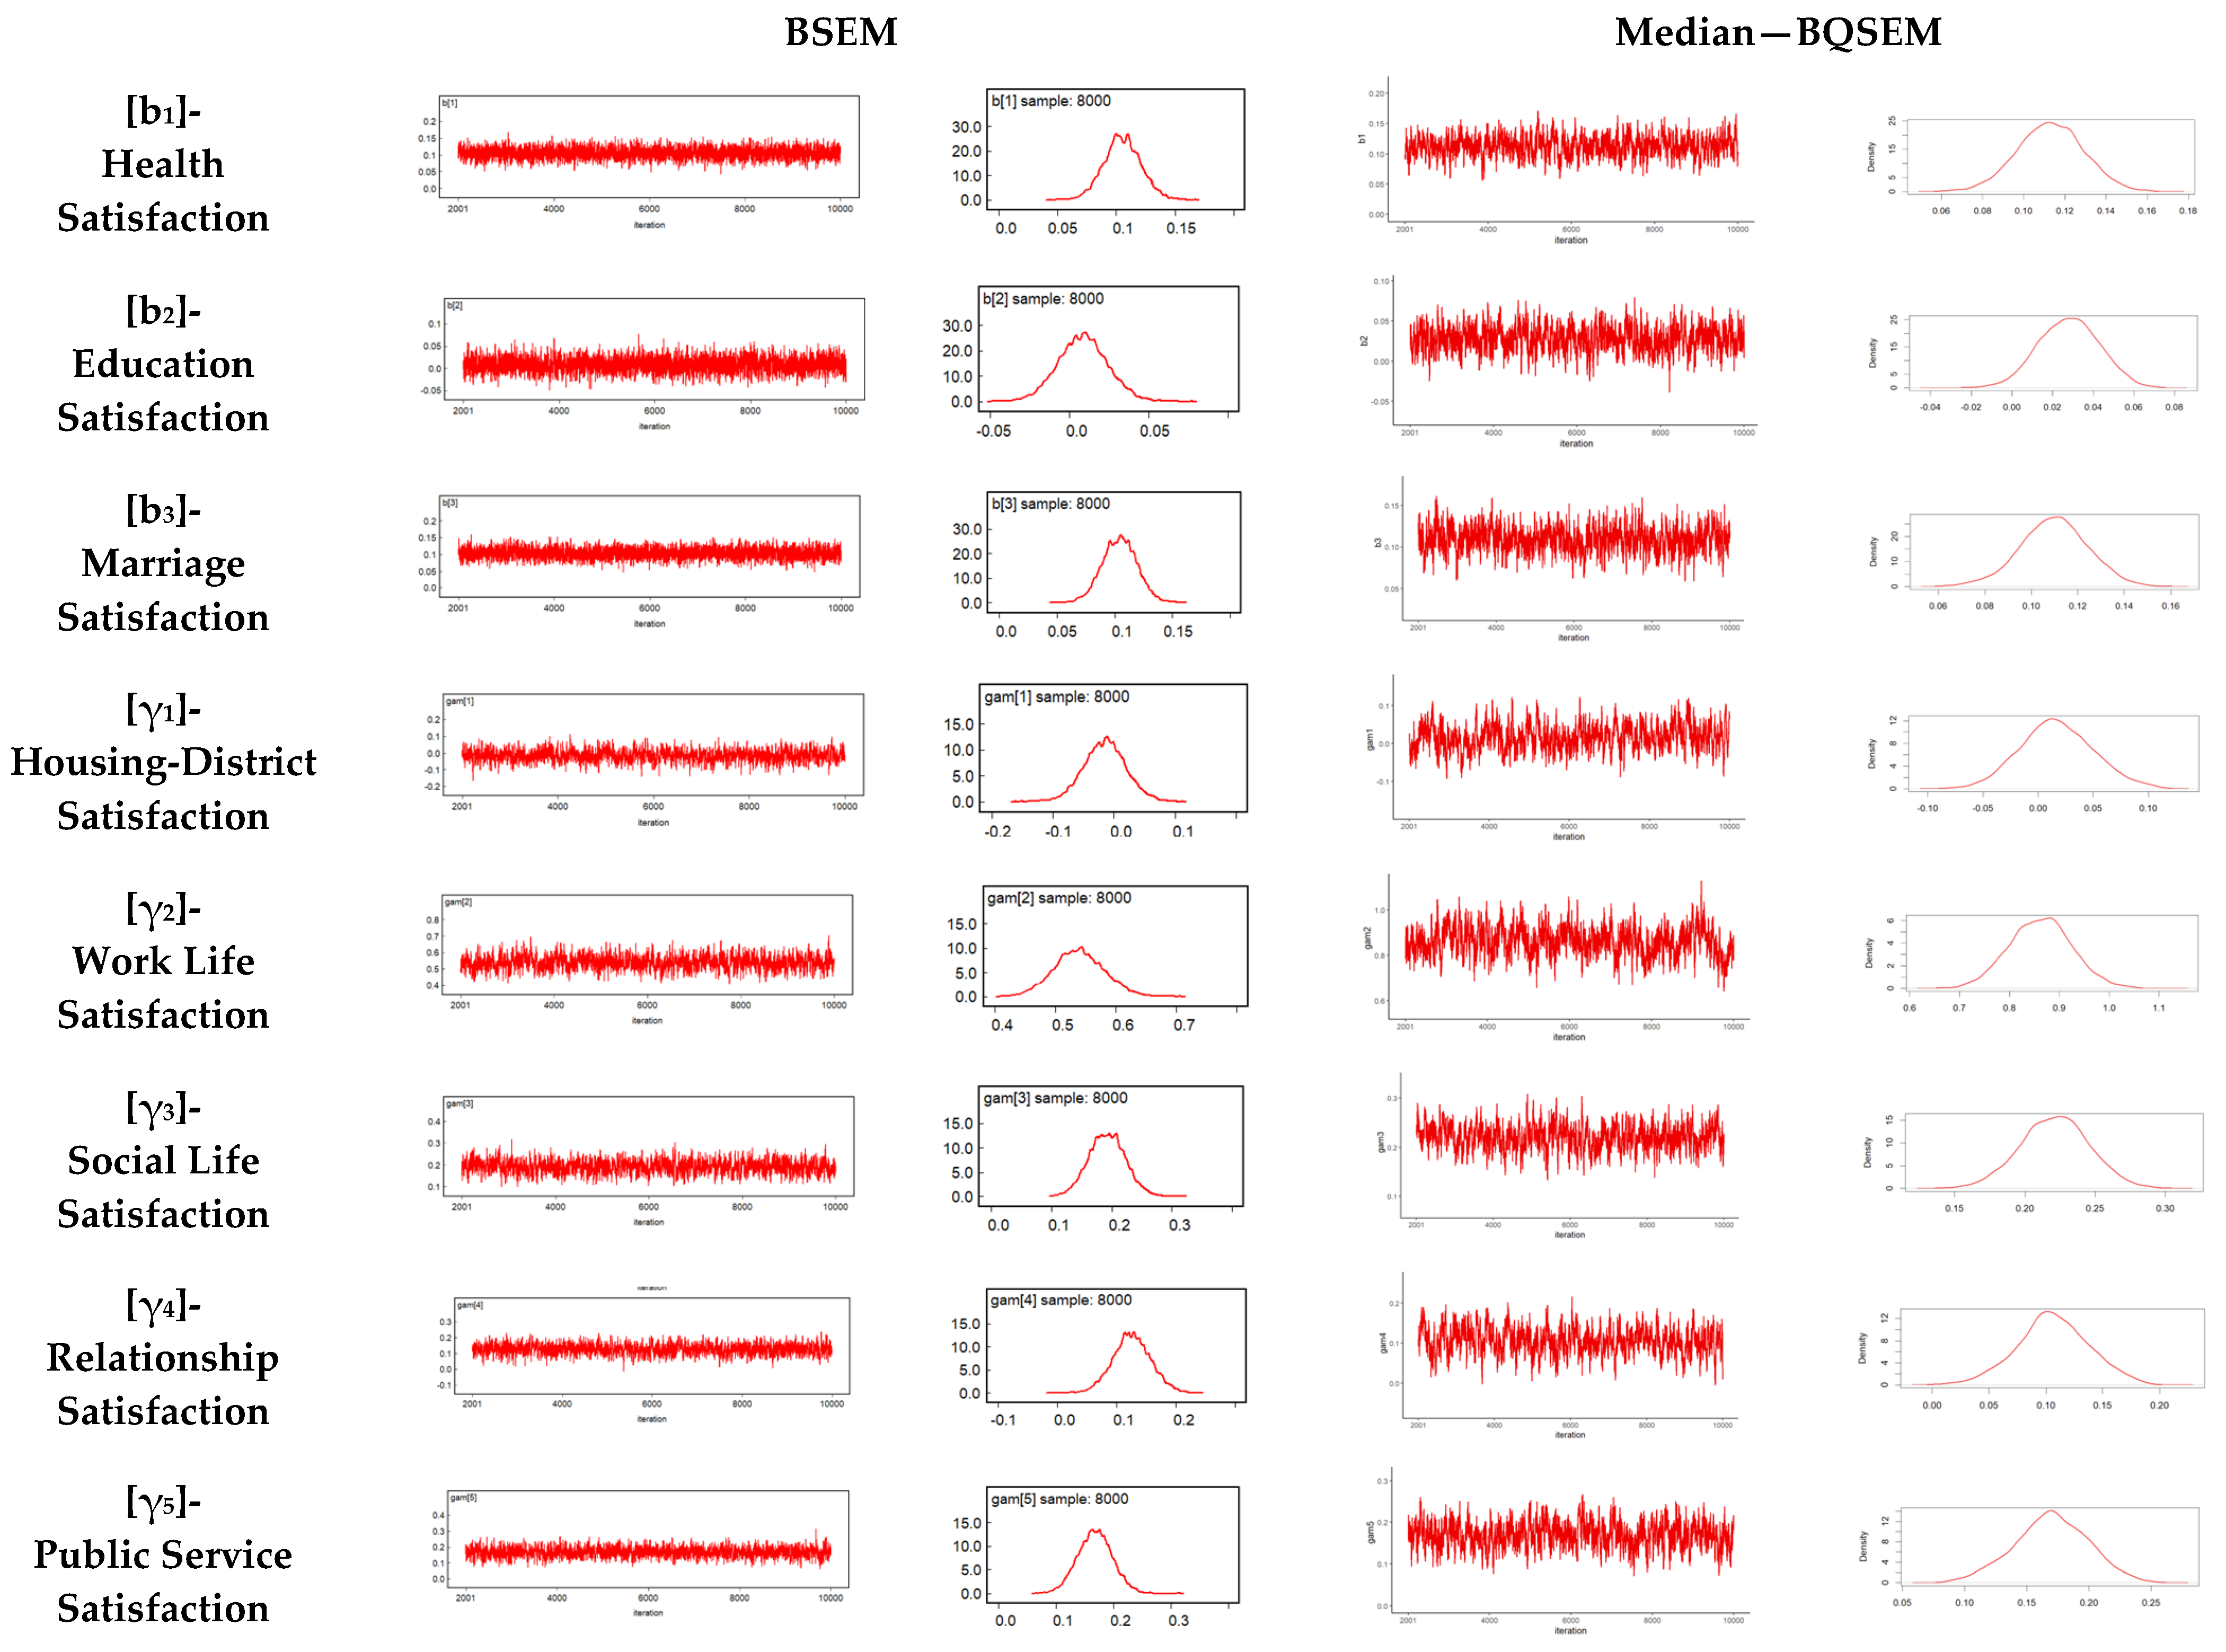
2.5. Determination of Convergence
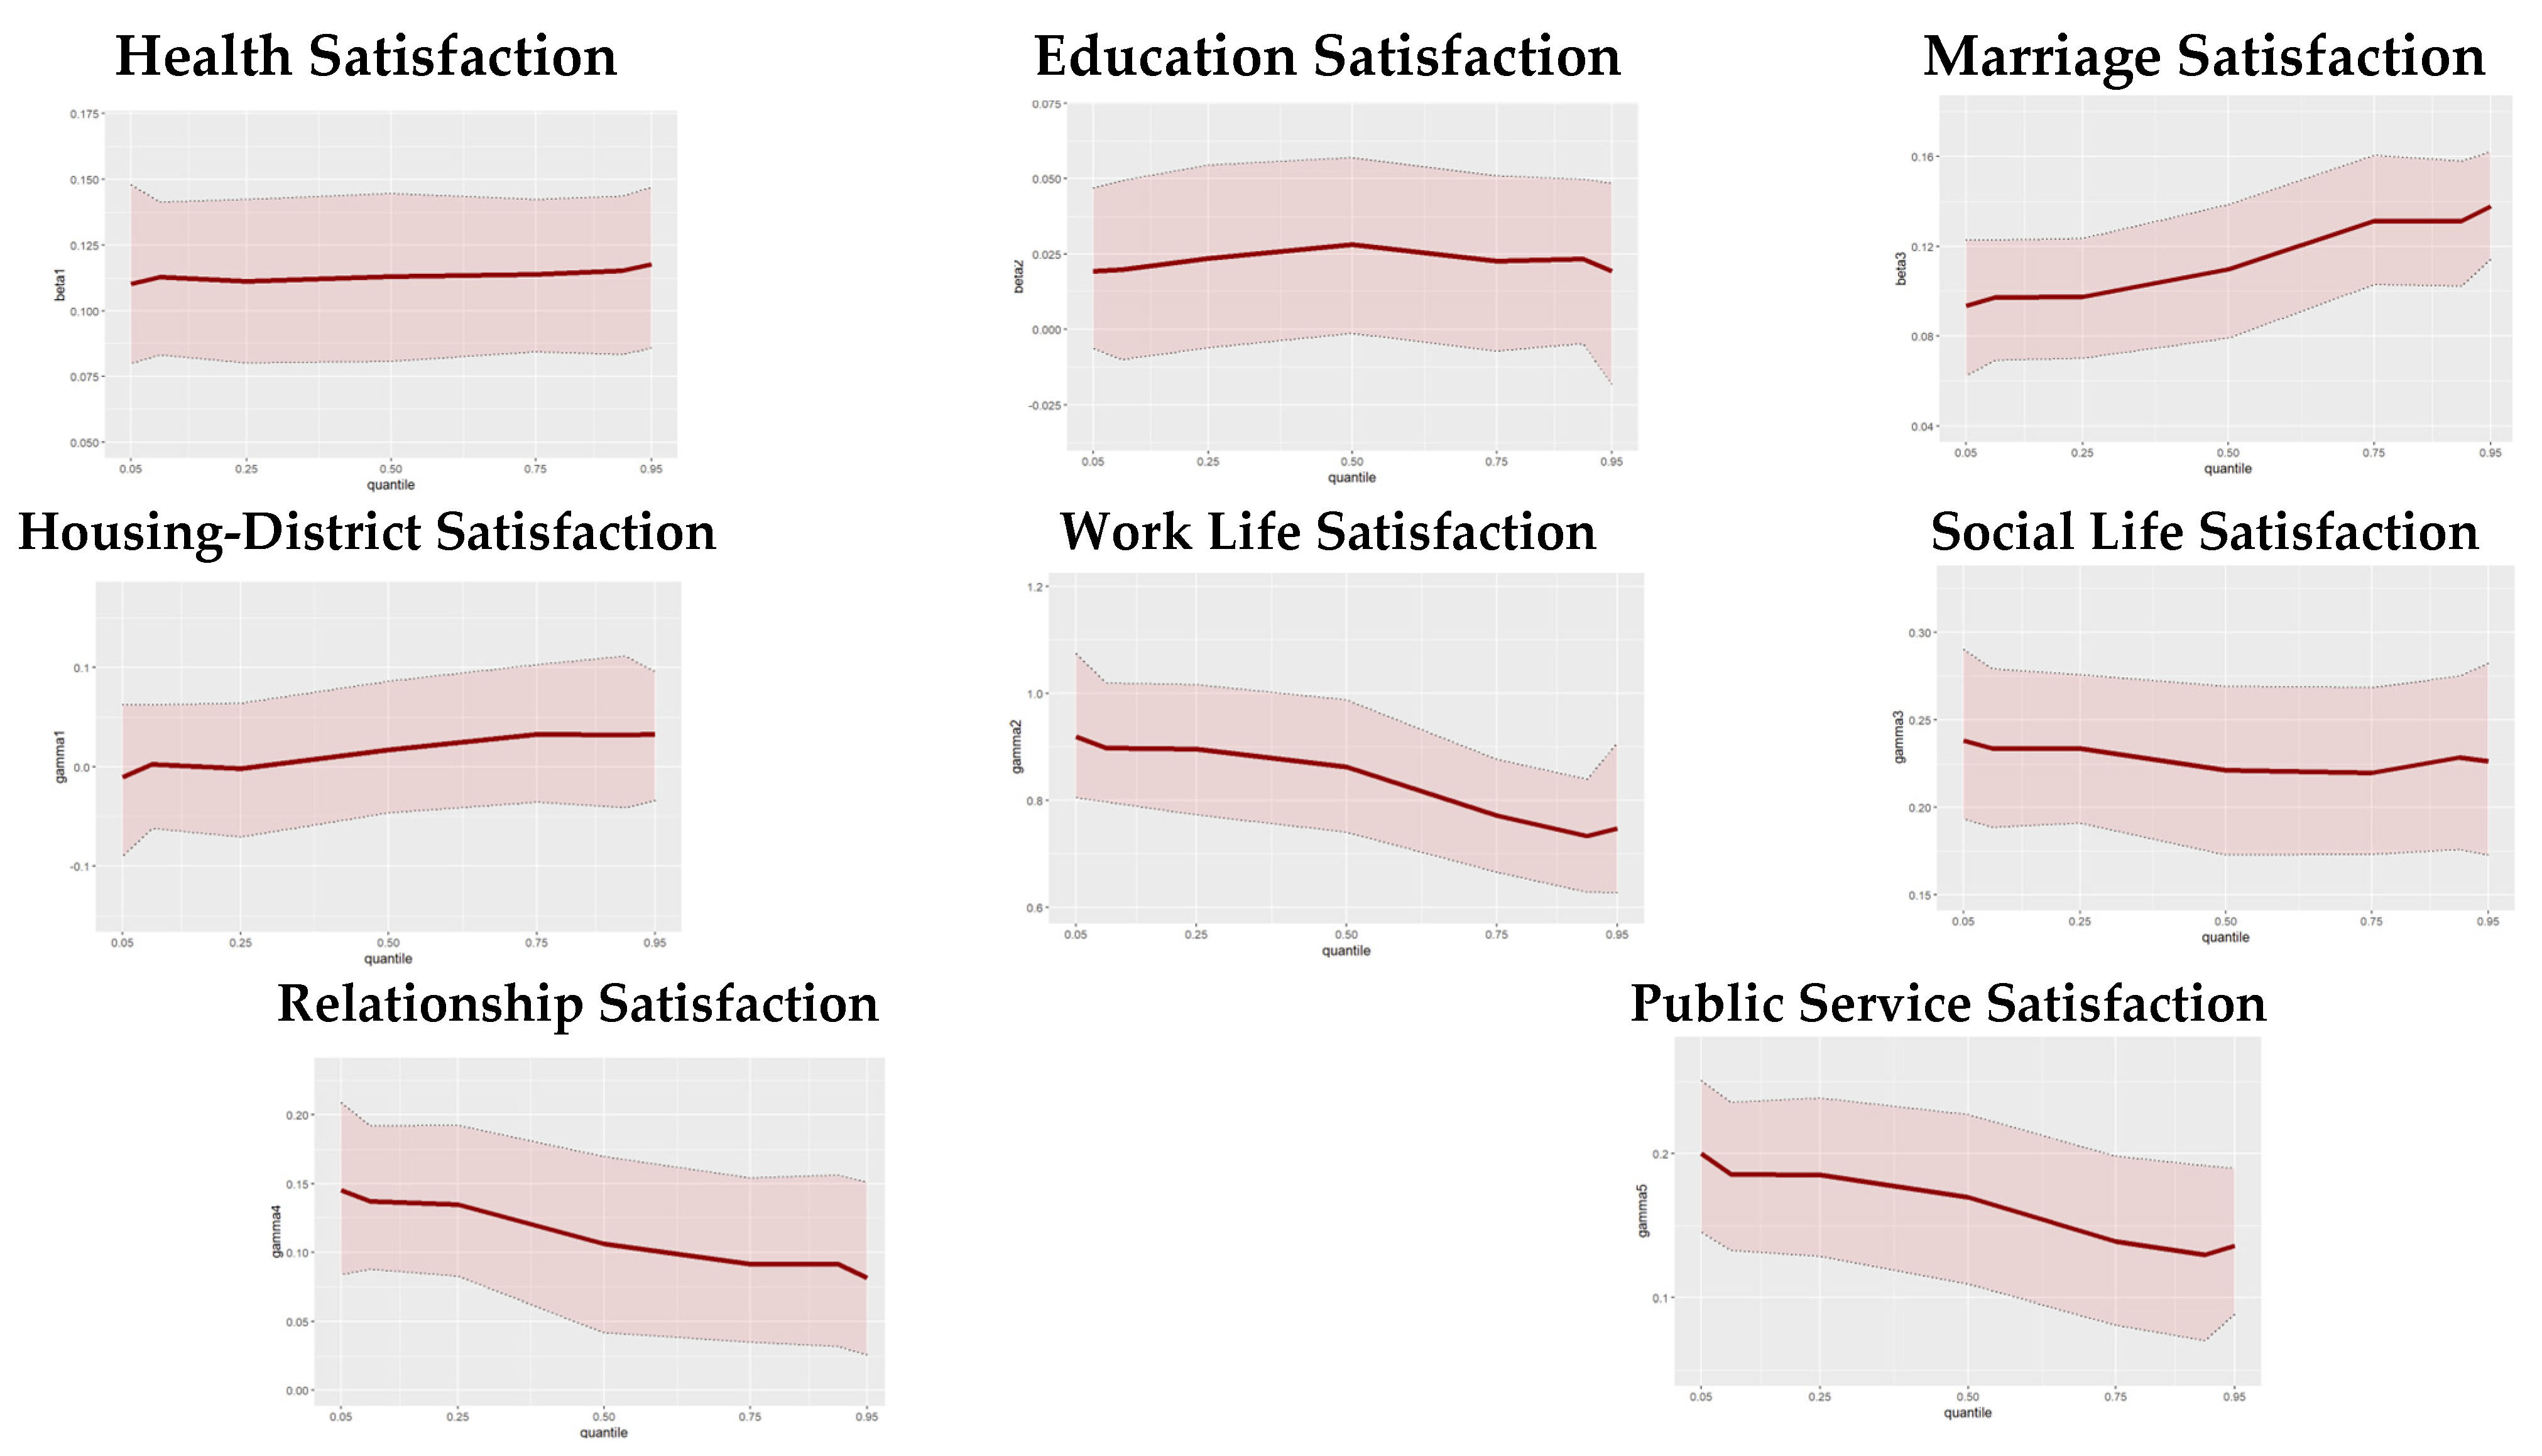
Convergence must be ensured in Bayesian estimation methods to test the consistency of the estimated parameters. Although various techniques are available for this purpose, trace and density plots were used in this study to evaluate Bayesian estimations of both QSEM and classical SEM.
In the application, the posterior distribution was simulated using Gibbs sampling, one of the MCMC methods. Although there are different approaches for choosing the number of chains, a single chain with a high number of iterations was preferred over multiple chains. As a result of the trials for both models, it was observed that the model converged after 10,000 iterations. Thus, it was decided to perform 10,000 iterations for the MCMC simulation. In addition, it was observed that convergence is achieved, and the series becomes stationary, when the first 2000 observations are discarded with a burn-in period for both models. The trace and density plots of the parameters in the structural model after the burn-in period are shown in Figure 3. Only the plots for the median-BQSEM have been displayed, as the results for different quantile values in the BQSEM were very close.
Analyzing the trace and density plots of the estimated parameters obtained after the burn-in period in Median-BQSEM and BSEM shown in Figure 3, it can be seen that the structural model parameters converge to a certain value, and it is observed that all of them show normal distributions when examining the density plots. It was also concluded that the factor loadings for both models converged to a certain value and were typically normally distributed.

3. Results

The mean values, standard deviations, and correlation coefficients for the latent variables in the model are shown in Table 2. The correlation analyses demonstrate that subjective well-being is positively correlated with satisfaction in various life domains, including housing-district satisfaction, work life satisfaction, social life satisfaction, relationship satisfaction, and public service satisfaction. Furthermore, housing-district satisfaction is positively correlated with work life satisfaction, social life satisfaction, relationship satisfaction, and public service satisfaction. Similarly, work life satisfaction shows a positive correlation with social life satisfaction, relationship satisfaction, and public service satisfaction. Social life satisfaction is also positively correlated with relationship satisfaction and public service satisfaction, and relationship satisfaction is positively correlated with public service satisfaction.
At this stage of the study, classical BSEM and BQSEM were applied using similar prior distributions, iteration counts, burn-in periods, and chain numbers. Table 3 presents the unstandardized parameter estimates and credible intervals for BSEM and Median-BQSEM.
Table 3 shows the BQSEM prediction results for the median value (τ = 0.50) and the classical BSEM prediction results. The parameter γ1, representing the latent variable “Housing-District Satisfaction”, and the parameter b3, representing “Education Satisfaction”, are statistically insignificant in both models. All other domain satisfactions are statistically significant. The unstandardized values of the parameter estimates obtained for all quantiles in BQSEM are given in Table 4 together with the BSEM results.
Table 4 shows the factor loadings, structural model coefficients, and covariances between latent variables of BSEM and BQSEM for quantiles 0.05, 0.10, 0.25, 0.50, 0.75, 0.90, and 0.95. Since the posterior predictive p-value (PPP) goodness of fit values are around 0.664–0.675 in these seven quantile models, the models are found to be at an acceptable fit level.
As seen in Table 4, health satisfaction positively affects subjective well-being. No significant differences were observed across quantile levels. Additionally, marriage satisfaction has a positive effect on subjective well-being, with this effect being greater at higher levels of subjective well-being and smaller at lower levels. In contrast, the effects of housing-district satisfaction and educational satisfaction on subjective well-being were not found to be statistically significant in any of the BSEM or BQSEM models.
Satisfaction with work life was found to have a significant and positive effect on subjective well-being. When examined according to quantile levels, differences in the effect levels were observed. The effect of work life satisfaction on subjective well-being is higher for individuals with lower levels of subjective well-being, whereas this effect is lower for those with higher levels. Social life satisfaction also positively influences subjective well-being, as indicated by both BSEM and BQSEM results, where the coefficients obtained are quite close to each other, suggesting that satisfaction with social life affects subjective well-being at similar levels across quantile levels. Furthermore, relationship satisfaction was found to affect subjective well-being positively. It has been found that, at the 5%, 10%, and 25% quantile levels, meaning for those with low subjective well-being, relationship satisfaction affects their subjective well-being levels more. As the level of subjective well-being increases (quantile value increases), the effect of relationship satisfaction on subjective well-being decreases. Finally, satisfaction with public services positively affects subjective well-being, with its effect also decreasing as the quantile value increases, similar to relationship satisfaction.
The estimates of the parameters b, b, b, b, γ, γ, γ, γ, and γ obtained in the structural model according to each quantile value are given in Figure 4 with their credible intervals. Marriage satisfaction shows an upward trend, with a stronger effect at higher quantiles, while work life satisfaction, relationship satisfaction, and public services satisfaction show decreasing effects, indicating greater relevance for individuals at lower quantiles. In contrast, health satisfaction remains relatively stable with small fluctuations, while education satisfaction and housing-district satisfaction exhibit statistically insignificant effects across all quantiles. These patterns highlight the importance of quantile analyses, which show how certain domains affect subjective well-being differently across the distribution and provide deeper insights beyond mean-based models.

4. Discussion

In this study, the BSEM and BQSEM analyses examine the relationship between subjective well-being and different life domains, analyzing the factors affecting individuals’ subjective well-being in Türkiye. In addition, the analyses conducted for each quantile level examine how these satisfaction elements affect subjective well-being and the differences between individuals with low and high subjective well-being. The findings indicate that satisfaction with health, education, marriage, work life, social life, relationships, and public service positively affects subjective well-being. The main results obtained can be summarized as follows (Table 4):
Health satisfaction has a positive effect on subjective well-being and does not change significantly across quantile levels. In other words, individuals with both low and high levels of subjective well-being exhibit similar levels of health satisfaction. The stable relationship found here supports the notion that health satisfaction is a foundational element of overall happiness, reinforcing its critical role in promoting subjective well-being. Studies conducted in Türkiye also confirm this positive relationship between health satisfaction and both happiness and general satisfaction [26,28,29]. Moreover, findings from international literature further support this conclusion [24,25], underscoring the universal importance of health satisfaction in influencing subjective well-being.
The effect of education satisfaction on subjective well-being was found to be statistically insignificant in both the quantile model and the classical model. The literature shows mixed findings, with some studies identifying a strong relationship between education and subjective well-being, while others do not demonstrate a clear connection. Studies that have proven a positive relationship between education and subjective well-being include: [13,16,51,52,53,54,55]. In the national literature, however, both negative effects of education on happiness [56,57] and positive effects [27,58,59,60] have been observed. These mixed results suggest that, while education contributes to subjective well-being, its effect may be influenced by factors such as socioeconomic status, employment opportunities, and personal aspirations, which can vary greatly among different populations. While many studies focus on the direct effects of education level on happiness, Köksal, Uçak, and Görmüş [26], as well as Güzel and Görmüş [28], have similarly examined the education satisfaction variable in the context of Türkiye. Although Köksal, Uçak, and Görmüş [26] found a positive relationship between education satisfaction and happiness during the years 2010–2012, they did not find a significant effect in 2008 and 2009. On the other hand, Güzel and Görmüş [28] emphasized that there was no direct effect of education satisfaction on happiness in 2019.
Marriage satisfaction positively affects subjective well-being. As the level of subjective well-being increases, the effect of marriage satisfaction on subjective well-being also increases. In other words, for individuals with lower levels of subjective well-being, the impact of marriage satisfaction is weaker compared to those with higher levels. Conversely, for individuals with higher levels of subjective well-being, the contribution of marriage satisfaction to their overall well-being is stronger. Köksal, Uçak and Şahin, Güzel and Görmüş, and Çakmak and Emirhan, in their studies with Turkish samples from different years, emphasized that marriage satisfaction has a positive and significant effect on happiness, similar to the findings of this study [26,28,29]. These results support the idea that marriage satisfaction plays an important role in influencing individuals’ subjective well-being across various contexts and time periods.
The effect of housing-district satisfaction on subjective well-being was not found to be statistically significant. Although both national and international studies in the literature have shown a positive relationship between housing satisfaction and general satisfaction [24,27,28,29], no significant effect was found in this study. However, unlike those studies, this research examines the combined effect of housing satisfaction and district satisfaction as a latent variable on subjective well-being, offering a more comprehensive view of how these factors jointly influence well-being. This discrepancy may result from the fact that, when considering the influence of location, the relationship between housing-district satisfaction and subjective well-being can be affected by variables such as neighborhood quality, safety, and access to amenities.
It has been observed that individuals’ work life satisfaction positively affects their levels of subjective well-being. For those with lower levels of subjective well-being, the effect of satisfaction derived from work life on their subjective well-being is greater compared to others. Conversely, for individuals with higher levels of subjective well-being, the contribution of work life satisfaction to their overall well-being is less significant. In other words, as the level of subjective well-being increases, the impact of satisfaction obtained from work life decreases. Literature shows that many studies have identified a positive relationship between income and subjective well-being [8,31,61,62,63]. In studies examining life satisfaction domains, variables such as income satisfaction, job satisfaction, and financial satisfaction have been incorporated into models, individually or in combination. In our study, however, a latent variable for work life satisfaction was created to represent satisfaction levels in work and income contexts. Both the national and international literature have established a positive effect of income satisfaction, job satisfaction, and financial satisfaction on happiness [24,25,26,27,28,29,64]. The results obtained from this study support the findings in the literature from a more specific perspective, demonstrating that, for individuals with lower subjective well-being, satisfaction derived from work life significantly and meaningfully enhances their levels of subjective well-being. This finding underscores how the level of subjective well-being shapes the impact of work satisfaction and highlights the importance of relationship satisfaction, particularly for individuals with lower levels of subjective well-being.
Social life satisfaction positively affects subjective well-being and exhibits a consistent relationship across different quantile levels. Whether at lower or higher quantiles, the effect of social life satisfaction on subjective well-being remains stable. In a study by Diener and Ryan [65], the authors discussed a positive relationship between high subjective well-being and sociability, suggesting a bidirectional causal link between these two variables. In other words, individuals with greater satisfaction in their social life tend to report higher subjective well-being, and those with higher subjective well-being are often more sociable. In previous studies, social satisfaction and leisure satisfaction have typically been evaluated as separate variables. For example, in their research on Türkiye, Güzel and Görmüş [28] and Soylu [64] found that social satisfaction positively affects both life satisfaction and happiness. However, Soylu [64] also noted that leisure satisfaction had no significant impact on life satisfaction. In contrast, Praag’s study using data from Germany showed that leisure satisfaction positively contributes to life satisfaction. These findings underscore the crucial role that social interactions and the quality of one’s social life play in sustaining and enhancing subjective well-being.
Relationship satisfaction also positively affects subjective well-being, and this effect varies according to quantile levels. For individuals with low subjective well-being, relationship satisfaction significantly enhances their well-being, whereas the effect is less pronounced for those with high subjective well-being. In other words, for individuals with high subjective well-being, satisfaction with relationships does not have a strong influence on their overall well-being. This is likely because individuals with high subjective well-being tend to socialize more easily and are more self-confident, allowing them to form their own social support systems with ease [65]. Therefore, it can be concluded that the effect of relationship satisfaction on subjective well-being is less significant for individuals with high subjective well-being compared to those with lower subjective well-being. Although the importance of relationship satisfaction may vary across cultures, studies in the literature have consistently shown that satisfaction with relationships (e.g., with friends and family) has a positive effect on happiness. Köksal, Uçak, and Şahin [26], similarly to the approach used in this study, identified relationship satisfaction as a single variable and found a positive and significant association between relationship satisfaction and happiness in Türkiye. These results, consistent with the findings of other studies in the literature, highlight the positive effect of relationships on subjective well-being. In addition to previous research, our findings provide more detailed insights, underscoring that for individuals with lower subjective well-being, the effect of relationship satisfaction is more pronounced. This emphasizes the crucial role that relationships play in enhancing well-being, particularly for those with initially lower levels of subjective well-being.
Satisfaction with public services has a positive effect on subjective well-being, and this effect decreases as the quantile levels increase. In other words, for individuals with higher levels of subjective well-being, satisfaction with public services has a smaller impact on their overall well-being. Similarly, Köksal, Uçak, and Şahin [26] incorporated all types of public services into a single variable, even though they did not treat public services satisfaction as a latent construct in their study. Their research on Türkiye demonstrated a positive relationship between public services satisfaction and happiness. However, due to the limited number of studies in the literature on this topic, these results need further research to be validated. Public services play a vital role in the quality of life by providing essential support and infrastructure that can enhance subjective well-being. The positive effect observed in this study suggests that effective public services contribute significantly to well-being, reinforcing the need for ongoing investment in public infrastructure and services.
This study’s limitations also present opportunities for future research. First, the data were collected solely from individuals in Türkiye, which limits the generalizability of the findings. This suggests the potential for conducting similar studies in different countries or cultural contexts to enhance the validity and reliability of the results. Secondly, the reliance on cross-sectional data from a single year may limit the ability to fully explore the causal relationships between subjective well-being and satisfaction domains. While longitudinal data would offer a more comprehensive understanding of the dynamic interactions between these variables, the application of such data within the framework of QSEM presents significant methodological challenges. The inclusion of multiple years, given the latent variable structure and the quantile-specific estimations employed in the analysis, would substantially increase the complexity of the model and potentially hinder interpretability. Therefore, this study’s focus on a single year was deemed appropriate to maintain the analytical clarity and focus of the findings. In addition, this study will provide a methodological reference for other studies in the field and may shed light on similar studies in the future. Lastly, the subjective well-being and satisfaction measurements used in the study are based on participants’ self-reports, which may be subject to biases such as social desirability and respondent tendencies. This limitation is common to all studies employing satisfaction domains based on self-reported data.
In addition, limitations are associated with the statistical methodology employed in this study. First, Bayesian prediction, while offering various advantages, entails certain challenges. Determining appropriate iteration counts and burn-in periods for convergence can require extensive experimentation, and, as the number of iterations grows—particularly in complex models—this process can become time-consuming, potentially leading to inefficiencies. Furthermore, compared to classical SEM, both the model’s overall fit assessment and parameter estimates are somewhat limited within the Bayesian framework. In particular, model fit in BQSEM can only be evaluated through the PPP criterion, which may not provide as comprehensive an assessment as in frequentist SEM approaches. Lastly, the application of QSEM in this study has been limited to linear models. Future research could explore extending QSEM to incorporate non-linear, non-parametric, or semi-parametric models among latent variables, expanding the applicability and robustness of the method in diverse contexts.

5. Conclusions

In conclusion, this study employs BSEM and BQSEM to provide valuable insights into the factors influencing individuals’ subjective well-being in Türkiye. These advanced methods, particularly the use of latent variable models and the innovative application of the quantile approach, offer a more nuanced understanding of how satisfaction in various life domains affects subjective well-being across different levels of well-being. This study is the first to apply BQSEM to subjective well-being, showcasing its potential to reveal the differential effects of predictors at various quantile levels.
These findings indicate that satisfaction with health, marriage, work life, social life, relationships, and public services all positively affect subjective well-being. Notably, for individuals with lower levels of subjective well-being, satisfaction with work life, relationships, and public services has a stronger effect on subjective well-being. In contrast, for those with higher levels of subjective well-being, marriage satisfaction affects subjective well-being more strongly. On the other hand, satisfaction with education and housing district did not show a significant effect, suggesting these areas may warrant further exploration.
These results emphasize that, when evaluating subjective well-being, it is crucial to consider not only economic indicators but also individuals’ personal and social satisfaction. Improving satisfaction levels in these domains can substantially improve overall life satisfaction. In summary, this study provides essential insights into the factors influencing subjective well-being in Türkiye and offers valuable guidance for enhancing overall quality of life through targeted improvements in these key areas.

Author Contributions

Conceptualization, Z.Ç. and N.B.A.; methodology, Z.Ç. and N.B.A.; formal analysis, Z.Ç.; data curation, Z.Ç.; writing—original draft preparation, Z.Ç.; writing—review and editing, Z.Ç. and N.B.A.; supervision, N.B.A. All authors have read and agreed to the published version of the manuscript.

Funding

This research received no external funding.

Institutional Review Board Statement

This study did not involve clinical experiments on humans or animals and did not raise any ethical concerns; therefore, ethical review and approval were waived. The data used in this study were secondary data obtained from the Turkish Statistical Institute and were fully anonymized. The study was conducted in accordance with the ethical principles outlined in the Declaration of Helsinki, and the anonymity and confidentiality of the data were strictly maintained.

Informed Consent Statement

Informed consent was waived due to the use of microdata obtained from the Turkish Statistical Institute.

Data Availability Statement

Due to legal or ethical reasons, the data used in the study cannot be shared as it was obtained from the Turkish Statistical Institute.

Conflicts of Interest

The authors declare no conflicts of interest.

References

  1. Witter, R.A.; Okun, M.A.; Stock, W.A.; Haring, M.J. Education and Subjective Well-Being: A Meta-Analysis. Educ. Eval. Policy Anal. 1984, 6, 165–173. [Google Scholar] [CrossRef]
  2. Easterlin, R.A. Explaining Happiness. Proc. Natl. Acad. Sci. USA 2003, 100, 11176–11183. [Google Scholar] [CrossRef] [PubMed]
  3. Frey, B.S.; Stutzer, A. Happiness Research: State and Prospects. Rev. Soc. Econ. 2005, 63, 207–228. [Google Scholar] [CrossRef]
  4. Diener, E. Guidelines for National Indicators of Subjective Well-Being and Ill-Being. J. Happiness Stud. 2006, 7, 397–404. [Google Scholar] [CrossRef]
  5. Dolan, P.; Peasgood, T.; White, M. Do We Really Know What Makes Us Happy? A Review of the Economic Literature on the Factors Associated with Subjective Well-Being. J. Econ. Psychol. 2008, 29, 94–122. [Google Scholar] [CrossRef]
  6. Mouratidis, K. Commute Satisfaction, Neighborhood Satisfaction, and Housing Satisfaction as Predictors of Subjective Well-Being and Indicators of Urban Livability. Travel. Behav. Soc. 2020, 21, 265–278. [Google Scholar] [CrossRef]
  7. Blanchflower, D.G. Measuring the Subjective Well-Being of Nations: National Accounts of Time Use and Well-Being; University of Chicago Press: Chicago, IL, USA, 2009; pp. 155–226. [Google Scholar]
  8. Sacks, D.W.; Stevenson, B.; Wolfers, J. The New Stylized Facts about Income and Subjective Well-Being. In IZA Discussion Papers; Institute for the Study of Labor (IZA): Bonn, Germany, 2012. [Google Scholar]
  9. Stevenson, B.; Wolfers, J. Subjective Well-Being and Income: Is There Any Evidence of Satiation? Am. Econ. Rev. 2013, 103, 598–604. [Google Scholar] [CrossRef]
  10. Yu, G.B.; Lee, D.-J.; Sirgy, M.J.; Bosnjak, M. Household Income, Satisfaction with Standard of Living, and Subjective Well-Being. The Moderating Role of Happiness Materialism. J. Happiness Stud. 2020, 21, 2851–2872. [Google Scholar] [CrossRef]
  11. Røysamb, E.; Tambs, K.; Reichborn-Kjennerud, T.; Neale, M.C.; Harris, J.R. Happiness and Health: Environmental and Genetic Contributions to the Relationship Between Subjective Well-Being, Perceived Health, and Somatic Illness. J. Personal. Soc. Psychol. 2003, 85, 1136–1146. [Google Scholar] [CrossRef]
  12. Huber, A.; Rabl, L.; Höge-Raisig, T.; Höfer, S. Well-Being, Mental Health, and Study Characteristics of Medical Students before and during the Pandemic. Behav. Sci. 2023, 14, 7. [Google Scholar] [CrossRef]
  13. Ross, C.E.; Willigen, M.V. Education and the Subjective Quality of Life. J. Health Soc. Behav. 1997, 38, 275. [Google Scholar] [CrossRef] [PubMed]
  14. Diener, E.; Suh, E. Measuring Quality of Life: Economic, Social, and Subjective Indicators. Soc. Indic. Res. 1997, 40, 189–216. [Google Scholar] [CrossRef]
  15. Nakamura, H.; Murata, C.; Yamazaki, Y. Social Activities and Subjective Well-Being among Older Persons in Japan. J. Epidemiol. Res. 2019, 5, 56. [Google Scholar] [CrossRef]
  16. Jin, Y.; Li, Z.; An, J. Impact of Education on Chinese Urban and Rural Subjective Well-Being. Child. Youth Serv. Rev. 2020, 119, 105505. [Google Scholar] [CrossRef]
  17. Dodge, R.; Daly, A.; Huyton, J.; Sanders, L. The Challenge of Defining Wellbeing. Intnl. J. Wellbeing 2012, 2, 222–235. [Google Scholar] [CrossRef]
  18. Selim, S. Life Satisfaction and Happiness in Turkey. Soc. Indic. Res. 2008, 88, 531–562. [Google Scholar] [CrossRef]
  19. Andrews, F.M.; Withey, S.B. Social Indicators of Well-Being: America’s Perception of Life Quality; Plenum Press: New York, NY, USA, 1976. [Google Scholar]
  20. Vermunt, R. Satisfaction, Happiness and Well-Being of Dutch Students. Soc. Indic. Res. 1989, 21, 1–33. [Google Scholar] [CrossRef]
  21. Cummins, R.A. The Domains of Life Satisfaction: An Attempt to Order Chaos. Soc. Indic. Res. 1996, 38, 303–328. [Google Scholar] [CrossRef]
  22. Veenhoven, R. Developments in Satisfaction-Research. Soc. Indic. Res. 1996, 37, 1–46. [Google Scholar] [CrossRef]
  23. Kousha, M.; Mohseni, N. Predictors of Life Satisfaction among Urban Iranian Women: An Exploratory Analysis. Soc. Indic. Res. 1997, 40, 329–357. [Google Scholar] [CrossRef]
  24. van Praag, B.M.S.; Frijters, P.; Ferrer-i-Carbonell, A. The Anatomy of Subjective Well-Being. J. Econ. Behav. Organ. 2003, 51, 29–49. [Google Scholar] [CrossRef]
  25. Easterlin, R.A.; Sawangfa, O. Happiness and Domain Satisfaction: Theory and Evidence. SSRN J. 2007. [Google Scholar] [CrossRef]
  26. Köksal, O.; Uçak, H.; Şahin, F. Happiness and Domain Satisfaction in Turkey. Int. J. Happiness Dev. 2017, 3, 323–341. [Google Scholar] [CrossRef]
  27. Eren, K.A.; Aşıcı, A.A. The Determinants of Happiness in Turkey: Evidence from City-Level Data. J. Happiness Stud. 2017, 18, 647–669. [Google Scholar] [CrossRef]
  28. Güzel, S.; Görmüş, A. Prediction of Satisfaction Indicators Increasing the Level of Happiness: Evidence from the Turkish Life Satisfaction Survey. Qual. Quant. 2023, 57, 3805–3824. [Google Scholar] [CrossRef]
  29. Çakmak, S.; Emirhan, P.N. The Effects of Domain Satisfaction on Overall Life Satisfaction in Türkiye. Int. J. Happiness Dev. 2024, 8, 244–270. [Google Scholar] [CrossRef]
  30. Emmons, R.A.; Diener, E. Factors Predicting Satisfaction Judgments: A Comparative Examination. Soc. Indic. Res. 1985, 16, 157–167. [Google Scholar] [CrossRef]
  31. Diener, E. Subjective Well-Being. Psychol. Bull. 1984, 85, 542–575. [Google Scholar] [CrossRef]
  32. Steel, P.; Schmidt, J.; Shultz, J. Refining the Relationship between Personality and Subjective Well-Being. Psychol. Bull. 2008, 134, 138–161. [Google Scholar] [CrossRef]
  33. Chen, Y.; Peng, Y.; Fang, P. Emotional Intelligence Mediates the Relationship between Age and Subjective Well-Being. Int. J. Aging Hum. Dev. 2016, 83, 91–107. [Google Scholar] [CrossRef]
  34. Huang, L.; Zhang, T. Perceived Social Support, Psychological Capital, and Subjective Well-Being among College Students in the Context of Online Learning during the COVID-19 Pandemic. Asia-Pac. Edu. Res. 2022, 31, 563–574. [Google Scholar] [CrossRef]
  35. Matkovic, H.; Brajkovic, L.; Kopilaš, V. Psychosocial Factors of Subjective Well-Being in Women with Eating Disorders. Behav. Sci. 2023, 13, 594. [Google Scholar] [CrossRef]
  36. Feng, F.; Li, H.; Zhang, T. The effect of physical activity on the subjective well-being of rural left-behind children: The mediating role of discrimination perceptions and loneliness. BMC Psychol. 2024, 12, 455. [Google Scholar] [CrossRef]
  37. Maridal, J.H. A Worldwide Measure of Societal Quality of Life. Soc. Indic. Res. 2017, 134, 1–38. [Google Scholar] [CrossRef]
  38. Stanca, L. The Geography of Economics and Happiness: Spatial Patterns in the Effects of Economic Conditions on Well-Being. Soc. Indic. Res. 2010, 99, 115–133. [Google Scholar] [CrossRef]
  39. Neira, I.; Lacalle-Calderon, M.; Portela, M.; Perez-Trujillo, M. Social Capital Dimensions and Subjective Well-Being: A Quantile Approach. J. Happiness Stud. 2019, 20, 2551–2579. [Google Scholar] [CrossRef]
  40. Lin, C.-C.; Yeh, Y. How Gratitude Influences Well-Being: A Structural Equation Modeling Approach. Soc. Indic. Res. 2014, 118, 205–217. [Google Scholar] [CrossRef]
  41. Diener, E.D.; Emmons, R.A.; Larsen, R.J.; Griffin, S. The Satisfaction with Life Scale. J. Personal. Assess. 1985, 49, 71–75. [Google Scholar] [CrossRef]
  42. Diener, E.; Smith, H.; Fujita, F. The Personality Structure of Affect. J. Personal. Soc. Psychol. 1995, 69, 130–141. [Google Scholar] [CrossRef]
  43. Binder, M.; Coad, A. From Average Joe’s Happiness to Miserable Jane and Cheerful John: Using Quantile Regressions to Analyze the Full Subjective Well-Being Distribution. J. Econ. Behav. Organ. 2011, 79, 275–290. [Google Scholar] [CrossRef]
  44. Yuan, H.; Golpelwar, M. Testing Subjective Well-Being from the Perspective of Social Quality: Quantile Regression Evidence from Shanghai, China. Soc. Indic. Res. 2013, 113, 257–276. [Google Scholar] [CrossRef]
  45. Zhang, Y.; Tang, N. Bayesian Empirical Likelihood Estimation of Quantile Structural Equation Models. J. Syst. Sci. Complex 2017, 30, 122–138. [Google Scholar] [CrossRef]
  46. Yazdi, M.; Roohafza, H.; Feizi, A.; Sarafzadegan, N. Association of Stressful Life Events and Psychological Problems Profile: Results from a Large-Scale Cross-Sectional Study Among Iranian Industrial Employees Using Bayesian Quantile Structural Equation Model. EXCLI J. 2018, 17, 620–633. [Google Scholar] [CrossRef]
  47. Life Satisfaction Survey; Turkish Statistical Institute: Çankaya, Turkey, 2020. Available online: https://www.tuik.gov.tr/media/announcements/yasam_memnuniyeti_arastirmasi_2020.pdf (accessed on 2 October 2024).
  48. Lee, S.-Y. Structural Equation Modeling: A Bayesian Approach; John Wiley & Sons: Hoboken, NJ, USA, 2007. [Google Scholar]
  49. Wang, Y. Bayesian Quantile Regression in Latent Variable Models. Ph.D. Thesis, The Chinese University of Hong Kong, Hong Kong, China, 2016. [Google Scholar]
  50. Wang, Y.; Feng, X.-N.; Song, X.-Y. Bayesian Quantile Structural Equation Models. Struct. Equ. Model. A Multidiscip. J. 2016, 23, 246–258. [Google Scholar] [CrossRef]
  51. Blanchflower, D.G.; Oswald, A.J. Well-Being over Time in Britain and the USA. J. Public Econ. 2004, 88, 1359–1386. [Google Scholar] [CrossRef]
  52. Chen, W. How Education Enhances Happiness: Comparison of Mediating Factors in Four East Asian Countries. Soc. Indic. Res. 2012, 106, 117–131. [Google Scholar] [CrossRef]
  53. Huang, J. Education, Income and Happiness of Chinese Urban Residents: Based on the Data of the 2005 Chinese General Social Survey. Chin. J. Sociol. 2013, 33, 181–203. [Google Scholar]
  54. Yu, Y. How Education Affects Happiness: Research Progress on Education, Public 15 Expenditure on Education, and Subjective Well-Being. Peking Univ. 16 Educ. Rev. 2014, 12, 105–120. [Google Scholar]
  55. Bień, B.; Bień-Barkowska, K. Objective Drivers of Subjective Well-Being in Geriatric Inpatients: Mobility Function and Level of Education Are General Predictors of Self-Evaluated Health, Feeling of Loneliness, and Severity of Depression Symptoms. Qual. Life Res. 2016, 25, 3047–3056. [Google Scholar] [CrossRef]
  56. Bozkuş, S.; Çevik, E.İ.; Üçdoğruk, Ş. Subjektif Refah ve Mutluluk Düzeyine Etki Eden Faktörlerin Sıralı Logit Modeli Ile Modellenmesi: Türkiye Örneği. In Proceedings of the İstatistik Araştırma Sempozyumu Bildiriler Kitabı, Ankara, Türkiye, 11–12 May 2006; pp. 93–116. [Google Scholar]
  57. Akin, H.B.; Şentürk, E. Bireylerin mutluluk düzeylerinin ordinal lojistik regresyon analizi ile incelenmesi-analysing levels of happiness of individuals with ordinal logistic analysis. Öneri Derg. 2012, 10, 183–193. [Google Scholar]
  58. Atay, B.; Atay, B. Happiness in East Europe in Comparison with Turkey. Master’s Thesis, İstanbul Bilgi Üniversitesi, İstanbul, Turkey, 2012. [Google Scholar]
  59. Dumludağ, E. Life Satisfaction and Income Comparison Effects in Turkey. Soc. Indic. Res. 2013, 114, 1199–1210. [Google Scholar] [CrossRef]
  60. Bülbül, Ş.; Giray, S. Sosyodemografik Özellikler Ile Mutluluk Algısı Arasındaki İlişki Yapısının Analizi. Ege Akad. Bakış 2011, 11, 113–123. [Google Scholar]
  61. Diener, E.; Sandvik, E.; Seidlitz, L.; Diener, M. The Relationship between Income and Subjective Well-Being: Relative or Absolute? Soc. Indic. Res. 1993, 28, 195–223. [Google Scholar] [CrossRef]
  62. Easterlin, R.A. Will Raising the Incomes of All Increase the Happiness of All? J. Econ. Behav. Organ. 1995, 27, 35–47. [Google Scholar] [CrossRef]
  63. Tay, L.; Zyphur, M.; Batz, C.L. Income and Subjective Well-Being: Review, Synthesis, and Future Research. In Handbook of Well-Being; DEF Publishers: Salt Lake City, UT, USA, 2018. [Google Scholar]
  64. Soylu, C. Predictors of Domain-Specific and Global Life Satisfaction across the First Half of Life: Which Domains of Life Satisfaction Are the Most Important for Global Life Satisfaction? Curr. Psychol. 2023, 42, 19443–19454. [Google Scholar] [CrossRef]
  65. Diener, E.; Ryan, K. Subjective Well-Being: A General Overview. S. Afr. J. Psychol. 2009, 39, 391–406. [Google Scholar] [CrossRef]
Figure 1. Research Model.
Behavsci 14 01170 g001
Figure 2. Symbolic representation of the path diagram on subjective well-being.
Behavsci 14 01170 g002
Figure 3. Trace and density plots of structural model parameters of BSEM and Median-BQSEM.
Behavsci 14 01170 g003
Figure 4. Graphs of structural model regression coefficients estimated for each quantile level and credible intervals at 95% confidence level.
Behavsci 14 01170 g004
Table 1. Latent and observed variables utilized in the study.
Name of the Latent VariableName of the Observed VariableQuestion
Subjective Well-BeingHappiness1. When you think your life as a whole, how happy are you?
Life Satisfaction2. When you think as a whole, rate your recent life satisfaction between 0 and 10.
Housing-District
Satisfaction
Housing1. Are you satisfied with your residence houses?
District2. Are you satisfied with district where you live?
Work Life
Satisfaction
Work1. Are you satisfied with your job?
Earning2. Are you satisfied with the income that you get from your job?
Income3. Are you satisfied with your household monthly income?
Time4. Are you satisfied with the time spend (taking) for work from arrival to departure?
Colleague5. Are you satisfied with relationships with people about your business?
Social Life
Satisfaction
Social life1. Are you satisfied with social life (entertainment, cultural and sporting activities, etc.)?
Personal Time2. Are you satisfied with taking time for yourself?
Relationship
Satisfaction
Relative1. Are you satisfied with relationships with your relatives?
Friend2. Are you satisfied with relationships with your friends?
Neighbor3. Are you satisfied with relationships with your neighbors?
Public Service
Satisfaction
Health1. Are you satisfied with health services?
Public order2. Are you satisfied with the public security service?
Judicial3. Are you satisfied with judicial services?
Education4. Are you satisfied with the services of education?
SSI5. Are you satisfied with the services of Social Security Institution?
Transportation6. Are you satisfied with the services of transportation?
Health
Satisfaction
-Are you satisfied with your health?
Education
Satisfaction
-Are you satisfied with the education you have ever received?
Marriage
Satisfaction
-Are you satisfied with your marriage?
Table 2. Descriptive statistics and correlation coefficients of latent variables.
MSD123456
1. Subjective Well-Being 5.0611.5151
2. Housing-District Satisfaction 3.8150.6480.262 **1
3. Work Life Satisfaction3.4890.6290.536 **0.340 **1
4. Social Life Satisfaction3.1400.9250.447 **0.270 **0.547 **1
5. Relationship Satisfaction3.8410.5650.301 **0.312 **0.321 **0.308 **1
6. Public Service Satisfaction3.6520.6120.380 **0.297 **0.405 **0.384 **0.347 **1
Note: M = mean; SD = standard deviation. ** p < 0.001.
Table 3. Estimated parameter coefficients and credible intervals at a 95% confidence level for BSEM and Median-BQSEM.
ParametersBSEMCredible İntervalMedian BQSEMCredible İnterval
Factor loadsλ210.924[0.865; 0.985]0.933[0.89; 0.982]
λ420.834[0.728; 0.943]0.940[0.890; 0.990]
λ631.513[1.429; 1.603]2.662[2.470; 2.803]
λ731.492[1.408; 1.582]2.694[2.499; 2.838]
λ830.728[0.656; 0.804]1.528[1.404; 1.636]
λ930.521[0.448; 0.595]0.404[0.363; 0.441]
λ11,40.887[0.831; 0.943]0.978[0.950; 1.006]
λ13,51.057[0.981; 1.140]1.057[1.013; 1.101]
λ14,50.872[0.799; 0.951]1.034[0.996; 1.072]
λ16,60.990[0.927; 1.058]0.649[0.608; 0.693]
λ17,61.025[0.958; 1.094]1.112[1.076; 1.15]
λ18,60.987[0.922; 1.056]1.218[1.170; 1.270]
λ19,60.977[0.915; 1.044]1.126[1.09; 1.161]
λ20,60.742[0.678; 0.806]1.044[1.004; 1.082]
Structural Model
Coefficients
b0—Constant 0.000-−0.007[−0.034; 0.018]
b1—Health Satisfaction 0.106[0.075; 0.136]0.113[0.081; 0.145]
b2—Education Satisfaction0.009[−0.022; 0.039]0.028[−0.001; 0.057]
b3—Marriage Satisfaction0.104[0.075; 0.133]0.110[0.079; 0.138]
γ1—Housing-District Satisfaction−0.014[−0.082; 0.054]0.017[−0.046; 0.086]
γ2—Work Life Satisfaction0.540[0.460; 0.622]0.862[0.740; 0.987]
γ3—Social Life Satisfaction0.192[0.135; 0.251]0.221[0.173; 0.269]
γ4—Relationships Satisfaction0.126[0.064; 0.189]0.106[0.042; 0.169]
γ5—Public Service Satisfaction0.168[0.109; 0.228]0.170[0.109; 0.227]
Covariance between
Latent Variables
ϕ110.524[0.451; 0.608]0.426[0.381; 0.472]
ϕ120.175[0.149; 0.203]0.078[0.066; 0.092]
ϕ130.236[0.200; 0.275]0.200[0.169; 0.232]
ϕ140.214[0.182; 0.247]0.199[0.172; 0.225]
ϕ150.199[0.170; 0.230]0.165[0.141; 0.189]
ϕ220.349[0.309; 0.391]0.128[0.114; 0.148]
ϕ230.305[0.274; 0.338]0.177[0.159; 0.198]
ϕ240.120[0.098; 0.143]0.058[0.046; 0.070]
ϕ250.162[0.140; 0.186]0.080[0.069; 0.093]
ϕ330.728[0.663; 0.793]0.773[0.722; 0.829]
ϕ340.237[0.204; 0.275]0.203[0.173; 0.235]
ϕ350.265[0.232; 0.298]0.235[0.207; 0.265]
ϕ440.488[0.432; 0.546]0.465[0.428; 0.504]
ϕ450.203[0.175; 0.232]0.188[0.164; 0.212]
ϕ550.477[0.429; 0.528]0.438[0.404; 0.476]
Note: Those that are statistically insignificant at 95% confidence level are shown in italics.
Table 4. Estimated parameter coefficients for BSEM and BQSEM.
BSEMBQSEM
Parameters-5%10%25%50%75%90%95%
Structural Model Coefficients
b0—Constant0.000−0.520−0.446−0.316−0.0070.2980.4400.505
b1—Health Satisfaction0.1060.1100.1130.1110.1130.1140.1150.118
b2—Education Satisfaction0.0090.0190.0200.0240.0280.0230.0230.019
b3—Marriage Satisfaction0.1040.0940.0970.0980.1100.1310.1310.138
γ1—Housing-District Satisfaction−0.014−0.0100.002−0.0020.0170.0330.0320.033
γ2—Work Life Satisfaction 0.5400.9190.8980.8960.8620.7720.7330.748
γ3—Social Life Satisfaction0.1920.2380.2340.2340.2210.2200.2280.226
γ4—Relationships Satisfaction0.1260.1450.1370.1350.1060.0910.0910.081
γ5—Public Service Satisfaction0.1680.2000.1860.1850.1700.1390.1300.136
Note: Those that are statistically insignificant at 95% confidence level are shown in italics.
Disclaimer/Publisher’s Note: The statements, opinions and data contained in all publications are solely those of the individual author(s) and contributor(s) and not of MDPI and/or the editor(s). MDPI and/or the editor(s) disclaim responsibility for any injury to people or property resulting from any ideas, methods, instructions or products referred to in the content.

