
Pupillary Responses to Dot Patterns on a Human Face Background


Abstract
1. Introduction
2. Materials and Methods
2.1. Participants
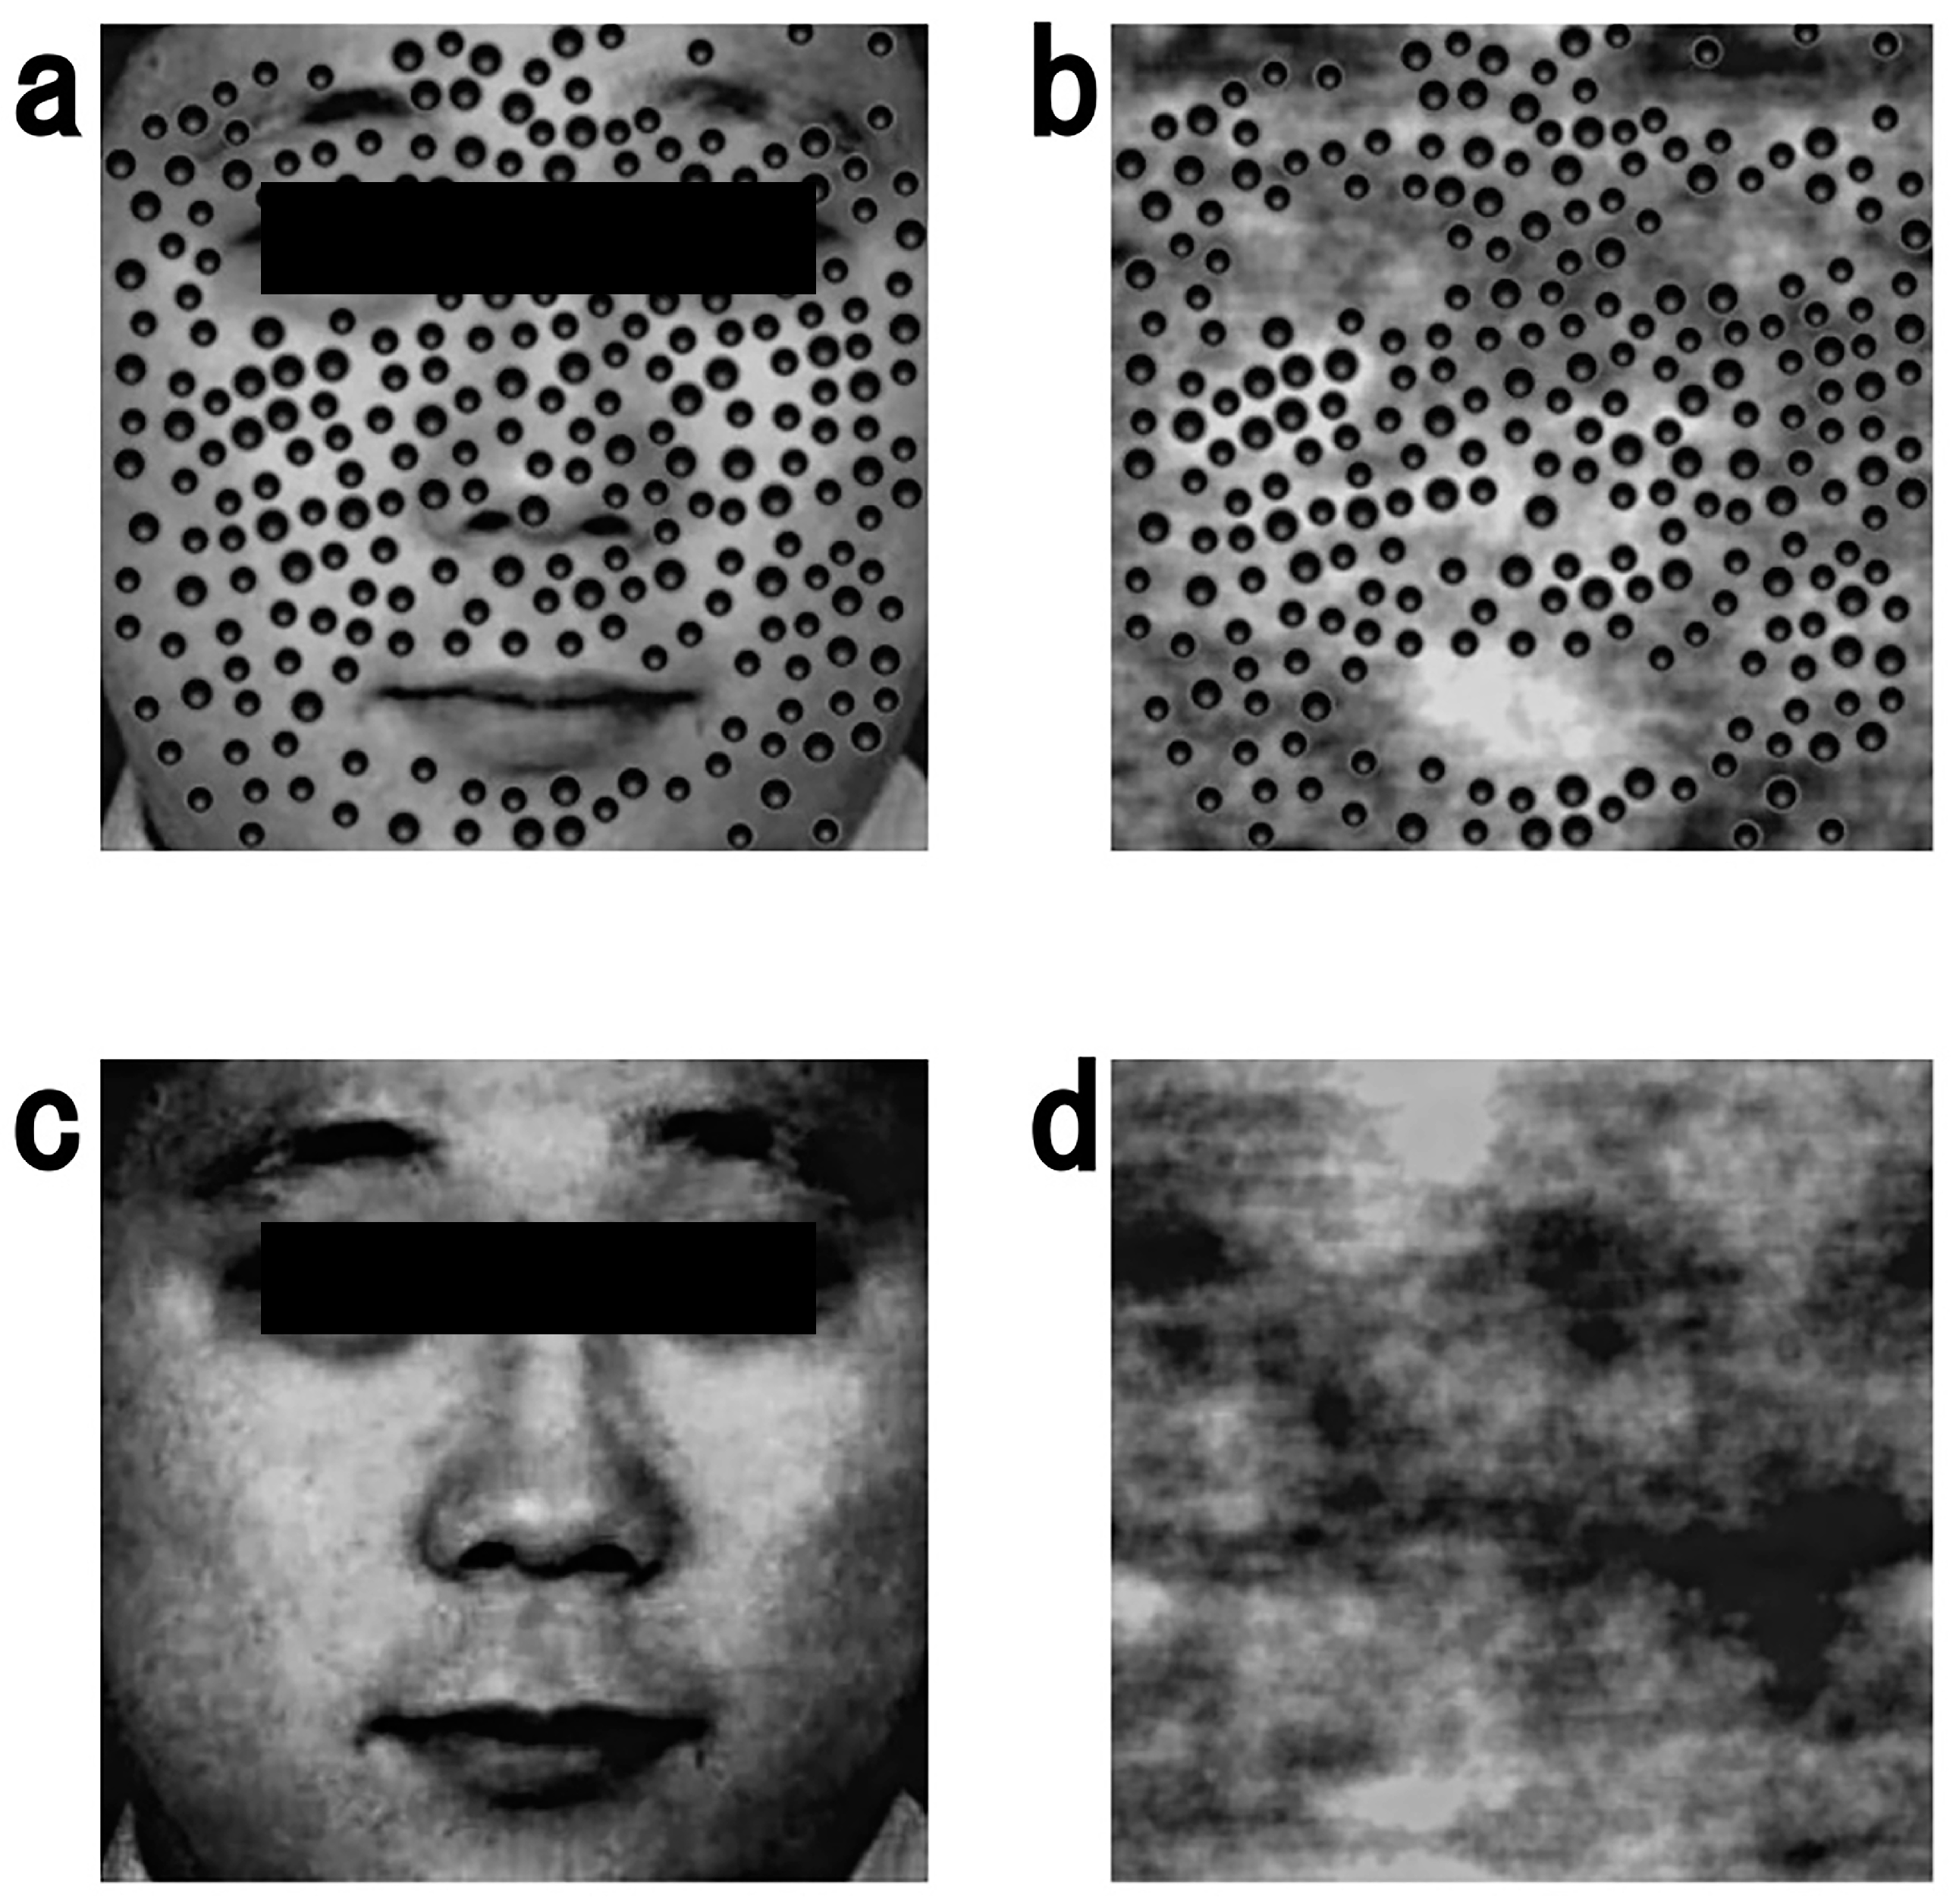
2.2. Stimuli
2.3. Apparatus
2.4. Procedure
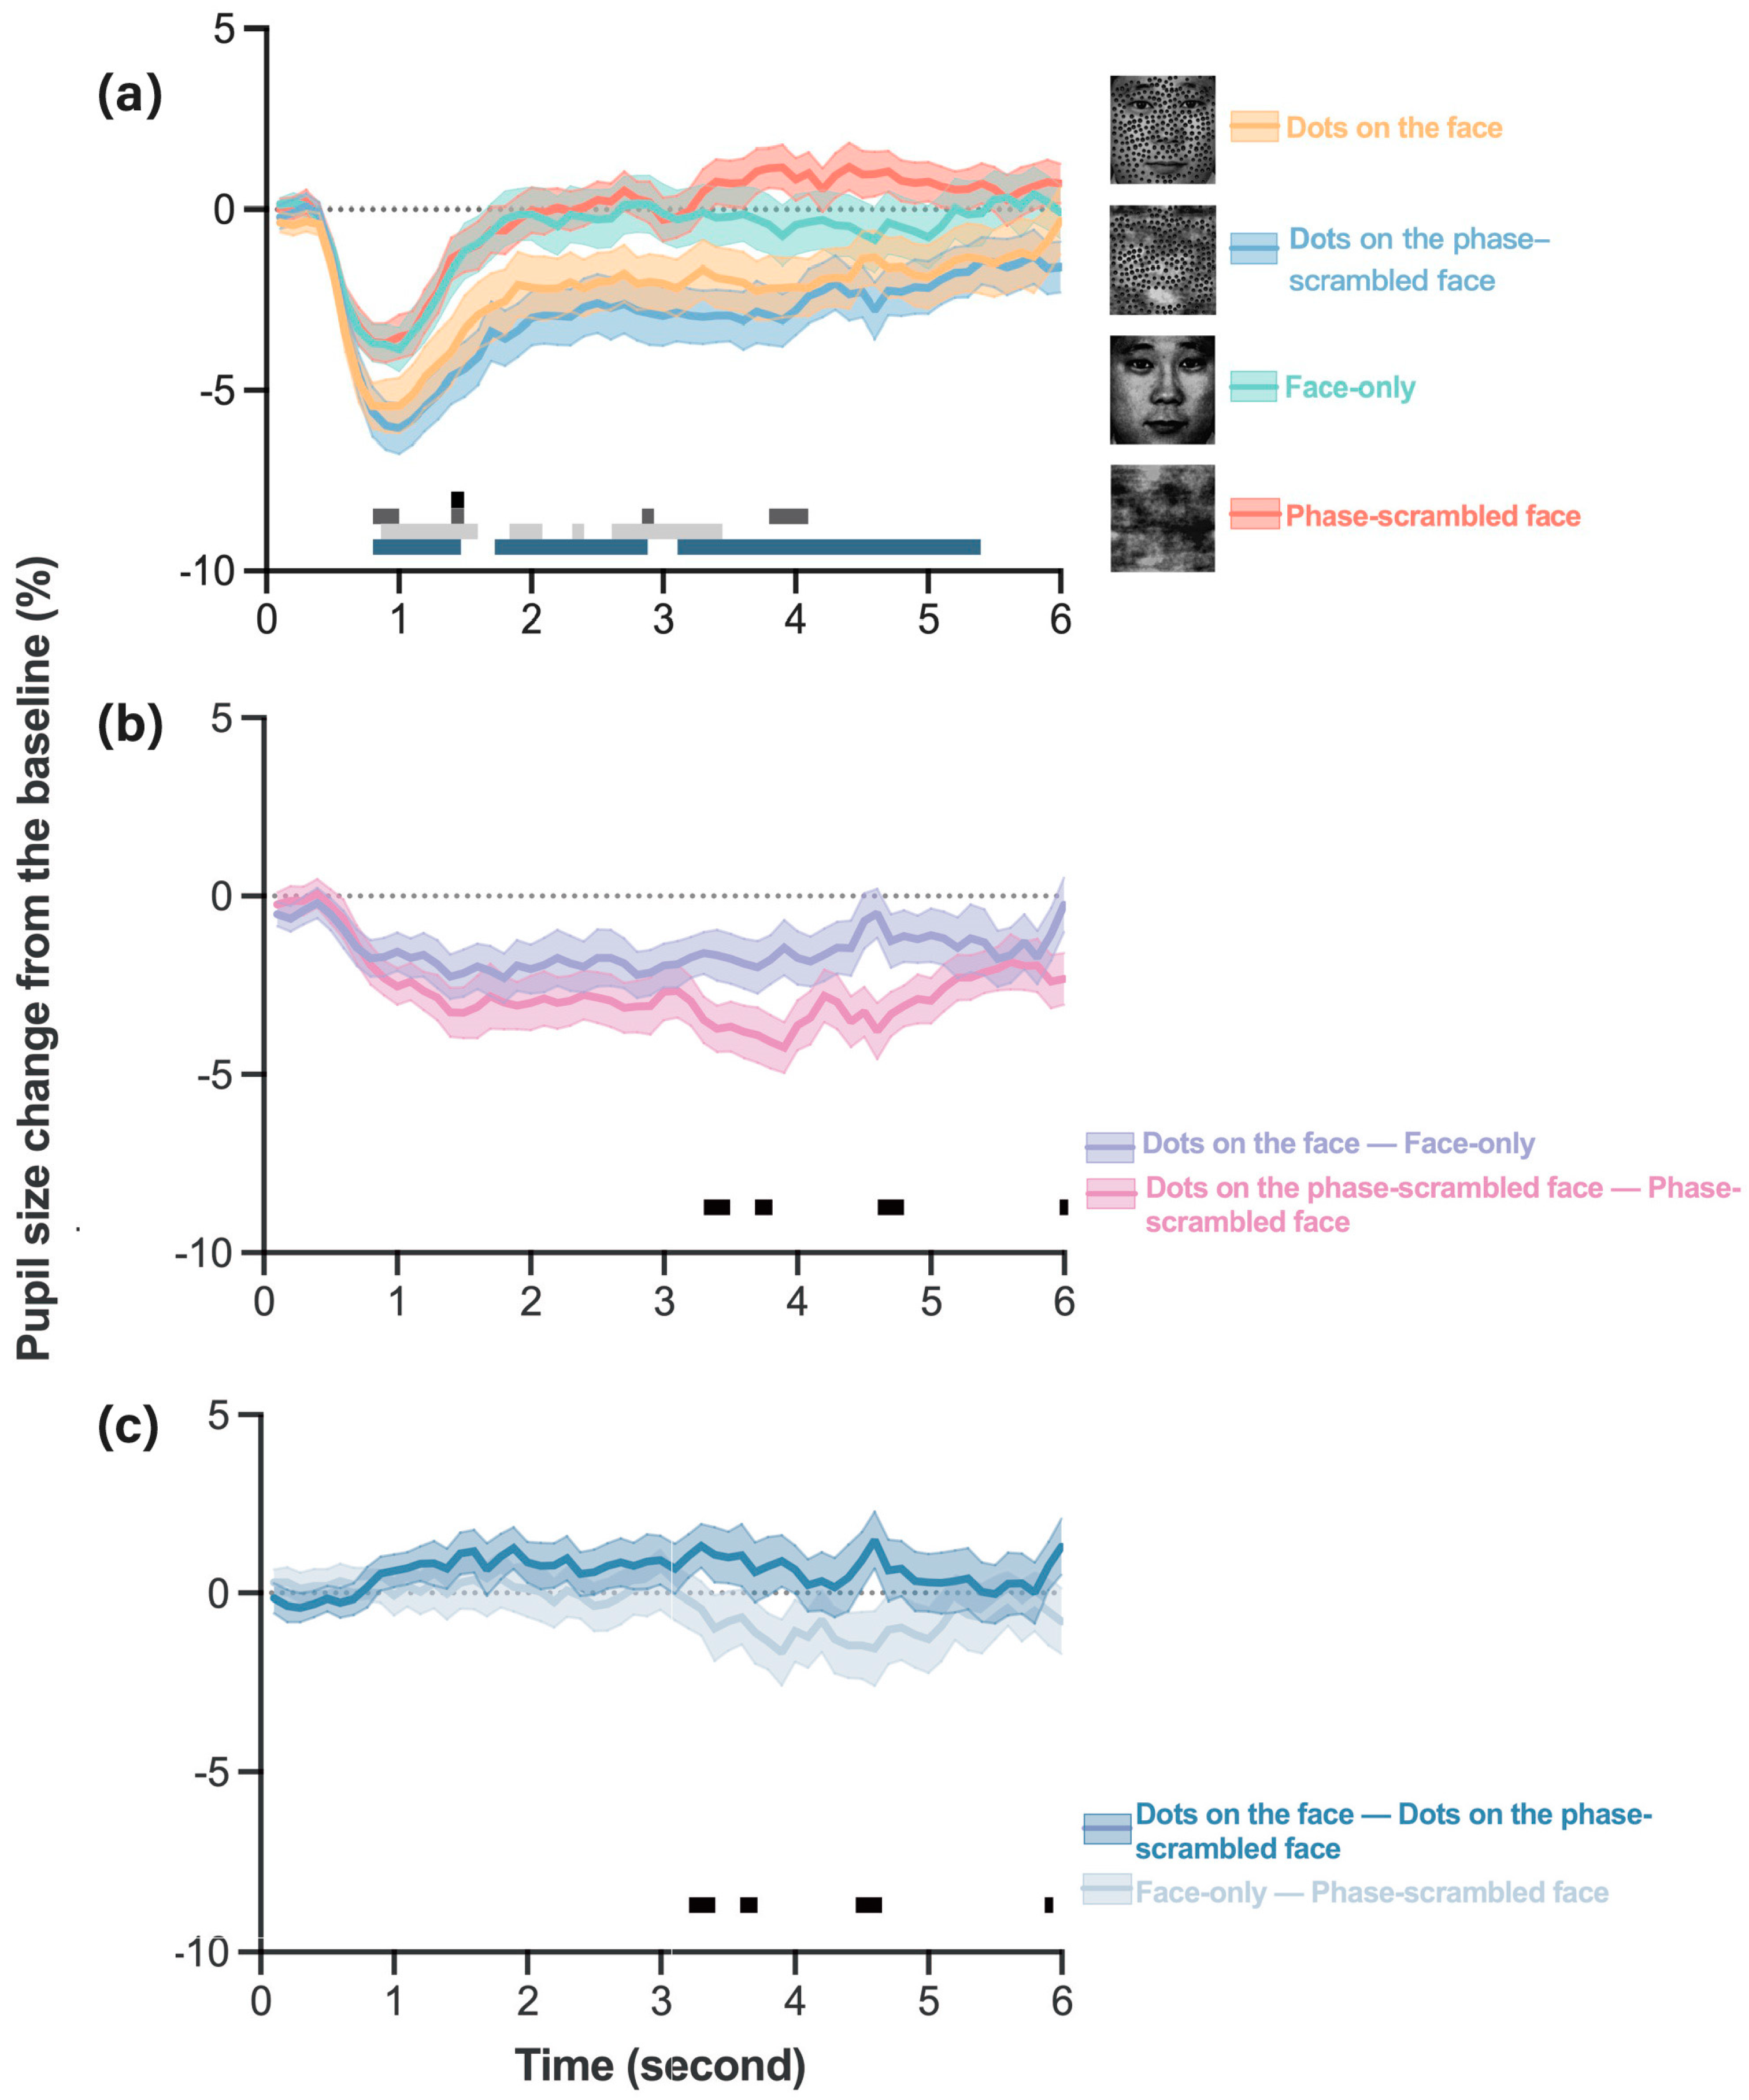
3. Results
4. Discussion
5. Conclusions
Author Contributions
Funding
Institutional Review Board Statement
Informed Consent Statement
Data Availability Statement
Conflicts of Interest
References
- Wagner, K.D.; Croley, J.A.; Wilson, J.M. Trypophobia, skin, and media. Dermatol. Online J. 2018, 24, 16. [Google Scholar] [CrossRef]
- Wilkins, A.J.; Penacchio, O.; Leonards, U. The built environment and its patterns: A view from the vision sciences. SDAR 2018, 6, 5. [Google Scholar] [CrossRef]
- Cole, G.G.; Wilkins, A.J. Fear of holes. Psychol. Sci. 2013, 24, 1980–1985. [Google Scholar] [CrossRef]
- Ayzenberg, V.; Hickey, M.R.; Lourenco, S.F. Pupillometry reveals the physiological underpinnings of the aversion to holes. PeerJ 2018, 6, e4185. [Google Scholar] [CrossRef] [PubMed]
- Folkow, B. Perspectives on the integrative functions of the ‘sympatho-adrenomedullary system’. Auton. Neurosci. 2000, 83, 101–115. [Google Scholar] [CrossRef] [PubMed]
- Murphy, F.C.; Nimmo-Smith, I.A.N.; Lawrence, A.D. Functional neuroanatomy of emotions: A meta-analysis. Cogn. Affect. Behav. Neurosci. 2003, 3, 207–233. [Google Scholar] [CrossRef]
- Granholm, E.E.; Steinhauer, S.R. Pupillometric measures of cognitive and emotional processes. Int. J. Psychophysiol. 2004, 52, 1–6. [Google Scholar] [CrossRef]
- Sirois, S.; Brisson, J. Pupillometry. Wiley Interdiscip. Rev. Cogn. Sci. 2014, 5, 679–692. [Google Scholar] [CrossRef]
- Rozin, P.; Fallon, A.E. A perspective on disgust. Psychol. Rev. 1987, 94, 23–41. [Google Scholar] [CrossRef]
- Stark, R.; Walter, B.; Schienle, A.; Vaitl, D. Psychophysiological correlates of disgust and disgust sensitivity. J. Psychophysiol. 2005, 19, 50–60. [Google Scholar] [CrossRef]
- Bradley, M.M.; Miccoli, L.; Escrig, M.A.; Lang, P.J. The pupil as a measure of emotional arousal and autonomic activation. Psychophysiology 2008, 45, 602–607. [Google Scholar] [CrossRef] [PubMed]
- Kreibig, S.D. Autonomic nervous system activity in emotion: A review. Biol. Psychol. 2010, 84, 394–421. [Google Scholar] [CrossRef]
- Chapman, H.A.; Anderson, A.K. Understanding disgust. Ann. N. Y. Acad. Sci. 2012, 1251, 62–76. [Google Scholar] [CrossRef]
- Calder, A.J.; Lawrence, A.D.; Young, A.W. Neuropsychology of fear and loathing. Nat. Rev. Neurosci. 2001, 2, 352–363. [Google Scholar] [CrossRef]
- Le, A.; Cole, G.G.; Wilkins, A. Trypophobia: Heart rate, heart rate variability and cortical haemodynamic response. J. Affect. Disord. 2020, 274, 1147–1151. [Google Scholar] [CrossRef] [PubMed]
- Furuno, M.; Imaisumi, S.; Maeda, K.; Hibino, H.; Koyama, S. The influence of background objects on unpleasantness evoked by lotus-seed-pods-on-the-living-body images (“Hasu-colla”). Int. J. Affect. Eng. 2017, 16, 221–230. [Google Scholar] [CrossRef]
- Furuno, M.; Sakurai, Y.; Imaizumi, S.; Koyama, S. Face-inversion effect on disgust evoked by a cluster of dots. i-Perception 2018, 9, 2041669518784960. [Google Scholar] [CrossRef] [PubMed]
- Song, N.; Koyama, S. Depth perception between dots and the background face reduces trypophobic discomfort. BMC Psychol. 2022, 10, 291. [Google Scholar] [CrossRef]
- Hasumaru. Ibo Ibo No Sekai [World of Warts]. Available online: https://comic.estar.jp/comics/11334068 (accessed on 5 January 2024).
- Le, A.; Cole, G.G.; Wilkins, A. Assessment of trypophobia and an analysis of its visual precipitation. Q. J. Exp. Psychol. 2015, 68, 2304–2322. [Google Scholar] [CrossRef]
- Sasaki, K.; Yamada, Y.; Kuroki, D.; Miura, K. Trypophobic discomfort is spatial-frequency dependent. Adv. Cogn. Psychol. 2017, 13, 224. [Google Scholar] [CrossRef]
- Skaggs, W. Fear of holes. Sci. Am. Mind 2014, 25, 12. [Google Scholar] [CrossRef]
- Yamada, Y.; Sasaki, K. Involuntary protection against dermatosis: A preliminary observation on trypophobia. BMC Res. Notes 2017, 10, 658. [Google Scholar] [CrossRef]
- Kupfer, T.R.; Fessler, D.M. Ectoparasite defence in humans: Relationships to pathogen avoidance and clinical implications. Philos. Trans. R. Soc. Lond. B Biol. Sci. 2018, 373, 20170207. [Google Scholar] [CrossRef] [PubMed]
- Kupfer, T.R.; Le, A.T. Disgusting clusters: Trypophobia as an overgeneralised disease avoidance response. Cogn. Emot. 2018, 32, 729–741. [Google Scholar] [CrossRef] [PubMed]
- Shirai, R.; Ogawa, H. Priming with skin-problems increases fear of clusters. Sci. Rep. 2021, 11, 10362. [Google Scholar] [CrossRef] [PubMed]
- Pipitone, R.N.; DiMattina, C.; Martin, E.R.; Pavela Banai, I.; Bellmore, K.; De Angelis, M. Evaluating the ‘skin disease-avoidance’ and ‘dangerous animal’ frameworks for understanding trypophobia. Cogn. Emot. 2022, 36, 943–956. [Google Scholar] [CrossRef]
- Cocker, K.D.; Moseley, M.J.; Bissenden, J.G.; Fielder, A.R. Visual acuity and pupillary responses to spatial structure in infants. Investig. Ophthalmol. Vis. Sci. 1994, 35, 2620–2625. [Google Scholar]
- Rossion, B.; Caharel, S. ERP evidence for the speed of face categorization in the human brain: Disentangling the contribution of low-level visual cues from face perception. Vision. Res. 2011, 51, 1297–1311. [Google Scholar] [CrossRef]
- Faul, F.; Erdfelder, E.; Lang, A.G.; Buchne, A. G* Power 3: A flexible statistical power analysis program for the social, behavioral, and biomedical sciences. Behav. Res. Methods 2007, 39, 175–191. [Google Scholar] [CrossRef]
- Matsumoto, D. Japanese and Caucasian Facial Expressions of Emotion (JACFEE) and Neutral Faces (JACNeuF) [Slides]. Intercultual and Emotion Research Laboratory, Department of Psychology. 1988. Available online: https://www.paulekman.com/ (accessed on 5 January 2024).
- Imagenavi. Sozai-Jiten Picture Database [Data File]. Available online: http://www.sozaijiten.com/ (accessed on 5 January 2024).
- Willenbockel, V.; Sadr, J.; Fiset, D.; Horne, G.O.; Gosselin, F.; Tanaka, J.W. Controlling low-level image properties: The SHINE toolbox. Behav. Res. Methods 2010, 42, 671–684. [Google Scholar] [CrossRef]
- Peng-Li, D.; Byrne, D.V.; Chan, R.C.; Wang, Q.J. The influence of taste-congruent soundtracks on visual attention and food choice: A cross-cultural eye-tracking study in Chinese and Danish consumers. Food Qual. Prefer. 2020, 85, 103962. [Google Scholar] [CrossRef]
- Kanwisher, N.; McDermott, J.; Chun, M.M. The fusiform face area: A module in human extrastriate cortex specialized for face perception. J. Neurosci. 1997, 17, 4302–4311. [Google Scholar] [CrossRef] [PubMed]
- Zeugin, D.; Notter, M.P.; Knebel, J.F.; Ionta, S. Temporo-parietal contribution to the mental representations of self/other face. Brain Cogn. 2020, 143, 105600. [Google Scholar] [CrossRef] [PubMed]
- Yang, T.T.; Simmons, A.N.; Matthews, S.C.; Tapert, S.F.; Bischoff-Grethe, A.; Frank, G.K.; Arce, E.; Paulus, M.P. Increased amygdala activation is related to heart rate during emotion processing in adolescent subjects. Neurosci. Lett. 2007, 428, 109–111. [Google Scholar] [CrossRef]
- Wang, C.A.; Baird, T.; Huang, J.; Coutinho, J.D.; Brien, D.C.; Munoz, D.P. Arousal effects on pupil size, heart rate, and skin conductance in an emotional Face Task. Front. Neurol. 2018, 9, 1029. [Google Scholar] [CrossRef]
- Hess, E.H. Attitude and pupil size. Sci. Am. 1965, 212, 46–55. [Google Scholar] [CrossRef]
- Fitzgerald, H.E. Autonomic pupillary reflex activity during early infancy and its relation to social and nonsocial visual stimuli. J. Exp. Child. Psychol. 1968, 6, 470–482. [Google Scholar] [CrossRef]
Disclaimer/Publisher’s Note: The statements, opinions and data contained in all publications are solely those of the individual author(s) and contributor(s) and not of MDPI and/or the editor(s). MDPI and/or the editor(s) disclaim responsibility for any injury to people or property resulting from any ideas, methods, instructions or products referred to in the content. |
© 2024 by the authors. Licensee MDPI, Basel, Switzerland. This article is an open access article distributed under the terms and conditions of the Creative Commons Attribution (CC BY) license (https://creativecommons.org/licenses/by/4.0/).
Share and Cite
Song, N.; Koyama, S. Pupillary Responses to Dot Patterns on a Human Face Background. Behav. Sci. 2024, 14, 69. https://doi.org/10.3390/bs14010069
Song N, Koyama S. Pupillary Responses to Dot Patterns on a Human Face Background. Behavioral Sciences. 2024; 14(1):69. https://doi.org/10.3390/bs14010069
Chicago/Turabian StyleSong, Nanxin, and Shinichi Koyama. 2024. "Pupillary Responses to Dot Patterns on a Human Face Background" Behavioral Sciences 14, no. 1: 69. https://doi.org/10.3390/bs14010069
APA StyleSong, N., & Koyama, S. (2024). Pupillary Responses to Dot Patterns on a Human Face Background. Behavioral Sciences, 14(1), 69. https://doi.org/10.3390/bs14010069