1. Introduction
Traffic accidents remain a significant cause of loss of life and property worldwide, and rear-end crashes account for the largest proportion. According to the annual report from the National Center for Statistics and Analysis [
1], in 2019 rear-end collisions accounted for 32.5% of all crashes (2.194 million), 7.1% of fatal crashes (2346), 31.1% of crashes with injuries (0.595 million), and 33.2% of all property-damage-only crashes (1.597 million). In China, rear-end collisions are very common [
2].
To prevent and reduce the number of rear-end collisions, further investigation into driver behavior is needed in conjunction with improvement in the traffic environment and the development of auxiliary devices on vehicles [
3,
4]. Most rear-end accidents are caused by several inappropriate behaviors of the following driver, such as distraction, inadequate perceptual discrimination, inappropriate interpretation of the traffic environment, and inadequate time-headway [
5,
6,
7]. Previous studies have analyzed the causes of rear-end collisions by focusing on the driver’s braking behavior. They reported that the leading vehicle’s speed, deceleration rate, and headway distance can affect the braking response time of following drivers [
7,
8,
9,
10]. For instance, Schweitzer et al. [
11] and Summala et al. [
12] investigated the impact of the leading vehicle’s speed and the following vehicle’s distance on braking response time. They found that the following driver’s reaction time was faster when the following distance was shorter. Similar results were found by Aust et al. [
13] and Engström [
14].
In addition to speed and distance, the leading vehicle’s deceleration rate is a critical factor in rear-end collisions. Hulst et al. [
7] investigated the influence of the leading vehicle’s deceleration rate on the following driver’s reaction time. Their results showed that the braking response time was longer when the deceleration rate was smaller; conversely, the greater the deceleration rate of the leading vehicle, the shorter the reaction time of the following driver. Wang et al. [
15] investigated the relationship between reaction time and driver braking behavior under different levels of urgency, three rates of deceleration (0.3, 0.5, and 0.75 g), and two different headways (1.5 and 2.5 s). Their results showed that shorter distances could produce faster reaction times, and higher deceleration rates could lead to faster reaction times than lower rates. Such results confirm that the leading vehicle’s speed, deceleration rate, and distance significantly affect the braking judgment of the following driver. Therefore, improving the ability of the following driver to judge the dynamics of the leading vehicle is an important factor in reducing the number of rear-end collisions.
The brake light is a car component that enables drivers to judge the dynamics of the vehicles ahead of them. Although brake lights, as they function at present, indicate when a driver is pushing the brake pedal, they do not reflect how hard the driver is pushing [
3,
9]. Thus, following drivers have a difficult time judging the deceleration rate of the vehicle ahead of them via the brake light signal alone. They have to depend on other visual information, such as a change in the angular velocity during optical expansion, to confirm how quickly they are approaching the leading vehicle [
9,
16]. However, the change in the angular velocity of the leading vehicle might be insufficient to allow the following driver to judge the deceleration rate correctly [
3]. Hence, other studies have focused on ways to improve the design of the brake lights to include additional information that can enable following drivers to determine the deceleration rate of the leading vehicle [
17,
18,
19,
20].
From the perspective of visual characteristics, visual attention is easily attracted by items that are bright, colorful, and changeable, and these characteristics can be used to design visual warning systems [
21]. Wierwille et al. [
18] compared the conventional brake light and a flashing warning light at a 4 Hz flashing frequency on the following driver’s braking response time. Their results showed no significant difference between a conventional brake light and a flashing warning light on braking response time, although the following driver’s brake reaction time was reduced from 0.25 s to 0.35 s in the flashing warning light condition. Similar results have been found by Li et al. [
19]. They compared following drivers’ braking response times with a conventional brake light and a flashing brake light. In their study, brake lights flashed at 3.6 Hz when the deceleration of the vehicle was 0.6 g. Their results showed no significant difference between the conventional brake light and flashing brake light on brake response time, although the following driver’s braking response time was reduced by 0.14 s in the flashing brake light condition. In the study cited above, flashing light systems with low frequencies (3.6 and 4 Hz) were insufficient to reduce the reaction time of the following drivers significantly. By contrast, Sohrabi [
20] found a significant difference in the braking reaction time of the following driver between a conventional brake light and a brake light at a 7 Hz flashing frequency, with the braking response time for the flashing brake light significantly faster than that for the conventional brake light.
However, this does not mean that the flashing brake light at a high frequency (7 Hz) significantly improved the response time of the participants relative to a brake light at a low frequency (3.6 and 4 Hz), which can be discussed from several viewpoints. First, from the perspective of vehicle speed, Wierwille et al. [
18] and Sohrabi [
20] did not set the vehicle speed as an independent variable in their experiment. By contrast, Li et al. [
19] applied three vehicle speeds in their study: 60, 80, and 100 km/h. Second, from the perspective of deceleration rate, Wierwille et al. [
18] and Sohrabi [
20] did not consider the effect of the deceleration rate of the leading vehicle on the response time of the following driver, whereas Li et al. [
19] used three deceleration rates (0.4 g, 0.6 g, and 0.8 g) to simulate a situation that would be encountered in real-world driving environments.
Finally, from the perspective of brake light flashing frequency, each of these three studies [
18,
19,
20] used only one flashing frequency to assess the brake response time of the following driver. From these three points of view, it can be seen that Wierwille et al. [
18] and Sohrabi [
20] considered fewer factors in their experiment, which limits the application of their results. Furthermore, although Li et al. [
19] added independent variables for vehicle speed and deceleration rate, they used only one brake light flashing frequency (3.6 Hz) in their experiments, and therefore their findings could not explain the effect of higher or lower brake light flashing frequencies on the braking response time of following drivers. Moreover, although visual attention is easily attracted by flashing signals, the effect of different flashing frequencies on the response time is unclear. Therefore, further research is needed to understand the effect of different brake light flashing frequencies on the braking response time of following drivers considering different deceleration rates and the speed of the leading vehicle.
Considering the issues elucidated above and to address these gaps in the literature, this study investigated the effect of speed, deceleration rate, and brake light flashing frequency of the leading vehicle on the braking response time of the following driver. It is anticipated that the results of this study could be used as a reference for brake light design, which in turn could reduce the occurrence of rear-end accidents and improve driving safety.
2. Methods
2.1. Participants
This study recruited 24 participants (aged 25 to 30; 14 males and 10 females) who participated voluntarily in our experiment. The average age of the participants was 26.3 years, and each had at least five years and 60,000 km (over 50 km per work day) driving experience. The inclusion criteria of participants in this experiment were: (1) A valid C1 or C2 driving license for China, (2) normal or corrected-to-normal vision, (3) no anomalous color vision, and (4) absence of psychiatric and sleep disorders.
2.2. Driving Simulator
It is difficult to collect data such as vehicle speed, brake pedal force, and deceleration rate safely and efficiently in real-world driving environments [
22,
23]. Consequently, to achieve our objective, we used a driving simulator that is already widely applied in studies related to driving simulation [
24,
25,
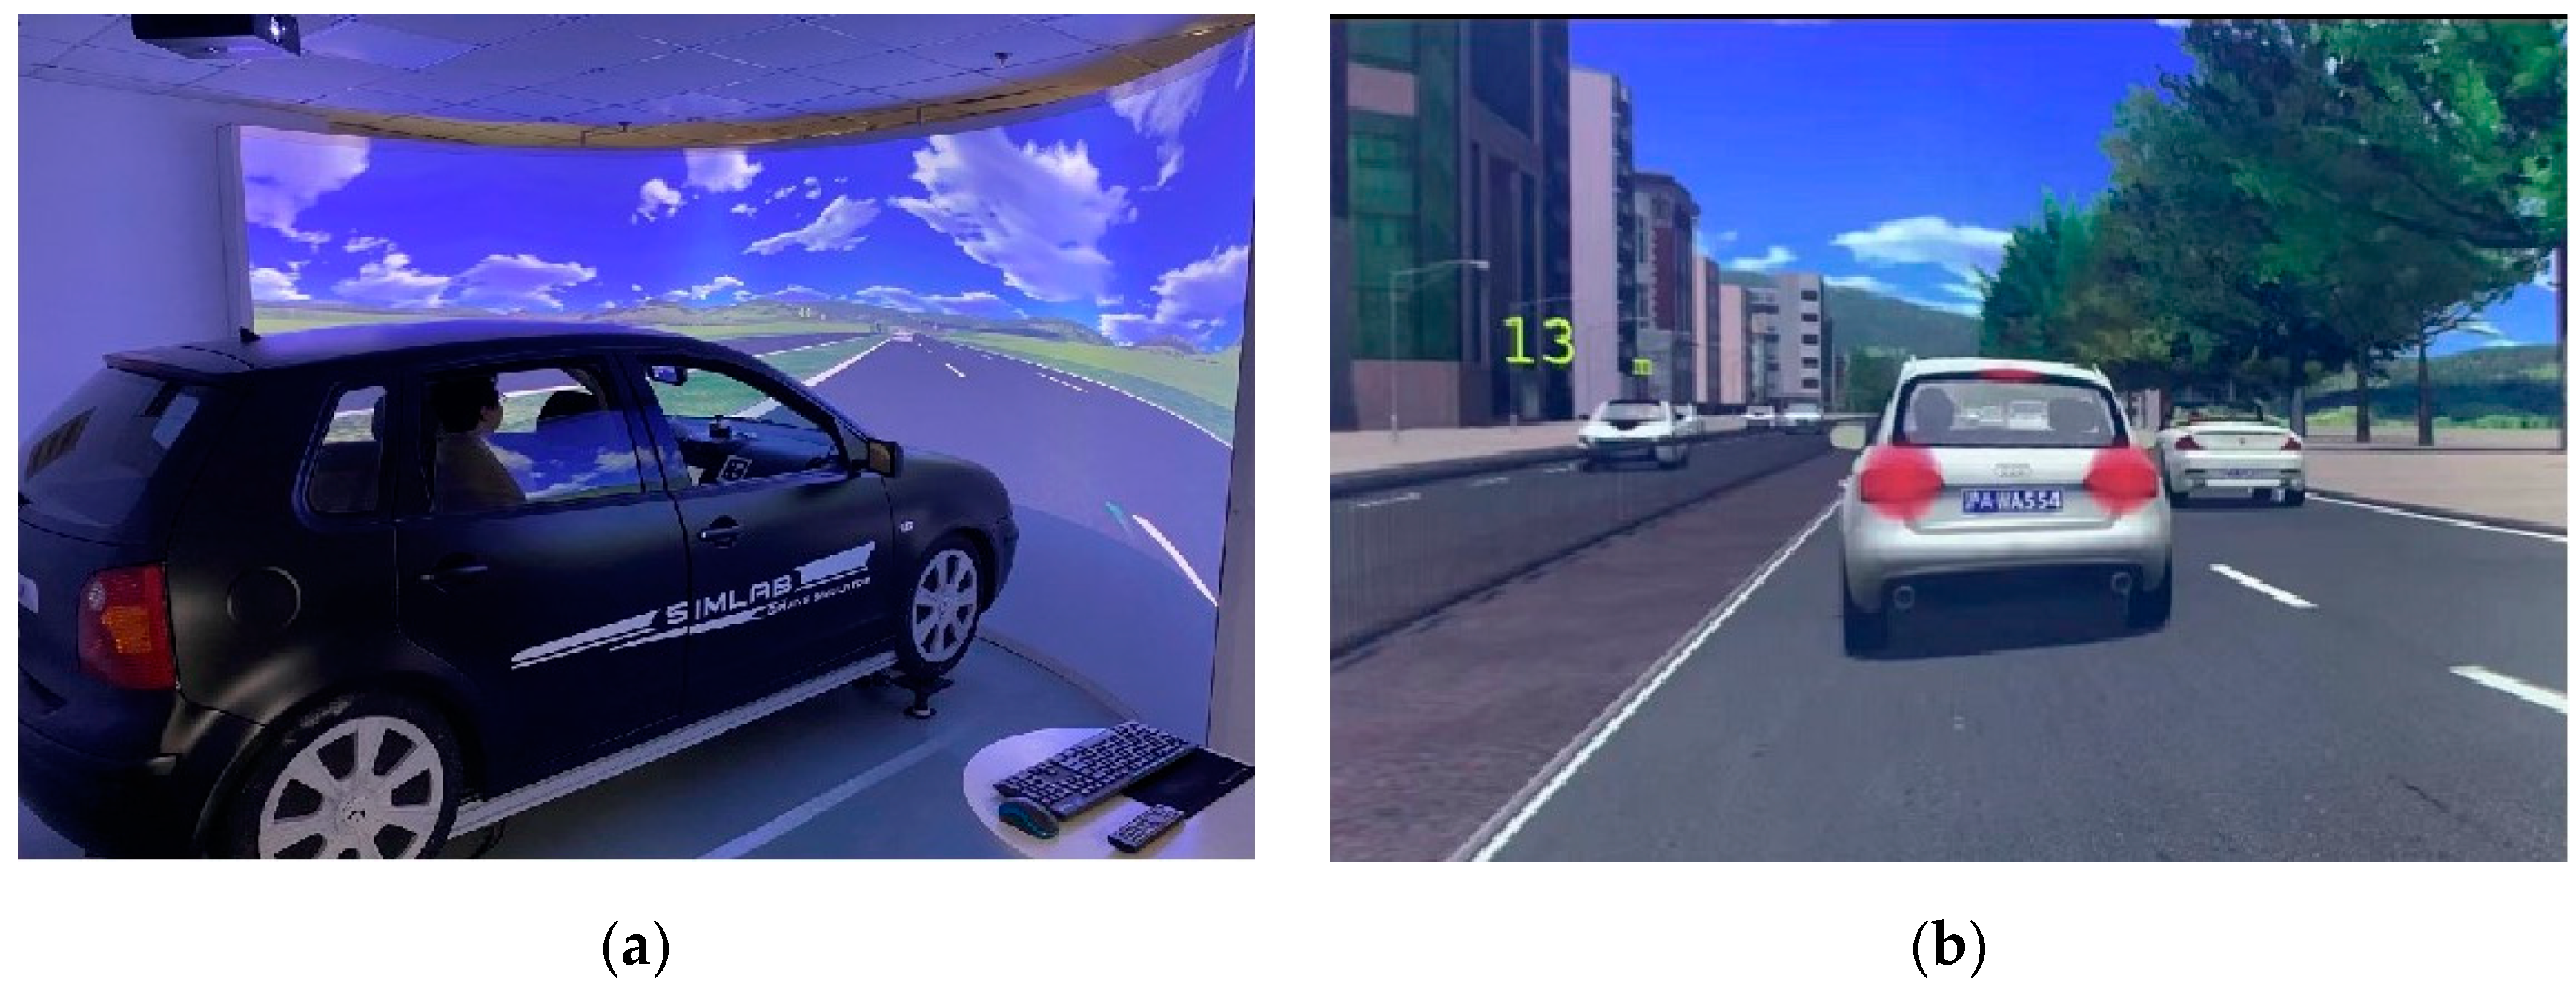
26]. Specifically, we used the SILAB driving simulator (WIVW GmbH, Veitshöchheim, Germany) to construct the driving environment for our experiment, located at INFO. instruments in Shanghai. We simulated the cockpit of a VW Polo vehicle with four real systems: steering simulation, brake and acceleration pedals, instrument control interface, and noise and vibration simulation systems. As such, the controls were those of an ordinary automatic vehicle. In addition, a 210-degree curved projection display (height: 2.62 m; radius: 2.8 m) presented the driving environment, and the distance from the participant to the display was 2.8 m. The driving environments were a 20-km long ordinary road and a 50-km long viaduct. The leading vehicle drove ahead at a speed of approximately 50 km/h on the ordinary road (80 km/h on the viaduct), passing was not allowed, and there were no intersections. The lanes on the ordinary road had a width of 3.25 m (3.5 m on the viaduct). On level and straightaways, any impact of horizontal bends and longitudinal slopes on the braking and steering of the drivers was removed. In addition, the field of view was wider and there were fewer buildings in the viaduct environment than in the ordinary road environment. The SILAB driving simulator and the ordinary road driving environment are shown in
Figure 1.
2.3. Experimental Environment and Design
We used two types of roads in Shanghai, ordinary roads and viaducts, to gain a complete picture of the response time of following drivers to the speed, deceleration rate, and flashing brake lights of the leading vehicle. Both the ordinary road and viaduct in the experiment had six lanes in two directions. An Audi A4 sedan, 4.4 m long and 2.05 m wide, was the leading vehicle in the experiment. The participants needed to follow the leading vehicle and maintain a safe distance (
SD) from it. The
SD was based on the road’s speed limit. According to the Shanghai traffic laws, the speed limit is 50 km/h on an ordinary road and 80 km/h on a viaduct, with SDs on an ordinary road and a viaduct of 13 m and 32 m, respectively. The calculation equation for
SD is as follows:
where
g = 9.8 m/s
2 and
= 0.8 (coefficient of friction).
With regard to deceleration rate, previous studies have indicated that different deceleration rates affect the braking response time of following drivers [
15,
19]. Wood and Zhang [
27] reported that the minimum and maximum deceleration rates among 2971 natural drivers were 0.23 g and 1.09 g, respectively. These represent the minimum and maximum deceleration rates that a driver may experience during normal daily driving. In addition, a deceleration of 0.6 g is generally assumed as the threshold for an emergency braking situation [
28,
29]. Notably, Li et al. [
19] used 0.6 g as the deceleration rate for emergency braking to trigger the flashing brake/hazard system. Considering the tuning of the driving simulator used in this study, we therefore utilized deceleration rates of 0.25 g, 0.6 g, and 1 g to present the braking situation of the leading vehicle and to measure the braking response time of the participants in our experiment.
Previous studies that have examined the flashing frequency of brake lights investigated frequencies of 3.6, 4, and 7 Hz [
18,
19,
20], with mixed outcomes. To verify the effectiveness of the flashing brake light, flashing frequencies of 4 and 7 Hz were used in this study. In addition, a low-frequency flashing of 2 Hz and a traditional brake light (0 Hz) were applied as extra factors in the experiment to provide a more comprehensive analysis of the braking response time of following drivers. Moreover, in addition to the effect of brake light frequency on braking response time, the speed and deceleration rate of the leading vehicle should be considered.
In light of the above, we investigated three independent variables: driving environment (road speeds), deceleration rate, and flashing frequency of the brake lights. We established two driving environments based on differing speed limits of 50 km/h (ordinary roads) and 80 km/h (viaducts). For the deceleration rate, we set three distinct levels: 0.25, 0.6, and 1 g. We set the flashing frequencies at 0 (conventional brake light), 2, 4, and 7 Hz because these were the critical flashing brake light factors. Accordingly, we employed a balanced factorial design with 2 (driving environment) × 3 (deceleration rate) × 4 (flashing frequency) combinations. All were within-subject factors.
2.4. Experimental Scenario and Procedure
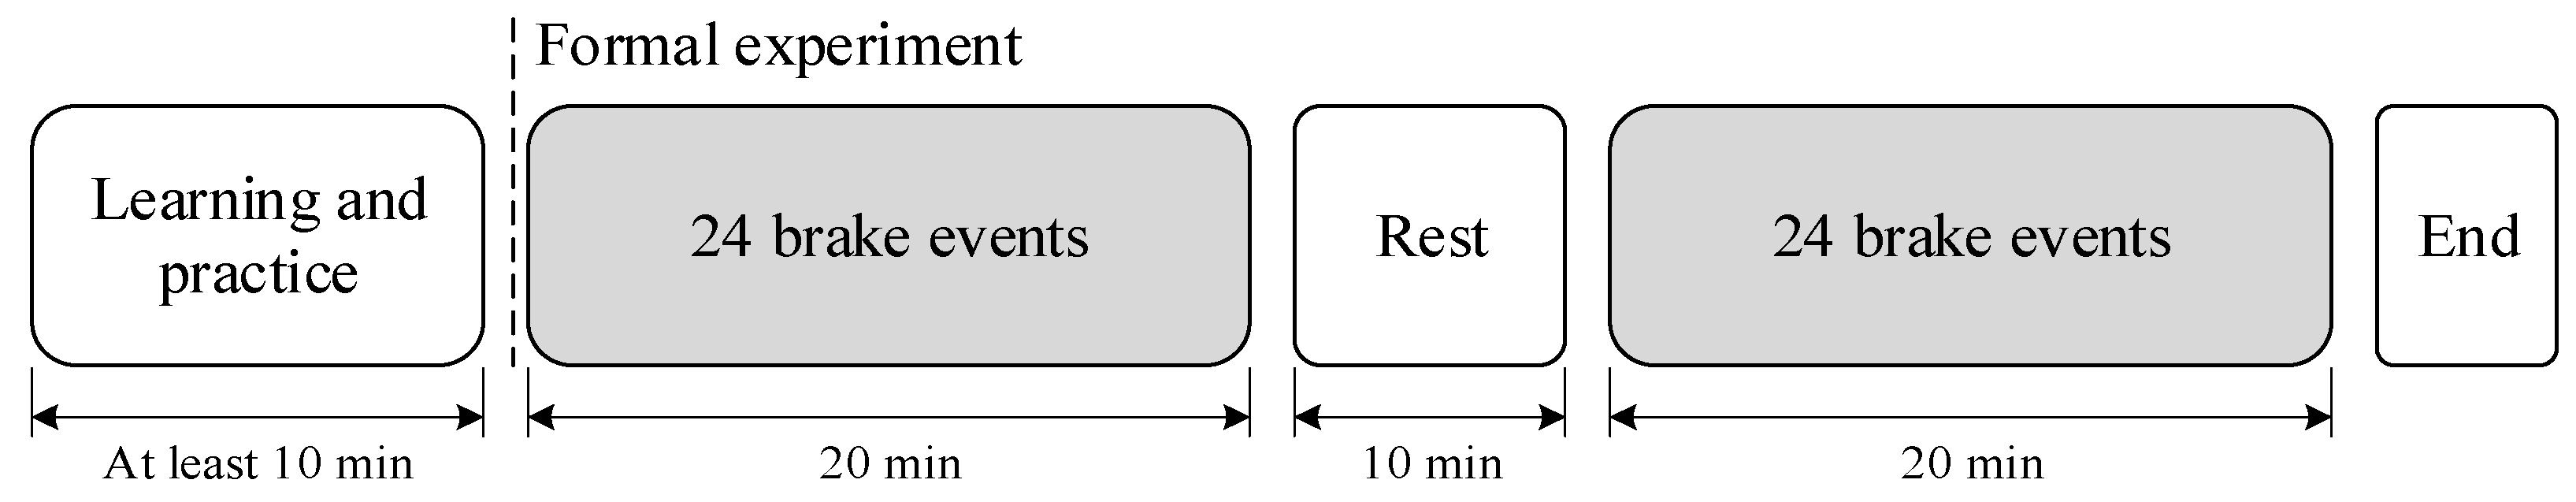
Before the formal experiment began, each participant was shown how to use the driving simulator and allowed at least ten minutes to become familiar with the characteristics of the simulation system, such as the accelerator pedal, brake pedal, steering wheel, driver’s seat, and the two driving environments, to minimize the effect of extraneous factors on the results of this experiment. If dizziness occurred during the experiment, the subject was withdrawn from participation. All participants signed informed consent forms.
As stated, we used two driving speed environments: 50 km/h (ordinary road) and 80 km/h (viaduct). The participants were randomly assigned to these two driving environments. Half of the participants began the formal experiment in the 50 km/h driving environment, while the other half began in the 80 km/h driving environment; these were then reversed in the second half of the experiment. The participants controlled the car’s speed and brake while following the leading vehicle at a requested distance (13 m in the 50 km/h driving environment and 32 m in the 80 km/h driving environment) on a straight road during the experiment, and they reacted to the leading vehicle’s braking in the same manner as in a real-world driving situation. In other words, the main task in the experiment was that of deceleration; when the brake light of the leading vehicle came on, the participants needed to determine whether there was a risk of collision and adjust the speed of their vehicle through the brake pedal to avoid a collision as soon as possible. The secondary task was to follow the leading vehicle and maintain a specific safety distance. The distance between the leading and following vehicles was displayed in real time on the left side of the driver’s field of vision (
Figure 1b). In addition, a “speed up” or “slow down” message was displayed near the real-time distance when the following vehicle was not within the specified distance.
There were twelve braking events randomly distributed in each driving environment, with each driving environment taking roughly 20 min to complete these events. The average interval of each braking event followed a normal distribution, with a mean of 1.2 min and a standard deviation of 0.6 min. After the twelve braking events, the participants were asked to step away from the vehicle and rest for 10 min before the next driving test. To immerse the participants in the experiment, the driving simulator provided engine noises and inertial forces as the vehicle accelerated or decelerated, engendering a more realistic driving experience. The experimental process is shown in
Figure 2.
2.5. Data and Statistical Analysis
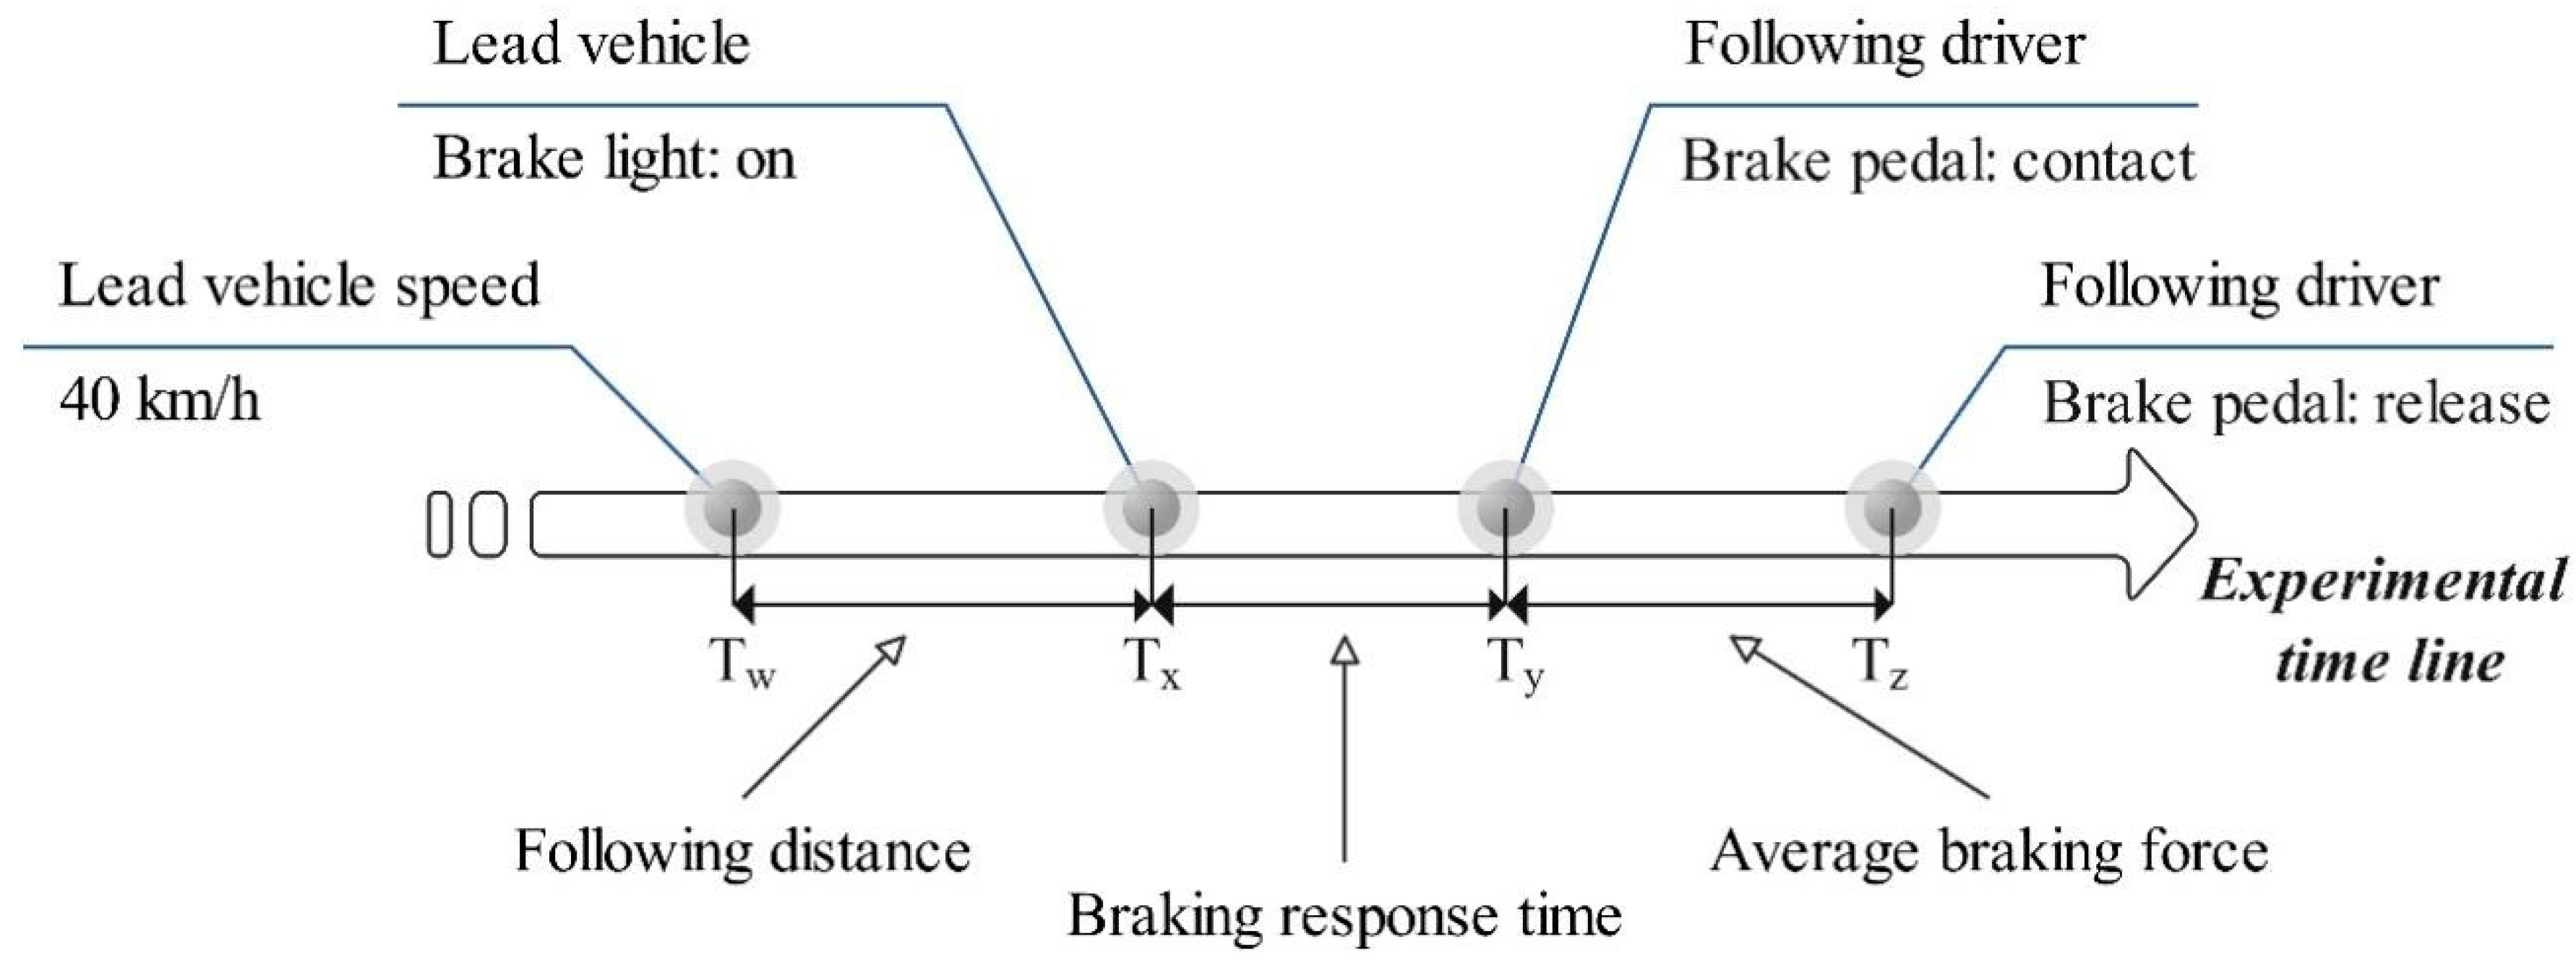
During the experiment, we calculated the influence of the flashing brake light under the different driving conditions on the following driver’s braking response time, defined as the interval between the activation of the leading vehicle’s brake light and the initial foot contact of the following driver with the brake pedal [
19]. We assumed T
x as the time when the leading vehicle’s brake light turned on and T
y as the time when the following driver’s foot initially contacted the brake. Thus, the braking response time (RT) was calculated as the difference between T
x and T
y. In addition, we calculated the ratio of the braking response time to each flashing brake light frequency to the response time to conventional brake lights to assess the efficiency of the flashing brake lights in improving the braking response time. We assumed T
z as the time when the following driver released the brake pedal the first time after T
y, while the average braking force was denoted as the force of the following driver depressing the brake pedal from T
y to T
z. We recorded the average following distance between the leading and following vehicles to evaluate the braking response time associated with the speed of the leading vehicle, the deceleration rate, and the flashing frequency. The relationship among T
x, T
y, and T
z is shown in
Figure 3. The calculations of braking response time, deceleration rate, average braking force, and average following distance are as follows.
where
denotes the response time in the conventional brake light condition and
denotes the response time in the brake light conditions with
i Hz flashing frequency, where
.
where
and
denote the different braking forces the following driver applied to the brake pedal at
and
, respectively, and
i denotes the time interval of the driving system sampling.
where
and
denote the real-time distances between the leading and following vehicles at
and
, respectively, and
i denotes the time interval of the driving system sampling.
We used the Kolmogorov–Smirnov test for our data analysis to evaluate the normality of the data, the Levene’s test for homogeneity of the variance, and analysis of variance (ANOVA) and post hoc analysis to verify the difference in the braking response time and average braking force under the different brake light flashing frequencies and deceleration rates in the 50 and 80 km/h driving environments. p-values were applied to evaluate the significance (p < 0.05) for each statistical test. We used SPSS 16 to perform all our statistical analyses.
3. Results
3.1. Braking Response Time
Generally, the ANOVA results in terms of significance level (p-values) and effect size (η2) showed that the driving environment (F = 97.319, p < 0.001, η2 = 0.162) and deceleration rate (F = 4.888, p = 0.008, η2 = 0.019) significantly affected braking response time and that there was an interaction among driving environment, deceleration rate, and flashing frequency (F = 2.598, p = 0.017, η2 = 0.017).
In addition, we separated the main effects of the braking response time into the two driving environments and analyzed them in terms of significance level (
p-values) and effect size (η
2). In the 50 km/h driving environment, the results show that while the deceleration rate significantly affected the braking response time (F = 5.388,
p < 0.05, η
2 = 0.041), there was no significant effect from the flashing frequency or from the interaction between the deceleration rate and flashing frequency on braking response time (
Table 1).
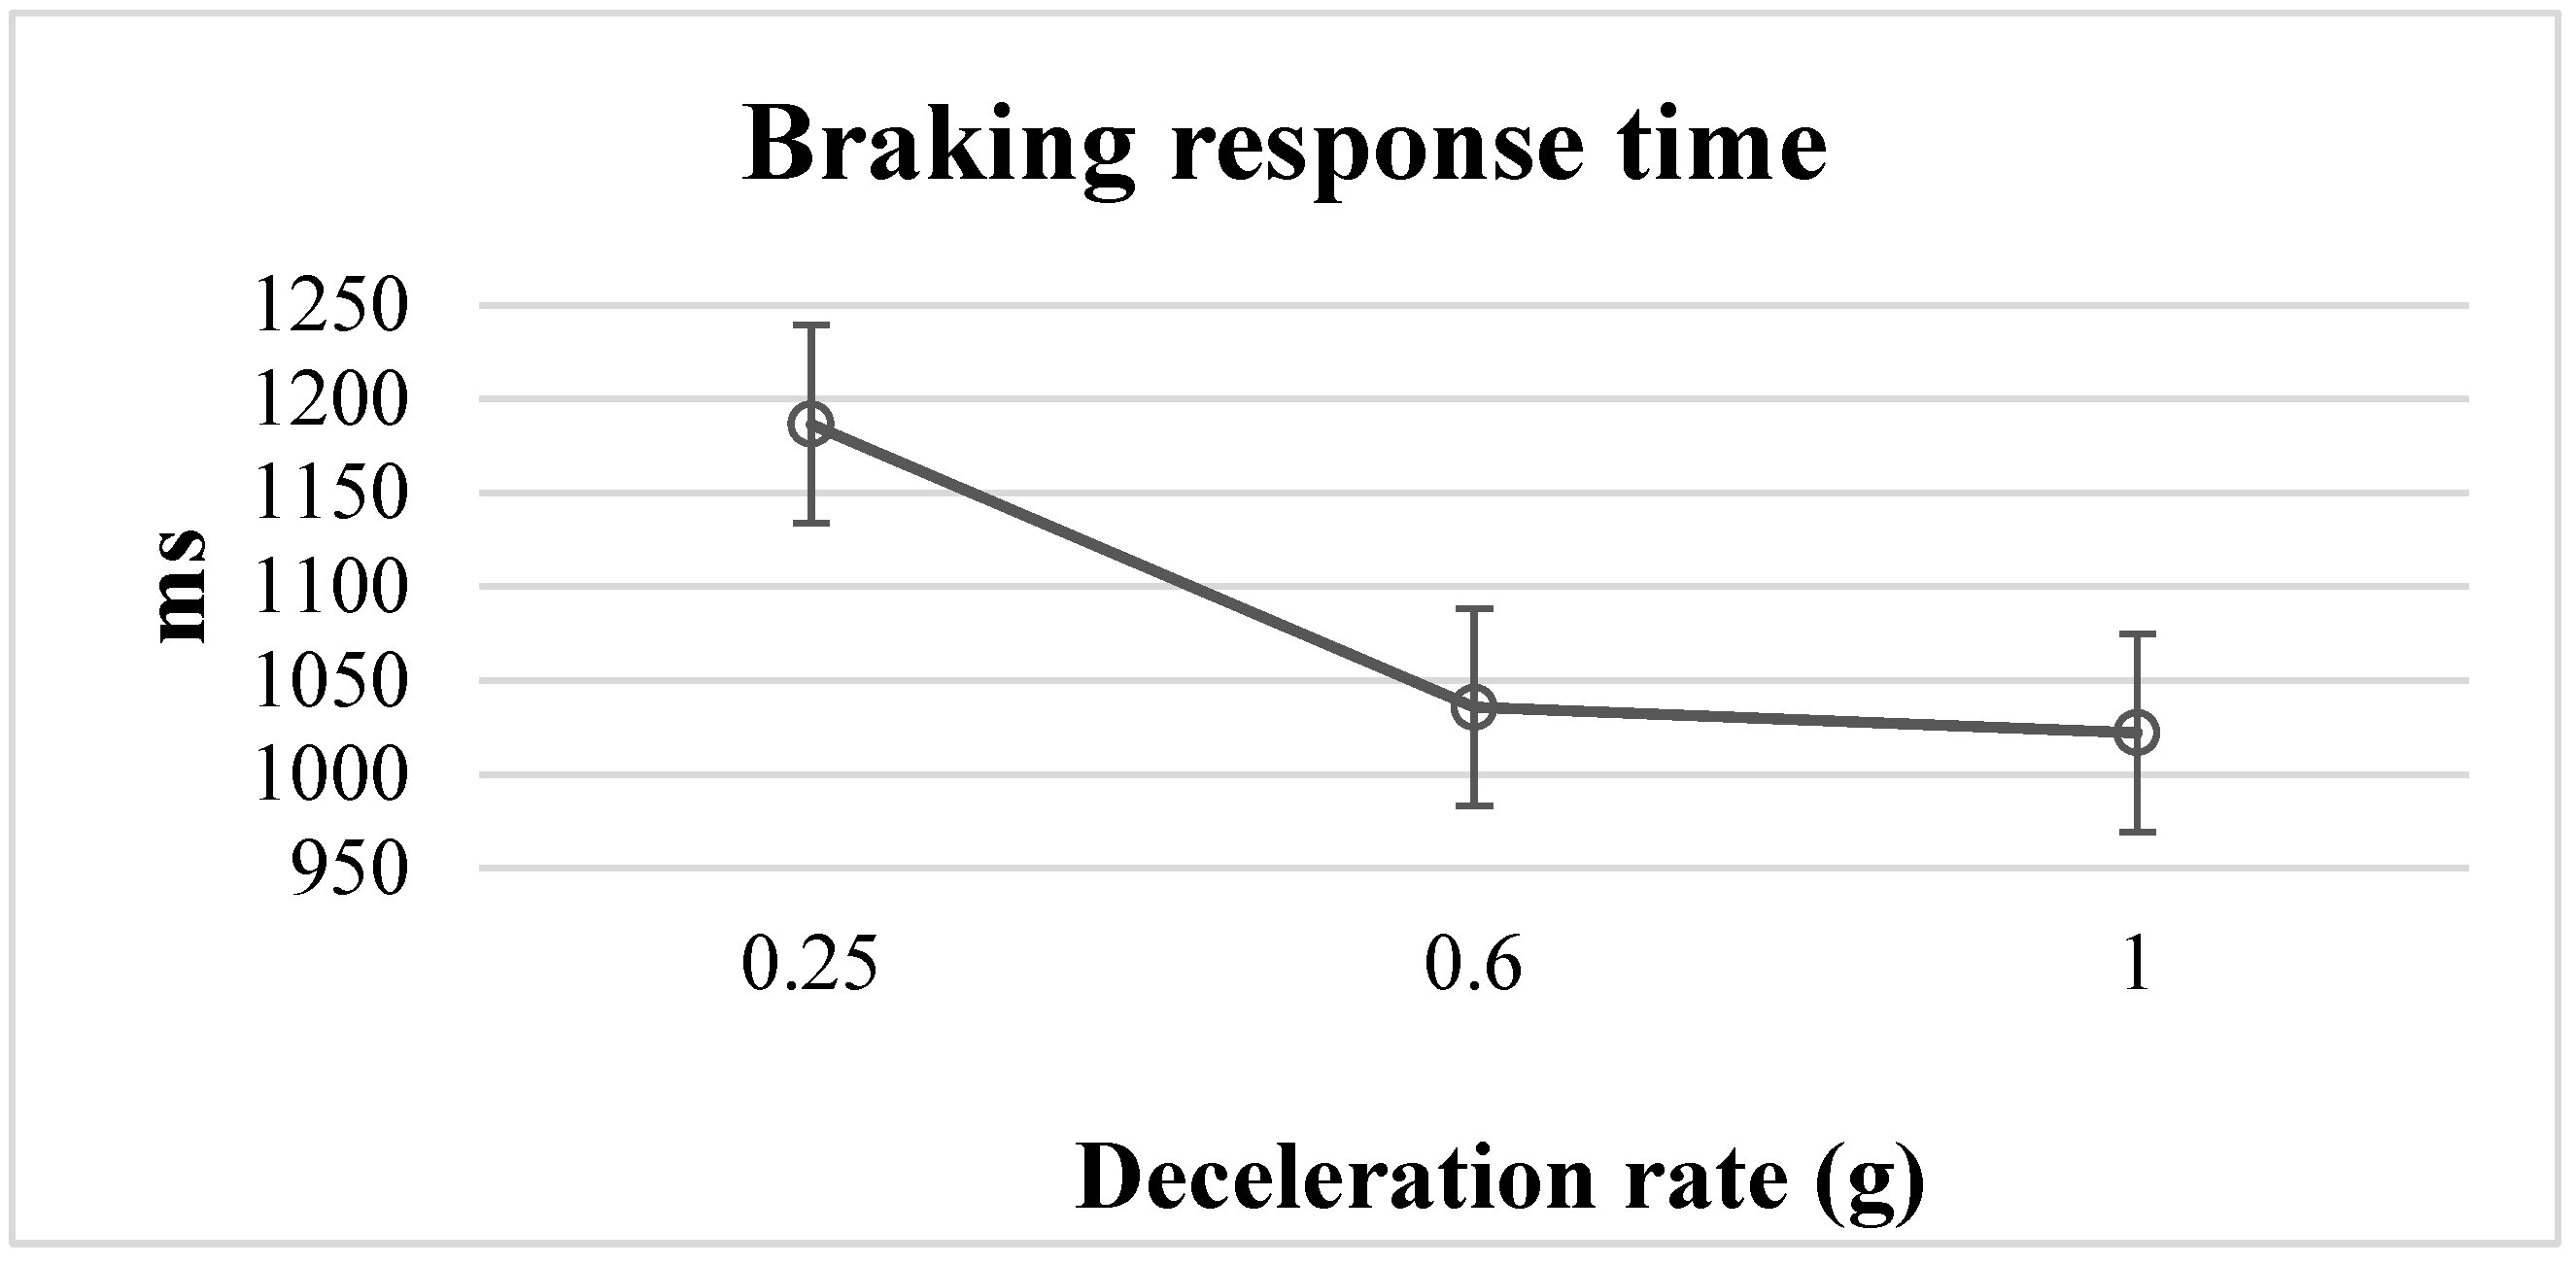
In the post hoc analysis results, there were significant differences between the deceleration rates of 0.25 g and 0.6 g (
p < 0.05) and the deceleration rates of 0.25 g and 1 g (
p < 0.05) on braking response times (
Figure 4). This confirmed that the braking response times for the events with the 0.6 g and 1 g deceleration rates were significantly faster than that for the 0.25 g deceleration rate. In the 80 km/h driving environment, there was no significant effect from the deceleration rates, the flashing frequencies, or their interactions on braking response time.
3.2. Average Braking Force
The ANOVA results in terms of significance level (
p-values) and effect size (η
2) showed that the driving environment (F = 45.197,
p < 0.001, η
2 = 0.082) and deceleration rate (F = 4.812,
p = 0.009, η
2 = 0.019) significantly affected the average braking force. The main effects of the average braking force were separated into the two driving environments and analyzed in terms of significance level (
p-values) and effect size (η
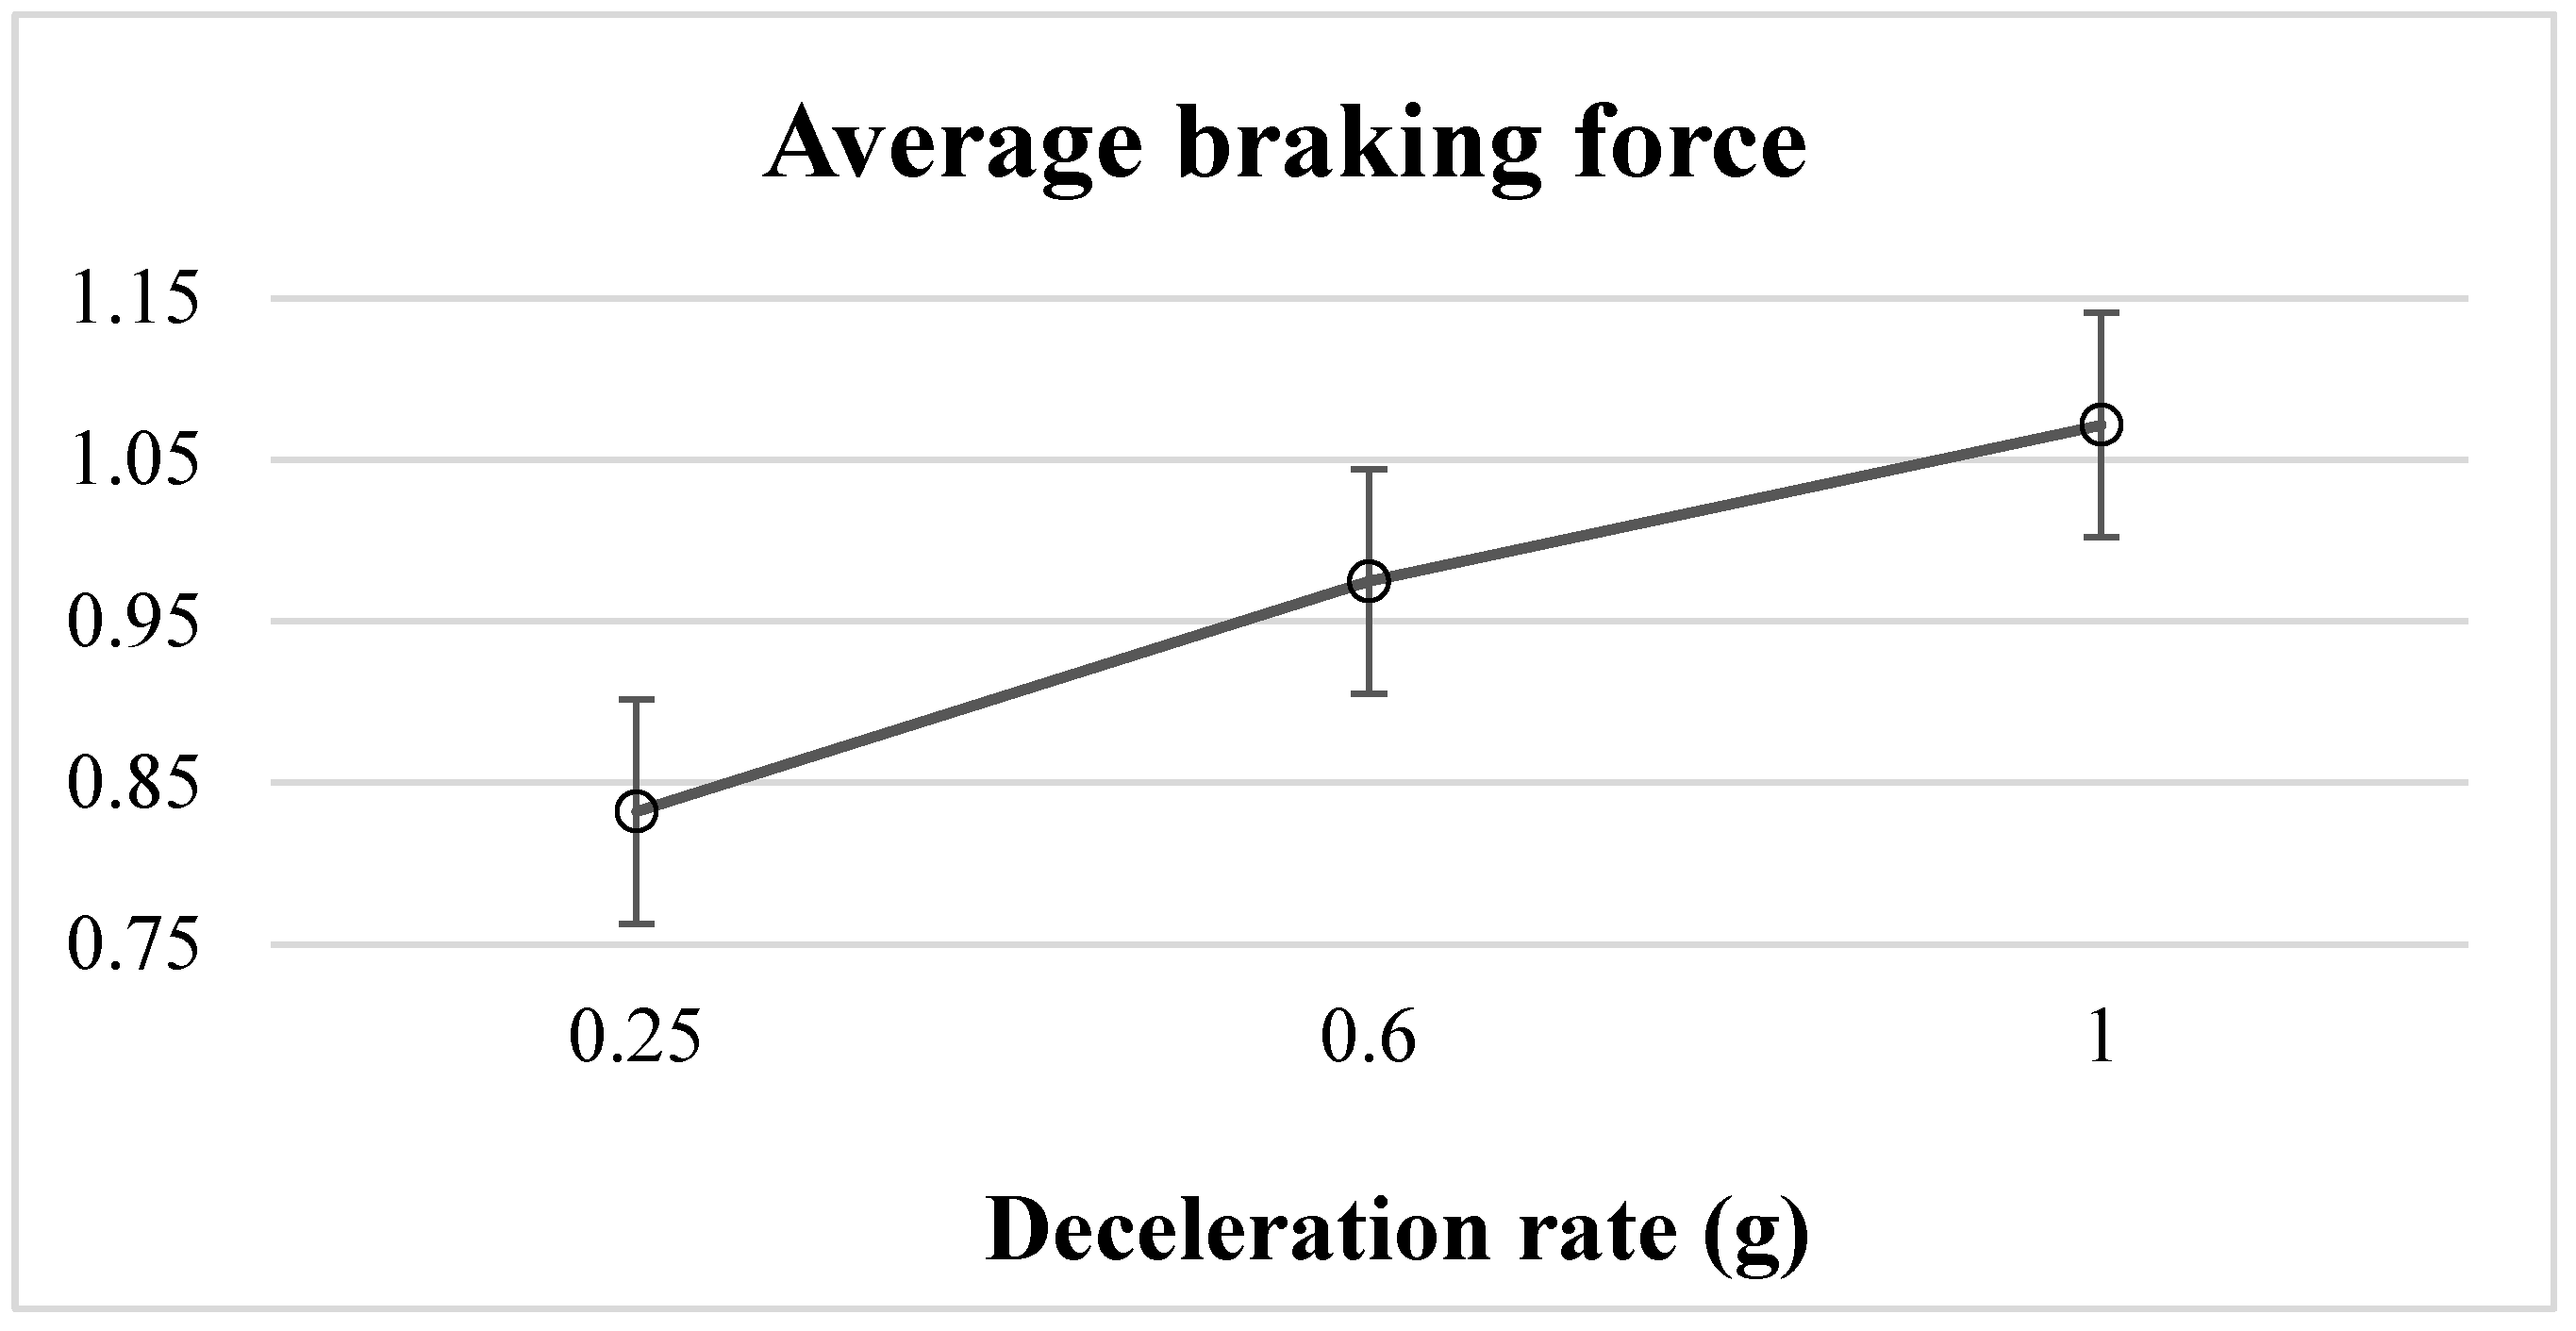
2). In the 50 km/h driving environment, the results indicated that while the deceleration rate of the leading vehicle had a significant effect on the average braking force (F = 4.229,
p < 0.05, η
2 = 0.032), there were no significant effects from the flashing frequencies or the interaction between the deceleration rate and flashing frequency on average braking force. Moreover, the results of the post hoc analysis showed that the average braking force in the brake event of the 1 g deceleration rate was significantly higher than that of the 0.25 g deceleration rate (
p = 0.011) (
Figure 5). With regard to the 80 km/h driving environment, there were no significant effects in terms of deceleration rate, flashing frequency, or their interaction on the average braking force.
3.3. Average Following Distance
In the 50 km/h driving environment, no significant effects were found in terms of the deceleration rate (F = 0.599, p > 0.05), flashing frequency (F = 1.138, p > 0.05), or their interaction (F = 2.635, p > 0.05) on the average following distance. We found the same results in the 80 km/h driving environment, where there were no significant effects from the deceleration rate (F = 0.896, p > 0.05), flashing frequency (F = 1.810, p > 0.05), or the interaction effect (F = 3.142, p > 0.05) on the average following distance.
3.4. Braking Response Time Ratio
The effect of the deceleration rate on the braking response time ratio in the two driving environments is summarized in terms of significance level (
p-value) and effect size (η
2) in
Table 2. In the 50 km/h driving environment, the results showed that the braking response time at 2 Hz flashing frequency was 1.81% lower than that at the 0 Hz flashing frequency. The braking response time at 4 Hz flashing frequency was 3.66% higher than that at 0 Hz flashing frequency, and the braking response time at 7 Hz flashing frequency was 7.7% higher than that at 0 Hz flashing frequency. However, we found no significant effect between the deceleration rate and the braking response time ratios at 2 Hz to 0 Hz, 4 Hz to 0 Hz, or 7 Hz to 0 Hz.
In the 80 km/h driving environment, the results showed that the braking response time at 2 Hz flashing frequency was 4.838% higher than that at 0 Hz flashing frequency, the braking response time at 4 Hz flashing frequency was 5.305% higher than that at 0 Hz flashing frequency, and the braking response time at 7 Hz flashing frequency was 7.546% higher than that at 0 Hz flashing frequency. Here, we again found no significant effect between the deceleration rate and the brake response time ratio at 2 to 0 Hz, 4 to 0 Hz, or 7 to 0 Hz.
5. Conclusions
In this study, we investigated the effect of four flashing brake light frequencies, three deceleration rates, and two following speeds on braking response times. To this end, we used the ratio of braking response time to evaluate the ratio of the reduction in response times under different brake light flashing frequency conditions. The results showed that the braking response in a 50 km/h driving environment was affected by the deceleration rate, whereas that in an 80 km/h driving environment was not. Furthermore, the flashing frequencies in the two driving environments did not affect the braking response times.
Visual attention is easily attracted to changeable items, and we considered this in our evaluation of the effect of flashing brake lights on braking response time. Although the experimental purpose, process, and methodology differed from those of previous studies, our results were similar in general; our main finding is that brake lights below a 7 Hz flashing frequency do not affect the braking response time of the following driver. Compared with conventional brake lights, however, flashing brake lights reduced the braking response time by 3–7% under different conditions, such as the speed and deceleration rate of the following vehicle, meaning that while flashing brake lights could reduce the brake response time, the effect was not obvious.
Currently, vehicles with autonomous driving system are not widely used, and people need to control vehicles based on visual cues in real-word driving environments. The brake light is one such visual cue, and has an important impact on the deceleration of the vehicle. It affects both the speed and flow of traffic, and may cause rear-end collisions and other traffic conflicts [
33,
34,
35]. Therefore, in order to further understand the impact of flashing brake lights on driving safety, further exploration of the issue in several research directions considering the limitations of this study is necessary. First, the effect of brake lights with a flashing frequency higher than 7 Hz on the driver’s braking response time; second, a higher or lower vehicle speed; third, the manner in which the flashing signal is displayed (co-displayed with the brake light or an additional display system); and fourth, an interaction analysis of the participants’ background and driving behavior, which might influence the results of braking response time. Finally, considering the visible differences between the simulated and real driving environments, it is important to verify that the experimental data from these two driving environments is consistent. It is anticipated that our study will lead to a deeper understanding of the behavior and responses of drivers in different driving environments, and that the driving environment will be redesigned and improved in accordance with the results, thereby improving traffic safety.


