Abstract
Social media have become an indispensable part of peoples’ daily lives. Research suggests that interactions on social media partly exhibit individuals’ personality, sentiment, and behavior. In this study, we examine the association between students’ mental health and psychological attributes derived from social media interactions and academic performance. We build a classification model where students’ psychological attributes and mental health issues will be predicted from their social media interactions. Then, students’ academic performance will be identified from their predicted psychological attributes and mental health issues in the previous level. Firstly, we select samples by using judgmental sampling technique and collect the textual content from students’ Facebook news feeds. Then, we derive feature vectors using MPNet (Masked and Permuted Pre-training for Language Understanding), which is one of the latest pre-trained sentence transformer models. Secondly, we find two different levels of correlations: (i) users’ social media usage and their psychological attributes and mental health status and (ii) users’ psychological attributes and mental health status and their academic performance. Thirdly, we build a two-level hybrid model to predict academic performance (i.e., Grade Point Average (GPA)) from students’ Facebook posts: (1) from Facebook posts to mental health and psychological attributes using a regression model (SM-MP model) and (2) from psychological and mental attributes to the academic performance using a classifier model (MP-AP model). Later, we conduct an evaluation study by using real-life samples to validate the performance of the model and compare the performance with Baseline Models (i.e., Linguistic Inquiry and Word Count (LIWC) and Empath). Our model shows a strong performance with a microaverage f-score of 0.94 and an AUC-ROC score of 0.95. Finally, we build an ensemble model by combining both the psychological attributes and the mental health models and find that our combined model outperforms the independent models.
1. Introduction
People’s psychological attributes and mental health issues can greatly influence their working performance in real life [1,2,3]. Psychological attributes [4] are essential properties of an individual which play vital role during her interactions in a society. Personality traits [5] are one of the most important psychological attributes which reflect one’s patterns of thoughts, behavior, and feelings. People may differ from each other in terms of personality traits because these traits might vary over time and across situations [6,7]. On the other hand, mental health is an integral part of overall health, which includes our emotional, psychological, and social well-being [8]. Mental health issues impact one in four people worldwide, yet access to care is challenging for those who suffer from them [9]. These illnesses are complex and can take many forms. There is a direct correlation between mental and physical health [10]. Several studies [11,12,13,14,15] have also described that psychological attributes and mental health significantly influence one’s performance in different real-life activities. A few studies [16,17] show strong association with students’ drop out rate and their mental health problems.
Similarly, Zhao et al. [11] show that personality traits and work performance have a strong relationship. Personality influences our eating habits and food choices [12], artistic and scientific creativity [13], and career selection [18]. Education psychology studies [1,19] also show that personality and self-efficacy have effects on students’ academic achievements. A more recent study [3] shows that depression and stress greatly affect students’ academic performance. In this paper, we predict students’ academic performance from their psychological attributes and mental health issues derived from Facebook interactions.
Pennebaker et al. [20] find that what people say and write tend to give information about their actual behavior. This finding indicates that what people write on social media may reveal their actual behavior. In fact, Back et al. [21] empirically showed that people tend to reflect their actual personality and behavior during Facebook interactions. Prior studies [22,23,24] also explored the association between mental health and social media interactions. For example, Choudhury et al. [22] examined the relationship between users’ depression and their Twitter social media platform interactions. In another study, Peng et al. [23] investigated the user’s mental health from profile details, behavioral attributes, and situation described in social media. However, we have found no prior study that made a bridge between students’ psychological and personality traits from the actual social media posts and academic performance.
In our study, we collect data of a total of 302 Facebook users. Then, we build a two-level hybrid prediction model to predict the level of academic performances (i.e., high, medium, or low) of students from their Facebook posts. In the first level, we extract 27,889 student posts to analyze their psychological attributes and mental health statuses. We also conduct a survey to collect the ground-truth data of Personality, Self-Efficacy, Depression, and Stress. Next, we build a non-linear regression model by using Bidirectional Long Short-Term memory (Bi-LSTM). In the second level, we evaluate four classification models comprised of one of the conventional multi-class models (K-Nearest Neighbors), one of the tree-based ensemble models (Random Forest), and two of the boosting-based ensemble models (i.e., adaptive boosting (AdaBoost) and light gradient boosting (LgBoost)) using the performance parameters (microaverage of recall, precision, and f-score). Figure 1 shows a high-level architecture of our prediction model. Here, the SM-MP (social media to mental/psychological) model represents the first level of prediction, and the MP-AP (mental/psychological to academic performance) model shows the second level of prediction. Finally, we develop a hybrid ensemble model through the stacking of K-Nearest Neighbors, Random Forest, and LgBoost models using a balanced weight distribution. Furthermore, we evaluate the developed models with 70 test participants to validate the accuracy of prediction.
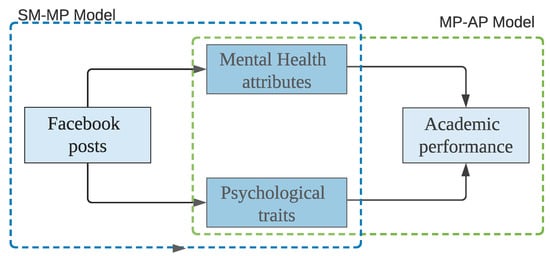
Figure 1.
High-level architecture of the academic performance prediction model.
In summary, we provide the following contributions:
- We conduct multi-disciplinary research that bridges between computer science and cognitive science.
- We build a new dataset that comprises students’ psychological attributes and mental health status (i.e., personality, stress, self-efficacy, and depression) and their academic performances, i.e., GPA.
- We build a two-level hybrid prediction model with a fusion of regression (level-1) and classification (level-2) that predicts students’ academic performances from their Facebook posts.
2. Background
Mental characteristics and personality traits may play an important role in how people make their decisions and perform an action in their real life. Personality traits are innate characteristics that guide people to behave in a certain way [25]. Furthermore, mental health disorders such as depression, anxiety, and stress may influence their performance. Therefore, we describe these concepts and related works on how social media can help detect these traits.
2.1. Depression
Depression is a common psychological disorder among undergraduate students and adults, characterized mainly by the persistence of sadness, feeling blue, and a loss of interest in daily activities [26]. According to Bondolfi et al. [27], depression makes people vulnerable to mental and physical health problems. Untreated depression is a common cause of suicide. According to the Substance Abuse and Mental Health Services Association (SAMHSA) (https://www.samhsa.gov/, accessed on 11 January 2022), 90% of the suicide cases are because of severe depression. People may encounter depression for several reasons. A person may feel depressed due to the death of an intimate person or loosing his job. An individual may feel depressed, despite that she may pass smooth life. Genetic behavior and environmental conditions may also trigger depression. The Major Depression Inventory (MDI) [28] is an approved scale to measure the level of depression of an individual. This inventory contains a total of 10 questions. The answer options for these questions range from 1–6 (Likert type scale). These questions ask users how they have felt in the last two weeks. For example, Have you ever felt low spirit or sad; Have you felt very restless; and Have you had trouble sleeping at night, are asked to the users.
2.2. Stress
Stress is the general reaction when any type of change occurs, which requires an adaption or response. McEwen et al. [29] find that the brain is the central organ of stress because brain points the threatening situations and stores them, which influences the psychological behavior of a person. People react to the changes with emotional, mental, and even physical responses. Even positive changes in our life can lead to stress. For example, a promotion at a job or giving birth to a child can significantly produce stress. If stress continues without any relief in the life of an individual, that may lead to distress. Moreover, distress may lead to headache, improper sleeping, and sexual dysfunction. Therefore, a person can commit self-injuries, suicide, or experience other harmful events. Toussain et al. [30] examine 148 young adults to find out the long-term effects of stress. They reveal that long-term stress may lead to worse psychological and physical health conditions. Cohen [31] designs a 10-item Perceived Stress Scale (PSS) scale. Respondents answer in a Likert scale of 1–5 for the PSS. These questions ask users about their feelings and thoughts during the last month. For example, the users are asked: How often have you felt nervous and stressed? how often have you felt that things were not going your way? How often have you been able to control irritations in your life?
2.3. Personality
Personality is a set of inherent characteristics that uniquely distinguish an individual from others. Azucar et al. [32] show that the Big Five model represents the overall personality traits of an individual. Big Five traits are stable for a person, or they may change slightly over the course of time. However, we may notice a change in personality traits due to a traumatic or life-changing experience. According to the Big Five model [33], there are five different traits: openness, extroversion, conscientiousness, neuroticism, and agreeableness. We describe briefly the Big Five traits as follows:
- Openness to experience: People who usually have strong imagination and who are eager to learn new knowledge generally possess a high score in openness. A person with a high openness score is usually insightful and imaginative.
- Conscientiousness: People who have a high conscientiousness score are generally organized and self-disciplined.
- Extroversion: The extroversion trait indicates being energetic, outgoing, and social. Extroverted people generally prone to sharing their experiences with others.
- Agreeableness: Agreeable people are likely to be friendly, compassionate, kind, and sympathetic with others. They also show kindness, affection, and warm behavior to others.
- Neuroticism: People with a high neuroticism score are generally emotionally unstable, nervous, sensitive, and moody.
The 10-Item Personality Inventory (TIPI) (http://gosling.psy.utexas.edu/scales-weve-developed/ten-item-personality-measure-tipi/ten-item-personality-inventory-tipi/, accessed on 11 January 2022) has been widely used to measure personality. This inventory has 44 statements, and the answer options are in a Likert scale of 1 to 5. Some example statements are: I see myself as Dependable, self-disciplined; I see myself as sympathetic, warm; I see myself as disorganized, careless.
2.4. Self-Efficacy
Self-efficacy [34] refers to an individual’s belief in his or her capacity to execute the behaviors necessary to produce specific performance attainments. A person with high score in self-efficacy has a strong judgmental process to execute a course of action to accomplish tasks. Ebstrup et al. [35] outline the 10-item psychometric scale, namely, the General Self Efficacy (GSE) scale designed to evaluate the optimistic self-confidence. The items explicitly refer to personal agency, i.e., the belief that one’s actions are responsible for successful outcomes, and has a Likert scale of 1–4 to answer. Some example statements are: I can always manage to solve difficult problems if I try hard enough; It is easy for me to stick to my aims and accomplish my goals; I can solve most problems if I invest the necessary effort.
2.5. Context-Based Word Embedding
Context-based Word embedding is the vector representation of a particular word in a document. The technique is capable of capturing the context of a word in a document in terms of semantic and syntactic similarity and its relation with other words. MPNet [36] is a pre-training model that combines masked language modeling (MLM) used in BERT [37] and permuted language modeling (PLM) used in XLNet [38] to convert sentences and paragraphs into a dense 768-dimensional vector space while capturing semantic information. Though XLNet addresses the limitation of neglecting dependency among the predicted tokens in BERT, it cannot leverage the full position information of a sentence, which results in the position discrepancy between pre-training and full-tuning. MPNet achieves the dependency among predicted tokens through permuted language modeling (vs. MLM in BERT) and takes auxiliary position information as input to make the model see a full sentence, thus reducing the position discrepancy (vs. PLM in XLNet) [36].
3. Related Work
We observe several studies [22,39,40] that describe the prediction of people’s mental health status from their social media posts. For example, Choudhury et al. [22] predict depression based on the data extracted from social media platform, Twitter. The authors analyze linguistic cues and signals from users’ text by using SVM classifier. In another study, Choudhury et al. [40] predict different types of emotions by analyzing text from Twitter posts. They collect the ground-truth data of Twitter users on depression by crowd-sourcing. They build an SVM classifier to predict depression with a high level of accuracy (73%). Park et al. [39] find that normal individuals exploit Twitter for gaining information, while depressed individuals use it as an instrument for social consciousness and emotional interchange. Tan et al. [41] find a relationship between users’ value and behavior to visit national park services among a total of 413 tourists.
Peng et al. [23] conduct research where they investigate users’ mental health conditions by using their micro-blog texts, profile details, and behavioral attributes extracted from their social media. They build multi-kernel SVM models to choose the optimal kernel for individual attributes in order to determine the depressed user. They compare their model with single-kernel SVM [42], KNN [43], Decision Trees [44], Naive Bayes [45], and a multi-kernel SVM model [46] for classifying depressed people with a reduced error rate to 16.54%. Dinakar et al. [47] study teenagers suffering from depression who seek help on the Internet. They build a machine learning model for investigating the main factors for stress of teenagers. They use supervised and unsupervised models for predicting depression. Choudhury et al. [48] predict human effective states from their social media data.
Pak et al. [49] collect a total of 300,000 tweets that are divided into 3 sets of documents: negative, positive, and factual. TreeTagger classifier is then used based on the multinomial Naive Bayes classifier, which uses N-gram and POS tag features. Gao et al. [50] show a computational model to predict a user’s attitude in terms of sensation, opinion, and probability of action on contentious social media subjects. We also observe a few studies [22,51] that focus on defining the mental and behavioral changes of new mothers in prenatal postpartum phases using their tweets. The researchers predict activity, emotion, and linguistic style measurements by three different classifiers. In another study on stress [52], the authors investigate post-traumatic stress disorder, a severe disease influencing millions worldwide, especially among military professionals.
In the light of the above discussion, we find that none of the previous studies have been conducted to predict users’ academic performance from their psychological attributes and mental health status derived from social media. We build a two-level hybrid classification model with the fusion of classification and regression models. The regression model generates the mental health and psychological attributes at the first level using the Facebook posts of an individual student. Then, a hybrid ensemble classification model predicts the academic performance of that student. To the best of our knowledge, our work is the first study that exploits semantic relationships (i.e., MPNet) from Facebook statuses to predict users’ academic performance.
4. Methodology
In this section, we describe the different steps of our proposed technique. First, we conduct a survey to assess psychological and mental health conditions of users. After that, we collect the Facebook interactions (i.e., posts) of these users. Finally, we build the prediction model for Facebook interactions and psychological attributes and mental health status. Towards this direction, we perform the following steps:
- Collecting and pre-processing dataset. We collect the users’ textual content using the downloaded dataset provided by each individual user. Users were contacted virtually, and they provided their dataset themselves.
- Feature selection. We find two different levels of correlations: (1) users’ social media usage and their psychological attributes and mental health status and (2) users’ psychological attributes and mental health status and their academic performance i.e., GPA. We use Pearson’s correlation coefficient [53] to select the significant features for psychological attributes and mental health status and GPA.
- Building model. We build a two-level hybrid model to predict the GPA from a student’s Facebook posts: (1) from Facebook posts to mental health and psychological attributes (SM-MP model) and (2) from psychological and mental attributes to academic performance (MP-AP model). For the sake of brevity, throughout this paper, we mention the models of Social Media to Mental and Psychological attributes and Mental and Psychological attributes to Academic Performance as the SM-MP and MP-AP models, respectively..
- Model validation. We investigate our SM-MP model, and find the R2 as 35.21%. In the MP-AP model, we achieve an AUC-ROC score of 0.95. We also test our method using a real-life test case, which shows the effectiveness of our proposed approach.
4.1. Collecting and Pre-Processing Dataset
We invited a total of 357 students from the Faculty of Science, Engineering, and Economics of United International University (https://www.uiu.ac.bd/, accessed on 11 January 2022) to participate in our research. Among them, 25 students did not show interest to attend the survey and 30 students did not agree to share their Facebook data. Thus, with the remaining 302 students (male = 178, female = 124), we conduct the survey in person or by using a Google Form. These students also provide us their extracted Facebook posts. Table 1 presents the statistics of students’ Facebook posts.

Table 1.
Statistics of Facebook dataset.
We recruited students by using the judgmental sampling [54] technique. Since participants needed to attend our study carefully in several surveys (i.e., MDI, PSS, IPIP, and GSE) and share their Facebook statuses, we conveyed that this study is going to investigate the relationship between students’ academic performance and their psychological attributes and mental health. They understood the necessity of this study and attended this study with interest and sincerity. Thus, we consider that a non-probability sampling such as judgmental sampling is the reasonable technique in our context [55]. We obtained ethical approval from the Institute of Advanced Research (IAR) (https://iar.uiu.ac.bd/, accessed on 11 January 2022) of the university. We explained the purpose of the study to the participants and also mentioned that their data will be securely stored and will not be distributed to others. We also assured that the data will be anonymous before publishing the results of the survey.
We collected users’ data in two steps. In the first step, we conducted a survey to measure users’ psychological attributes and mental health status. We performed surveys in either the on-site or online modes to collect the ground truth data. In our questionnaire, we had a total of 74 items: for stress (10 items), depression (10 items), self-efficacy (10 items), and Big Five personality (44 items). In the second step, we requested the users to provide us with their Facebook posts by downloading them as a compressed folder from the settings option of their Facebook profiles. The Facebook data were collected on April 2021, and due to the pandemic situation, the users were contacted through virtual meetings or phone calls. Additionally, with due permission from the students, we collected their academic results (i.e., GPA of Spring 2021). We computed the Cronbach’s alpha test of users’ answers for the psychological and mental health questionnaire. Cronbach’s alpha [56,57] estimates the internal consistency of reliability of test scores. We found the score of the tests to be in the range of 0.50–0.65; the study of Chen et al. [56] shows that these scores are acceptable.
We have utilized the Facebook dataset from those users who attended the survey and provided us with their Facebook posts. We pre-processed these posts using regular expressions to remove all the URLs, default “message“ tags, punctuation marks, unnecessary white spaces, and empty strings. Our data contained a few local languages. We detected non-English languages by using a python library TextBlob (https://textblob.readthedocs.io/, accessed on 11 January 2022) and discarded those contents. We also used a custom dictionary to convert the short form of a regular word into a typical word. For example, “n8“, “bro“, “m“, “u“ are converted to “night“, “brother“, “am“ and “you“, respectively. Finally, we used the popular spaCY (https://spacy.io/, accessed on 11 January 2022) library “Lemmatizer“ to lemmatize the text posts.
4.2. Feature Selection
In this section, we describe the techniques of how we selected the relevant features for building our model. Students’ Facebook posts contain textual content. To feed these data, we converted the text into vector representations using sentence transformer (MPNet) [36], a context-based word-embedding technique. We used MPNet because it achieves the dependency among predicted tokens through permuted language modeling (vs. MLM in BERT) and takes auxiliary position information as input to make the model observe a full sentence, which reduces the position discrepancy of the model (vs. PLM in XLNet). As we used a context-based word-embedding technique, additional feature selection methods were not required. In the second level, we identified important features to predict users’ academic performance from their psychological attributes and mental health status. Since both of the dependent (i.e., academic performance) and independent (i.e., Big5, Self-Efficacy, Depression, and Stress) variables were continuous, we used Pearson’s correlation coefficient. We selected relevant attributes that were strongly related to our dependent variable (i.e., GPA). Table 2 presents the correlation between psychological attributes and mental health status and academic results (i.e., GPA).
Table 2.
Pearson’s Correlation coefficients between psychological attributes and mental health status and academic performances. , .
4.3. Building Models
In this section, we describe the process of building our models. In the first step, we built a regression model from the social media dataset to mental health and psychological attributes (SM-MP model). In the next step, we built a classifier model to predict the students’ academic performance levels (High/Medium/Low) from their psychological attributes and mental health status (MP-AP model).
4.3.1. SM-MP Model
After cleaning the texts, we applied MPNet by using Python’s SentenceTransformers framework (https://www.sbert.net/docs/pretrained_models.html, accessed on 11 January 2022. We imported one of the versions of MPNet named all-mpnet-base-v1 (https://huggingface.co/sentence-transformers/all-mpnet-base-v1, accessed on 11 January 2022) as the pre-trained model base and extracted a dense 768-dimensional vector space while capturing the semantic information for the input text. We saved the vectors as a pickle file in our local Google drive.
We fed the dataset, which had a dimension of 44,951,024, to the word-embedding layer. In our Facebook dataset, we found that an individual student had a total of 4495 maximum words in his or her statuses. Each word is represented by 768 vectors. Then, the output was fed to a BiLSTM layer having 64 neurons with the return sequence set as True. The BiLSTM gave an output of (None, None, 128) dimension, and it contained 557,568 parameters. We used the Dropout [58] technique for regularization to avoid overfitting during training phase of the neural network. A dropout layer does not change the dimensions of the data, and it has zero parameters. We fed the output to a new BiLSTM layer having 32 neurons. This layer gave an output shape of (None, 64), and the number of the parameters was 41,216. Then, the output was fed to 3 different dense layers with 256, 128, and 1 neurons, respectively. We used mean square error [59] for loss function and Adam with learning rate = 0.0005 as an optimizer. We used tanh [60] as an activation function for the hidden layers. For the output layer, we used Linear [60] activation function. Figure 2 demonstrates the architecture of predicting mental health and psychological attributes from Facebook posts.
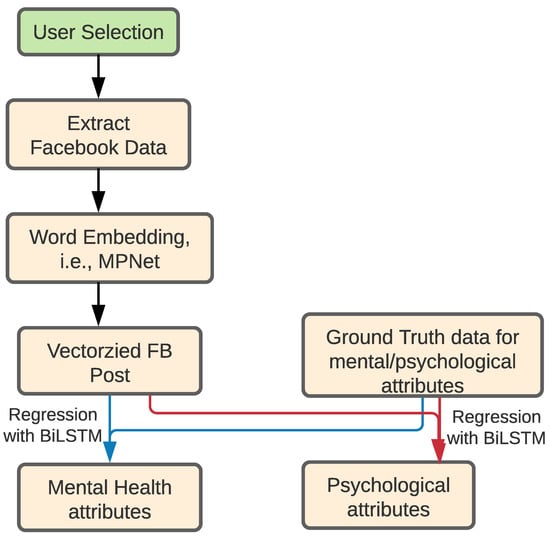
Figure 2.
Architecture of predicting mental health and psychological attributes (SM-MP) from Facebook posts.
Table 3 shows that our BiLSTM model demonstrates the best performance among the independent models. We used mean square error [61] for loss function and Adam with learning rate = 0.001 as an optimizer. We executed our model with distinct values to find the value that shows the best performance while keeping the training time to a minimum. We executed the models with smaller values of 0.01 and 0.001. We used tanh [60] as an activation function. The primary benefit of using tanh is that it is zero-centered, which made it easier to model inputs that had negative, neutral, and positive values. We did not use Softmax because, typically, it is used for multi-class classification with cross entropy loss function, while we compute non-linear regression with mean square error as loss function.
Table 3.
Strength of the regression models from MPNet to psychological attributes and mental health status.
The Sigmoid was not used because it is not zero-centered, and it gives output values between 0 and 1. We did not use ReLU because of the Dying ReLU issue, where some ReLU neurons fundamentally die for all inputs and stay inactive regardless of the input value. We found from different models (see Table 3) that self-efficacy shows the strongest potential (R2 0.35), while neuroticism shows the weakest potential (R2 0.19).
4.3.2. MP-AP Model
After selecting the relevant features, we built a multi-class classifier model (MP-AP model) from users’ psychological attributes and mental health status to their academic performance. The outputs of the psychological attributes and mental health status from the SM-MP model were used as the independent features, whereas the level of academic performance was used as the dependent feature in terms of three different labels: low (less than 2.5), medium (between 2.5 to 3.5), and high (greater than 3.5).
We compared four classification models to find out the best-performing model for predicting the academic performance. One conventional multi-class model (K Nearest Neighbors), one tree-based ensemble model (Random Forest), and two boosting-based ensemble models (AdaBoost and LgBoost) were evaluated to find out the best-performing model. We evaluated the models using an 80/20 train–test split by using the extracted output of the mental health and psychological features. Being a multi-classification problem, the performance of the models were compared using the microaverage of the f-score and area under the receiver operating curve (AUC-ROC).
Among the models, AdaBoost performed the poorest, with a score of 0.69. In contrast, KNN showed moderate performance with a score of 0.87, whereas Random Forest and LgBoost outperformed those models with scores of 0.91 and 0.89, respectively. Furthermore, we developed a hybrid ensemble model through the stacking of KNN, Random forest, and LgBoost using balanced weights, as shown in Figure 3. Table 4 shows the performance of the models measured using the microaverage of f-score of the test samples. The developed multi-variant ensemble model outperformed the previously discussed models with an f-score of 0.94, which signifies the superiority of the model with an increase of 0.03 in terms of f-score from the second best-performing model (RF). Additionally, the model demonstrated an AUC-ROC score of 0.95 (see Figure 4). With a score of 0.93, Random Forest performed closest to the developed ensemble model, and AdaBoost performed the poorest with a score of 0.67.
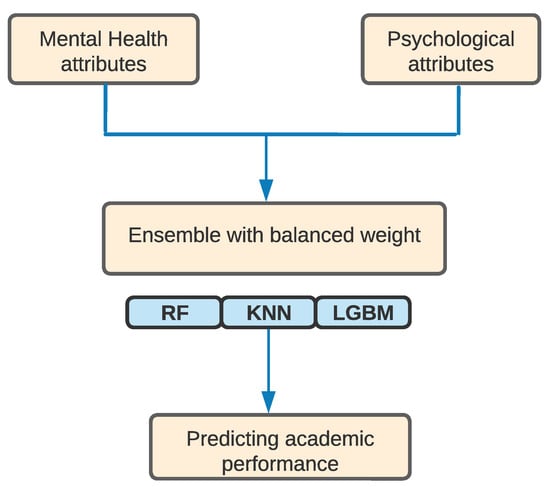
Figure 3.
Architecture of predicting users’ academic performance (i.e., high, medium, and low) from mental health and psychological attributes (MP-AP).
Table 4.
Comparison of different models using performance parameters.
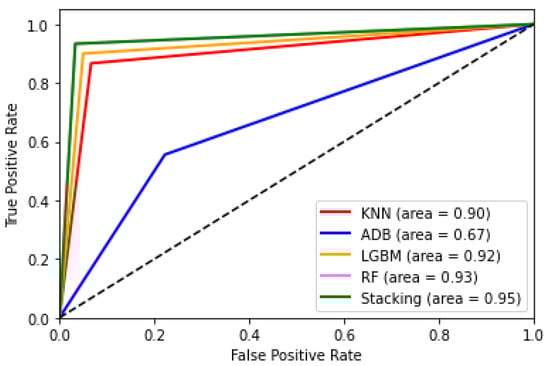
Figure 4.
Comparison of different models using AUC-ROC.
4.4. Evaluation
In this section, we validate the developed models by collecting the actual psychological attributes and mental health status and level of academic performances of the students who were not included in the data collection procedure and comparing these data with the prediction of the developed models. For the validity of our hypothesis test, we used Chi-square and Paired t tests. The tests actually compared the difference between our predicted and actual psychological attributes, mental health, and academic performance results. We conducted the validity tests of the above hypotheses [57,62]. We investigated the performance of the SM-MP model using Paired t test in case of predicting the psychological attributes and mental health status of a student from his Facebook post. On the other hand, we applied Chi-square tests to understand the validity of the MP-AP model by using the using the explored psychological attributes and mental health status in the previous step. Additionally, we compared the performance of the developed model with two of the baseline models using the Average R2 (in case of SM-MP) and AUC-ROC (in case of MP-AP) analysis of the test data.
4.4.1. Validation through Comparing
Our step-by-step validation process has been described in Figure 5. We first obtained a total of 70 university students’ GPA to validate our prediction method and labeled them as high (greater than 3.5), medium (between 2.5 to 3.5), and low (less than 2.5). We present the statistics of the collected data from users in Table 5. We collected Facebook posts of these 70 students by using the Graph API explorer. Additionally, we collected the actual scores of these psychological attributes and mental health status by using various surveys (MDI, PSS, TIPI, and GSE). Then, we applied Sentence Transformer (MPNet) model over their Facebook posts. Later, we fed the feature vectors into the SM-AP model (Level 1) and predicted the scores of psychological attributes and mental health scores. We compared the actual values of the psychological attributes and mental health status and predicted the scores of the psychological attributes and mental health status. Then, we conducted Paired t tests [63] to check if the means of these sets of psychological attributes and mental health statuses are significantly different by using IBM SPSS. The results showed that the p-value was <0.17 which is not statistically significant. The result of the Paired t test indicated that our hypothesis accepts the null hypothesis (i.e., rejects the alternate hypothesis), which claims that there is no difference between the actual and predicted level of students’ results. Then, we fed the relevant features, i.e., Depression, Self-efficacy, Conscientiousness, and Agreeableness (see Table 2), to the MP-AP (Level 2) model to predict the level of academic performance of the participants. We compared the actual level and the predicted level of academic results to validate the performance of the model by using Chi-Square test [64], since both of the levels are categorical in nature. Then, we obtained that the p-value was <0.11, which also established that our hypothesis accepts the null hypothesis (i.e., rejects the alternate hypothesis). In summary, we can claim that our predicted and actual level of academic performances have no statistical difference.
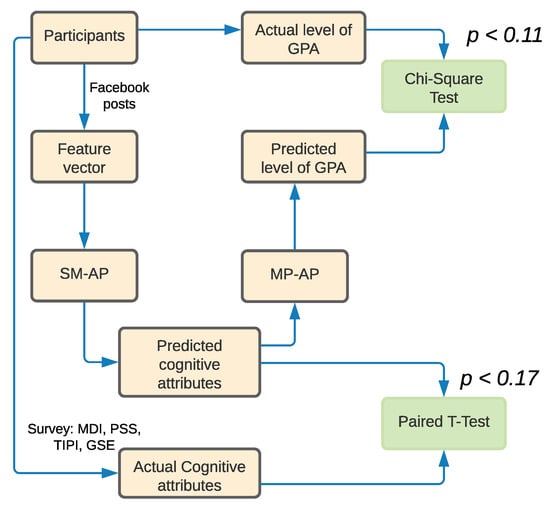
Figure 5.
Design of the evaluation study to validate the model using real-life samples.
Table 5.
Statistics of evaluation dataset.
4.4.2. Comparison with the Baselines
For the first baseline, we assumed that the academic performance can be predictable with the Linguistic Inquiry and Word Count (LIWC)-based technique. We selected LIWC as a baseline model because the technique has been proven successful in analyzing and predicting users’ psychological states from their word usage pattern [65,66]. We also analyzed our text by using Empath [67], for converting users’ posts into lexicon-frequency-based approach. Empath generates new lexical categories on demand.
LIWC-based performance prediction (Baseline 1): LIWC is a psycho-linguistic tool for text analysis. LIWC 2007 identifies 74 different features from the text data into different categories, where each category contains hundreds of words [68]. These categories include standard counts, psychological processes, relativity, personal concerns, and other dimensions. We first analyzed the Facebook posts of the 70 students by using LIWC. Then, we identified relevant features from 74 categories, where LIWC categories are independent variables, and users’ psychological attributes and mental health statuses are dependent variables. We used R Leaps package (https://cran.r-project.org/web/packages/leaps/leaps.pdf, accessed on 11 January 2022) using an efficient branch-and-bound algorithm to find the best subset of LIWC categories. By using these relevant features, we built our regression model for predicting psychological attributes and mental health status. From the psychological attributes and mental health status that we predict from the LIWC categories, we next predict users’ level of academic performance. Empirical results using LIWC showed their ability to detect context in a wide variety of experimental environments, including concentration, emotionality, social relationships, modes of thought, and individual differences.
Empath (Baseline 2): We also analyzed our evaluation dataset by using Empath [67]. Empath is a deep-learning-based psycho-linguistic tool that produces and validates new lexical categories on demand from a small set of seed words (such as “bleed“ and “punch“ to produce aggression in the category). Empath draws connotations between words and phrases by neural embedding across more than 1.8 billion words of modern fiction. It uses its neural embedding to discover new related terms and then validates the category with a crowd-powered filter. It also analyzes text through 200 built-in, pre-validated categories, such as neglect, state, created from common topics in our dataset. We again identified the best subset of features that were correlated with users’ psychological attributes and mental health statuses through R Leaps implementation package. Finally, we predicted students’ class of academic performance from the scores of correlated psychological attributes and mental health statuses. Table 6 shows the performance of different models.
Table 6.
Comparison of our model with the baseline models.
5. Discussion
In this paper, we build a two-level hybrid model to predict students’ academic performance, from students’ actual Facebook posts. We utilize social media posts to calculate psychological attributes and mental health status of students. Thereafter, we predict academic performance from these psychological attributes and mental health status. Therefore, our study integrates different psychological attributes and mental health status derived from Facebook interactions to predict students’ academic performance. In the first level, we exploit users’ Facebook posts to investigate their mental and psychological status. We identify the semantic relationships among the words by analyzing words from left–right and right–left according to the context. We perform the context-based word embedding by using the Sentence Transformer (MPNet) word-embedding vector, where we use a deep-learning-based BiLSTM model. In the conventional methods, researchers usually identify important features, but the sentence transformer model (MPNet) usually considers the whole content as an individual vector. Note that MPNet has a vector size of 768. Since the associations between different variables are non-linear in nature, we use non-linear techniques in our research to predict the mental health and psychological attributes. Our results show that the BiLSTM model performs better than the LSTM and GRU models. This is because, both LSTM and GRU use one forward pass and, therefore, cannot capture the relationship among the words in backwards directions. In contrast, BiLSTM can identify relationships among the words in both directions, which produces a more accurate model. Regarding our finding that the BiLSTM model shows better prediction accuracy, we note that prior studies [56,69] also show similar performance results. We observe that our model moderately predicts all the psychological attributes and mental health status. Among these, we observe that the model predicts self-efficacy scores more accurately. In contrast, we also observe that our model predicts neuroticism personality traits poorly. The reason behind this could be that people may not always feel comfortable in writing their negative attitude in social media.
In the second level, we predict students’ academic performance from their psychological and mental health attributes extracted from the previous level.
Gao et al. [70] find that depressive symptoms among Taiwanese adolescents have negative association with their academic performance by conducting a multivariate regression analysis. In the study, authors found that association may be related to the academic stress that is often found in education systems with high-stakes examinations such as Taiwan. In Bangladesh, students in private universities also have three semesters in a year, and in a semester, they have a total of six examinations (four class tests, mid- and final-term exam papers) in a single course, and they take more than three courses on an average, which might arouse depressive symptoms. Students nowadays are also addicted to the Internet and digital devices. Kumar et al. [71] also show that Internet addiction may promote depressive symptoms and impact their academic performance. In our study, we also obtained similar findings, which can be backed by these previous studies [70,71]. In another study [72], we find that students who have a high level of engagement with academic activities have high scores in self efficacy; in our study, we also find that academic performance and self efficacy are positively correlated.
Dogan [73] finds that neuroticism negatively influences academic performance for both short-term examinations (i.e., final exam) and long-term preparation (i.e., final project) among students. For extraversion, they find weak relationships because the graduation project requires a good collaboration with the teacher coordinator and group members. Kim et al. [74] find that conscientiousness is a strong predictor for academic performance. However, authors do not find any connection between openness and academic performance, which is not aligned with our findings. However, we may explain that open people are likely to apply their reasoning and brain stimulus to solve any problems, and they tend to accomplish the task in a crafted and shorter way than that of others. Thus, they might be good performers in academic activities as well.
In contrast, we notice that extroversion trait has negative significant correlation with students’ GPA. Later, we evaluate four classification model comprising one of the conventional multi-class models (K-Nearest Neighbors), one of the tree-based ensemble models (Random Forest), and two of the boosting-based ensemble models (AdaBoost and LgBoost) using the performance parameters (microaverage of recall, precision, and f-score). Finally, we develop a hybrid ensemble model through the stacking of K-Nearest Neighbors, Random Forest, and LgBoost using balanced weight distribution. The developed hybrid model outperform other models with a good AUC-ROC score of 0.95 and an f-scoremicro of 0.94. According to the study of Zhuang et al. [75], A/B exam paper finds the degree of fairness between two sessions (A and B) of exam papers even though the knowledge point is the same. In our study, to maintain the fairness of the survey questionnaire, we provide the same set of questions to all the participants. In addition to the variable selection during our model building, we systematically select statistically significant variables which generate the maximum accuracy. Therefore, we did not use any A/B exam papers in our experiment; rather, we emphasized more on the standardized tests, which were designed by expert researchers.
Contributions
Our study has two major contributions. First, our work is the first study that integrates different psychological attributes and mental health statuses derived from actual Facebook interactions to predict students’ academic performance. Most prior literature use self-reported survey data to predict students’ academic performance from students’ Facebook activities [76]. In contrast, we build our model using actual Facebook interactions. Furthermore, we also note that much of the prior literature employs self-reported data to predict negative consequences of Facebook use [77,78,79]. Indeed, there are several prior studies [22,39,40] that use actual social media interactions, especially from the Twitter platform. Therefore, our approach of using actual Facebook interactions to predict stress and depression encourages this body of literature to use objective measures more in model building. Second, to the best of our knowledge, our work is the first to build a two-level prediction model with a fusion of regression and classification techniques that predict the level of students’ academic performance from their Facebook posts. In doing so, we propose a novel balanced weighted hybrid ensemble classifier model where we integrate conventional, tree-based, and boosting-based models. Our model shows good prediction capability with an AUC-ROC of 0.95, which signifies a correct prediction in 95% of the test cases. Applications can be built using our approach that may help to detect the students who may dropout in the future. Interventions against dropout can be planned based on such early detection.
6. Conclusions
We have built a two-level hybrid prediction model to predict students’ academic performance, i.e., GPA, from their Facebook interactions. In the first level, we have converted students’ Facebook posts by using the MPNet technique. Then, we have built four different types of linear regression models: Big Five Personality, Self-Efficacy, Depression, and Stress from Facebook posts. In the second level, we have built a hybrid ensemble classifier model to predict the level of academic performance of the students from their mental health and psychological attributes. Our models have obtained a strong prediction potential. There are some avenues to extend our research. We plan to augment photo related activities along with the Facebook statuses to understand users’ psychological and mental health attributes better. Several studies [80,81,82] also show that profile photos of Facebook users can also reveal their psychological attributes such as personality traits and interaction style. Study [83] shows that different social media reveal similar types of psychological attributes for an individual user. In this study, we are also interested in predicting users’ academic performance and computing their psychological attributes and mental health from different social media such as Twitter, Reddit, etc. Students’ academic performances may fluctuate [84,85] for different reasons, and we would like to investigate whether users’ psychological and mental health attributes are the vital factors.
Author Contributions
M.S.H.M.: methodology, formal analysis, writing—original draft; S.I.: writing—original draft, supervision; S.S.: writing, resources, supervision; M.E.A.: writing—original draft, supervision; A.Z.: experimenting and writing. All authors have read and agreed to the published version of the manuscript.
Funding
This research is funded by Institute of Advanced Research (Grant No. IAR/2021/Pub/012), United International University, Bangladesh.
Institutional Review Board Statement
We have developed an agreement to interact with users and collect their data in an ethical, IRB-approved manner (IRB:#25-0527-PRO1).
Informed Consent Statement
Informed consent was obtained from all subjects involved in the study.
Conflicts of Interest
The funders had no role in the design of the study; in the collection, analyses, or interpretation of data; in the writing of the manuscript, or in the decision to publish the results.
Abbreviations
The following abbreviations are used in this manuscript:
| SM-MP | Social media to mental/psychological attributes |
| MP-AP | Mental/psychological attributes to academic performance |
| LIWC | Linguistic inquiry and word count |
| BiLSTM | Bidirectional long short term memory |
| MDI | Major depression inventory |
| PSS | Perceived stress scale |
| TIPI | Ten-item personality inventory |
| GSE | Generalized self efficacy |
| GPA | Grading point average |
References
- Komarraju, M.; Karau, S.J.; Schmeck, R.R.; Avdic, A. The Big Five personality traits, learning styles, and academic achievement. Personal. Individ. Differ. 2011, 51, 472–477. [Google Scholar] [CrossRef]
- Boon, L.K.; Fern, Y.S.; Sze, C.C. Factors affecting individual job performance. In Proceedings of the International Conference on Management Finance and Economics, Sarawak, Malaysia, 15–16 October 2012. [Google Scholar]
- Ruz, M.E.A.; Al-Akash, H.Y.; Jarrah, S. Persistent (Anxiety and depression) affected academic achievement and absenteeism in nursing students. Open Nurs. J. 2018, 12, 171. [Google Scholar] [CrossRef] [PubMed]
- Guyon, H.; Falissard, B.; Kop, J.L. Modeling psychological attributes in psychology–An epistemological discussion: Network analysis vs. latent variables. Front. Psychol. 2017, 8, 798. [Google Scholar] [CrossRef] [PubMed] [Green Version]
- Yarkoni, T. Personality in 100,000 words: A large-scale analysis of personality and word use among bloggers. J. Res. Personal. 2010, 44, 363–373. [Google Scholar] [CrossRef] [Green Version]
- Allen, M.S.; Vella, S.A.; Laborde, S. Health-related behaviour and personality trait development in adulthood. J. Res. Personal. 2015, 59, 104–110. [Google Scholar] [CrossRef]
- Specht, J.; Egloff, B.; Schmukle, S.C. Stability and change of personality across the life course: The impact of age and major life events on mean-level and rank-order stability of the Big Five. J. Personal. Soc. Psychol. 2011, 101, 862. [Google Scholar] [CrossRef] [Green Version]
- WHO. Promoting Mental Health: Concepts, Emerging Evidence, Practice: Summary Report; World Health Organization: Geneva, Switzerland, 2004. [Google Scholar]
- Tomlinson, M.; Lund, C. Why does mental health not get the attention it deserves? An application of the Shiffman and Smith framework. PLoS Med. 2012, 9, e1001178. [Google Scholar] [CrossRef] [Green Version]
- Pickett, K.E.; Wilkinson, R.G. Income inequality and health: A causal review. Soc. Sci. Med. 2015, 128, 316–326. [Google Scholar] [CrossRef]
- Zhao, H.; Seibert, S.E.; Lumpkin, G.T. The relationship of personality to entrepreneurial intentions and performance: A meta-analytic review. J. Manag. 2010, 36, 381–404. [Google Scholar] [CrossRef]
- Keller, C.; Siegrist, M. Does personality influence eating styles and food choices? Direct and indirect effects. Appetite 2015, 84, 128–138. [Google Scholar] [CrossRef]
- Baas, M.; Roskes, M.; Sligte, D.; Nijstad, B.A.; De Dreu, C.K. Personality and creativity: The dual pathway to creativity model and a research agenda. Soc. Personal. Psychol. Compass 2013, 7, 732–748. [Google Scholar] [CrossRef]
- Şahin, E.; Çekin, R.; Yazıcılar Özçelik, İ. Predictors of academic achievement among physical education and sports undergraduate students. Sports 2018, 6, 8. [Google Scholar] [CrossRef] [PubMed] [Green Version]
- Jolić Marjanović, Z.; Altaras Dimitrijević, A.; Protić, S.; Mestre, J.M. The Role of Strategic Emotional Intelligence in Predicting Adolescents’ Academic Achievement: Possible Interplays with Verbal Intelligence and Personality. Int. J. Environ. Res. Public Health 2021, 18, 13166. [Google Scholar] [CrossRef] [PubMed]
- Wang, H.; Yang, C.; He, F.; Shi, Y.; Qu, Q.; Rozelle, S.; Chu, J. Mental health and dropout behavior: A cross-sectional study of junior high students in northwest rural China. Int. J. Educ. Dev. 2015, 41, 1–12. [Google Scholar] [CrossRef]
- Hjorth, C.F.; Bilgrav, L.; Frandsen, L.S.; Overgaard, C.; Torp-Pedersen, C.; Nielsen, B.; Bøggild, H. Mental health and school dropout across educational levels and genders: A 4.8-year follow-up study. BMC Public Health 2016, 16, 976. [Google Scholar] [CrossRef] [Green Version]
- Hirschi, A.; Niles, S.G.; Akos, P. Engagement in adolescent career preparation: Social support, personality and the development of choice decidedness and congruence. J. Adolesc. 2011, 34, 173–182. [Google Scholar] [CrossRef]
- Caprara, G.V.; Vecchione, M.; Alessandri, G.; Gerbino, M.; Barbaranelli, C. The contribution of personality traits and self-efficacy beliefs to academic achievement: A longitudinal study. Br. J. Educ. Psychol. 2011, 81, 78–96. [Google Scholar] [CrossRef]
- Pennebaker, J.W.; Graybeal, A. Patterns of natural language use: Disclosure, personality, and social integration. Curr. Dir. Psychol. Sci. 2001, 10, 90–93. [Google Scholar] [CrossRef]
- Back, M.D.; Stopfer, J.M.; Vazire, S.; Gaddis, S.; Schmukle, S.C.; Egloff, B.; Gosling, S.D. Facebook profiles reflect actual personality, not self-idealization. Psychol. Sci. 2010, 21, 372–374. [Google Scholar] [CrossRef]
- De Choudhury, M.; Gamon, M.; Counts, S.; Horvitz, E. Predicting depression via social media. In Proceedings of the Seventh International AAAI Conference on Weblogs and Social Media, Cambridge, MA, USA, 8–11 July 2013; pp. 128–137. [Google Scholar]
- Peng, Z.; Hu, Q.; Dang, J. Multi-kernel SVM based depression recognition using social media data. Int. J. Mach. Learn. Cybern. 2019, 10, 43–57. [Google Scholar] [CrossRef]
- De Choudhury, M.; De, S. Mental health discourse on reddit: Self-disclosure, social support, and anonymity. In Proceedings of the Eighth International AAAI Conference on Weblogs and Social Media, Ann Arbor, MA, USA, 1–4 June 2014; pp. 71–80. [Google Scholar]
- Parks-Leduc, L.; Feldman, G.; Bardi, A. Personality traits and personal values: A meta-analysis. Personal. Soc. Psychol. Rev. 2015, 19, 3–29. [Google Scholar] [CrossRef] [PubMed] [Green Version]
- Ramón-Arbués, E.; Gea-Caballero, V.; Granada-López, J.M.; Juárez-Vela, R.; Pellicer-García, B.; Antón-Solanas, I. The prevalence of depression, anxiety and stress and their associated factors in college students. Int. J. Environ. Res. Public Health 2020, 17, 7001. [Google Scholar] [CrossRef] [PubMed]
- Bondolfi, G.; Mazzola, V.; Arciero, G. In between ordinary sadness and clinical depression. Emot. Rev. 2015, 7, 216–222. [Google Scholar] [CrossRef]
- Bech, P.; Timmerby, N.; Martiny, K.; Lunde, M.; Soendergaard, S. Psychometric evaluation of the Major Depression Inventory (MDI) as depression severity scale using the LEAD (Longitudinal Expert Assessment of All Data) as index of validity. BMC Psychiatry 2015, 15, 190. [Google Scholar] [CrossRef] [Green Version]
- McEwen, B.S.; Bowles, N.P.; Gray, J.D.; Hill, M.N.; Hunter, R.G.; Karatsoreos, I.N.; Nasca, C. Mechanisms of stress in the brain. Nat. Neurosci. 2015, 18, 1353. [Google Scholar] [CrossRef]
- Toussaint, L.; Shields, G.S.; Dorn, G.; Slavich, G.M. Effects of lifetime stress exposure on mental and physical health in young adulthood: How stress degrades and forgiveness protects health. J. Health Psychol. 2016, 21, 1004–1014. [Google Scholar] [CrossRef] [Green Version]
- Cohen, S.; Kamarck, T.; Mermelstein, R. Perceived stress scale. Meas. Stress. Guide Health Soc. Sci. 1994, 10, 1–2. [Google Scholar]
- Azucar, D.; Marengo, D.; Settanni, M. Predicting the Big 5 personality traits from digital footprints on social media: A meta-analysis. Personal. Individ. Differ. 2018, 124, 150–159. [Google Scholar] [CrossRef]
- John, O.P.; Srivastava, S. The Big Five trait taxonomy: History, measurement, and theoretical perspectives. Handb. Personal. Theory Res. 1999, 2, 102–138. [Google Scholar]
- Bandura, A. Self-efficacy mechanism in human agency. Am. Psychol. 1982, 37, 122. [Google Scholar] [CrossRef]
- Ebstrup, J.F.; Eplov, L.F.; Pisinger, C.; Jørgensen, T. Association between the Five Factor personality traits and perceived stress: Is the effect mediated by general self-efficacy? Anxiety Stress Coping 2011, 24, 407–419. [Google Scholar] [CrossRef] [PubMed]
- Song, K.; Tan, X.; Qin, T.; Lu, J.; Liu, T.Y. Mpnet: Masked and permuted pre-training for language understanding. arXiv 2020, arXiv:2004.09297. [Google Scholar]
- Devlin, J.; Chang, M.W.; Lee, K.; Toutanova, K. Bert: Pre-training of deep bidirectional transformers for language understanding. arXiv 2018, arXiv:1810.04805. [Google Scholar]
- Yang, Z.; Dai, Z.; Yang, Y.; Carbonell, J.; Salakhutdinov, R.R.; Le, Q.V. Xlnet: Generalized autoregressive pretraining for language understanding. Adv. Neural Inf. Process. Syst. 2019, 32, 1–11. [Google Scholar]
- Park, M.; McDonald, D.W.; Cha, M. Perception differences between the depressed and non-depressed users in twitter. In Proceedings of the Seventh International AAAI Conference on Weblogs and Social Media, Cambridge, MA, USA, 8–11 July 2013; pp. 476–485. [Google Scholar]
- De Choudhury, M.; Counts, S.; Horvitz, E. Social media as a measurement tool of depression in populations. In Proceedings of the 5th Annual ACM Web Science Conference, Paris, France, 2–4 May 2013; pp. 47–56. [Google Scholar]
- Tan, P.J.B.; Yao, H.m.; Hsu, M.H. A Case Study of Tourist Perceptions and Revisit Intention Regarding Qingwan Cactus Park in Penghu, Taiwan. Sustainability 2021, 13, 12404. [Google Scholar] [CrossRef]
- Ma, Y.; Guo, G. Support Vector Machines Applications; Springer: Berlin/Heidelberg, Germany, 2014; Volume 649. [Google Scholar]
- Hu, L.Y.; Huang, M.W.; Ke, S.W.; Tsai, C.F. The distance function effect on k-nearest neighbor classification for medical datasets. SpringerPlus 2016, 5, 1304. [Google Scholar] [CrossRef] [Green Version]
- Sharma, H.; Kumar, S. A Survey on Decision Tree Algorithms of Classification in Data Mining. Int. J. Sci. Res. 2016, 5, 2093–2096. [Google Scholar]
- Kaviani, P.; Dhotre, S. Short Survey on Naive Bayes Algorithm. Int. J. Adv. Res. Comput. Sci. Manag. 2017, 4, 607–611. [Google Scholar]
- Athoillah, M.; Irawan, M.I.; Imah, E.M. Support vector machine with multiple kernel learning for image retrieval. In Proceedings of the 2015 International Conference on Information & Communication Technology and Systems (ICTS), Lugano, Switzerland, 3–6 February 2015; pp. 17–22. [Google Scholar]
- Dinakar, K.; Weinstein, E.; Lieberman, H.; Selman, R.L. Stacked generalization learning to analyze teenage distress. In Proceedings of the Eighth International AAAI Conference on Weblogs and Social Media, Ann Arbor, MA, USA, 1–4 June 2014; pp. 81–90. [Google Scholar]
- De Choudhury, M.; Gamon, M.; Counts, S. Happy, nervous or surprised? Classification of human affective states in social media. In Proceedings of the Sixth International AAAI Conference on Weblogs and Social Media, Dublin, Ireland, 4–8 June 2012; pp. 435–438. [Google Scholar]
- Pak, A.; Paroubek, P. Twitter as a Corpus for Sentiment Analysis and Opinion Mining; LREc: Valletta, Malta, 2010; Volume 10, pp. 1320–1326. [Google Scholar]
- Gao, H.; Mahmud, J.; Chen, J.; Nichols, J.; Zhou, M. Modeling user attitude toward controversial topics in online social media. In Proceedings of the Eighth International AAAI Conference on Weblogs and Social Media, Ann Arbor, MI, USA, 1–4 June 2014; pp. 121–130. [Google Scholar]
- De Choudhury, M.; Counts, S.; Horvitz, E. Major life changes and behavioral markers in social media: Case of childbirth. In Proceedings of the 2013 Conference on Computer Supported Cooperative Work, San Antonio, TX, USA, 23–27 February 2013; pp. 1431–1442. [Google Scholar]
- Coppersmith, G.; Harman, C.; Dredze, M. Measuring post traumatic stress disorder in Twitter. In Proceedings of the Eighth International AAAI Conference on Weblogs and Social Media, Ann Arbor, MI, USA, 1–4 June 2014; pp. 579–582. [Google Scholar]
- Benesty, J.; Chen, J.; Huang, Y.; Cohen, I. Pearson correlation coefficient. In Noise Reduction in Speech Processing; Springer: Berlin/Heidelberg, Germany, 2009; pp. 1–4. [Google Scholar]
- Marshall, M.N. Sampling for qualitative research. Fam. Pract. 1996, 13, 522–526. [Google Scholar] [CrossRef]
- Yadav, S.K.; Singh, S.; Gupta, R. Sampling methods. In Biomedical Statistics; Springer: Berlin/Heidelberg, Germany, 2019; pp. 71–83. [Google Scholar]
- Chen, J.; Hsieh, G.; Mahmud, J.U.; Nichols, J. Understanding individuals’ personal values from social media word use. In Proceedings of the 17th ACM Conference on Computer Supported Cooperative Work & Social Computing, Baltimore, MD, USA, 15–19 February 2014; pp. 405–414. [Google Scholar]
- Zhang, J.; Lyu, J. Reliability, validity and preliminary hypothesis tests for the English version of the Psychological Strain Scales (PSS). J. Affect. Disord. 2014, 164, 69–75. [Google Scholar] [CrossRef] [Green Version]
- Srivastava, N.; Hinton, G.; Krizhevsky, A.; Sutskever, I.; Salakhutdinov, R. Dropout: A simple way to prevent neural networks from overfitting. J. Mach. Learn. Res. 2014, 15, 1929–1958. [Google Scholar]
- Chai, T.; Draxler, R.R. Root mean square error (RMSE) or mean absolute error (MAE)?—Arguments against avoiding RMSE in the literature. Geosci. Model Dev. 2014, 7, 1247–1250. [Google Scholar] [CrossRef] [Green Version]
- Wang, Q.; Zhang, D.; Si, L. Semantic hashing using tags and topic modeling. In Proceedings of the 36th international ACM SIGIR conference on Research and development in information retrieval, Dublin, Ireland, 28 July 2013–1 August 2013; pp. 213–222. [Google Scholar]
- De Boer, P.T.; Kroese, D.P.; Mannor, S.; Rubinstein, R.Y. A tutorial on the cross-entropy method. Ann. Oper. Res. 2005, 134, 19–67. [Google Scholar] [CrossRef]
- Huber-Carol, C.; Balakrishnan, N.; Nikulin, M.; Mesbah, M. Goodness Fit Tests Model Validity; Springer Science & Business Media: Berlin/Heidelberg, Germany, 2012. [Google Scholar]
- Hsu, H.; Lachenbruch, P.A. Paired t test. In Wiley Stats Ref: Statistics Reference Online; Willey: Hoboken, NJ, USA, 2014. [Google Scholar]
- McHugh, M.L. The chi-square test of independence. Biochem. Medica 2013, 23, 143–149. [Google Scholar] [CrossRef] [PubMed] [Green Version]
- Mukta, M.S.H.; Ali, M.E.; Mahmud, J. Temporal modeling of basic human values from social network usage. J. Assoc. Inf. Sci. Technol. 2019, 70, 151–163. [Google Scholar] [CrossRef]
- Mukta, M.S.H.; Khan, E.M.; Ali, M.E.; Mahmud, J. Predicting Movie Genre Preferences from Personality and Values of Social Media Users. In Proceedings of the Eleventh International Conference on Web and Social Media, ICWSM 2017, Montreal, QC, Canada, 15–18 May 2017; pp. 624–627. [Google Scholar]
- Fast, E.; Chen, B.; Bernstein, M.S. Empath: Understanding Topic Signals in Large-Scale Text. In Proceedings of the 2016 CHI Conference on Human Factors in Computing Systems, San Jose, CA, USA, 7–12 May 2016; Kaye, J., Druin, A., Lampe, C., Morris, D., Hourcade, J.P., Eds.; ACM: New York, NY, USA, 2016; pp. 4647–4657. [Google Scholar]
- Tausczik, Y.R.; Pennebaker, J.W. The psychological meaning of words: LIWC and computerized text analysis methods. J. Lang. Soc. Psychol. 2010, 29, 24–54. [Google Scholar] [CrossRef]
- Mukta, M.S.H.; Ali, M.E.; Mahmud, J. Identifying and validating personality traits-based homophilies for an egocentric network. Soc. Netw. Anal. Min. 2016, 6, 74. [Google Scholar] [CrossRef]
- Gao, Y.; Hu, D.; Peng, E.; Abbey, C.; Ma, Y.; Wu, C.I.; Chang, C.Y.; Hung, W.T.; Rozelle, S. Depressive symptoms and the link with academic performance among rural Taiwanese children. Int. J. Environ. Res. Public Health 2020, 17, 2778. [Google Scholar] [CrossRef] [Green Version]
- Kumar, S.; Kumar, A.; Badiyani, B.; Singh, S.K.; Gupta, A.; Ismail, M.B. Relationship of internet addiction with depression and academic performance in Indian dental students. Clujul Med. 2018, 91, 300. [Google Scholar] [CrossRef] [Green Version]
- Andersen, S.C.; Gensowski, M.; Ludeke, S.G.; John, O.P. A stable relationship between personality and academic performance from childhood through adolescence. An original study and replication in hundred-thousand-person samples. J. Personal. 2020, 88, 925–939. [Google Scholar] [CrossRef]
- Dogan, U. Student engagement, academic self-efficacy, and academic motivation as predictors of academic performance. Anthropol. 2015, 20, 553–561. [Google Scholar] [CrossRef]
- Kim, K.R.; Seo, E.H. The relationship between procrastination and academic performance: A meta-analysis. Personal. Individ. Differ. 2015, 82, 26–33. [Google Scholar] [CrossRef]
- Zhuang, Z.Y.; Ho, C.K.; Tan, P.J.B.; Ying, J.M.; Chen, J.H. The optimal setting of A/B exam papers without item pools: A hybrid approach of IRT and BGP. Mathematics 2020, 8, 1290. [Google Scholar] [CrossRef]
- Whelan, E.; Islam, A.N.; Brooks, S. Applying the SOBC paradigm to explain how social media overload affects academic performance. Comput. Educ. 2020, 143, 103692. [Google Scholar] [CrossRef]
- Junco, R. Too much face and not enough books: The relationship between multiple indices of Facebook use and academic performance. Comput. Hum. Behav. 2012, 28, 187–198. [Google Scholar] [CrossRef]
- Turel, O.; Qahri-Saremi, H. Problematic use of social networking sites: Antecedents and consequence from a dual-system theory perspective. J. Manag. Inf. Syst. 2016, 33, 1087–1116. [Google Scholar] [CrossRef]
- Islam, A.N.; Mäntymäki, M.; Benbasat, I. Duality of self-promotion on social networking sites. Inf. Technol. People 2019, 32, 269–296. [Google Scholar] [CrossRef]
- Segalin, C.; Celli, F.; Polonio, L.; Kosinski, M.; Stillwell, D.; Sebe, N.; Cristani, M.; Lepri, B. What your Facebook profile picture reveals about your personality. In Proceedings of the 25th ACM international conference on Multimedia, Mountain View, CA, USA, 23–27 October 2017; pp. 460–468. [Google Scholar]
- Celli, F.; Bruni, E.; Lepri, B. Automatic personality and interaction style recognition from facebook profile pictures. In Proceedings of the 22nd ACM International Conference on Multimedia, Orlando, FL, USA, 3–7 November 2014; pp. 1101–1104. [Google Scholar]
- Liu, L.; Preotiuc-Pietro, D.; Samani, Z.R.; Moghaddam, M.E.; Ungar, L. Analyzing personality through social media profile picture choice. In Proceedings of the Tenth International AAAI Conference on Web and Social Media, Cologne, Germany, 17–20 May 2016. [Google Scholar]
- Al Maruf, H.; Meshkat, N.; Ali, M.E.; Mahmud, J. Human behaviour in different social medias: A case study of Twitter and Disqus. In Proceedings of the 2015 IEEE/ACM International Conference on Advances in Social Networks Analysis and Mining (ASONAM), Paris, France, 25–28 August 2015; pp. 270–273. [Google Scholar]
- Marcomini Neto, A.; Fucuta, P.D.S.; Brienze, V.M.S.; Lima, A.R.D.A.; Brienze, S.L.A.; André, J.C. Fluctuation of academic performance of medical students selected by affirmative action policies (PIMESP). Rev. Bras. Educ. Med. 2022, 46, 1–10. [Google Scholar] [CrossRef]
- Zhang, T.; Xu, Y.; Qi, P.; Li, X.; Hu, G. Predicting the Performance Fluctuation of Students Based on the Long-Term and Short-Term Data. In Proceedings of the 2017 International Conference of Educational Innovation through Technology (EITT), Osaka, Japan, 7–9 December 2017; pp. 126–127. [Google Scholar]
Publisher’s Note: MDPI stays neutral with regard to jurisdictional claims in published maps and institutional affiliations. |
© 2022 by the authors. Licensee MDPI, Basel, Switzerland. This article is an open access article distributed under the terms and conditions of the Creative Commons Attribution (CC BY) license (https://creativecommons.org/licenses/by/4.0/).