Frequency Domain Electromagnetic Method (FDEM) as a Tool to Study Contamination at the Sub-Soil Layer


1
Department of Electrical and Electronic Engineering, Ariel University, Ariel 4077625, Israel
2
GeoSence LTD, Eeven Yehuda 40500, Israel
3
Department of Natural Resources, Agricultural Research Organization, Institute of Plant Sciences, Gilat Research Center, Gilat 8531100, Israel
*
Author to whom correspondence should be addressed.
Geosciences 2019, 9(9), 382; https://doi.org/10.3390/geosciences9090382
Submission received: 25 July 2019
/
Revised: 15 August 2019
/
Accepted: 27 August 2019
/
Published: 31 August 2019
Abstract
:Traditional sheep and cattle grazing in natural semiarid Mediterranean, Asian and African regions is based on night corrals, where animal secretions accumulate. Lack of management and disregard for the long-term effects of using the same sites for corrals on underground soil characters may negatively affect soil values. This locally increases the content of organic matter and nutrients such as nitrogen, potassium, phosphorus and others that are stockpiled in the corrals. As these activities are long-lasting, they affect the soil parameters, leading to nutrient leakage and contamination of the upper and sub-soil surface. This alarming situation demands a technique to reveal and estimate sub-soil contamination in corrals by using the frequency domain electromagnetic method (FDEM) for measuring soil salinity. The aim of this study is to correlate electrical conductivity measurement with the FDEM to study the influence of sheep corrals on the changes within the sub-soils of corrals in the semiarid region of the northern Negev desert. The results show that a correlation was found between the laboratory soil analysis and the electromagnetic analysis in all sites. Plugot forest site results found to be anomalous indicated sub-surface conductivity resulting from the presence of the corral, with a higher conductivity value of about 230 mS/m, while no differences were found between the soil layers outside the active corral and the corral edge. High values were found in the center of the active corral: 960 mS/m by the laboratory analysis and 200 mS/m by the FDEM. The values obtained in the abandoned corral in the laboratory were about 10 times lower than those obtained from the active corral and six times lower that those found with the FDEM. At the Beit Nir site, high values were found in the center of the active corral: 300 mS/m by the laboratory analysis and 130 mS/m by the FDEM. With different sources of manure, cattle and sheep have shown similar patterns of electrical conductivity (EC) obtained in the sub-soil layers between active and abandoned corrals: high in the center and low at the edge and outside the corral and decreased with depth.

1. Introduction
Semiarid and dry Mediterranean regions, which are not utilized for agricultural crops, have been used for hundreds and thousands of years for livestock grazing. During the green season, these pasturelands are intensively exploited for feeding animals on herbaceous vegetation [1,2,3]. Several factors may affect pastureland nutrient flux: seasonal climate, landscape topography, vegetation species composition, animal type and grazing management practices [4].
In the semiarid Negev desert of Israel, more than 250,000 sheep and goats undergo migration for seasonal grazing in the late winter and spring from their traditional residential settlements in the eastern Negev to planted forests in the western and northern Negev. This management routine is highly encouraged by foresters, who note that grazing will reduce herbaceous vegetation and thus reduce the risk of forest fires [5,6,7,8].
Traditional livestock grazing (sheep or cattle) in natural semiarid Mediterranean, Asian and African regions is based on grazing during the day and returning to protected corrals or areas near a water point at night in order to prevent herds from scattering and to guard against predation. This routine of livestock management leads to the accumulation of animal secretions in night corrals [9,10,11,12,13]. Furthermore, since the herds return to the same grazing area every year and the night corrals are built at the same site, high levels of excreted manure and urine accumulate in the soils. Thus, livestock grazing affects the magnitude of soil nutrients in rangeland ecosystems [14,15,16,17], locally increasing the content of organic matter and minerals such as nitrogen, potassium, phosphorus and other nutrients stockpiled in the corrals [13,18,19,20,21]. These effects are long-lasting and affect soil parameters. This results in nutrient leakage and contamination of upper and sub-soil surfaces [11] (Figure 1). Lack of rational management of seasonal corral location results in a sharp increase in the degradation process of night corral’s area. This degradation calls for a technique to determine the contamination levels of corral sub-soils.
The identification of leakage to the sub-soil can be carried out through conservative methods, including chemical and physical measurements. In recent years, however, there has been an increase in the use of active remote-sensing tools, such as the sub-surface frequency domain electromagnetic method (FDEM) (Figure 1), for measuring and estimating the sub-surface’s electrical conductivity profile and magnetic susceptibility (MS). This method provides the added advantage of being able to map underground salinity changes [22,23,24].
The aim of this study was to demonstrate the use of the FDEM method to evaluate the leakage of livestock secretions to the sub-soil beneath the corrals in semiarid Mediterranean planted forests. Our purpose was to develop practical tools that would provide a snapshot of changes in spatial soil salinity content to depths of about 2–3 m in corral areas, at a relatively low cost and in real time. The salinity of the soil, irrigation water, or fertilizer solution is an important parameter affecting the root zone environment of plants. Any of these factors can have a significant effect on plant growth and pasture quality. Low salt levels could lead to nutrient deficiencies while high salt levels serve as a warning sign to adjust.
The spatial measurements performed with the FDEM allow tens of thousands of points per hectare to be measured, thereby enabling the spatial situation along the grazed area to be monitored while minimizing effort and economizing the cost of digging and removing samples from the underground layers.
2. Materials and Methods
2.1. Study Sites
The study was conducted at two sites (Figure 2, Table 1). At each site, we chose two locations: (1) active-continuous use and (2) abandoned corrals (5–10 years). One location was in planted forests located in the northern Negev desert in Israel, the Plugot Forest (31°37′8.03″ N; 34°44′46.77″ E; altitude 120 m above sea level (a.s.l.)), in which 266 ha are planted with Eucalyptus sargentii. The site is grazed seasonally by Bedouin herds. The second site is the Beit Nir Natural Reserve area in Shefelat Yehuda (31°65′ N, 34°88′ E; altitude 285 m a.s.l.), in which 2000 ha are dominated by woody shrubs and scattered trees. The dominant perennial species in the research area are Pistacia lentiscus, Phillyrea latifolia, Sarcopoterium spinosum, and Eucalyptus camaldulensis. This site is grazed by managed cattle herds, with supplements of hay and fallow in the late autumn and early winter [13].
The corral matrix is dominated by herbaceous vegetation, mostly short annual grasses, legumes, thistles, and forbs. The soil is sandy clay in the Plugot forest (49.2% clay, 37.5% sand, 13.3% silt) and that in Beit Nir is brown and pale Rendzina with calcareous material and a sandy loam texture (48% clay). The long-term average seasonal rainfall is 391 mm in the Plugot forest and 450 in the Beit Nir site, with rain falling during the cold season from late autumn to early spring (November–April; values are for the hydrological year) [13]. Average minimal (January) and maximal (July) temperatures are 8.1 °C and 31.7 ℃ in the Plugot forest and 8.3 ℃ and 34 ℃ in the Beit Nir site [25]. The electrical conductivity (EC) measurements were carried out in July and September, when the soil was relatively dry, with up to 5% moisture content.
Herds of Bedouin sheep arrive every year at the Plugot forest for seasonal grazing (ca. 700 animals; ca. 90% Awassi sheep and 30% Baladi goats), with an average stocking rate of 2.7 animals ha-1. Adult animal weight is 40–50 kg. In Beit Nir the cattle herd consists of 700 individuals (mixed Hereford and Simmental). Mature animal weight is 500–700 kg, with an average stocking rate of 0.53 animal ha-1. The grazing starts in February after a threshold vegetation biomass is reached in order to ensure continuous productivity during the green season, which lasts 3 to 5 months based on yearly rainfall conditions. According to traditional grazing in the region, sheep are kept overnight in seasonal corrals that are 50 to 80 m in diameter. During the daytime, the herds graze on the herbaceous vegetation, while at nighttime they are gathered back into the corrals. At the Beit Nir site, the cattle graze during the daytime in the corral matrix on the herbaceous vegetation and at nighttime are concentrated near water points.
2.2. Laboratory Analysis
Soil sampling was carried out in the summers of 2017 and 2018. Soil samples at three different depths (n = 5) were collected in cross-section, from the central corral matrix to the outside of the corral matrix, while crossing the corral edges. The soil samples were collected and transferred to the laboratory for EC measurements. EC was measured in saturated paste (1:2 soil:water, respectively), after shaking for 1 h (150 rpm) and filtration (Whatman No.1) [26].
2.3. FDEM Measurements
The traditional electrical method “measures” apparent resistivity using electrodes that require ground contact in a DC electrical survey, while the Electromagnetic (EM) method “measures” apparent conductivity without ground contact. The EM method, known as a “potential method”, involves transmitting and receiving EM fields, commonly using a set of coils. The common unit of resistivity is ohm-m and that of conductivity is the inverse, Siemen/m.
Similarly, the apparent conductivity is only the same as the true conductivity when the earth is a homogeneous half space. As an example, consider a pair of horizontal coils separated by a distance r. A routinely measured quantity is called the mutual coupling ratio for a horizontal coplanar (or vertical dipole) coil configuration over layered earth, as derived by [27,28,29], among others. Figure 3 shows a coplanar coil pair at height h above the layered earth [30]. A damped least-squares inversion based on singular value decomposition is used to solve the nonlinear inverse problem.
The depth of investigation of an EM system can be estimated using the skin depth δ, which is defined in classical EM theory as the distance in a homogeneous medium over which the amplitude of a plane wave is attenuated by a factor of 1/e, or about 37% of its original amplitude. The skin depth δ is:
where σ is the half-space conductivity, μ is magnetic permeability and ω is the angular frequency of the wave plane. However, the depth of investigation is affected by the properties of the target and host medium as well as factors related to sensor sensitivity, accuracy, frequency, coil configuration, ambient noise and data processing and interpretation methods. Under ideal conditions, the depth of investigation can be greater than upper layer depth, but in geologically complex and/or environmentally noisy areas the depth of investigation can be substantially less than upper layer depth [31]. Consequently, the depth of investigation is practically empirical and should be measured or correlated by other means when an estimation is not good enough. The ability to transmit in several frequencies allows us to perform “frequency sounding” using a multi-frequency sensor, thereby resolving different depths of correlation.
The FDEM method provides a geophysical tool for measuring EC and MS (apparent values) of sub-surface rocks, soils and minerals. The FDEM method involves generating EM fields that induce alternating sub-surface eddy currents, which in turn cause the sub-surface materials to form relative magnetic fields. By measuring these magnetic fields, apparent sub-surface properties such as EC and MS can be deduced. EC is mainly a function of the soil and rock matrix, percent saturation and conductivity of pore fluids.
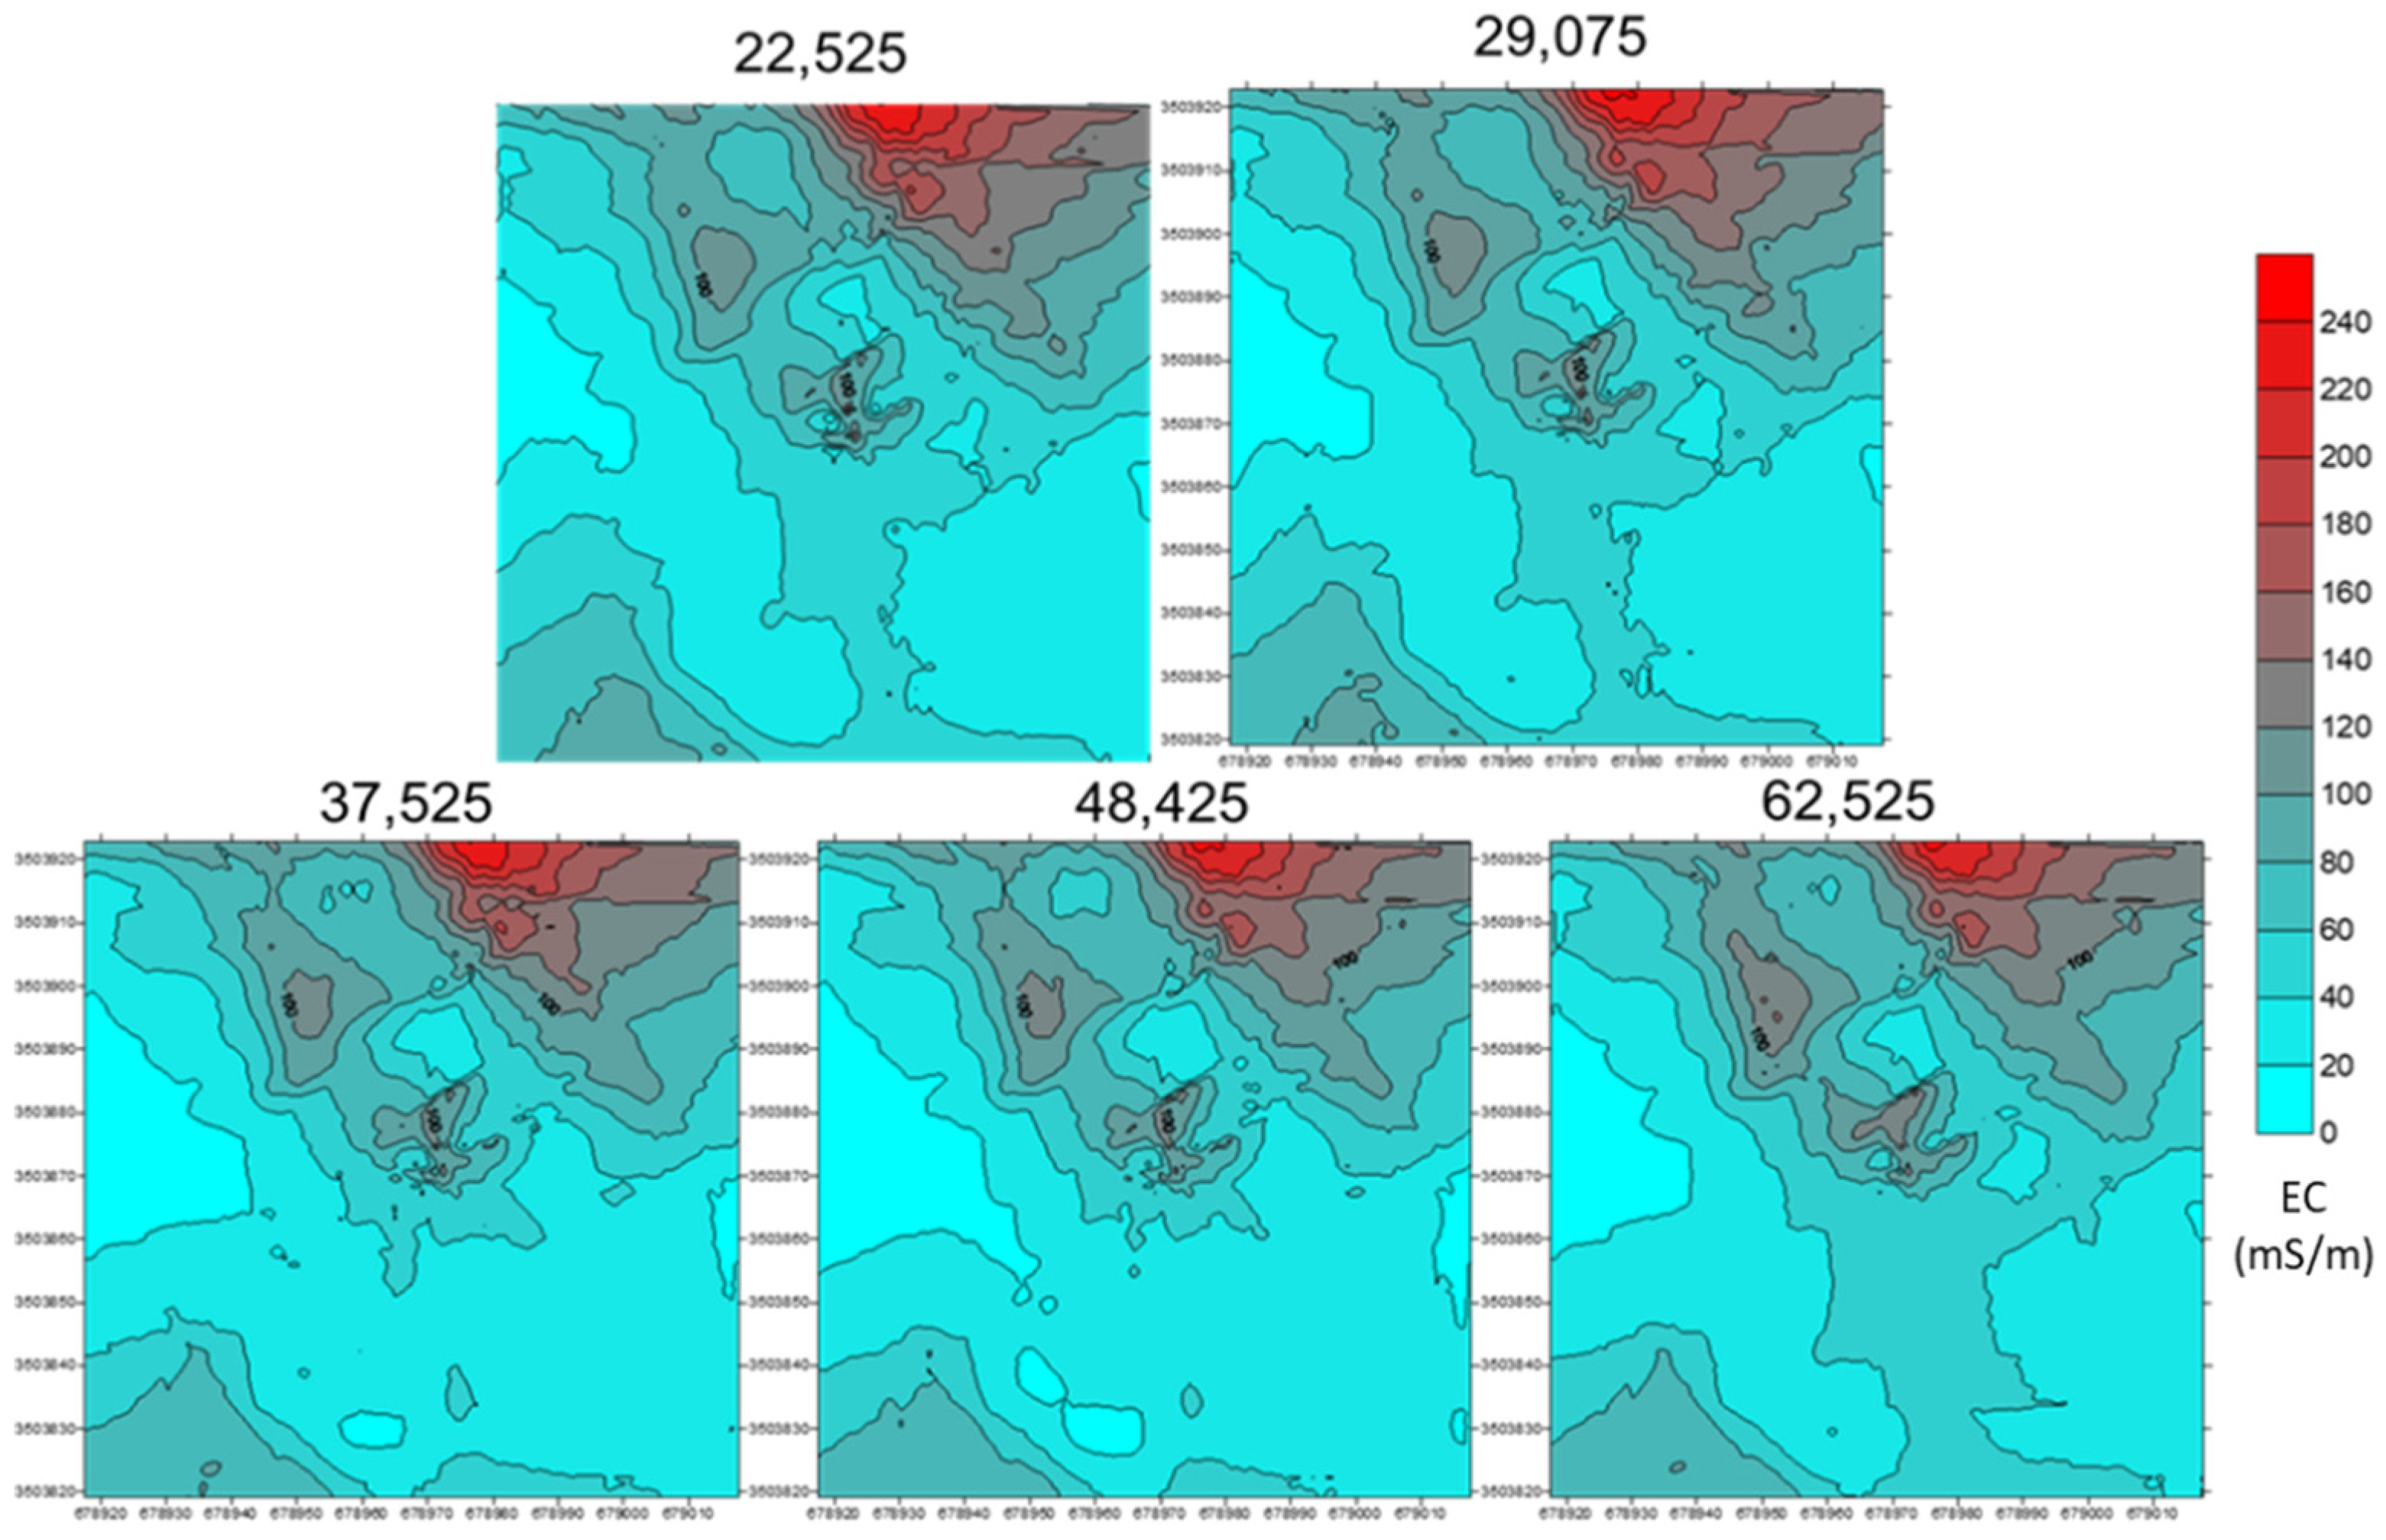
In this study, we used a Gem-2 sensor operated in multi-frequency mode with the following five frequencies: 22,525 Hz; 29,075 Hz; 37,525 Hz; 48,425 Hz; 62,525 Hz (Figure 4). Since there is a connection between frequency and penetration depth, each frequency reaches a different penetration depth. The lower the frequency, the deeper the penetration. The maximum penetration depth achieved was 3 m. Frequency result measurements show a unique resemblance between different wavelength analyses, probably because of the similar infiltration of the contamination along the depth range; therefore, we chose to present the total EC averaging parameter to express the differences in the results between the two sites (Figure 5).
2.4. Calculations and Statistics
Tukey HSD post hoc tests (for all tests p < 0.05) comparisons were carried out to examine differences among corral categories and controls and the correlation between the FDEM and the EC measurements. Comparison of electrical conductivity of FDEM results and chemical results were conducted from the sub-soil surface. Statistical analyses were performed in JMP® (version 13, SAS, Cary, NC, USA) (https://www.jmp.com).
3. Results
3.1. Plugot Forest Site
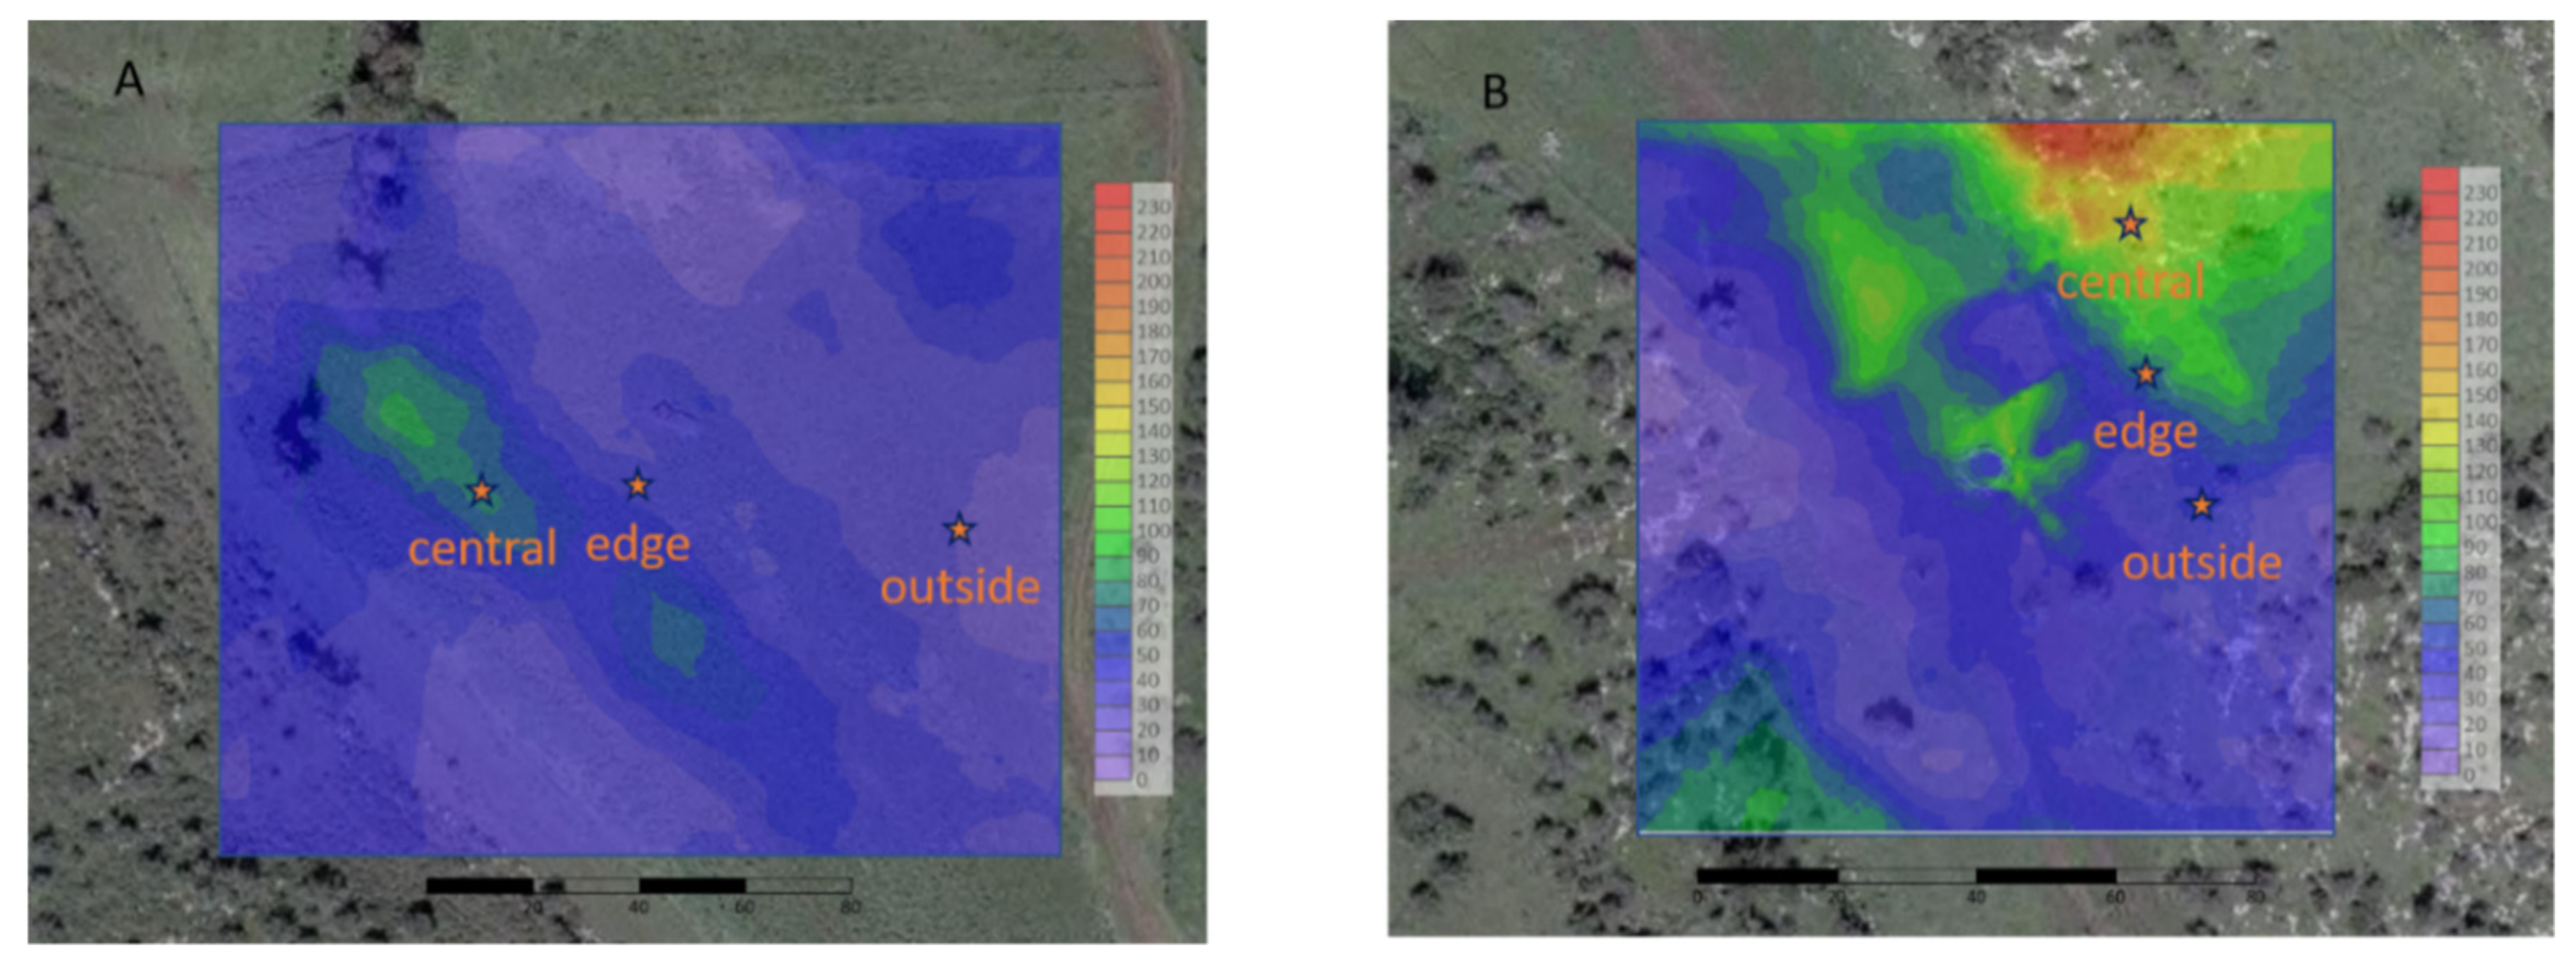
The sensor GEM-2 scanning area was approximately 50 m long and 50 m wide. Lower EC values appear in blue shades, while higher conductivity values appear in red (Figure 5). Figure 6 is based on the EC measurements performed with FDEM in active and abandoned corrals at the Plugot forest site. The center of the two maps represents relatively high EC levels, as shown by the salt layer in the sub-soil (Figure 6). This was found to be anomalous, indicating sub-surface conductivity resulting from the presence of the corral, with a higher conductivity value of about 230 mS/m (Figure 5).
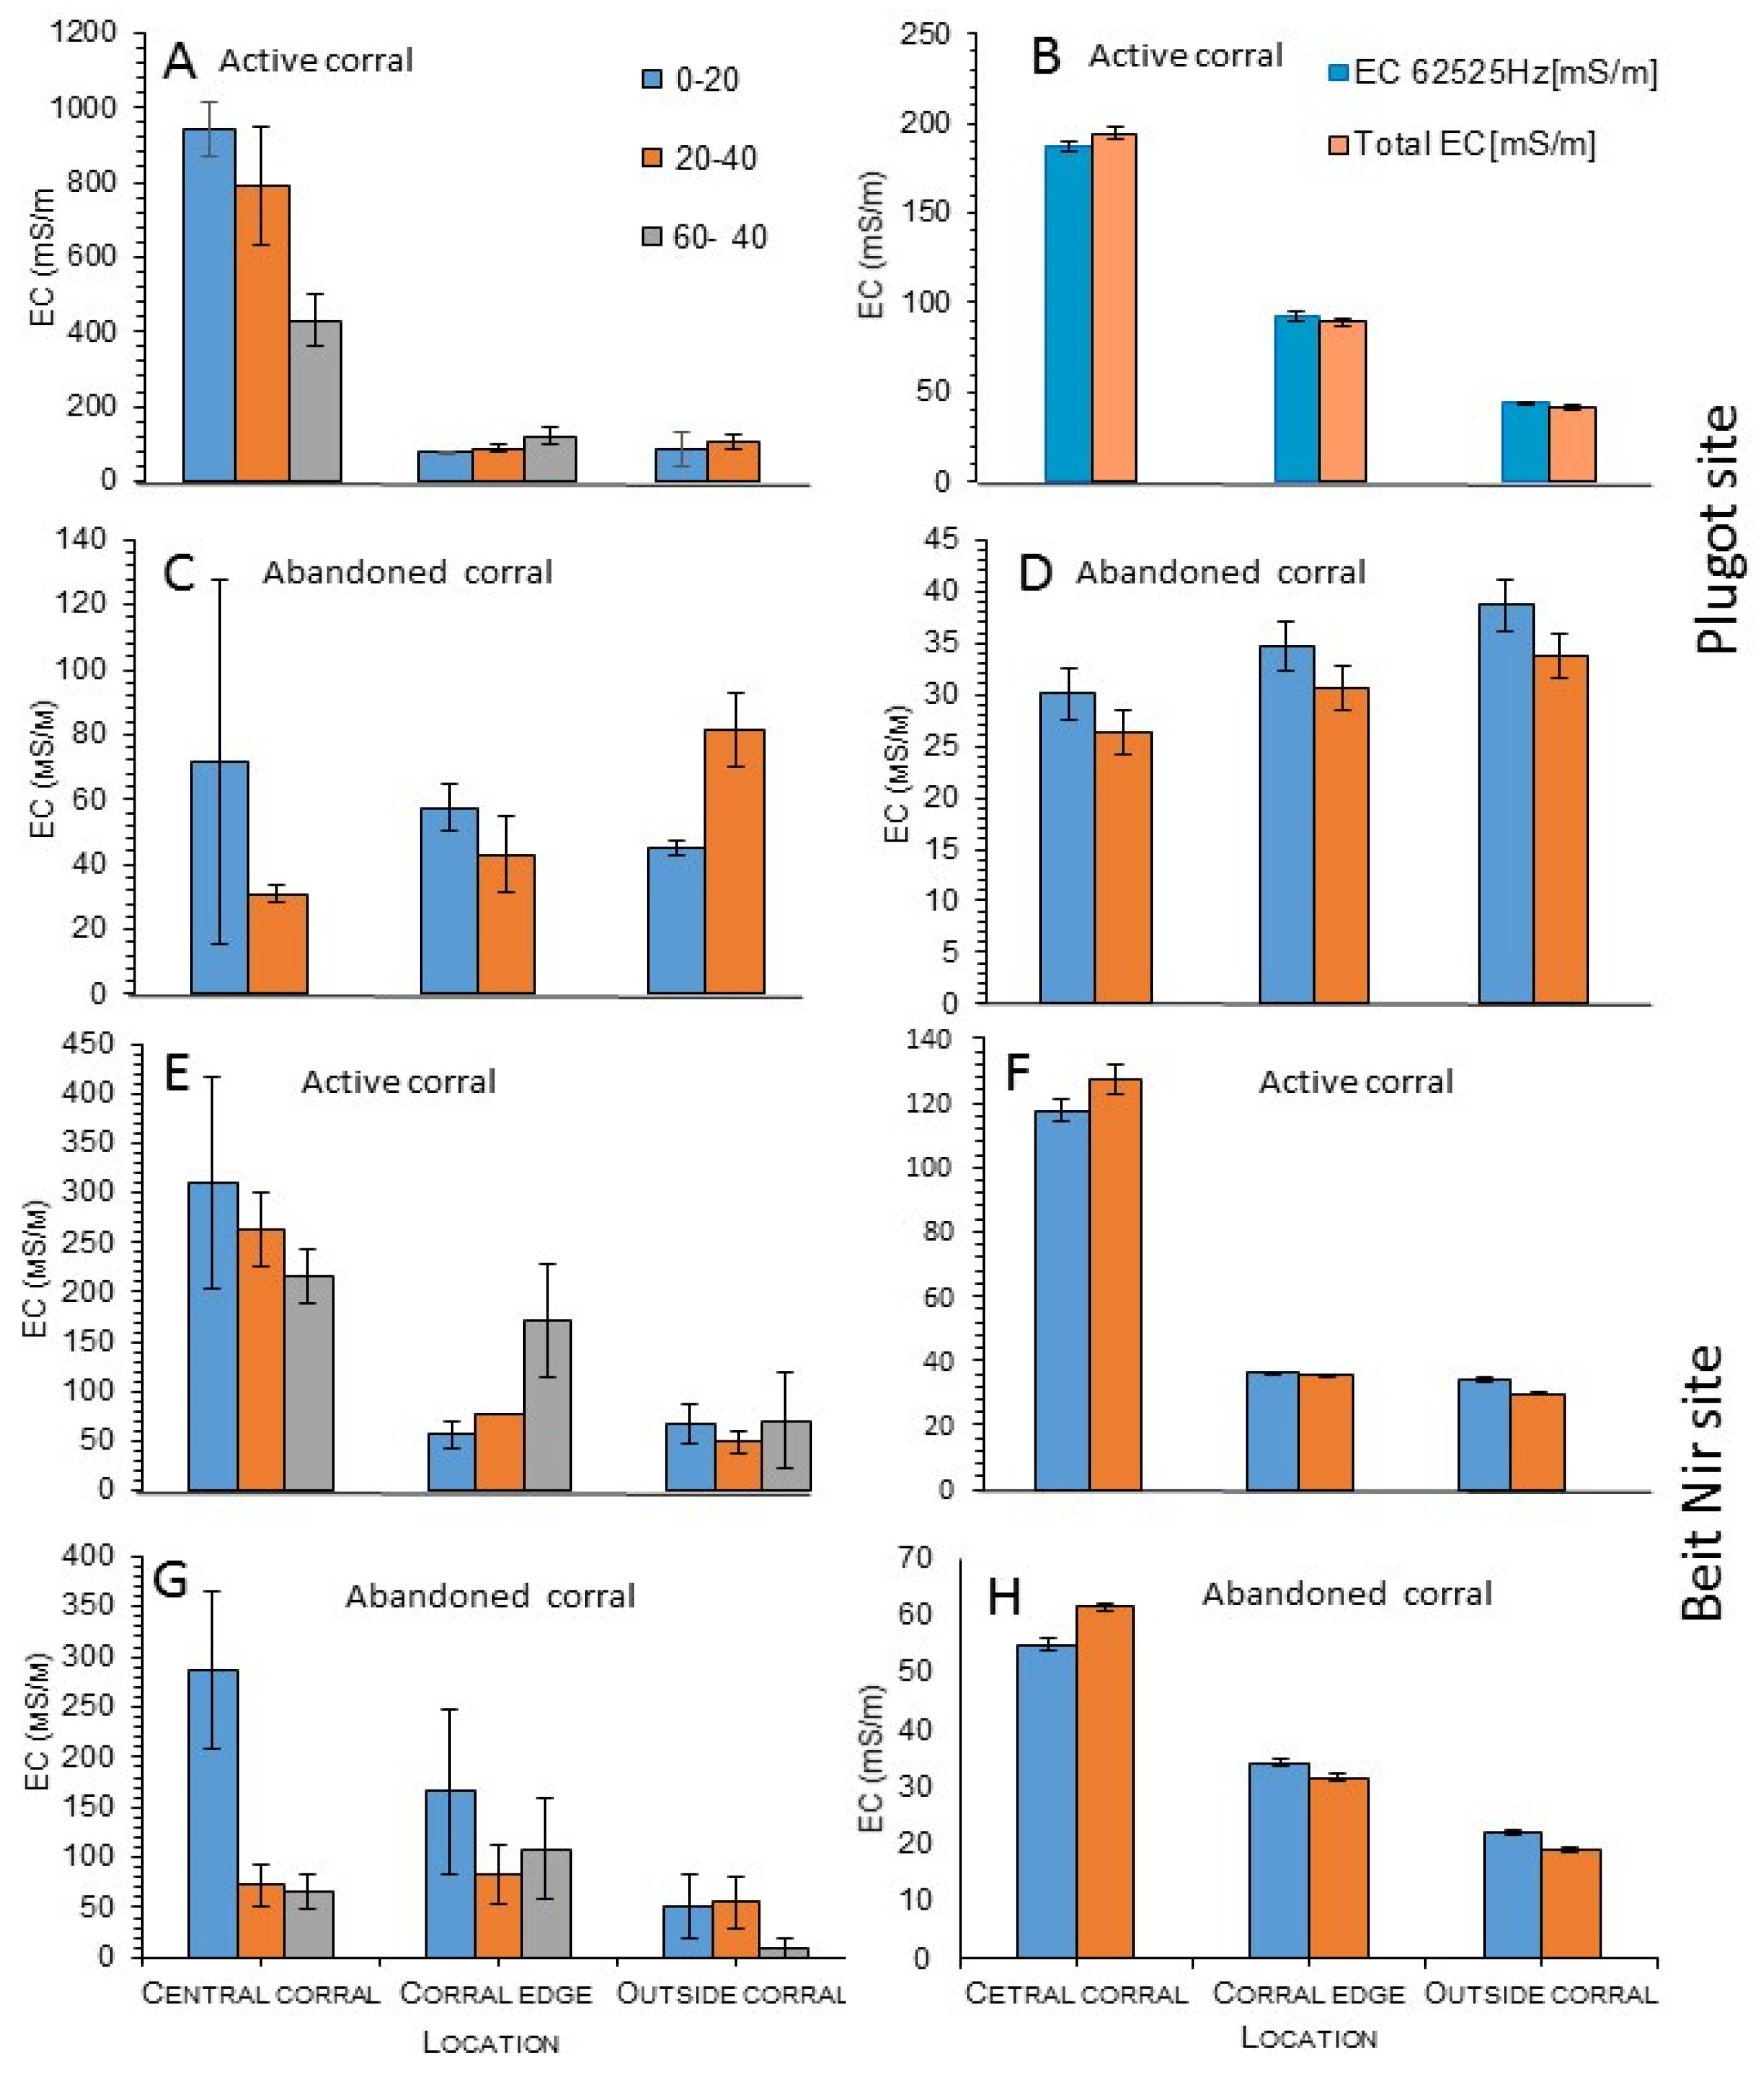
A similar trend was noted in the laboratory measurements along the soil depth in comparison to the FDEM in the active corral at the Plugot site. No differences were found between the soil layers outside the active corral and the corral edge. High values were found in the center of the active corral: 960 mS/m by the laboratory analysis (Figure 7A) and 200 mS/m measured by the FDEM (Figure 7B). Gradient values of EC were found in the center of the active corral upper layer (0–20 cm) in comparison to the lower layers (20–40 and 40–60 cm, respectively) (Figure 7). The values obtained in the abandoned corral in the laboratory were about 10 times lower than those obtained from the active corral and six times lower those obtained with the FDEM (Figure 7A,C and Figure 7B,D, respectively). Almost no differences were found in the pattern between the center, the edge, and outside the corral in both the laboratory analysis and the FDEM measurements in the abandoned corral, although the laboratory showed higher values −80 mS/m in comparison to 40 mS/m, obtained by the FDEM.
3.2. Beit Nir Site
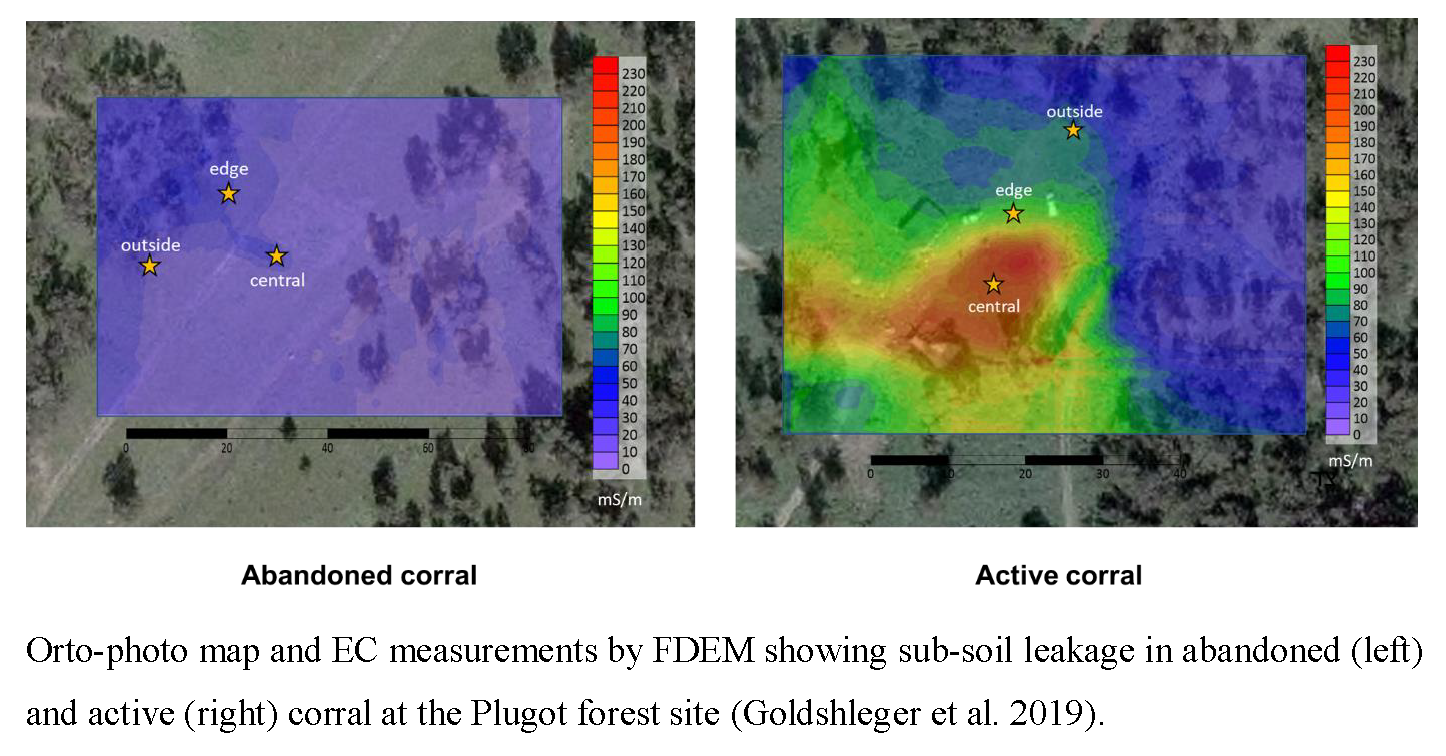
Figure 8 was based on EC measurements carried out with FDEM in abandoned and active corrals at the Beit Nir site. The lower EC values appear in blue shades, while higher conductivity values appear in red. The center of the two maps represents relatively high EC levels, indicating sub-surface conductivity resulting from the presence of the corral. A similar trend was obtained in the laboratory measurements along the soil depth in comparison to the FDEM in the active corral at the Beit Nir site (Figure 7). Differences were also found between the soil layers outside the active corral and at the corral edge. High values were found in the center of the active corral: 300 mS/m by laboratory analysis (Figure 7E) and 130 mS/m measured by the FDEM (Figure 7F). EC gradient values of about 50 mS/m were found in the center of the active corral upper layer (0–20 cm) in comparison to the lower layers (20–40 and 40–60 cm, respectively) (Figure 7G,H).
4. Discussion
The purpose of our study was to develop a practical tool to detect changes with the EC in sub-soil layers of corral areas. The concept is based on using FDEM measurements for a high soil coverage area at a relatively low cost and with real-time laboratory EC measurements.
Grazing intensity affected soil and sub-soil properties [12,32,33], while the accumulation of animal secretions in night corrals intensified the sub-soil effects [2,6,10,13,18]. Akhzari et al. [2] reported using different soil sampling methods: from six 150 m transects, significant differences were found between soil EC values in corral soils in comparison to the nearby landscape. While their study is based on digging to the soil depth and transferring soil samples from the underground layers to the laboratory for chemical analysis, the FDEM technique minimizes labor effort, time and costs.
Our results show that despite the different sources of manure, from cattle at Beit Nir and sheep at Plugot, similar patterns of the EC were obtained in the sub-soil layers between active and abandoned corrals at both sites. EC was higher in the center and lower at the edge and outside the corral; moreover, it decreased with depth. A similar pattern was observed between the two methods regarding the lowest area and the topographic changes. The difference obtained between the two methods showed a correlation between the laboratory analysis and the electromagnetic analysis at both sites (between active corrals, r2 = 0.76, p = 0.0021).
In the abandoned corrals (5 to 10 years old) [13], we found that the differences between the center of the corrals and the adjacent natural area were less significant than the differences between the center of the active corral and the outer natural area. This may indicate changes over time that result from the leakage of the salts to the sub-soil underground.
The results of the FDEM and the laboratory methods show good trend correlation; however, the values cannot be identical because of the inherent differences between these EM methods of measurement: (1) AC vs. DC: while FDEM measures AC (alternating current) in the field at different frequencies, a DC (direct current) method is used in the laboratory; (2) volume differences of 5–6 orders of magnitudes: “spatial” vs. “point/local” (the FDEM is “spatial volumetric” method—samples are of a volume magnitude of m3, while the laboratory uses a “point/local measurement” method—samples are of a volume magnitude of only several cm3 to several tens of cm3); (3) field natural and nondestructive vs. laboratory destructive conditions: for the FDEM, nondestructive and non-contact methods are used, wherein samples are at their natural conditions, while in the laboratory a “wet” unnatural condition is necessary for DC measurements, wherein samples are mixed with distilled water at ratio of 1:1 to allow the current flow.
5. Conclusions
The results show that different sources of manure (cattle at Beit Nir and sheep at Plugot) have very similar patterns of EC obtained in the sub-soil layers, between active and abandoned corrals at both sites. The obtained results show a correlation between the laboratory soil analysis and the electromagnetic analysis at all sites. A similar pattern and trend were observed between the two methods in terms of the topographic changes.
This correlation was expressed by high EC values in the center, low EC values at the edge and outside the corral, and decreasing EC values with increasing depth. This is an important factor, as the EC values cannot be the same because of the inherent difference between the FDEM and laboratory methods for EC measurements.
Author Contributions
N.G. and E.Z. were the project leaders and wrote the manuscript; O.S. helped with collecting the field data; U.B. helped with the analysis. All authors reviewed and approved the final version.
Funding
Please add: This research received no external funding.
Acknowledgments
To the memory of Naftali Goldshleger. The authors would like to thank Shimshon Shuker and Hiam Abu-Glaion for help in the laboratory and fieldwork.
Conflicts of Interest
The authors declare no conflict of interest.
References
- Noy-Meir, I.; Seligman, N.D. Management of semi-arid ecosystems in Israel. In Management of Semi-Arid Ecosystems; Walker, B.H., Ed.; Elsevier: Oxford, UK, 1979. [Google Scholar]
- Akhzari, D.; Pessarakli, M. Effects of exclosure on soil nutrients, vegetation diversity and biomass production in hilly rangelands. J. Plant Nut. 2016, 39, 1776–1782. [Google Scholar] [CrossRef]
- Moradi, E.; Heshmati, G.A.; Ghilishli, F.; Zohreh, M.S.; Pessarakli, M. Grazing intensity and environmental factors effects on species composition and diversity in rangelands of Iran. J. Plant Nut. 2016, 39, 2002–2014. [Google Scholar] [CrossRef]
- Reeder, J.D.; Schuman, G.E. Influence of livestock grazing on C sequestration in semi-arid mixed-grass and short rangelands. Environ. Pollut. 2002, 116, 457–463. [Google Scholar] [CrossRef]
- Augustine, D.J. Long-term, livestock-mediated redistribution of nitrogen and phosphorus in an East African savanna. J. Appl. Ecol. 2003, 40, 137–149. [Google Scholar] [CrossRef] [Green Version]
- Zaady, E.; Yonatan, R.; Shachak, M.; Perevolotsky, A. The effects of grazing on abiotic and biotic parameters in a semiarid ecosystem: A case study from the Northern Negev, Israel. Arid Land Res. Manag. 2001, 15, 245–361. [Google Scholar] [CrossRef]
- Schoenbaum, I.; Kigel, J.; Barkai, D.; Landau, S. Weed infestation of wheat field by sheep stubble grazing in Mediterranean semiarid region. Crop Past. Sci. 2009, 60, 1–9. [Google Scholar] [CrossRef]
- Stavi, I.; Barkai, D.; Islam, K.R.; Zaady, E. No adverse effect of moderate stubble grazing on soil quality and organic carbon pool in dryland wheat agro-ecosystems. Agron. Sustain. Dev. 2015, 35, 1117–1125. [Google Scholar] [CrossRef] [Green Version]
- Klemmedson, J.O.; Tiedemann, A.R. Soil and vegetation development in an abandoned sheep corral on degraded sub-alpine rangeland. Great Basin Nat. 1994, 54, 301–312. [Google Scholar]
- Zhang, Y.J.; Jiang, W.L.; Ren, J.Z. Effects of sheep night corralling on soil nitrogen and plant growth. N. Z. J. Agric. Res. 2001, 44, 151–157. [Google Scholar] [CrossRef]
- Leytem, A.B.; Seefeldt, S.S. Impact of sheep bedding on soil nutrient dynamics in the centennial mountains of Montana and Idaho. Soil Sci. 2008, 173, 503–510. [Google Scholar] [CrossRef]
- Nüsse, A.; Linsler, D.; Kaiser, M.; Ebeling, D.; Tonn, B.; Isselstein, J.; Ludwig, B. Effect of grazing intensity and soil characteristics on soil organic carbon and nitrogen stocks in a temperate long-term grassland. Arch. Agron. Soil Sci. 2017, 63, 1776–1783. [Google Scholar] [CrossRef]
- Vinograd, A.; Zaady, E.; Kigel, J. Dynamics of soil nutrients in abandoned sheep corrals in semi-arid Mediterranean planted forests. J. Arid Environ. 2019, 164, 38–45. [Google Scholar] [CrossRef]
- Bromfield, S.M.; Jones, O.L. The effect of sheep on the recycling of phosphorous in hayed-off pastures. Aust. J. Agric. Res. 1970, 21, 699–711. [Google Scholar] [CrossRef]
- Kieft, T.L. Grazing and plant-canopy effects on semiarid soil microbial biomass and respiration. Biol. Fert. Soils 1994, 18, 155–162. [Google Scholar] [CrossRef]
- Stavi, I.; Lavee, H.; Ungar, E.D.; Sarah, P. Eco-geomorphic feedbacks in semi–arid rangelands: A review. Pedosphere 2009, 19, 217–229. [Google Scholar] [CrossRef]
- Wu, G.L.; Du, G.Z.; Liu, Z.H.; Thirgood, S. Effect of fencing and grazing on a Kobresia-dominated meadow in the Qinghai-Tibetan Plateau. Plant Soil 2009, 319, 115–126. [Google Scholar] [CrossRef]
- Shand, C.A.; Coutts, G. The effects of sheep faeces on soil solution composition. Plant Soil 2006, 285, 135–148. [Google Scholar] [CrossRef]
- Paz-Kagan, T.; Shachak, M.; Zaady, E.; Karnieli, A. Evaluation of land-use transformation using soil quality and primary productivity in a semi-arid area, Israel. Agric. Ecosyst. Environ. 2014, 193, 9–24. [Google Scholar] [CrossRef]
- Yuan, H.; Hou, F. Grazing intensity and soil depth effects on soil properties in alpine meadow pastures of Qilian Mountain in northwest China. Acta Agric. Scand. Sect. B—Soil Plant Sci. 2015, 65, 222–232. [Google Scholar] [CrossRef]
- Akhzari, D.; Pessarakli, M.; Eftekhari, A.S. Effects of grazing intensity on soil and vegetation properties in a Mediterranean rangeland. Commun. Soil Sci. Plant Anal. 2015, 46, 2798–2806. [Google Scholar] [CrossRef]
- Triantafilis, J.; Laslett, G.M.; McBratney, A.B. Calibrating an Electromagnetic Induction Instrument to Measure Salinity in Soil under Irrigated Cotton. Soil Sci. Soc. Am. J. 2000, 64, 1009–1017. [Google Scholar] [CrossRef]
- Triantafilis, J.; Odeh, I.O.A.; McBratney, A.B. Five Geostatistical Models to Predict Soil Salinity from Electromagnetic Induction Data Across Irrigated Cotton. Soil Sci. Soc. Am. J. 2001, 65, 869–878. [Google Scholar] [CrossRef]
- Simon, F.-X.; Tabbagh, A.; Thiesson, J.; Sarris, A. Practical Assessment of a Multi-Frequency Slingram EMI for Archaeological Prospection; Presented at the CAA: Paris, France, 2014. [Google Scholar]
- Israel Meteorological Service. 2019. Available online: http://www.ims.gov.il/ (accessed on 31 August 2019).
- Methods of Soil Analysis-Soil; Part 3, Chemical Methods; Science Society of Amreica: Madison, WI, USA, 1996; pp. 417–433.
- Ward, S.H. Electromagnetic theory for geophysical applications. In Mining Geophysics II; The Society of Exploration Geophysicists: Tulsa, OK, USA, 1967; pp. 13–196. [Google Scholar]
- Ward, S.H.; Hohmann, G.W. Electromagnetic theory for geophysical applications. In Electromagnetic Methods in Applied Geophysics: Volume 1 Theory; Society of Exploration Geophysicists: Tulsa, OK, USA, 1988; pp. 130–311. [Google Scholar]
- Won, I.J.; Huang, H. Magnetometers and electro-magnetometers. Lead. Edge 2004, 23, 448–451. [Google Scholar] [CrossRef]
- Huang, H.; Won, I.J. Real-time resistivity sounding using a hand-held broadband electromagnetic sensor. Geophysics 2003, 68, 1224–1231. [Google Scholar] [CrossRef]
- Huang, H. Depth of investigation for small broadband electromagnetic sensors. Gophysics 2005, 70, G135–G142. [Google Scholar] [CrossRef]
- Li, X.; Zhang, C.; Fu, H.; Guo, D.; Song, X.; Wan, C.; Ren, J. Grazing exclusion alters soil microbial respiration, root respiration and the soil carbon balance in grasslands of the Loess Plateau, northern China. Soil Sci. Plant Nut. 2013, 59, 877–887. [Google Scholar] [CrossRef] [Green Version]
- Thompson, T.L.; Zaady, E.; Huancheng, P.; Wilson, T.B.; Martens, D.A. Soil C and N in patchy shrublands of the Negev and Chihuahuan Deserts: A Comparative Study. Soil Biol. Biochem. 2006, 38, 1943–1955. [Google Scholar] [CrossRef]
Figure 1.
(a) Downstream contamination of animal secretions leaking from a sheep corral; (b) Gem-2 frequency domain electromagnetic method (FDEM) measurements.
Figure 1.
(a) Downstream contamination of animal secretions leaking from a sheep corral; (b) Gem-2 frequency domain electromagnetic method (FDEM) measurements.
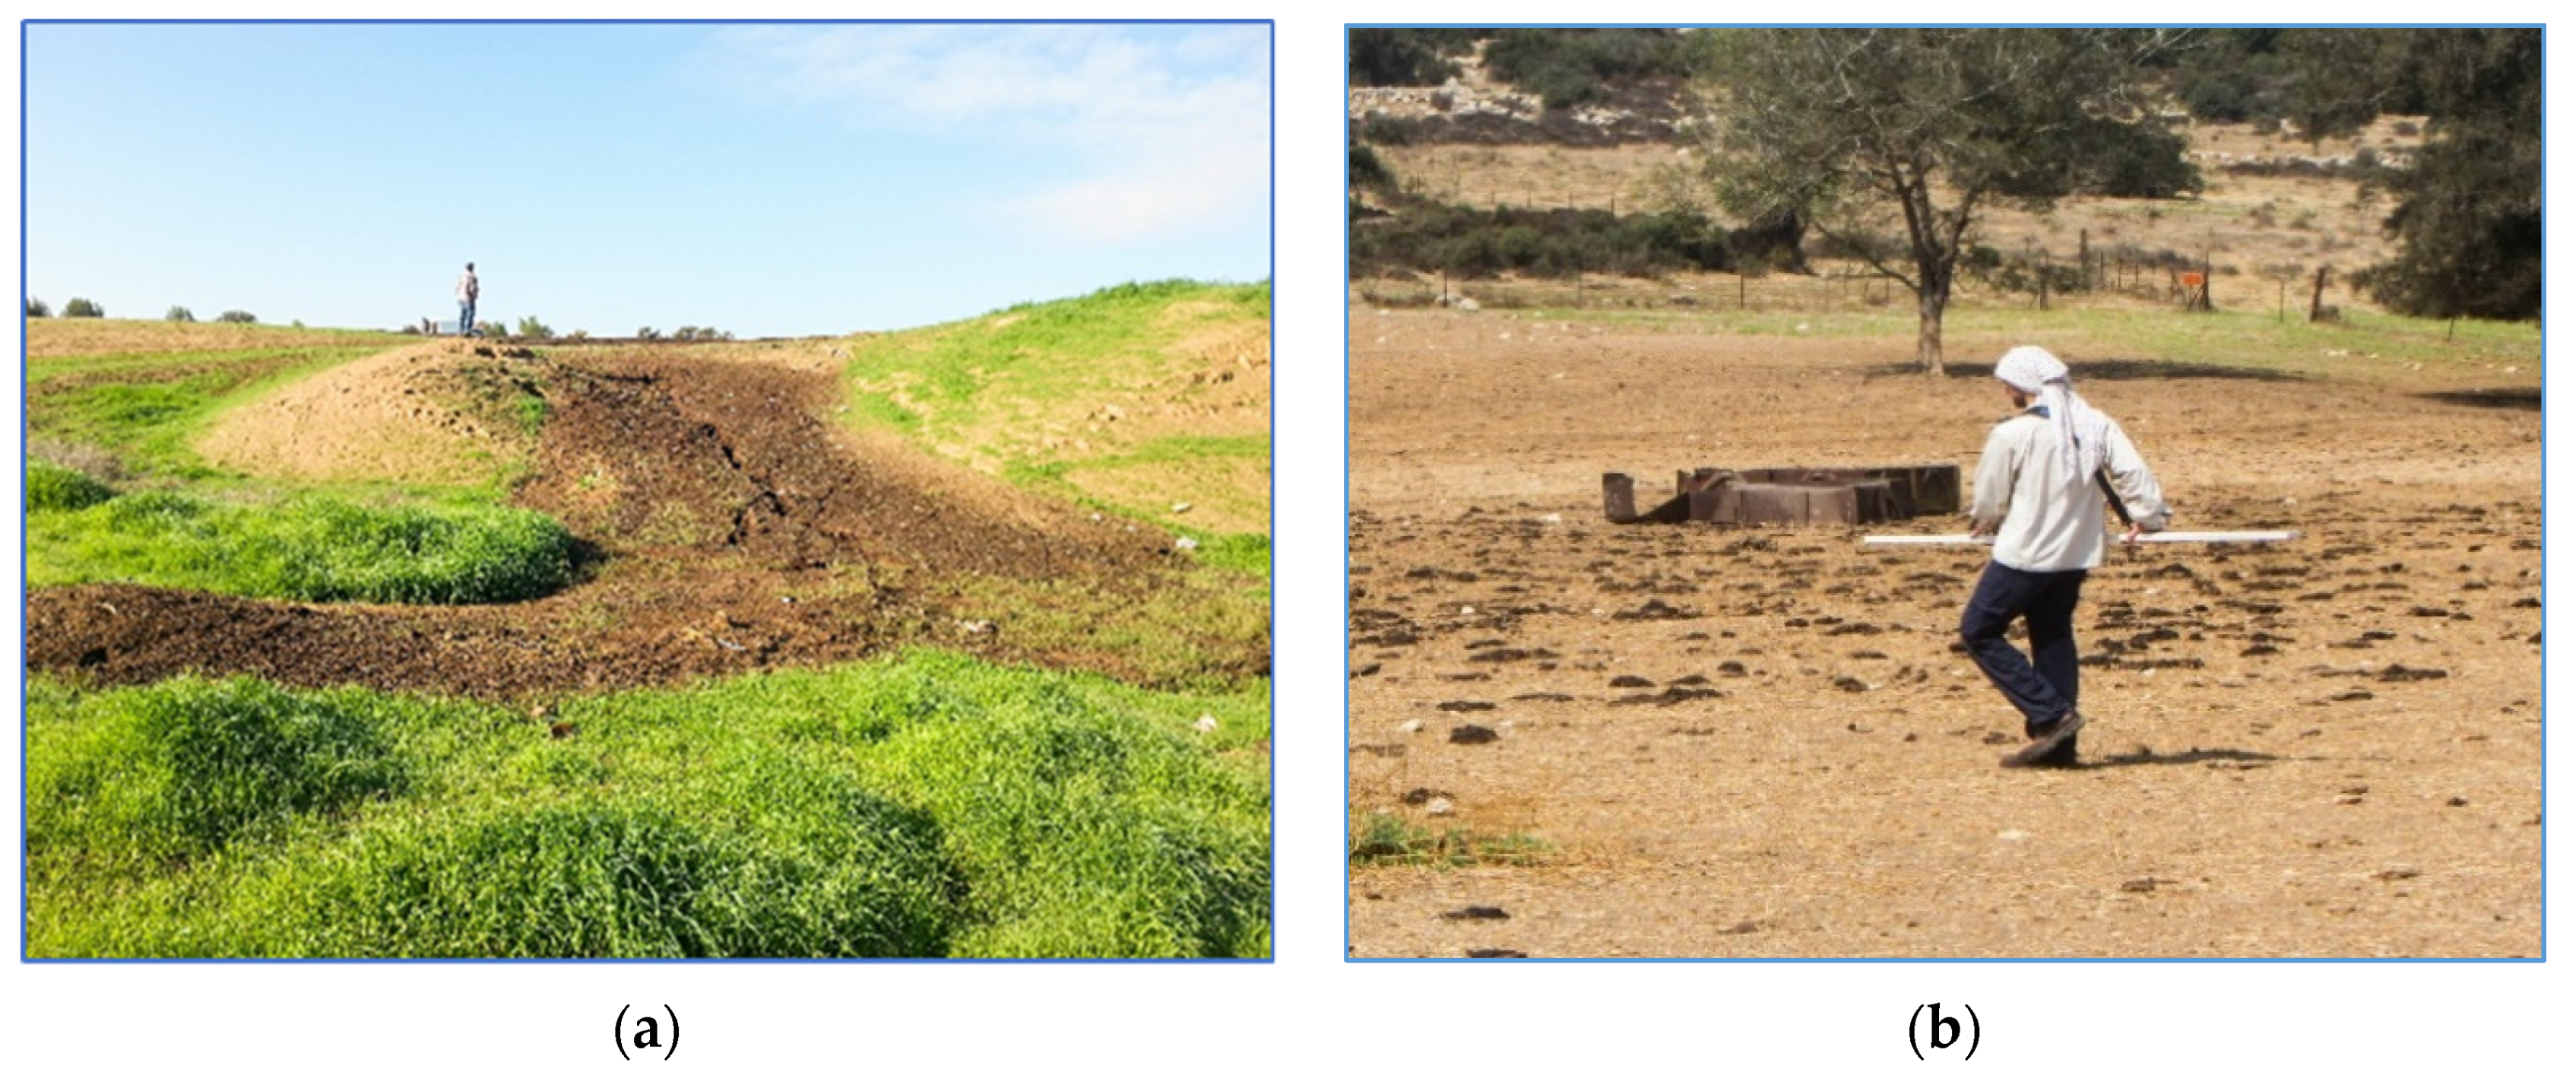
Figure 2.
Schematic map of the research sites in the northern Negev and the Shefelat Yehuda.
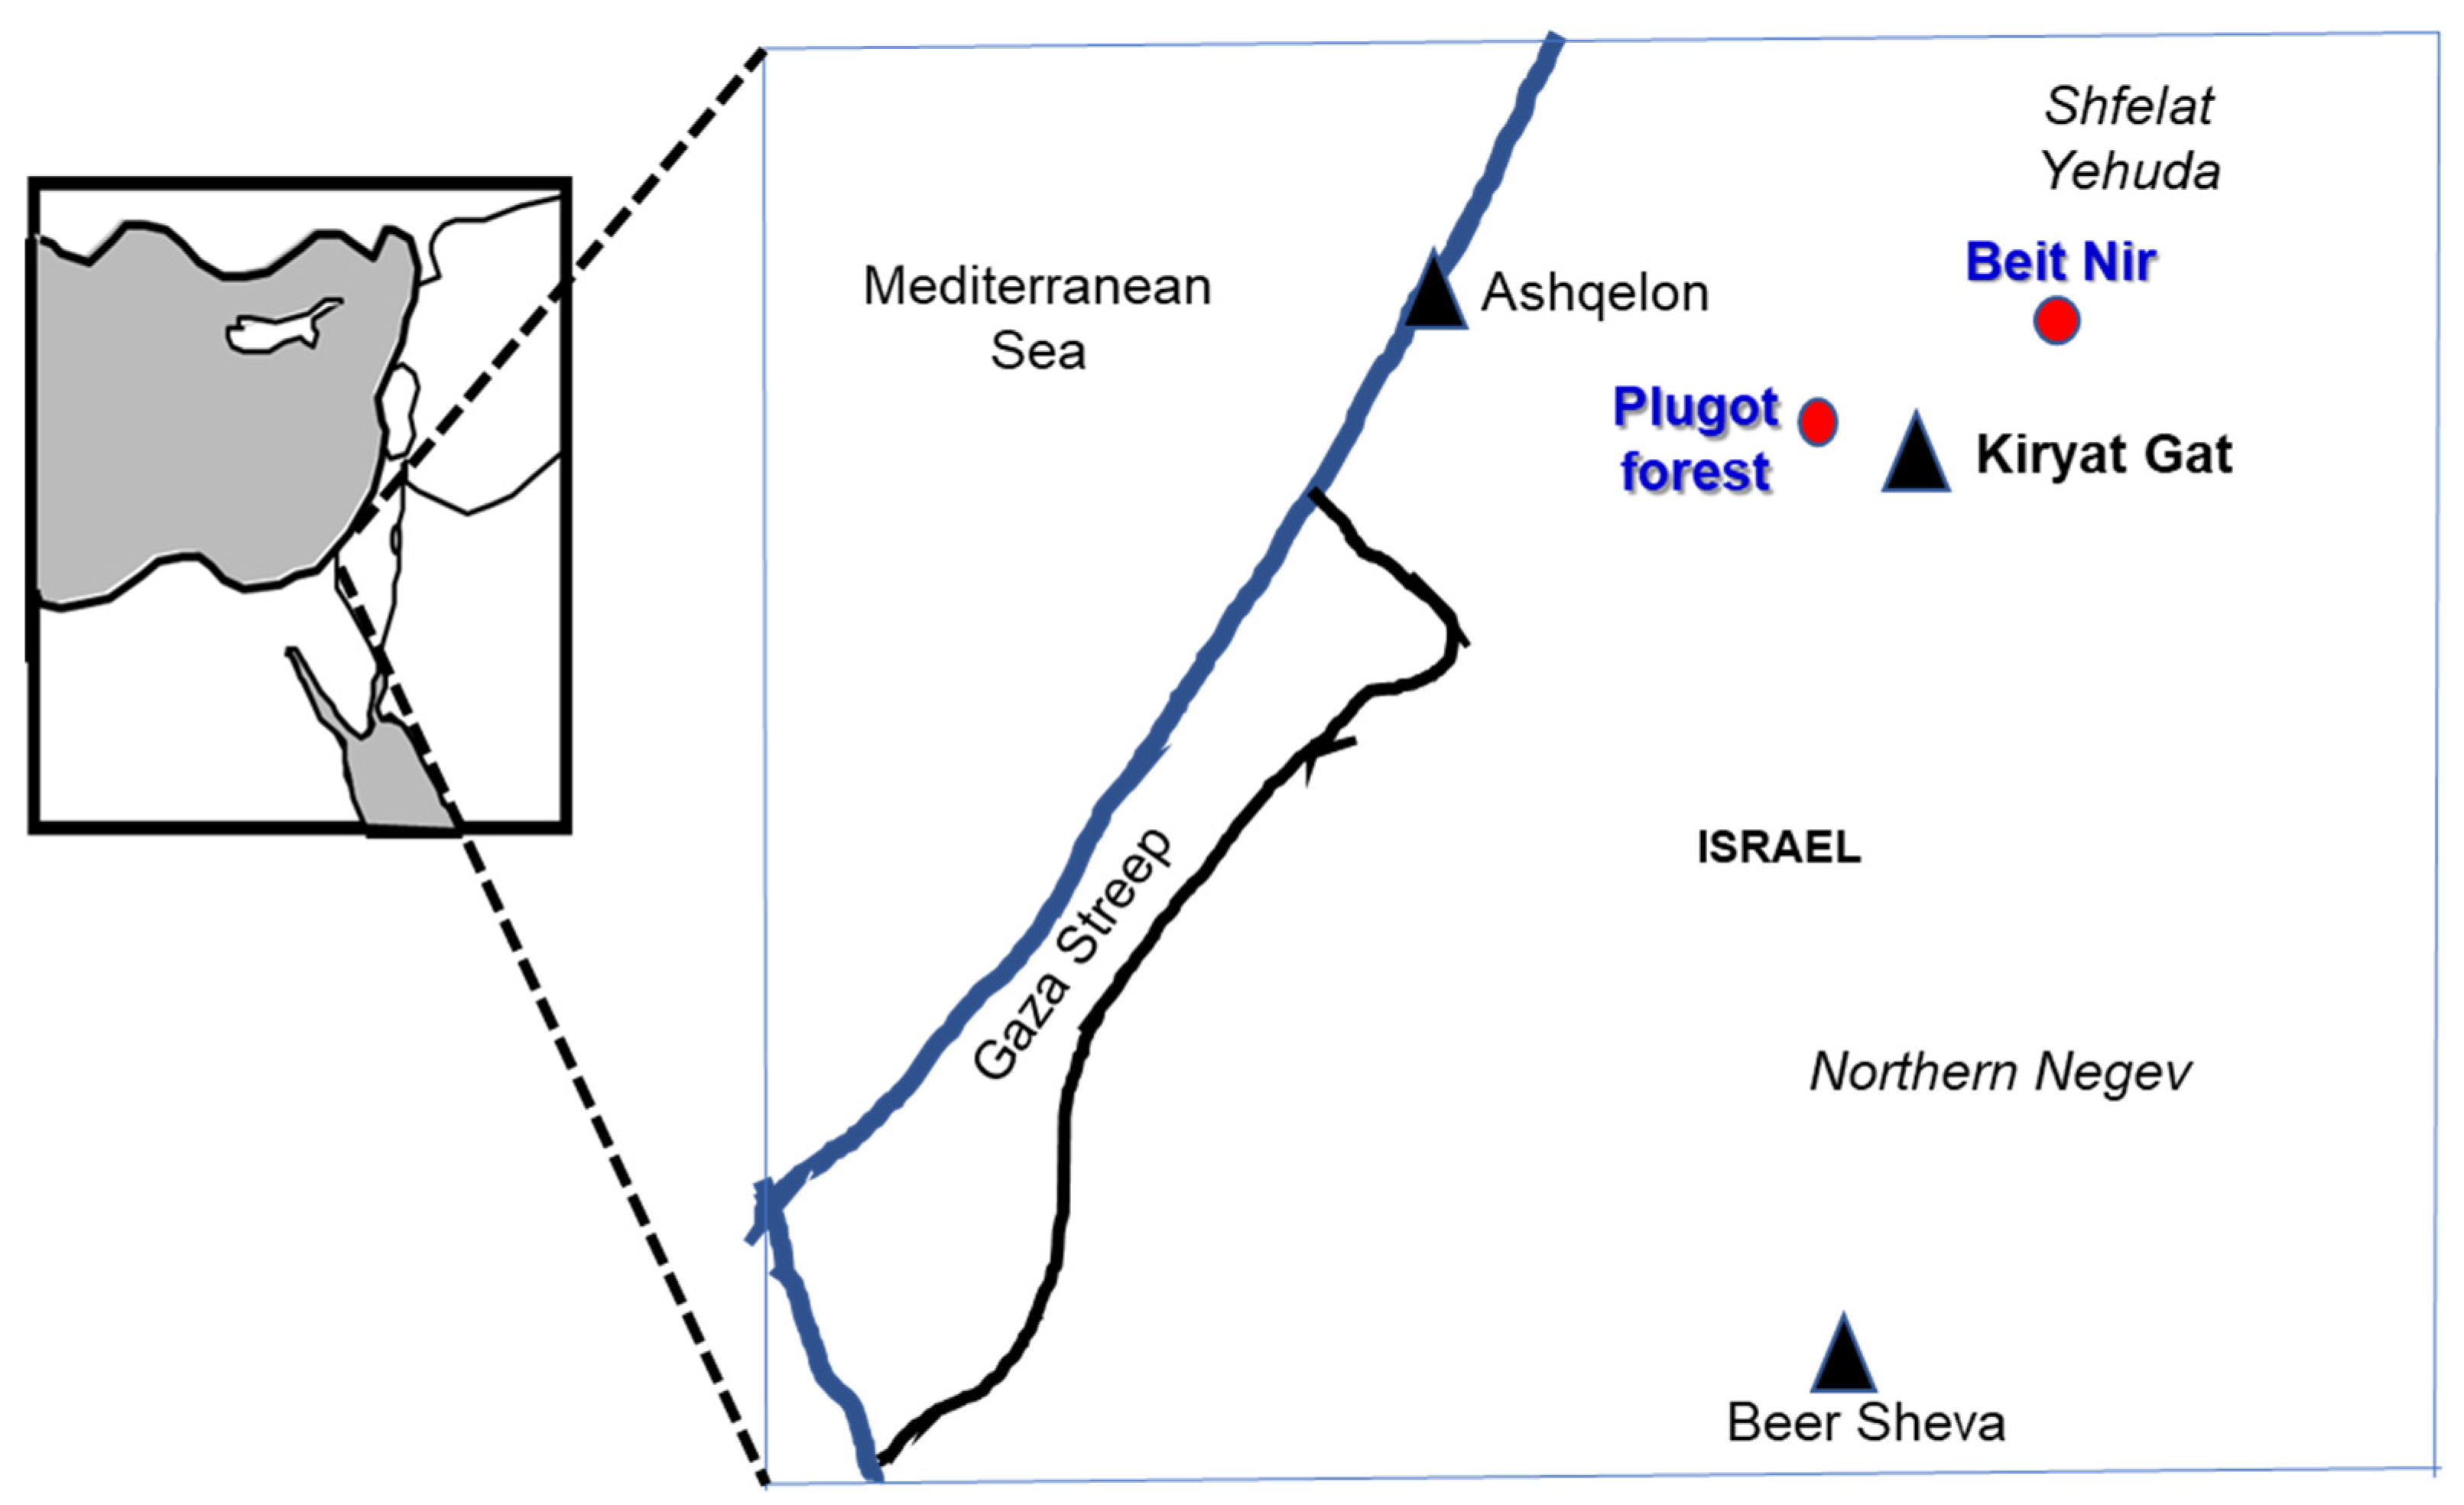
Figure 3.
Geometry of the horizontal coplanar electromagnetic sensor over layered earth where σ is the conductivity, t is the thickness of each layer, the subscripts stand for the number of layers, s is the coil separation and h is the sensor height [30].
Figure 3.
Geometry of the horizontal coplanar electromagnetic sensor over layered earth where σ is the conductivity, t is the thickness of each layer, the subscripts stand for the number of layers, s is the coil separation and h is the sensor height [30].
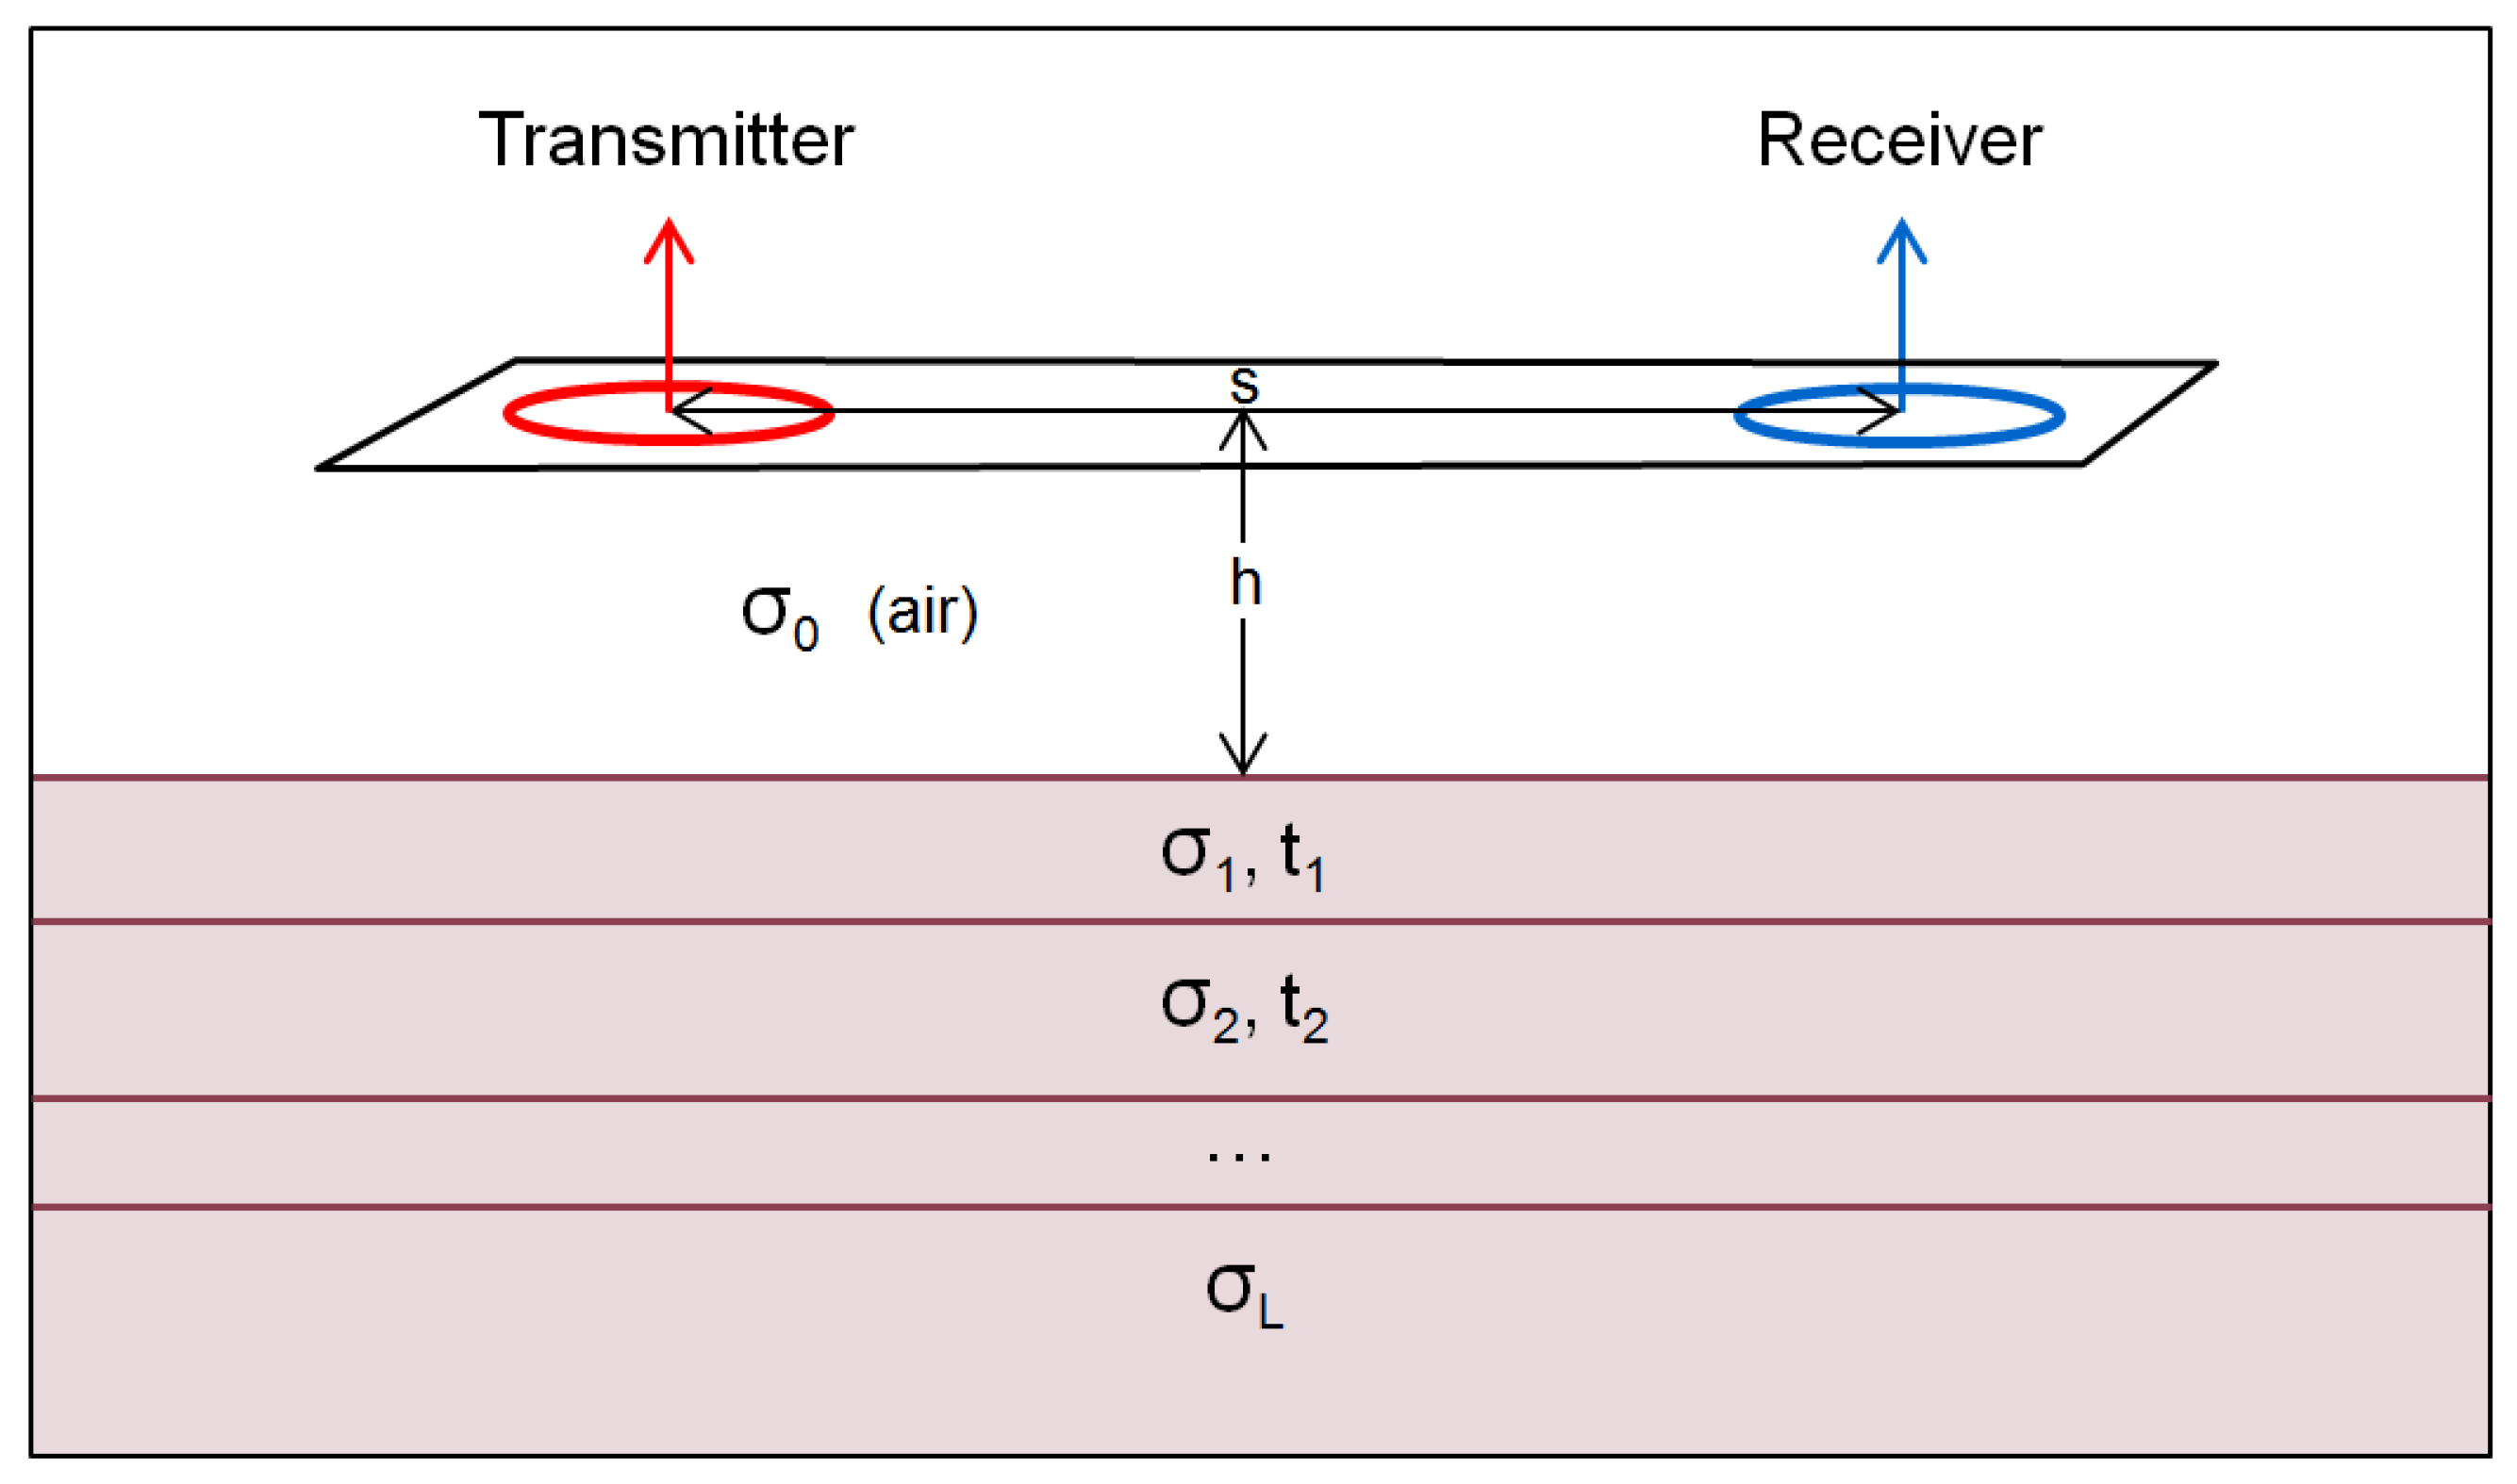
Figure 4.
FDEM frequency results from Beit Nir site in active corral: 22,525 Hz, 29,075 Hz, 37,525 Hz, 48,425 Hz and 62,525 Hz.
Figure 4.
FDEM frequency results from Beit Nir site in active corral: 22,525 Hz, 29,075 Hz, 37,525 Hz, 48,425 Hz and 62,525 Hz.

Figure 5.
Orto-photo map and electrical conductivity (EC) measurements by FDEM showing leakage in an abandoned (left) and active (right) corral at the Plugot forest site.
Figure 5.
Orto-photo map and electrical conductivity (EC) measurements by FDEM showing leakage in an abandoned (left) and active (right) corral at the Plugot forest site.
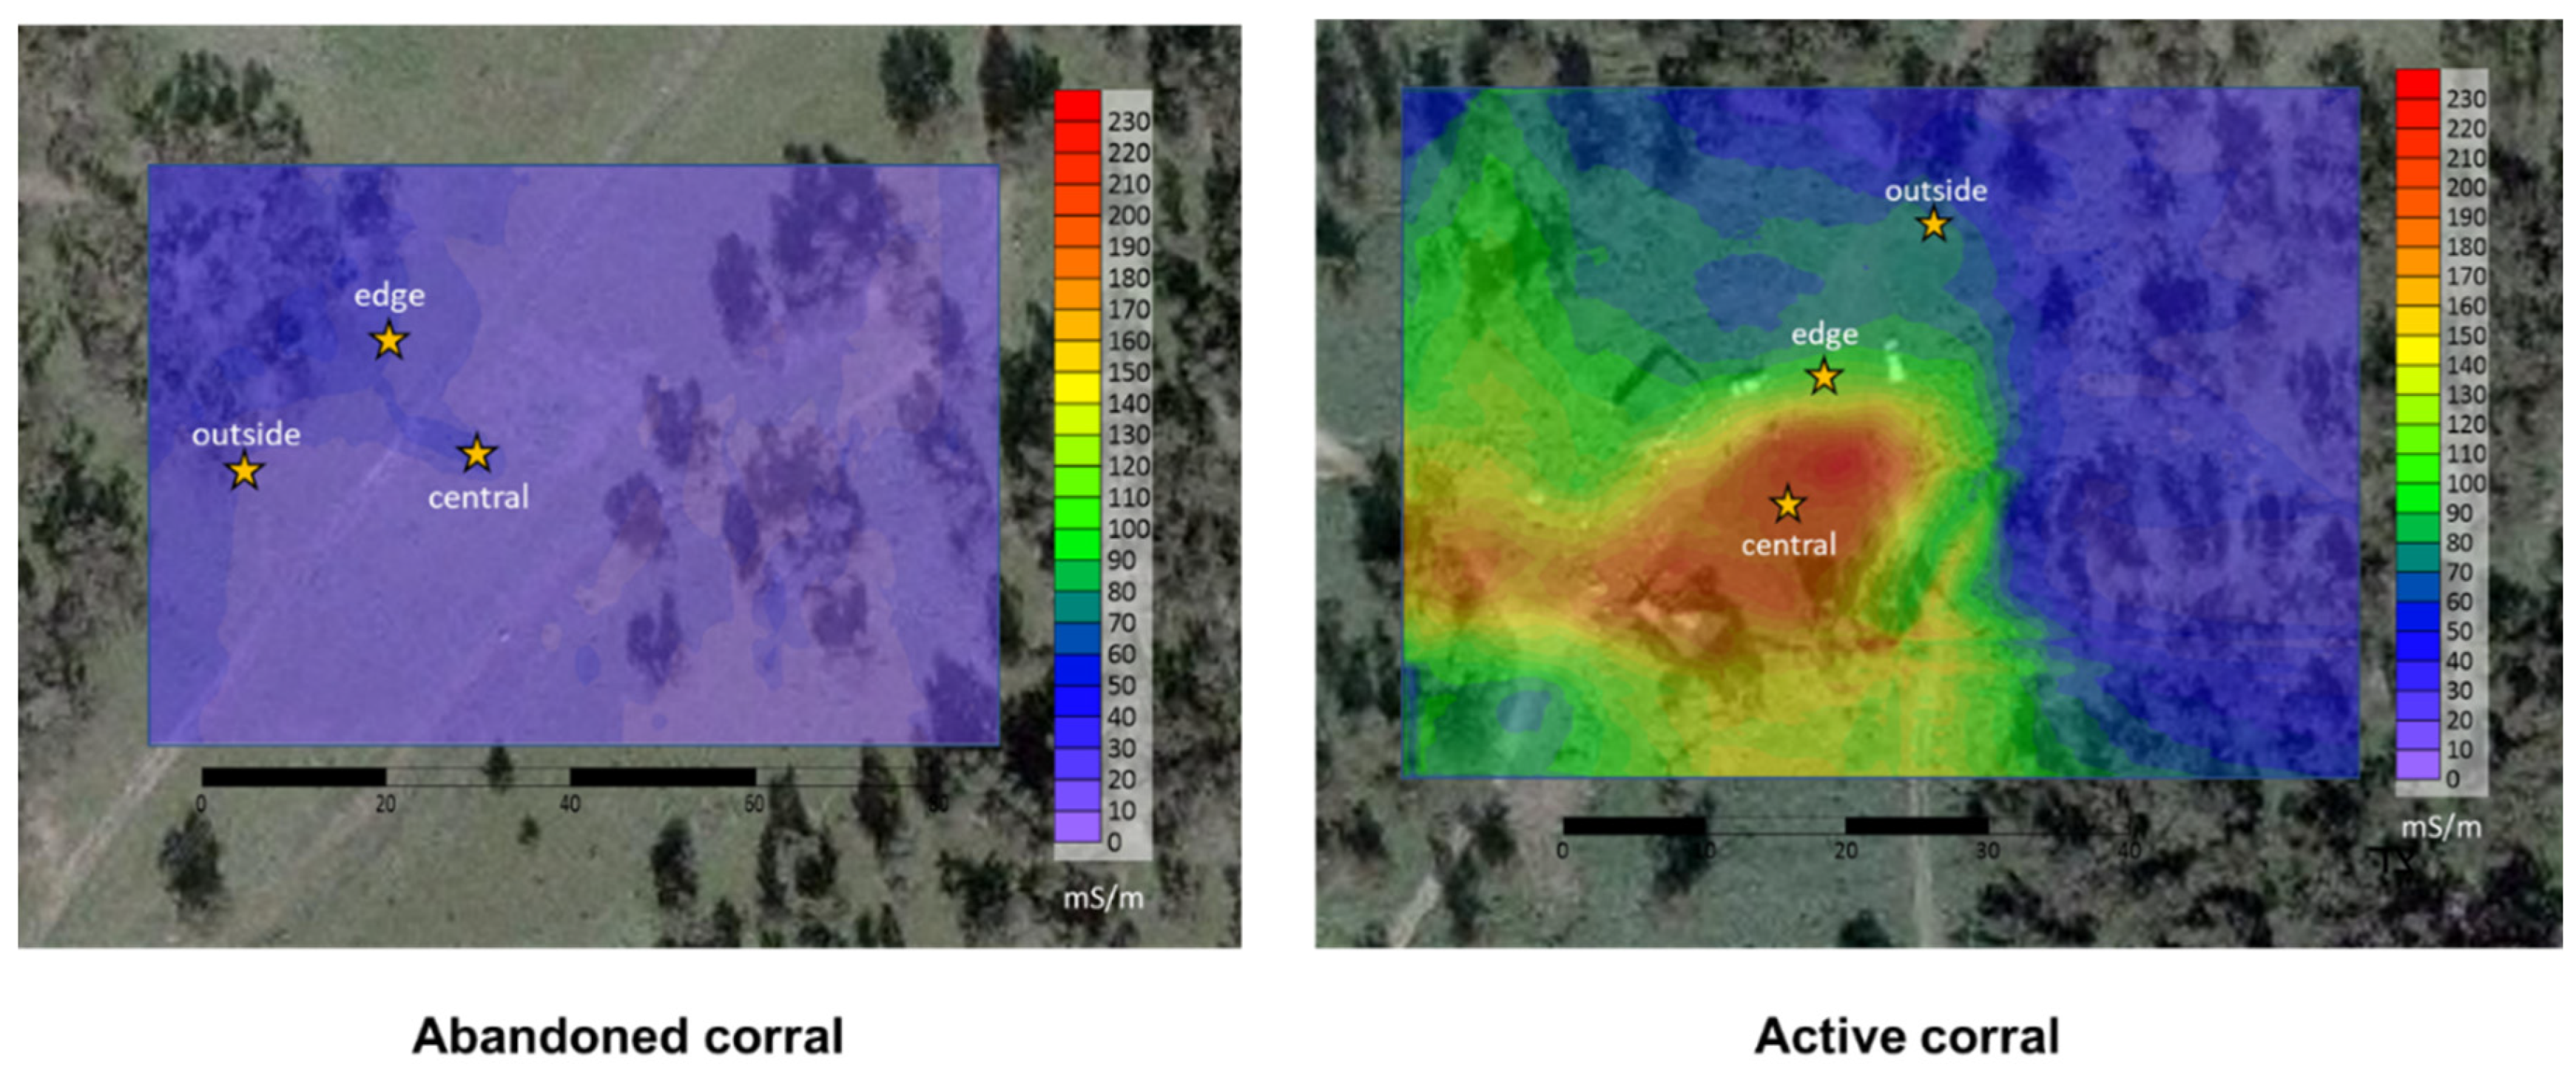
Figure 6.
Exposure of a layer, at a depth of 20 cm, of salts in the sub-soil of the active sheep corral in Plugot forest.
Figure 6.
Exposure of a layer, at a depth of 20 cm, of salts in the sub-soil of the active sheep corral in Plugot forest.
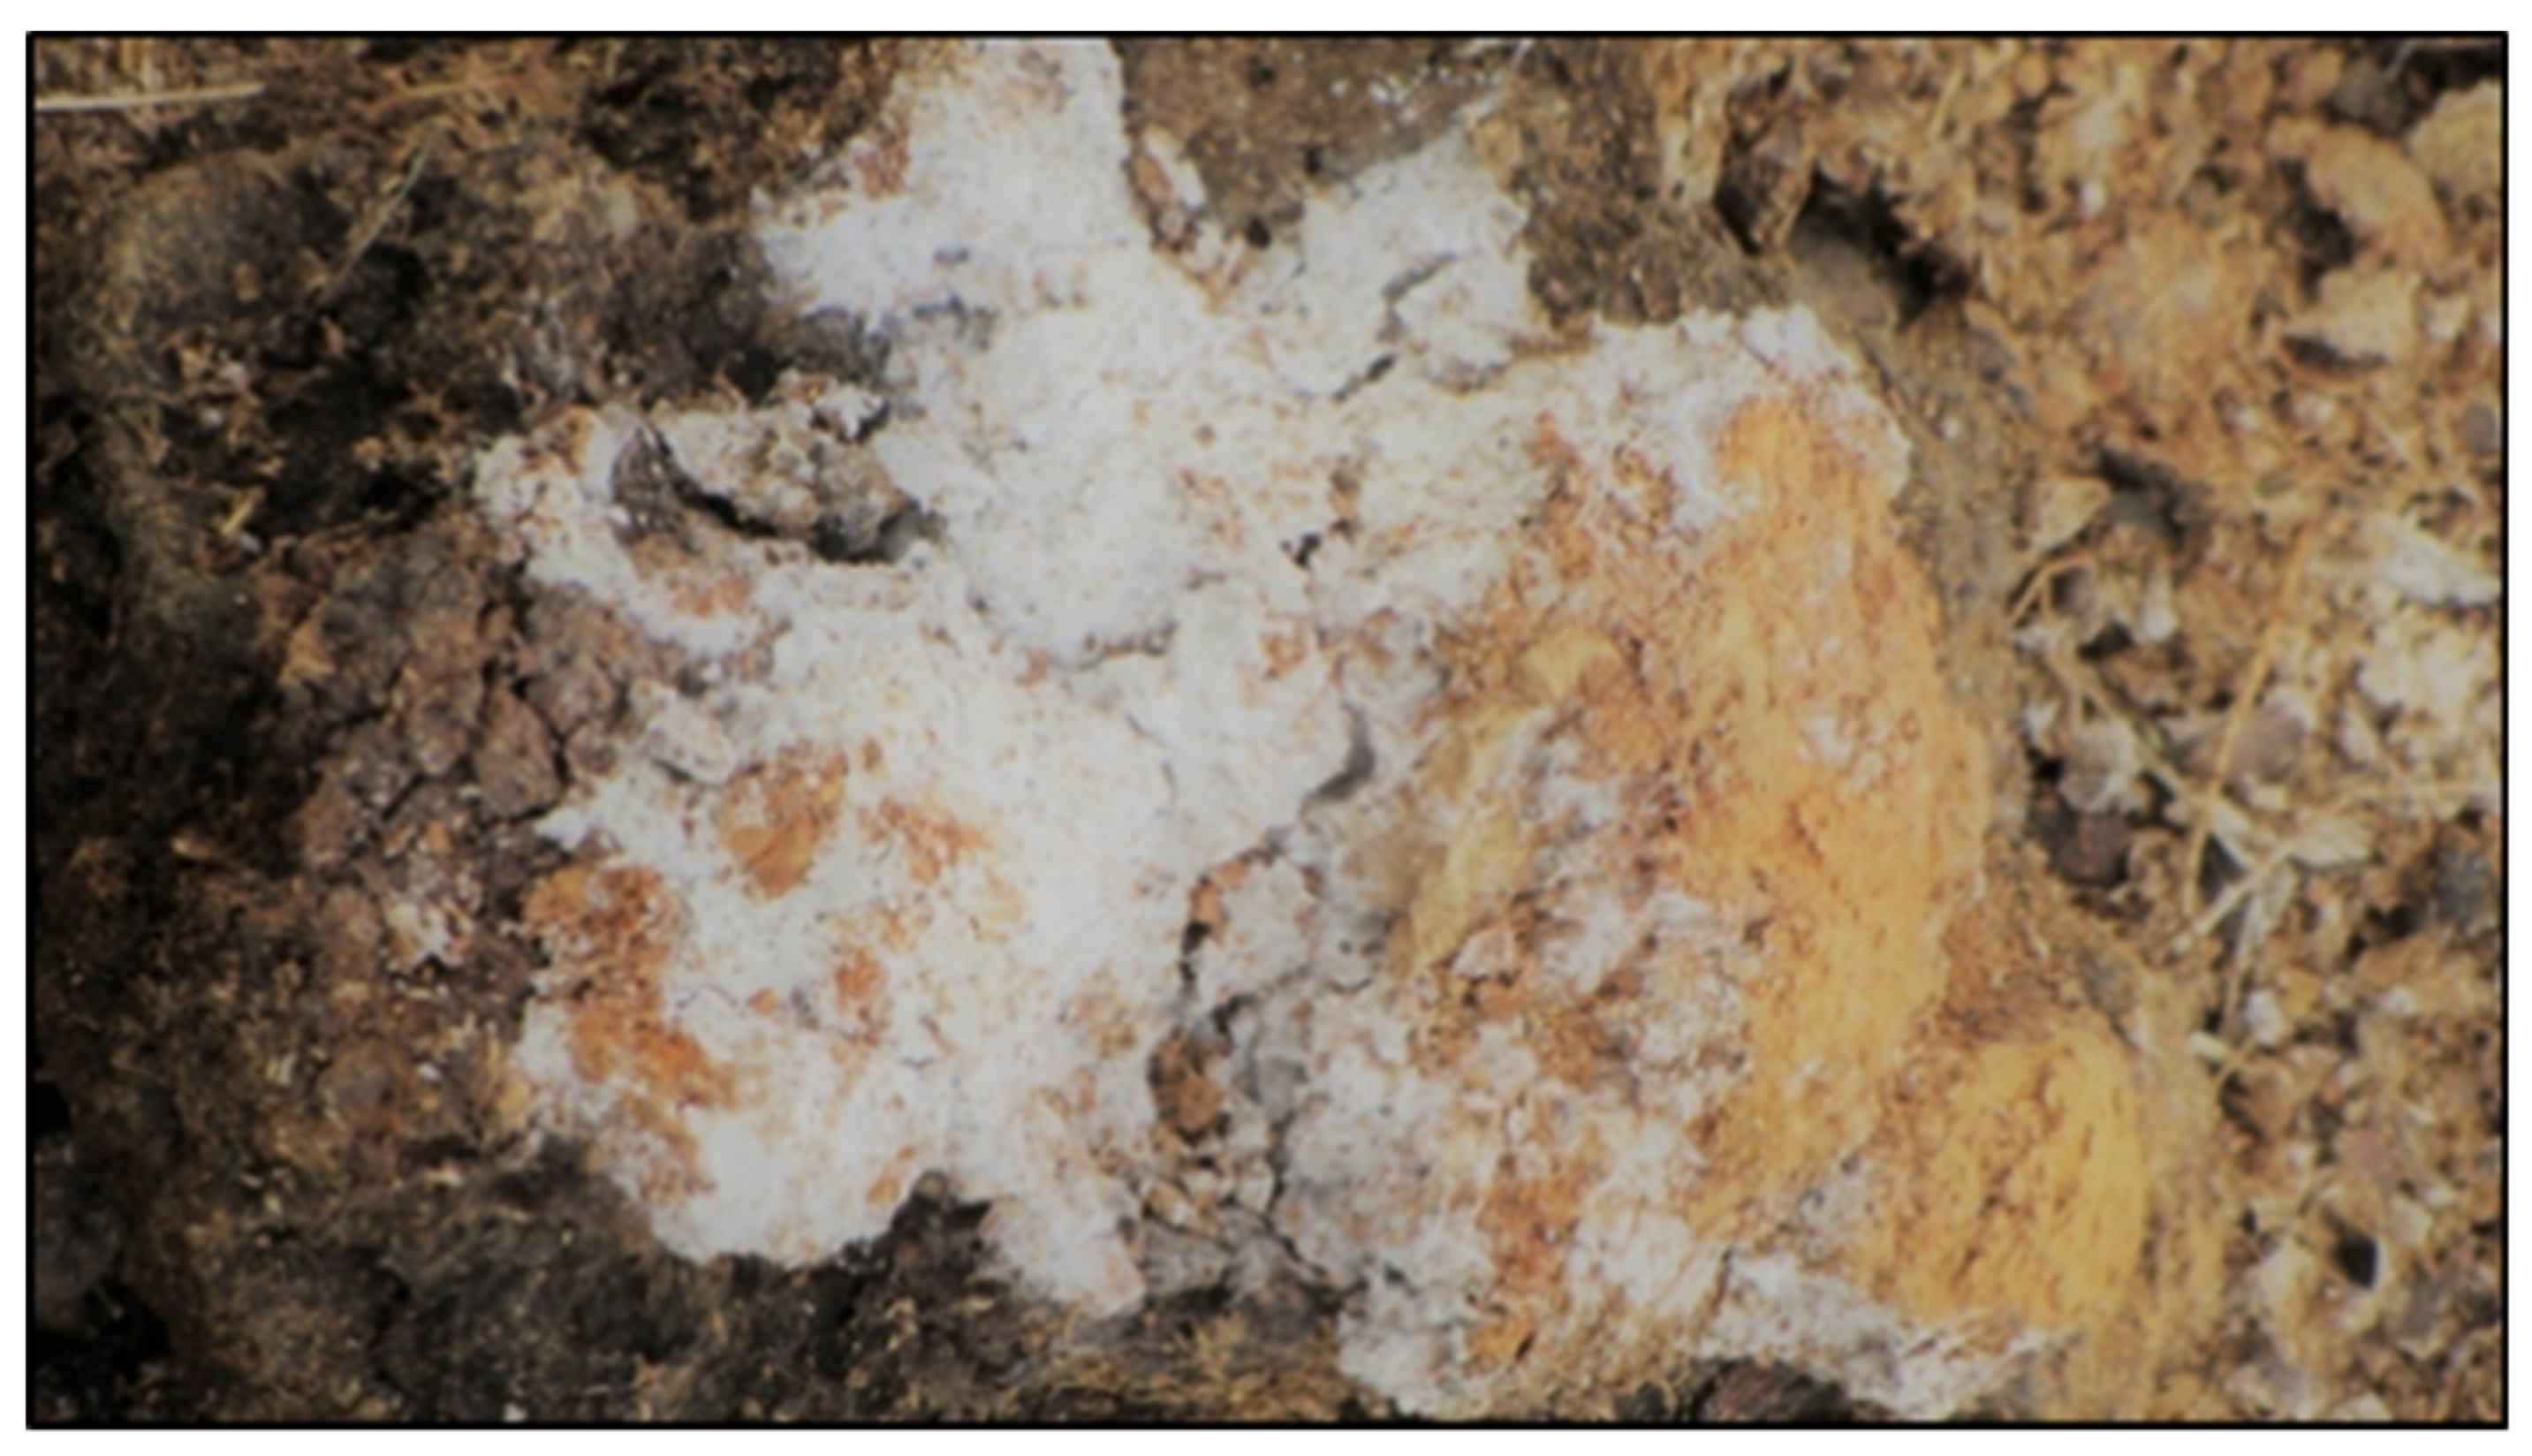
Figure 7.
Comparison between EC values measured in the laboratory; A—in an active and C—abandoned corral at the Plugot forest site by depth (cm); E—in an active and G—abandoned corral at the Beit Nir site by depth (cm). EC measurements obtained with the FDEM; B—in an active and D—abandoned corral at the Plugot forest site; F—in an active and H—abandoned corral at the Beit Nir site. The EC is 62,525 Hz (mS/m) on average the total various frequencies (mean ±SD).

Figure 8.
Orto-photo map and EC measurements by the FDEM showing leakage in abandoned (A, left) and active (B, right) corrals at the Beit Nir site.
Figure 8.
Orto-photo map and EC measurements by the FDEM showing leakage in abandoned (A, left) and active (B, right) corrals at the Beit Nir site.

Table 1.
Basic characteristics of the two research sites. Plugot Forest in the northern Negev and Beit Nir Natural Reserve area in Shefelat Yehuda.
Table 1.
Basic characteristics of the two research sites. Plugot Forest in the northern Negev and Beit Nir Natural Reserve area in Shefelat Yehuda.
| Title | Plugot Site | Beit Nir Site |
|---|---|---|
| Type | planted forest | natural reserve |
| Location | northern Negev, Israel | Shefelat Yehuda, Israel |
| Ltitude/Longitude | 31°37′8.03″ N/34°44′46.77″ E | 31°65′ N/34°88′ E |
| Altitude | 120 m a.s.l. | 285 m a.s.l. |
| Size | 266 ha | 2000 ha |
| Flora | Eucalyptus sargentii | woody shrubs and scattered trees; the dominant perennial species are Pistacia lentiscus, Phillyrea latifolia, Sarcopoterium spinosum, and Eucalyptus camaldulensis |
| Grazing | seasonally by Bedouin herds | cattle herds, with supplements of hay and fallow in the late autumn and early winter |
© 2019 by the authors. Licensee MDPI, Basel, Switzerland. This article is an open access article distributed under the terms and conditions of the Creative Commons Attribution (CC BY) license (http://creativecommons.org/licenses/by/4.0/).
Share and Cite
MDPI and ACS Style
Goldshleger, N.; Shamir, O.; Basson, U.; Zaady, E. Frequency Domain Electromagnetic Method (FDEM) as a Tool to Study Contamination at the Sub-Soil Layer. Geosciences 2019, 9, 382. https://doi.org/10.3390/geosciences9090382
AMA Style
Goldshleger N, Shamir O, Basson U, Zaady E. Frequency Domain Electromagnetic Method (FDEM) as a Tool to Study Contamination at the Sub-Soil Layer. Geosciences. 2019; 9(9):382. https://doi.org/10.3390/geosciences9090382
Chicago/Turabian StyleGoldshleger, Naftaly, Omer Shamir, Uri Basson, and Eli Zaady. 2019. "Frequency Domain Electromagnetic Method (FDEM) as a Tool to Study Contamination at the Sub-Soil Layer" Geosciences 9, no. 9: 382. https://doi.org/10.3390/geosciences9090382
Note that from the first issue of 2016, this journal uses article numbers instead of page numbers. See further details here.