Dependence Models of Borehole Expansion on Explosive Charge in Spherical Cavity Blasting


Abstract
:1. Introduction
- Presenting a new method for determining the value of spherical cavity blasting performance indicators;
- Determining the mathematical model that best describes the dependence of blasting results on the amount of explosive charge.
2. Previous Research
3. Recent Research
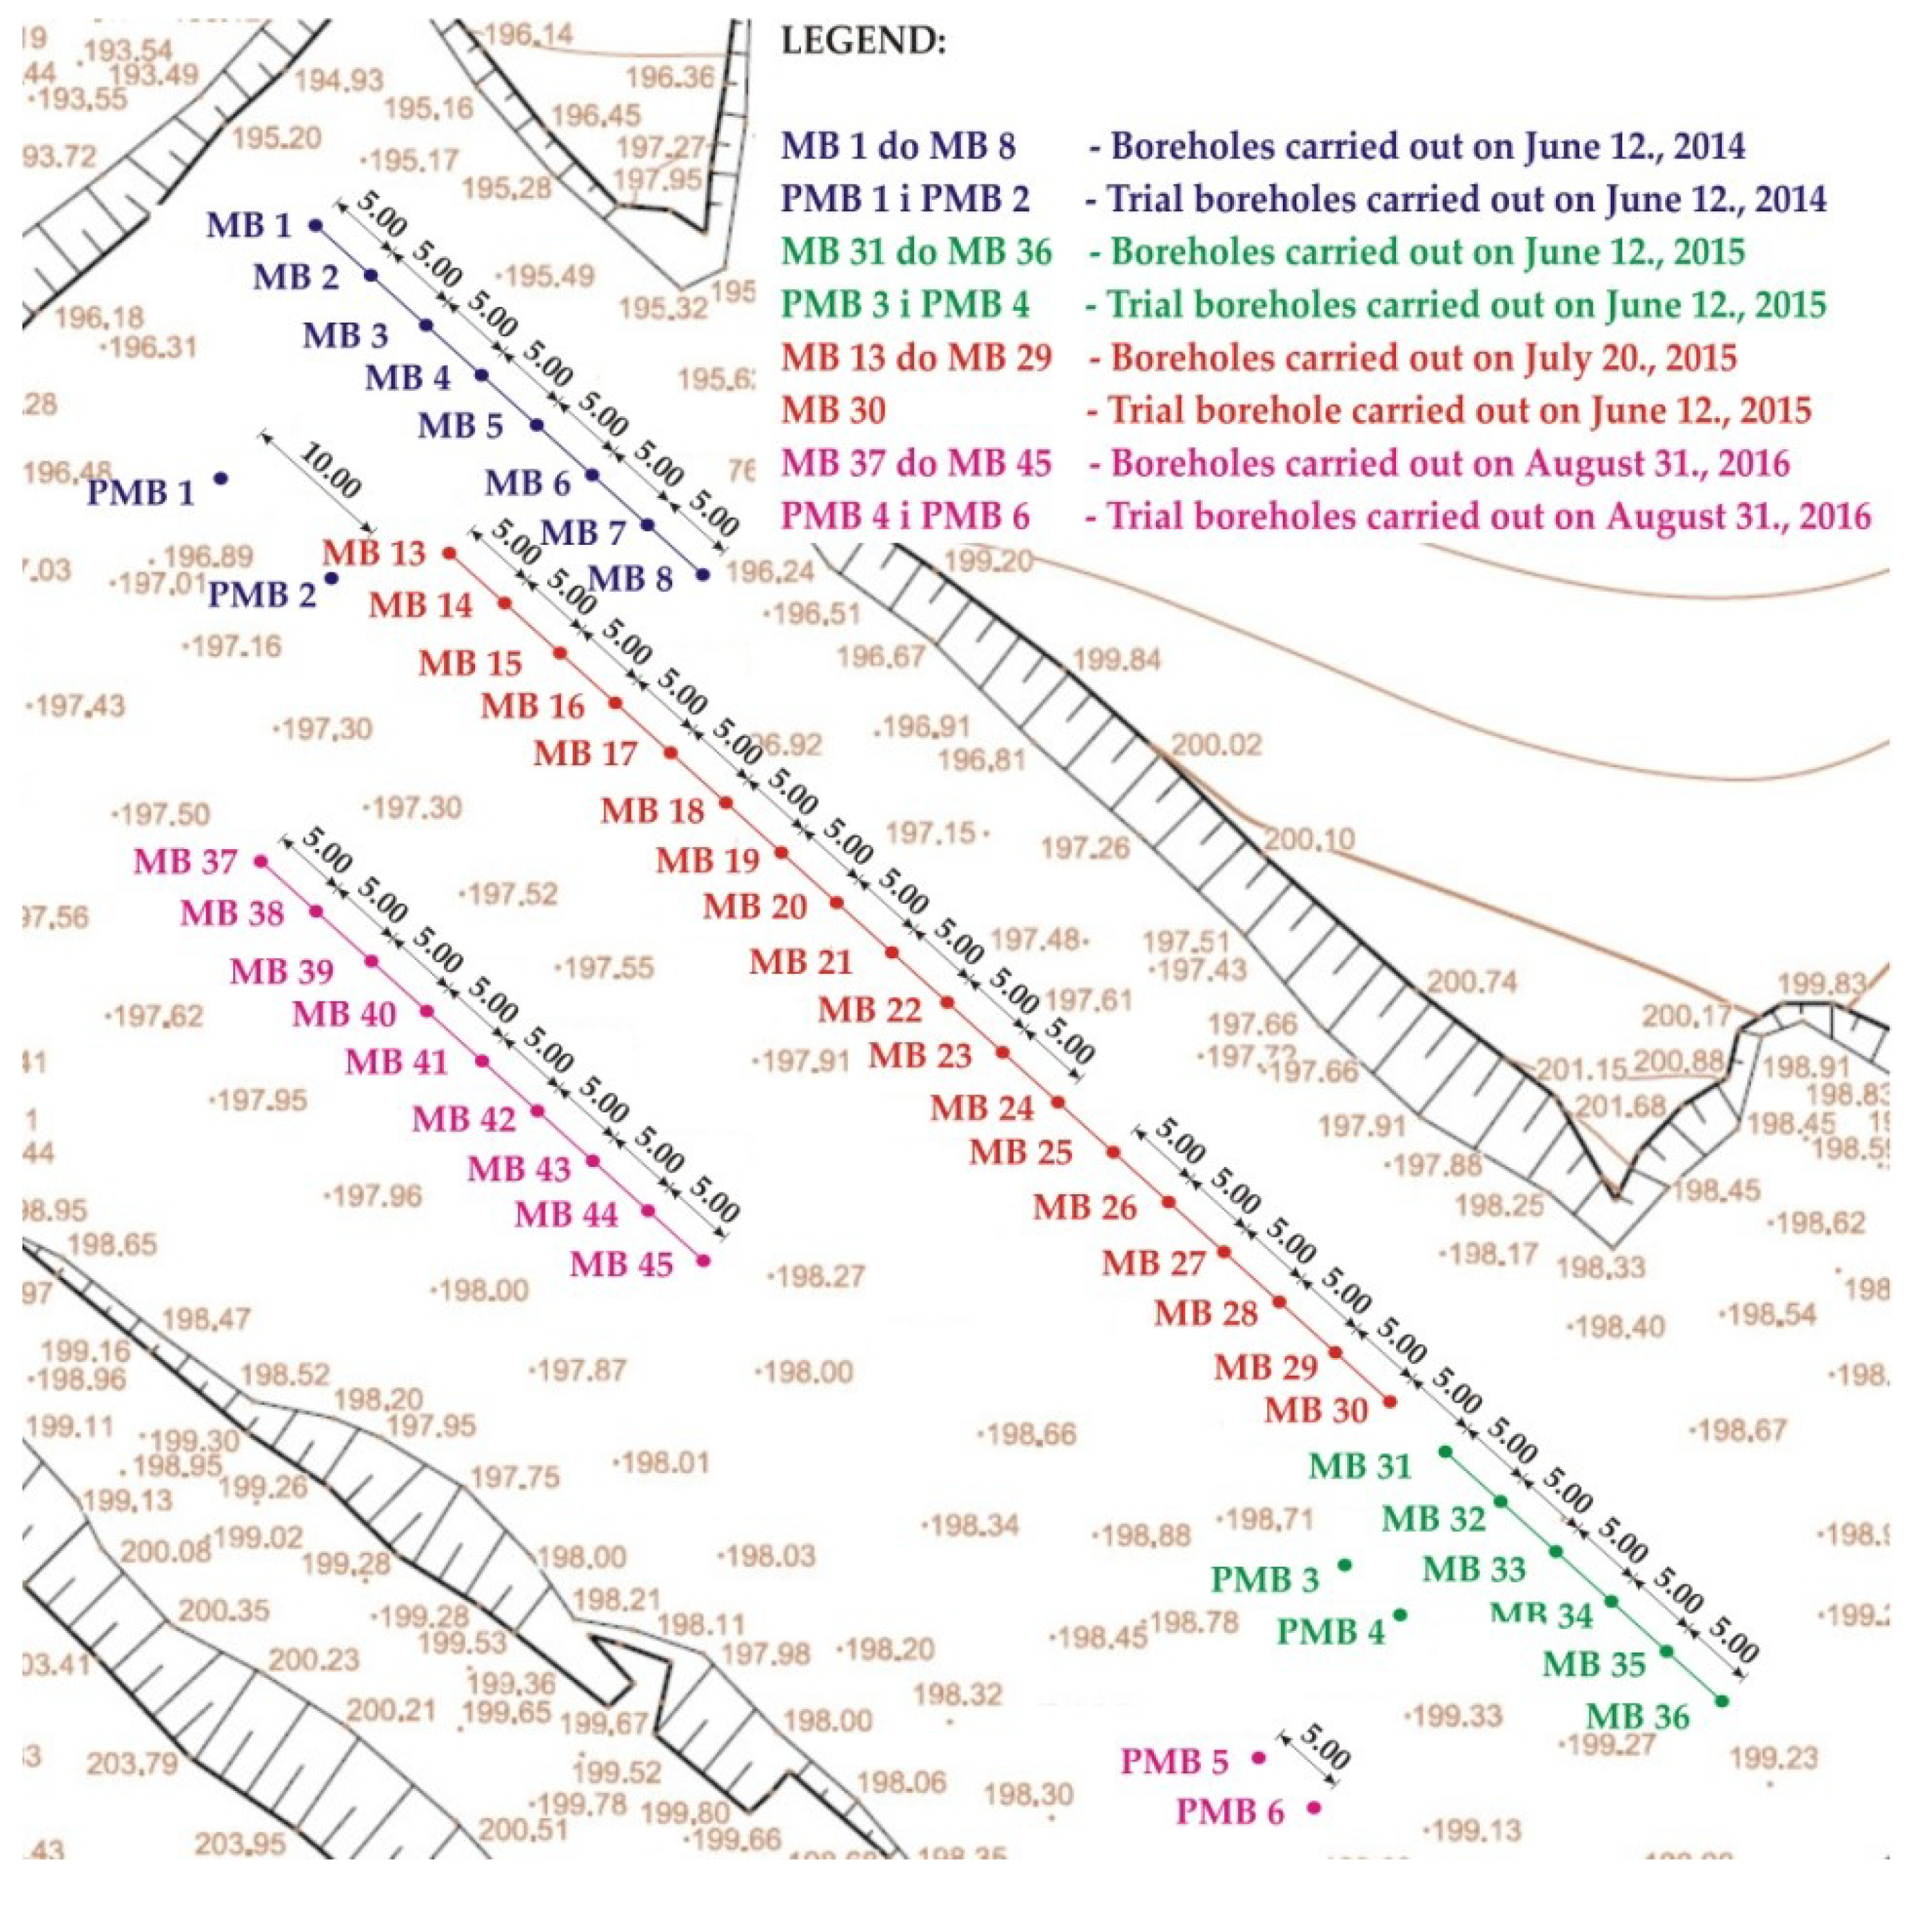
- Locating blasting areas and positioning of the future boreholes
- -
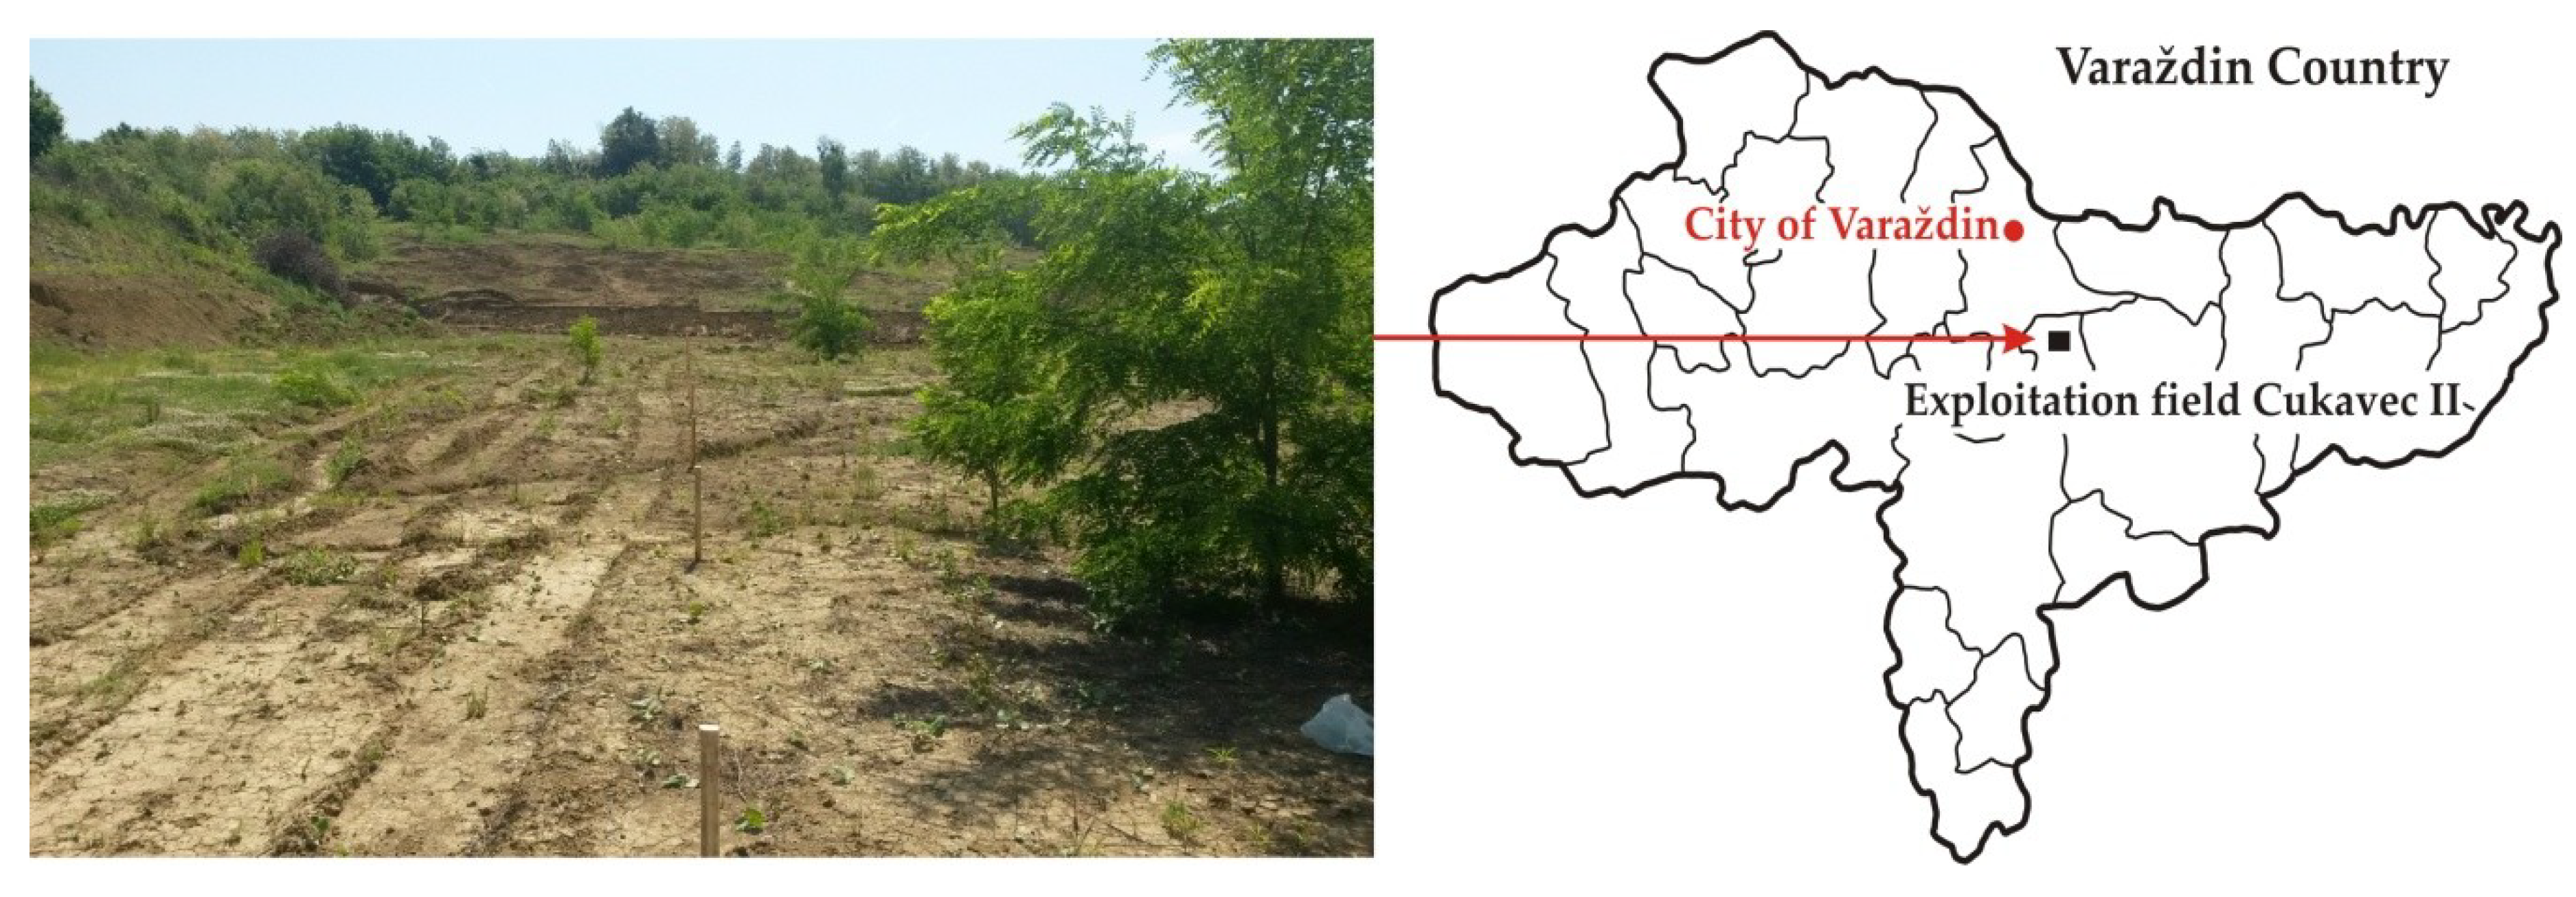
- In order to determine the borehole position coordinates and height, is the determination of the geodetic profile (Figure 6), was performed with the RTK GNSS method, using online transformation parameters via CROPOS (CROatianPOsitioning System).
- Geotechnical field investigations
- -
- For the assessment of the dynamic properties of the soil at the profile depth before and after the blasting, the MASW (multi-channel analysis of surface waves) method for multichannel analysis of surface waves, have been used for measurement of velocity of the shear waves Vs [20,21]. The aim of the geophysical research was to determine the data on the general and mechanical properties of the soil natural layers by depth, and to determine the changes of the soil dynamic properties caused by the activation of explosive charges of different type and masses;
- -
- Exploratory drilling of boreholes was carried out with the aim of obtaining disturbed and undisturbed samples of clay, which were taken from characteristic boreholes at certain depth, and sent to geotechnical laboratory for further testing;
- -
- Geomechanical laboratory tests of disturbed and undisturbed samples of the subject clay have been performed in an accredited laboratory of the Faculty of Geotehnical Engineering according to the international standard HRN EN ISO / IEC 17025: 2007. For the purposes of research, the clay moisture is determined, with its undrained shear strength before and after blasting.
- Test blasting and determination of the effective range of masses of two different types of explosives
- -
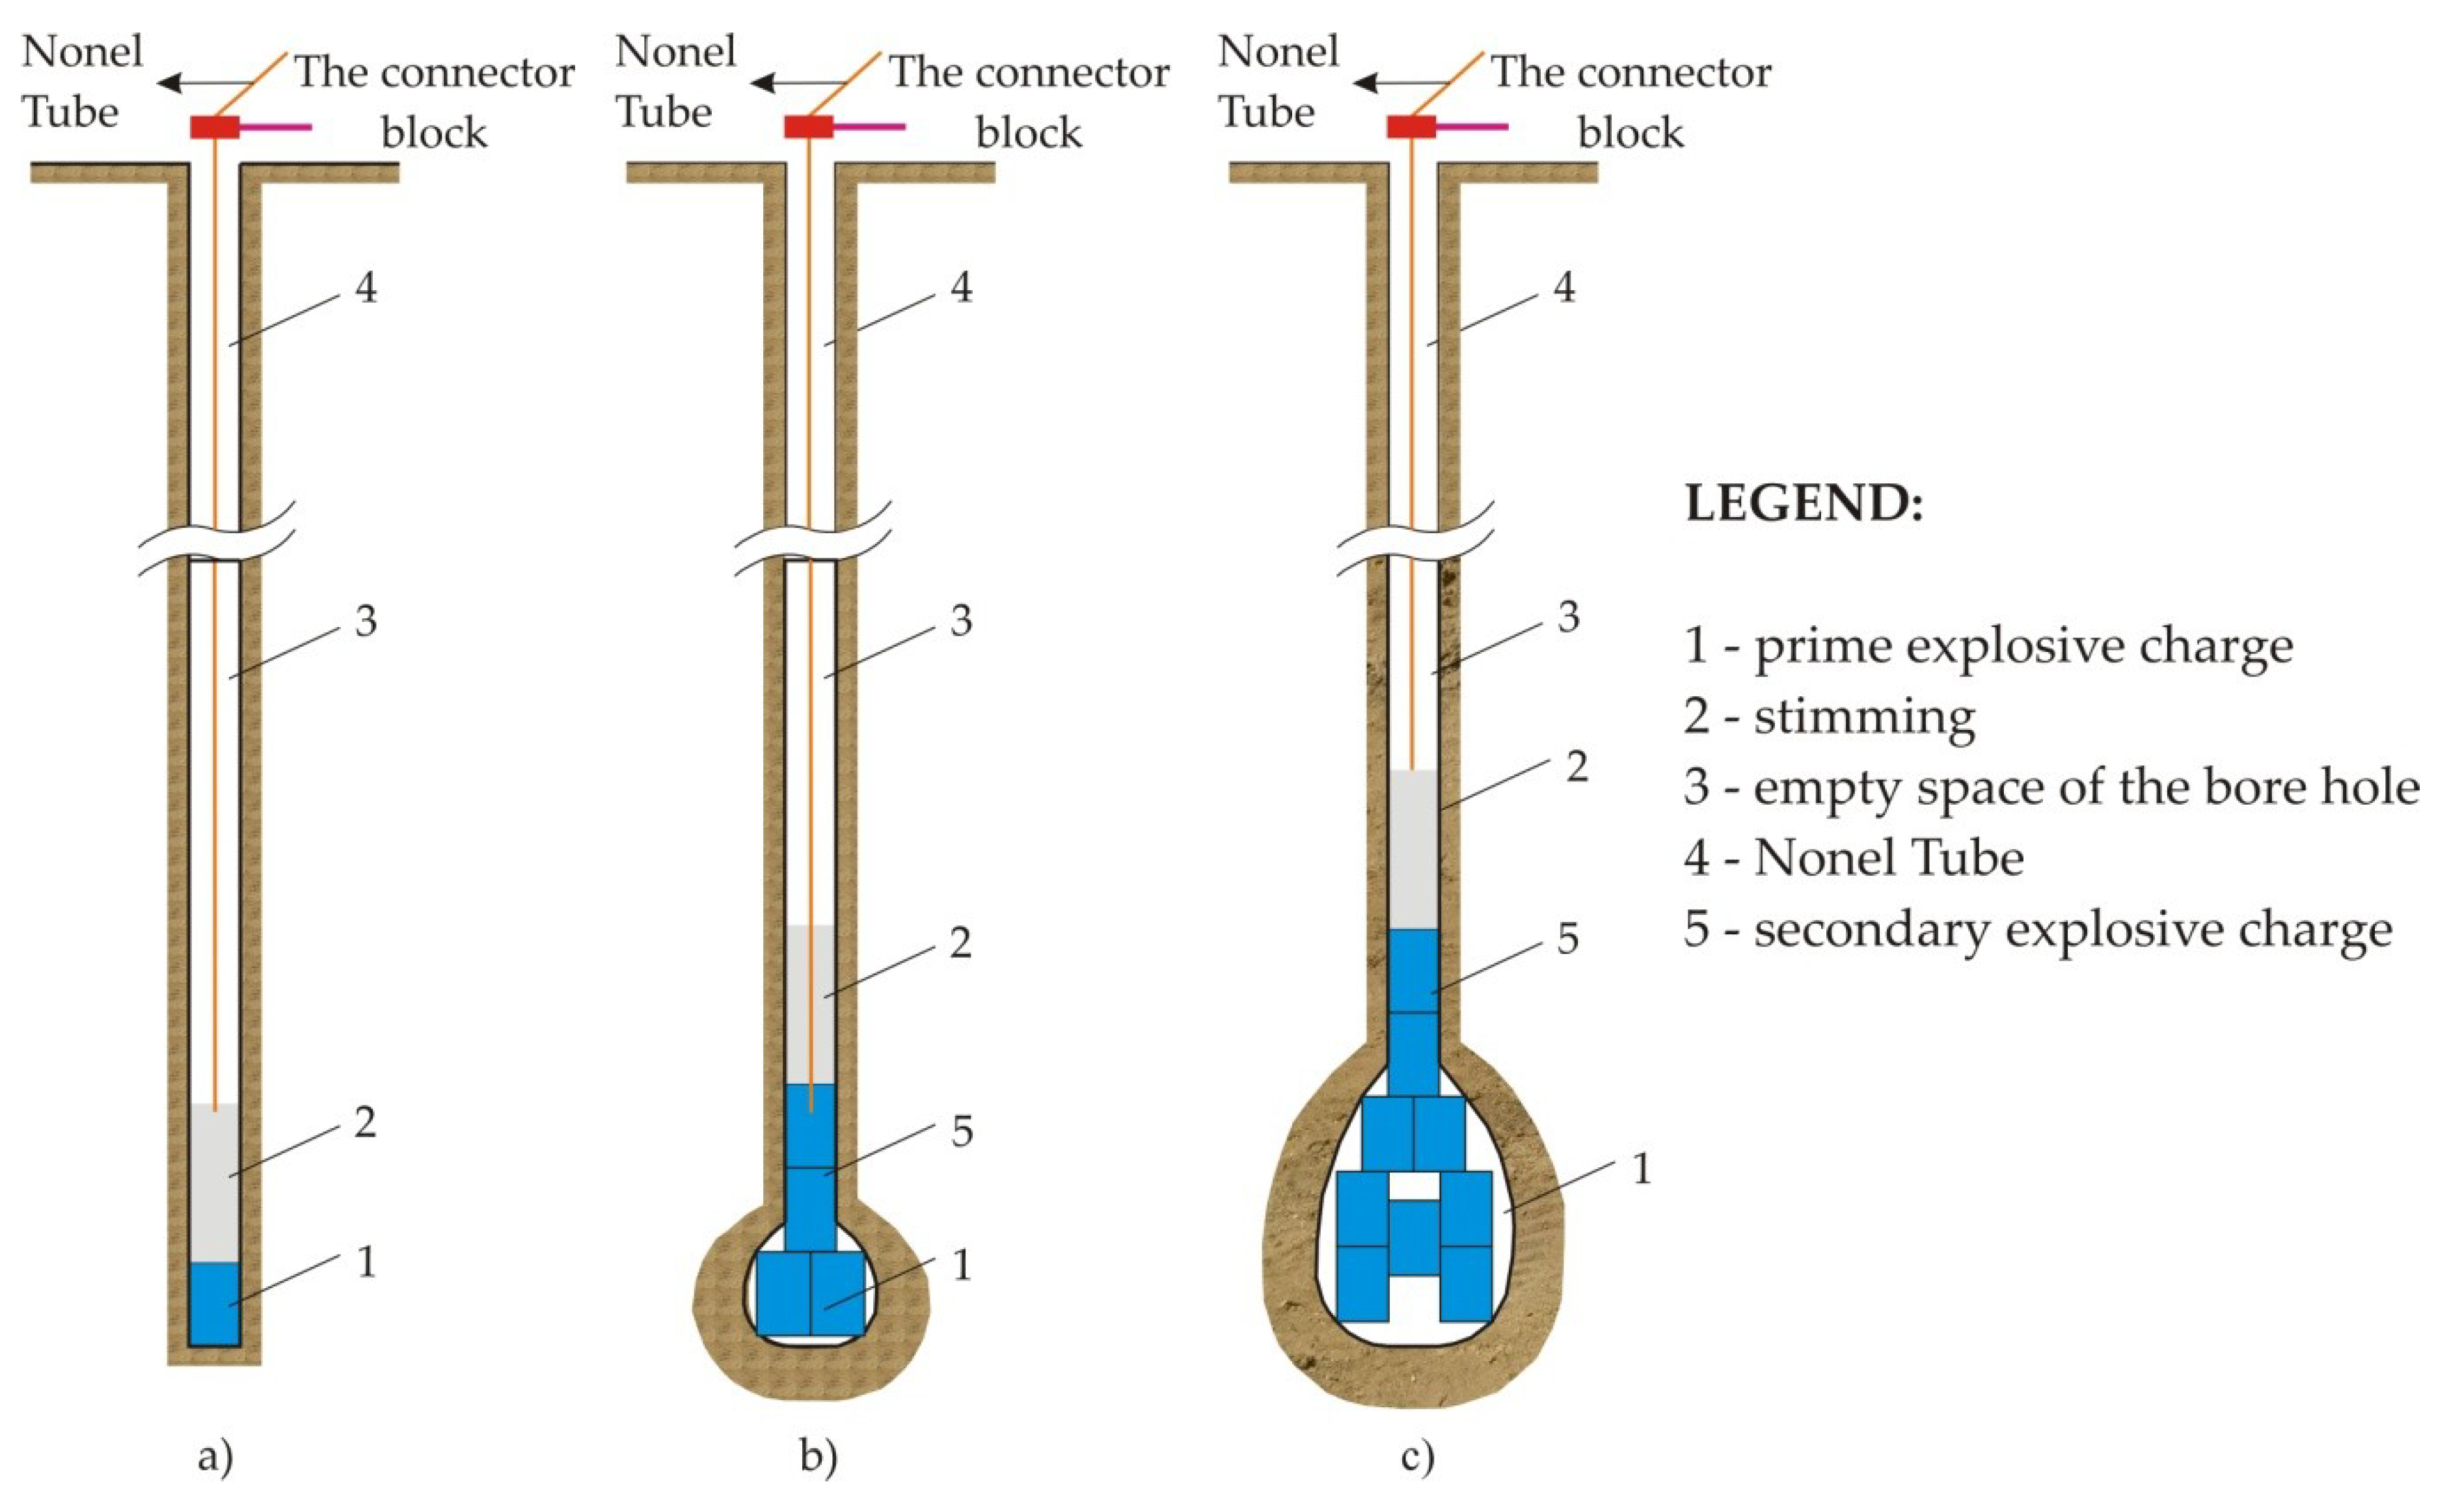
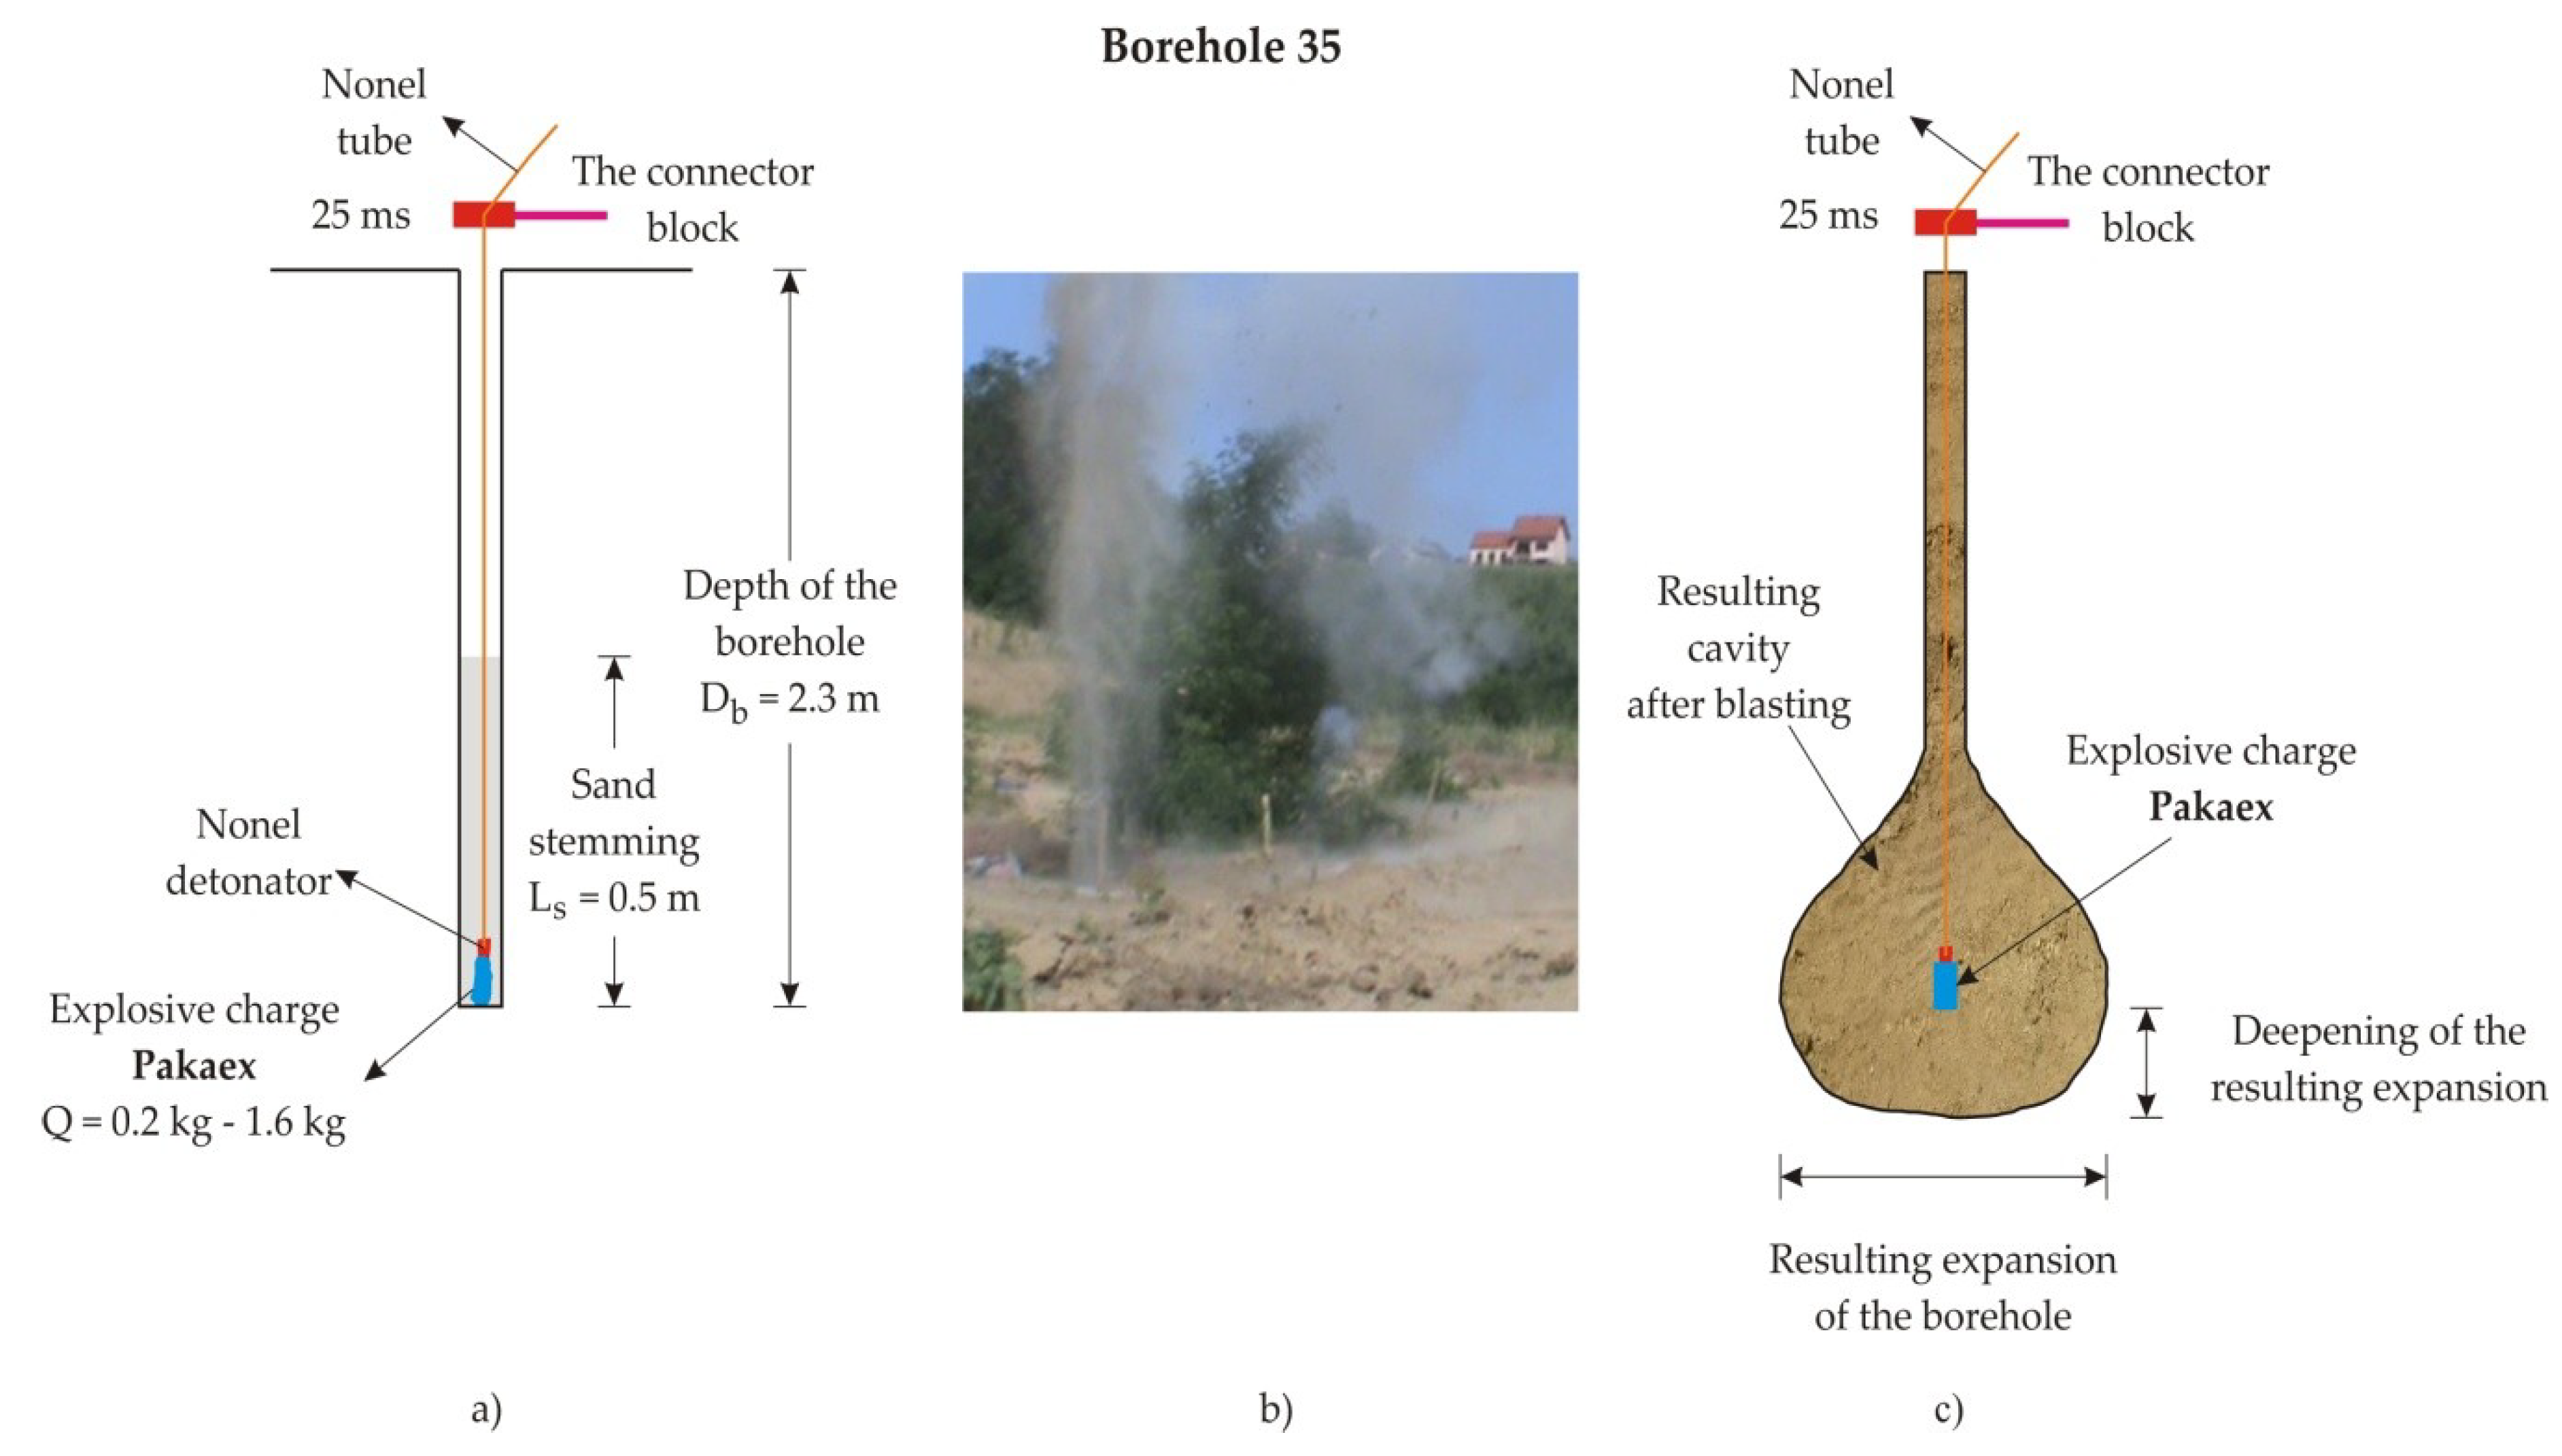
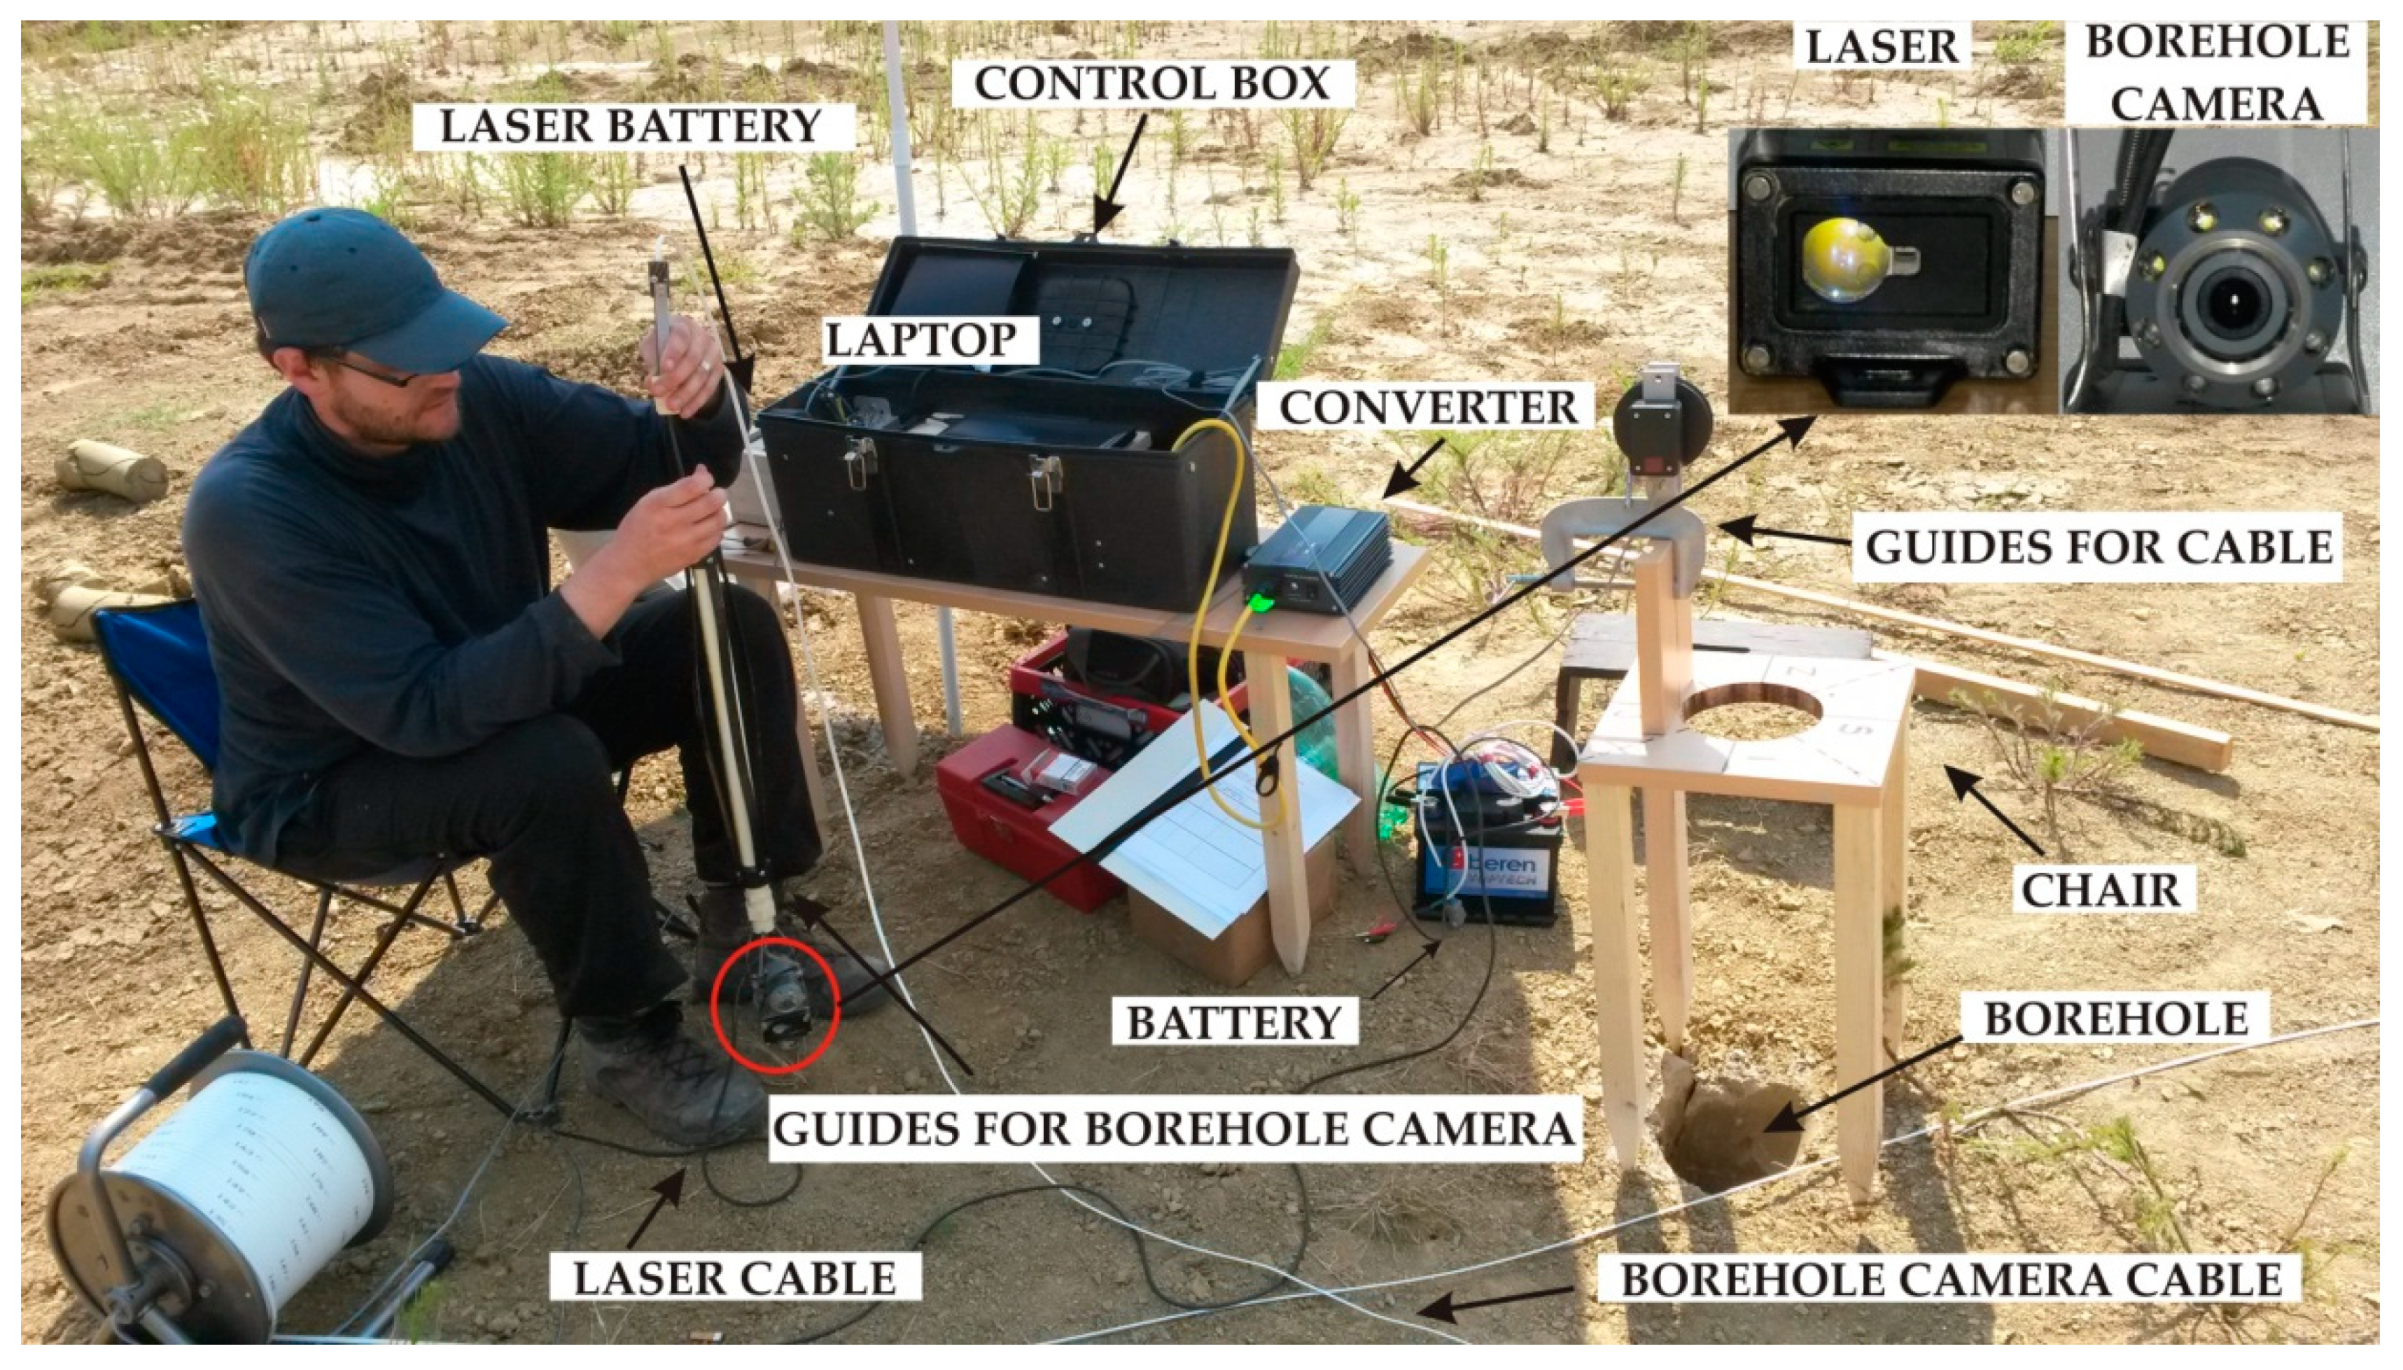
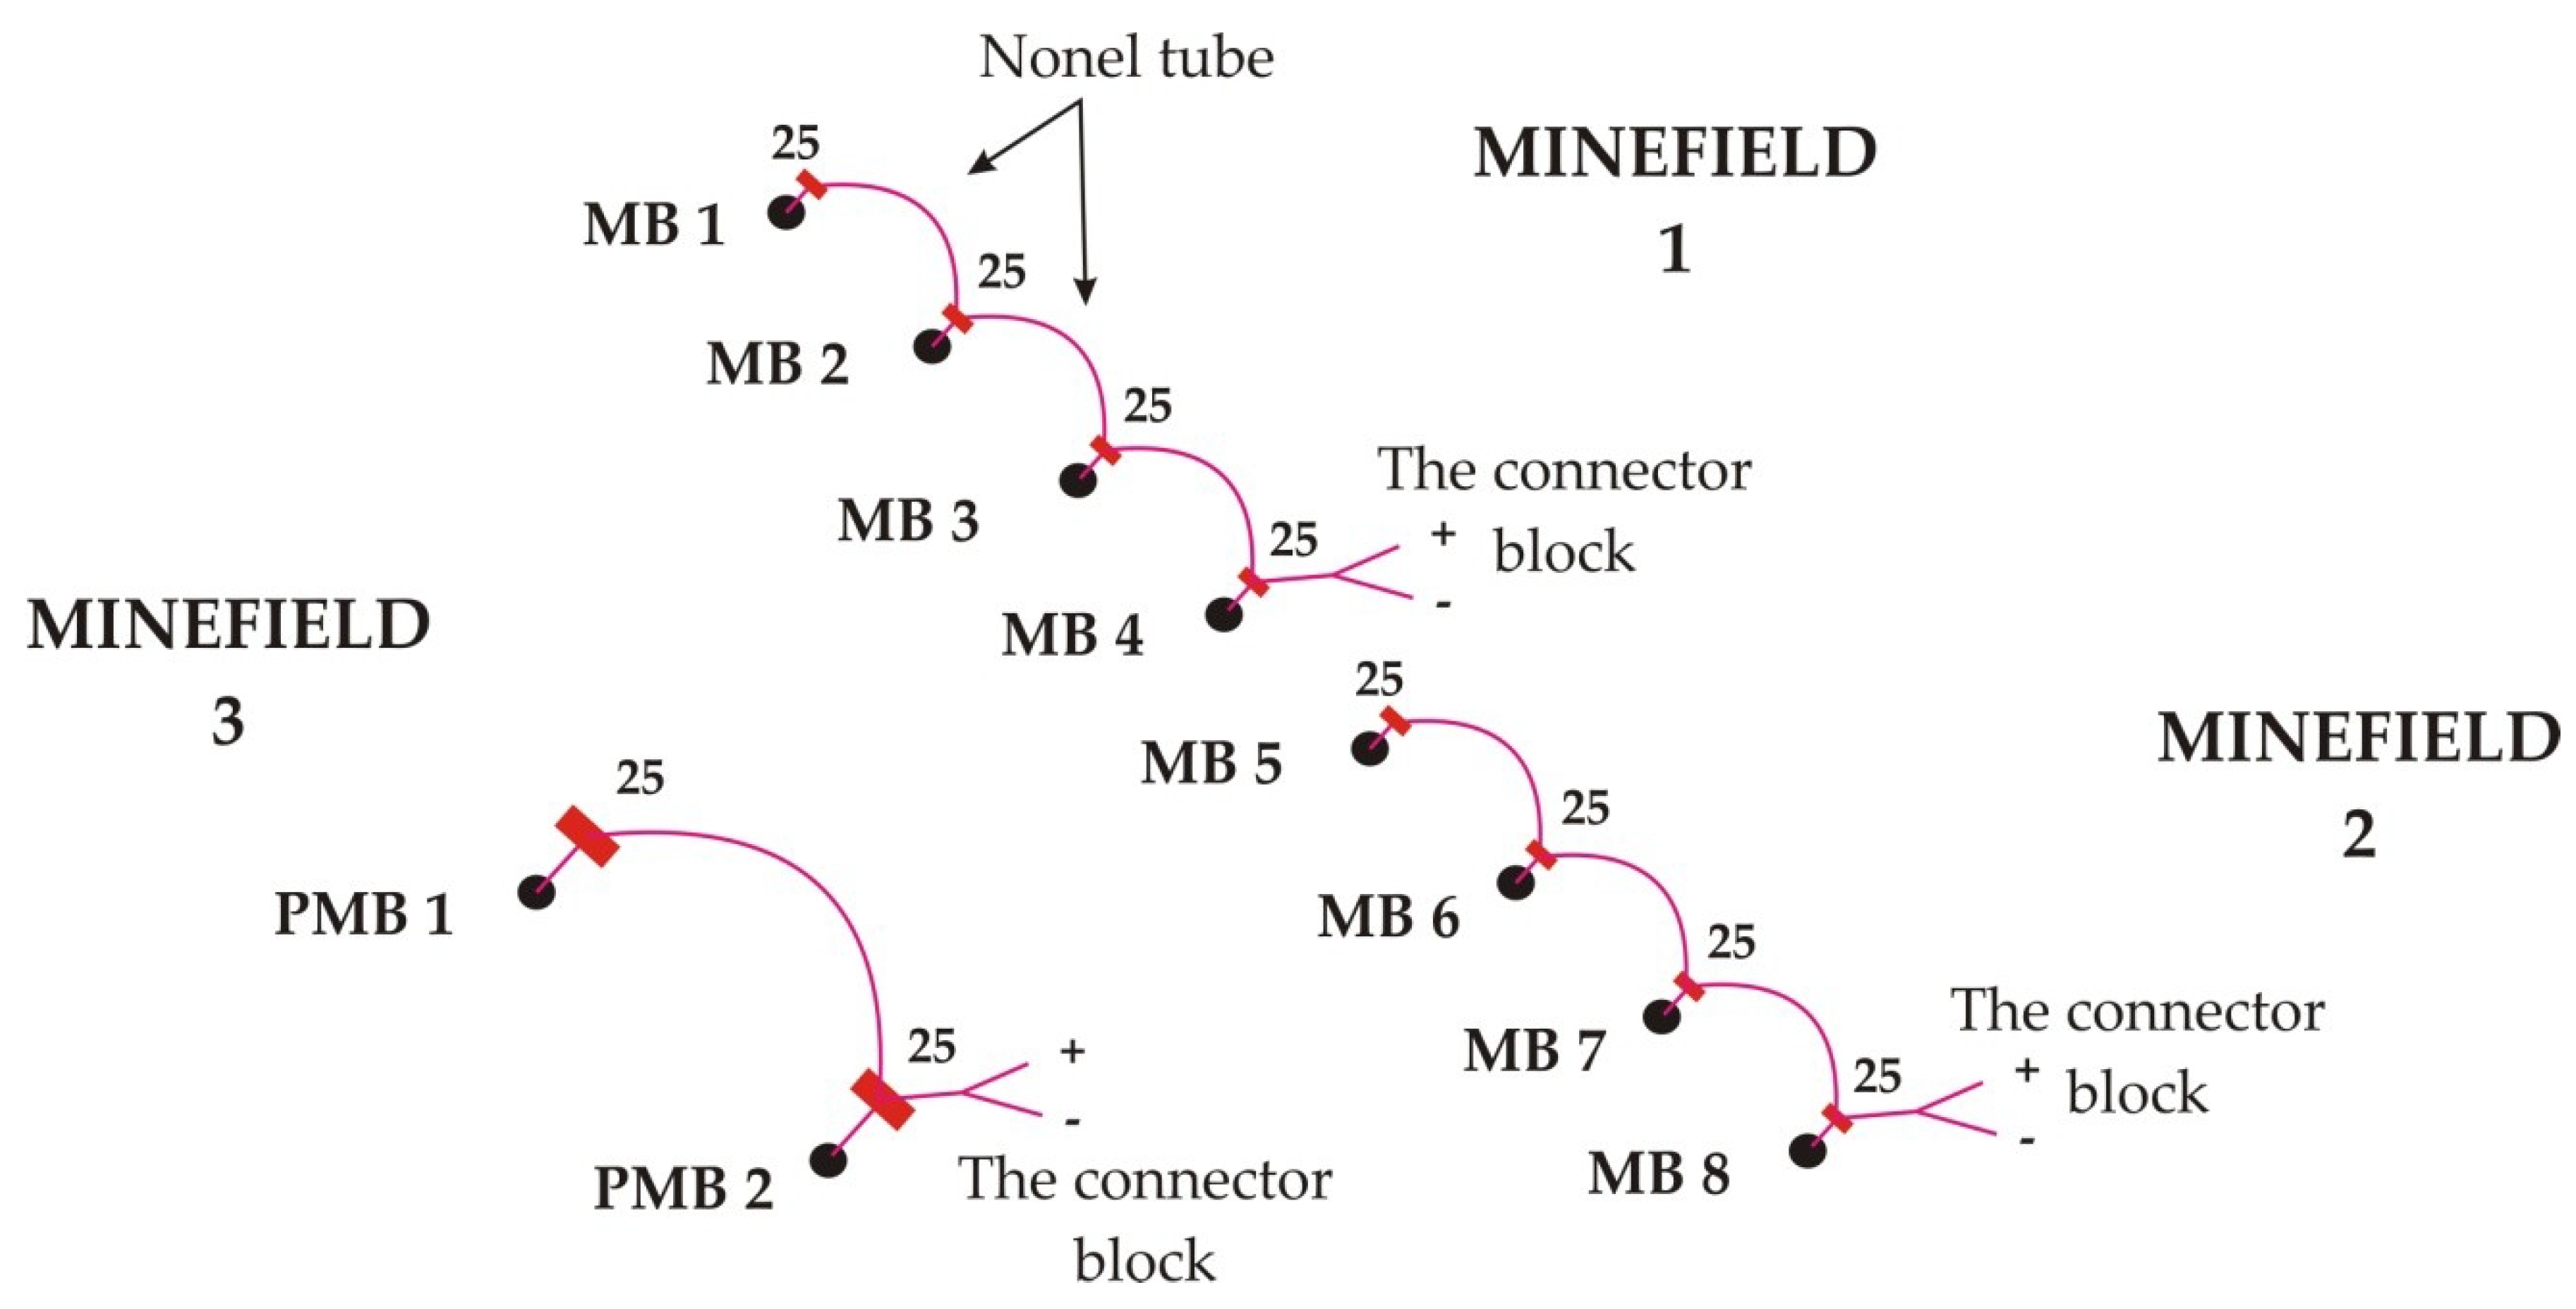
- It was found that the spherical expansion for the predetermined borehole diameter of 131 mm and the depth from 2.00 to 3.00 m, is possible with the explosive type Permonex V19 and Pakaex, ranging from 0.2 to 1.6 kg. Declared velocity of detonation for Permonex V19 explosive is 4500 m/s, while for the Pakaex explosive is 2950 m/s. The explosive charge activation was performed by the NONEL system started with the instantaneous electric detonators (IED) (Figure 7). During the test blasts, the stem was 0.3 m and 0.5 m, depending on the quantity of explosive in the borehole, not to allow its ejection from it, which would result in partial detonation energy loss. The stone material gradation 0/4 mm was used for stemming. Figure 8a shows the borehole construction. The moment of explosive charge activation of the Permonex V19 is shown in Figure 8b, and the schematic representation of the resulting spherical expansion is shown in Figure 8c [14].
- Determination of spherical expansion after explosive charge activation
- -
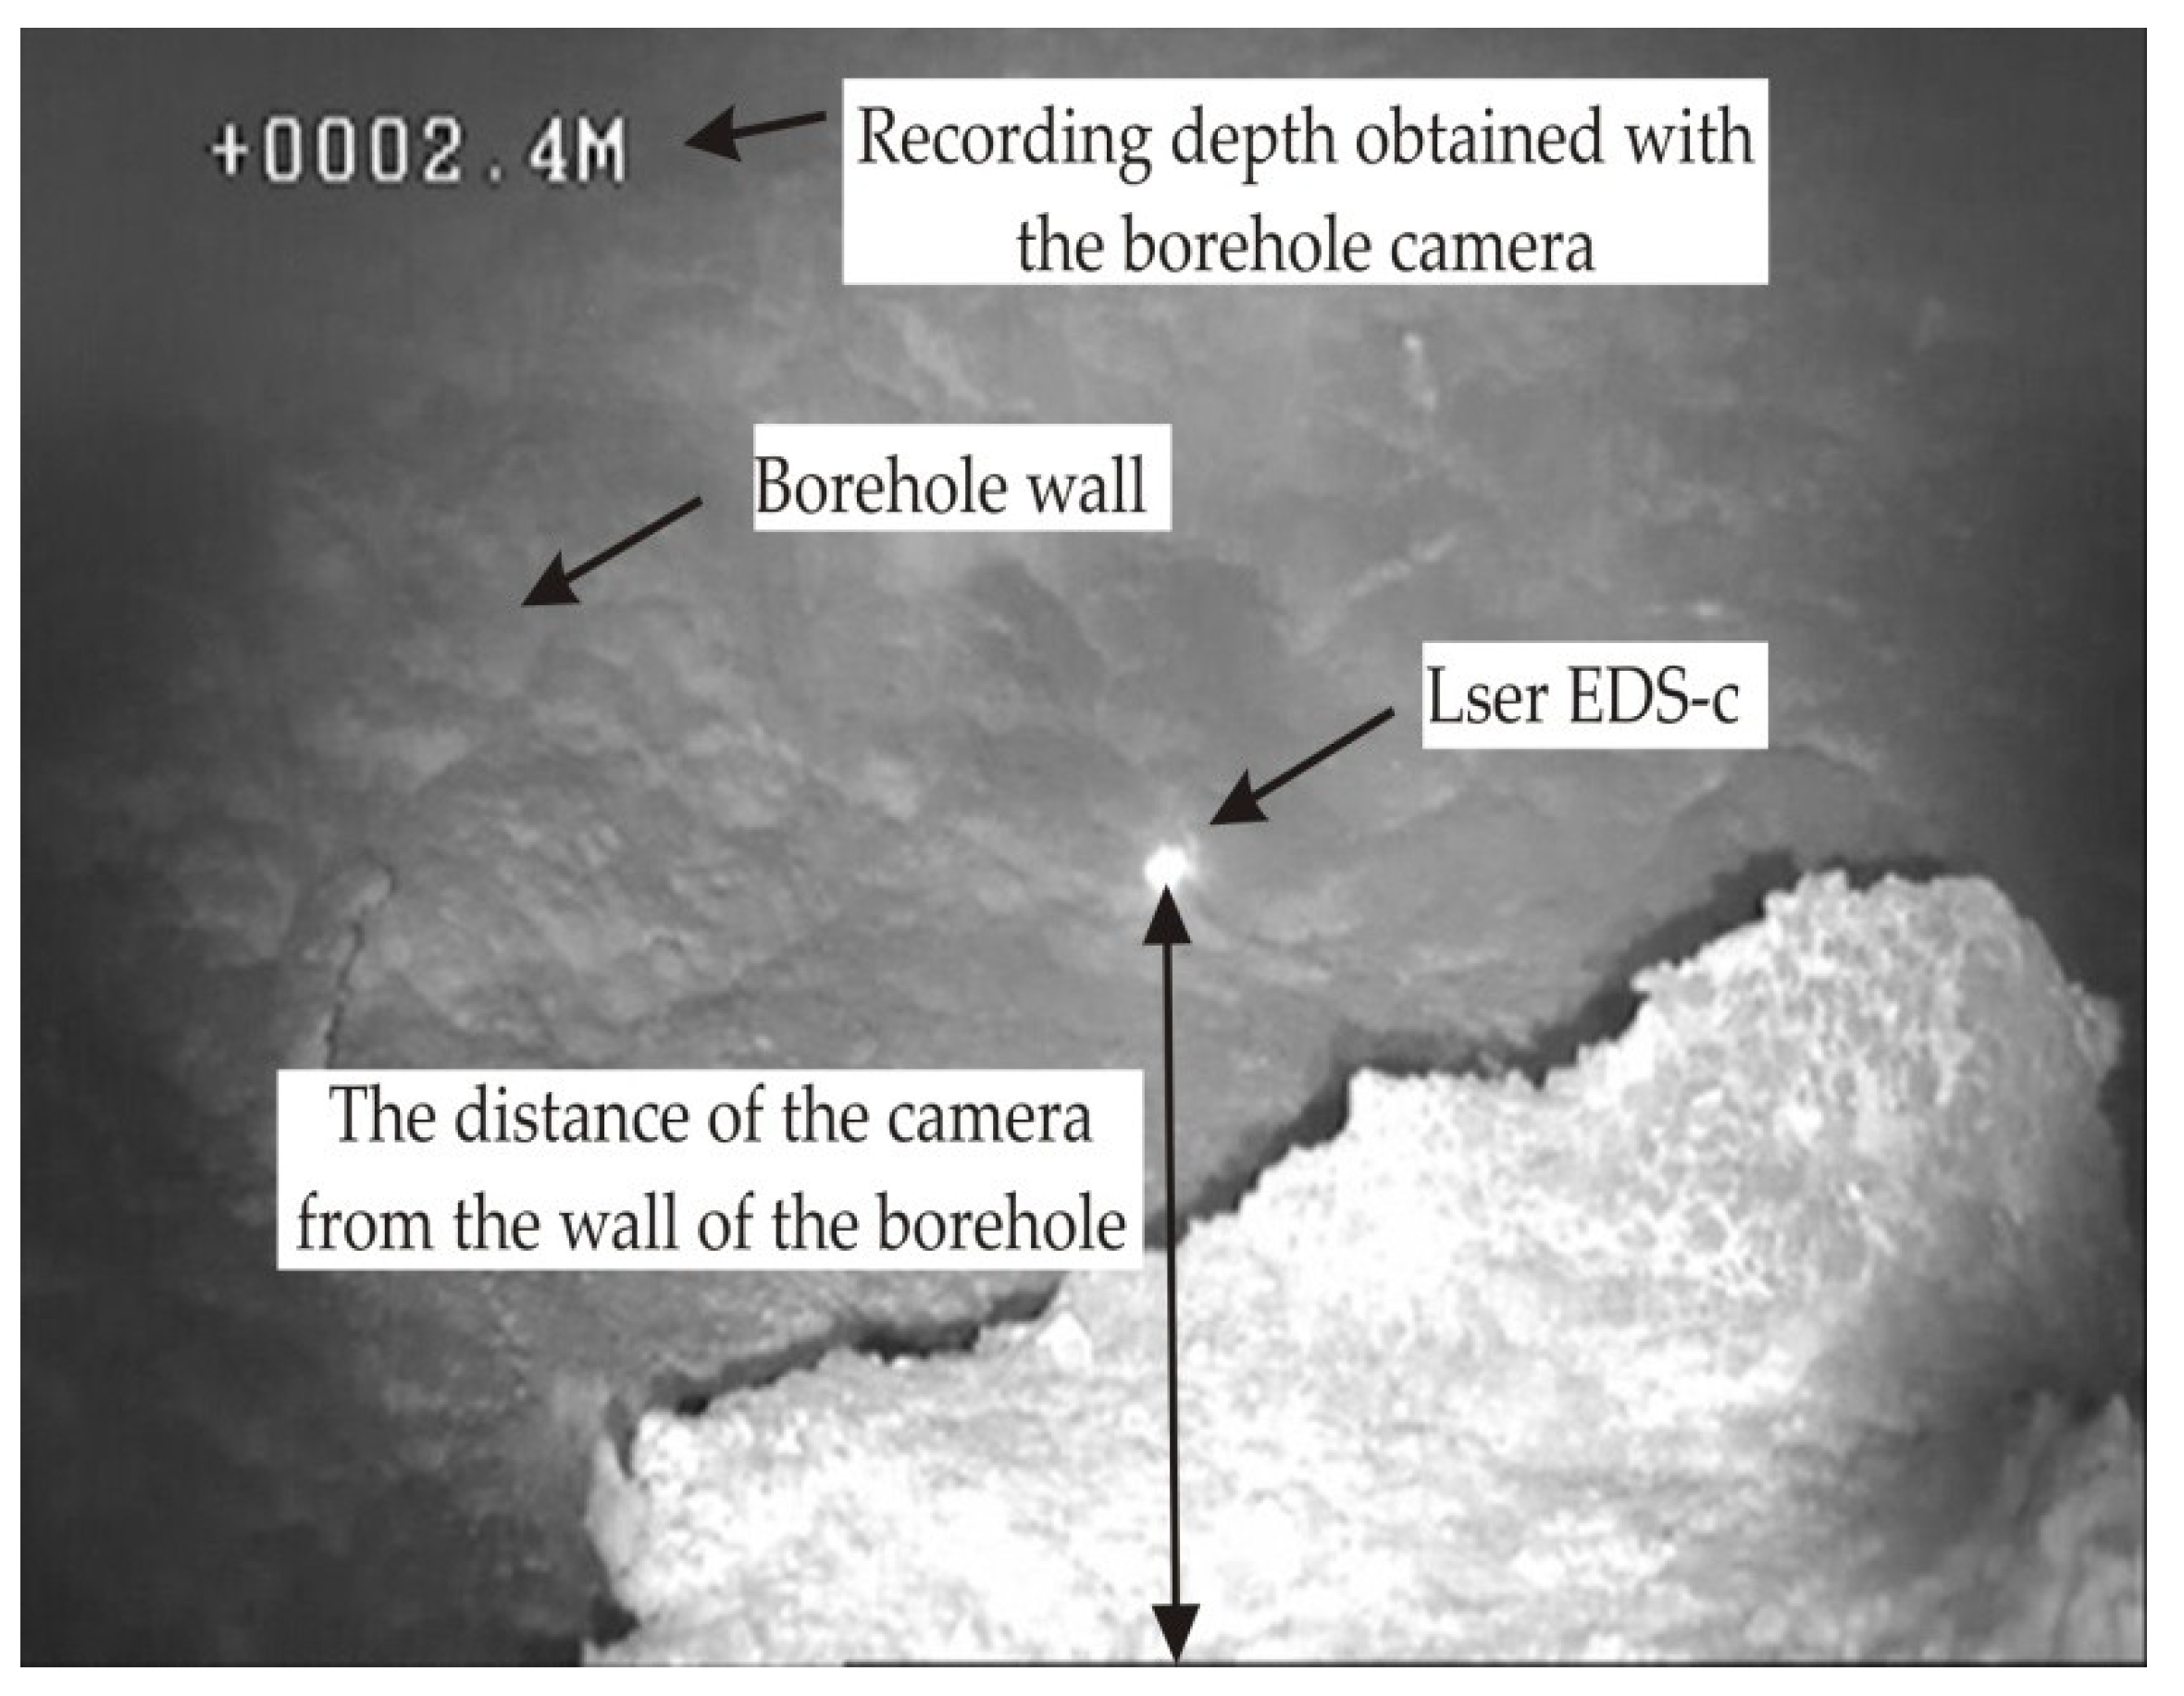
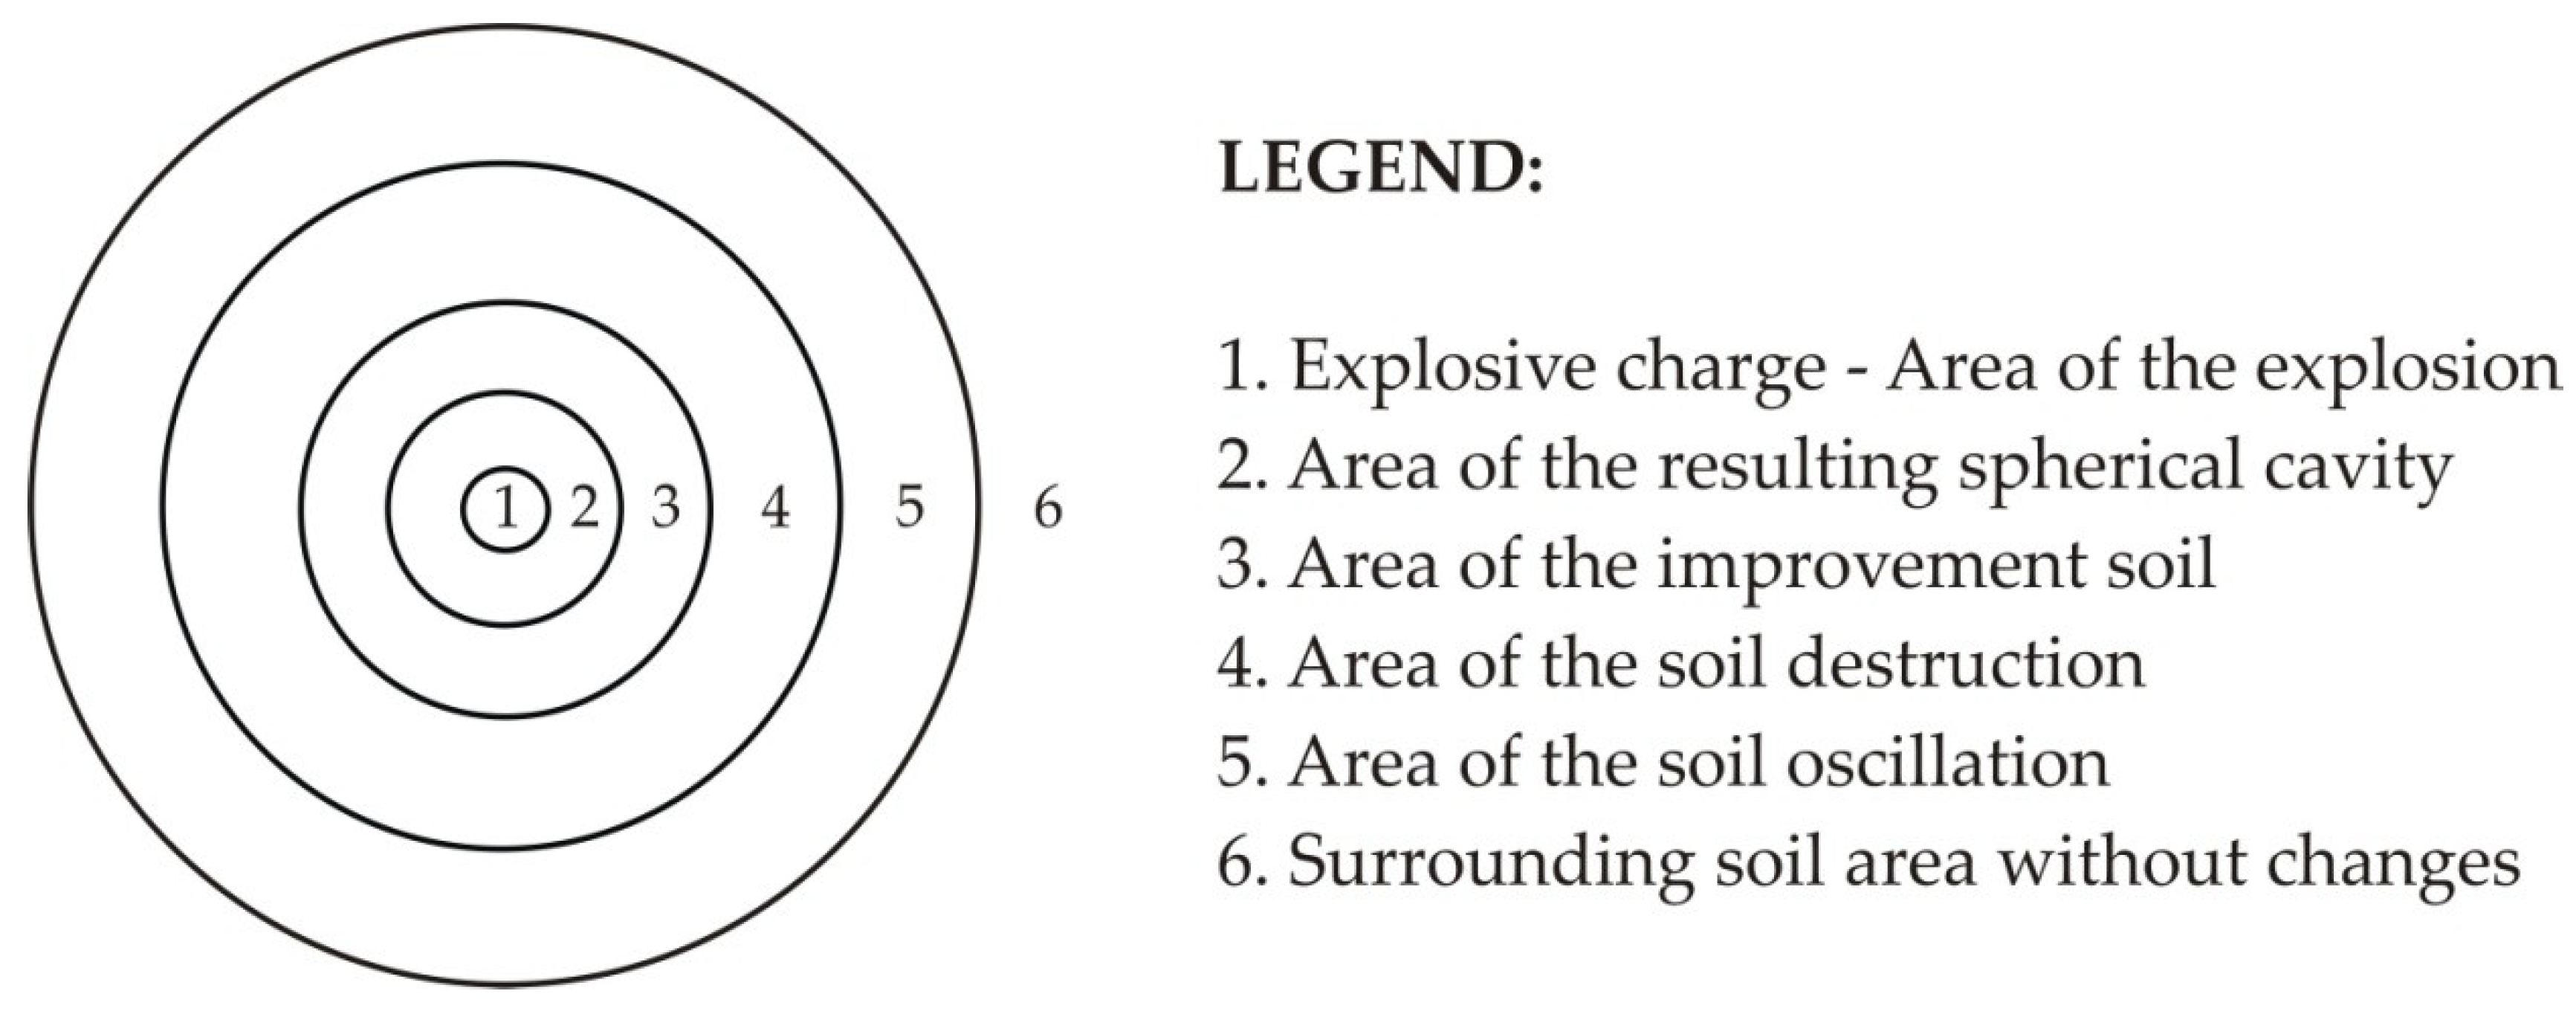
- The most important was the determination of the shape and volume of the spherical expansions formed after the explosive charge detonation in a 131 mm in diameter cylindrical borehole.
4. Spherical Expansion Volume Measuring Method
5. Models
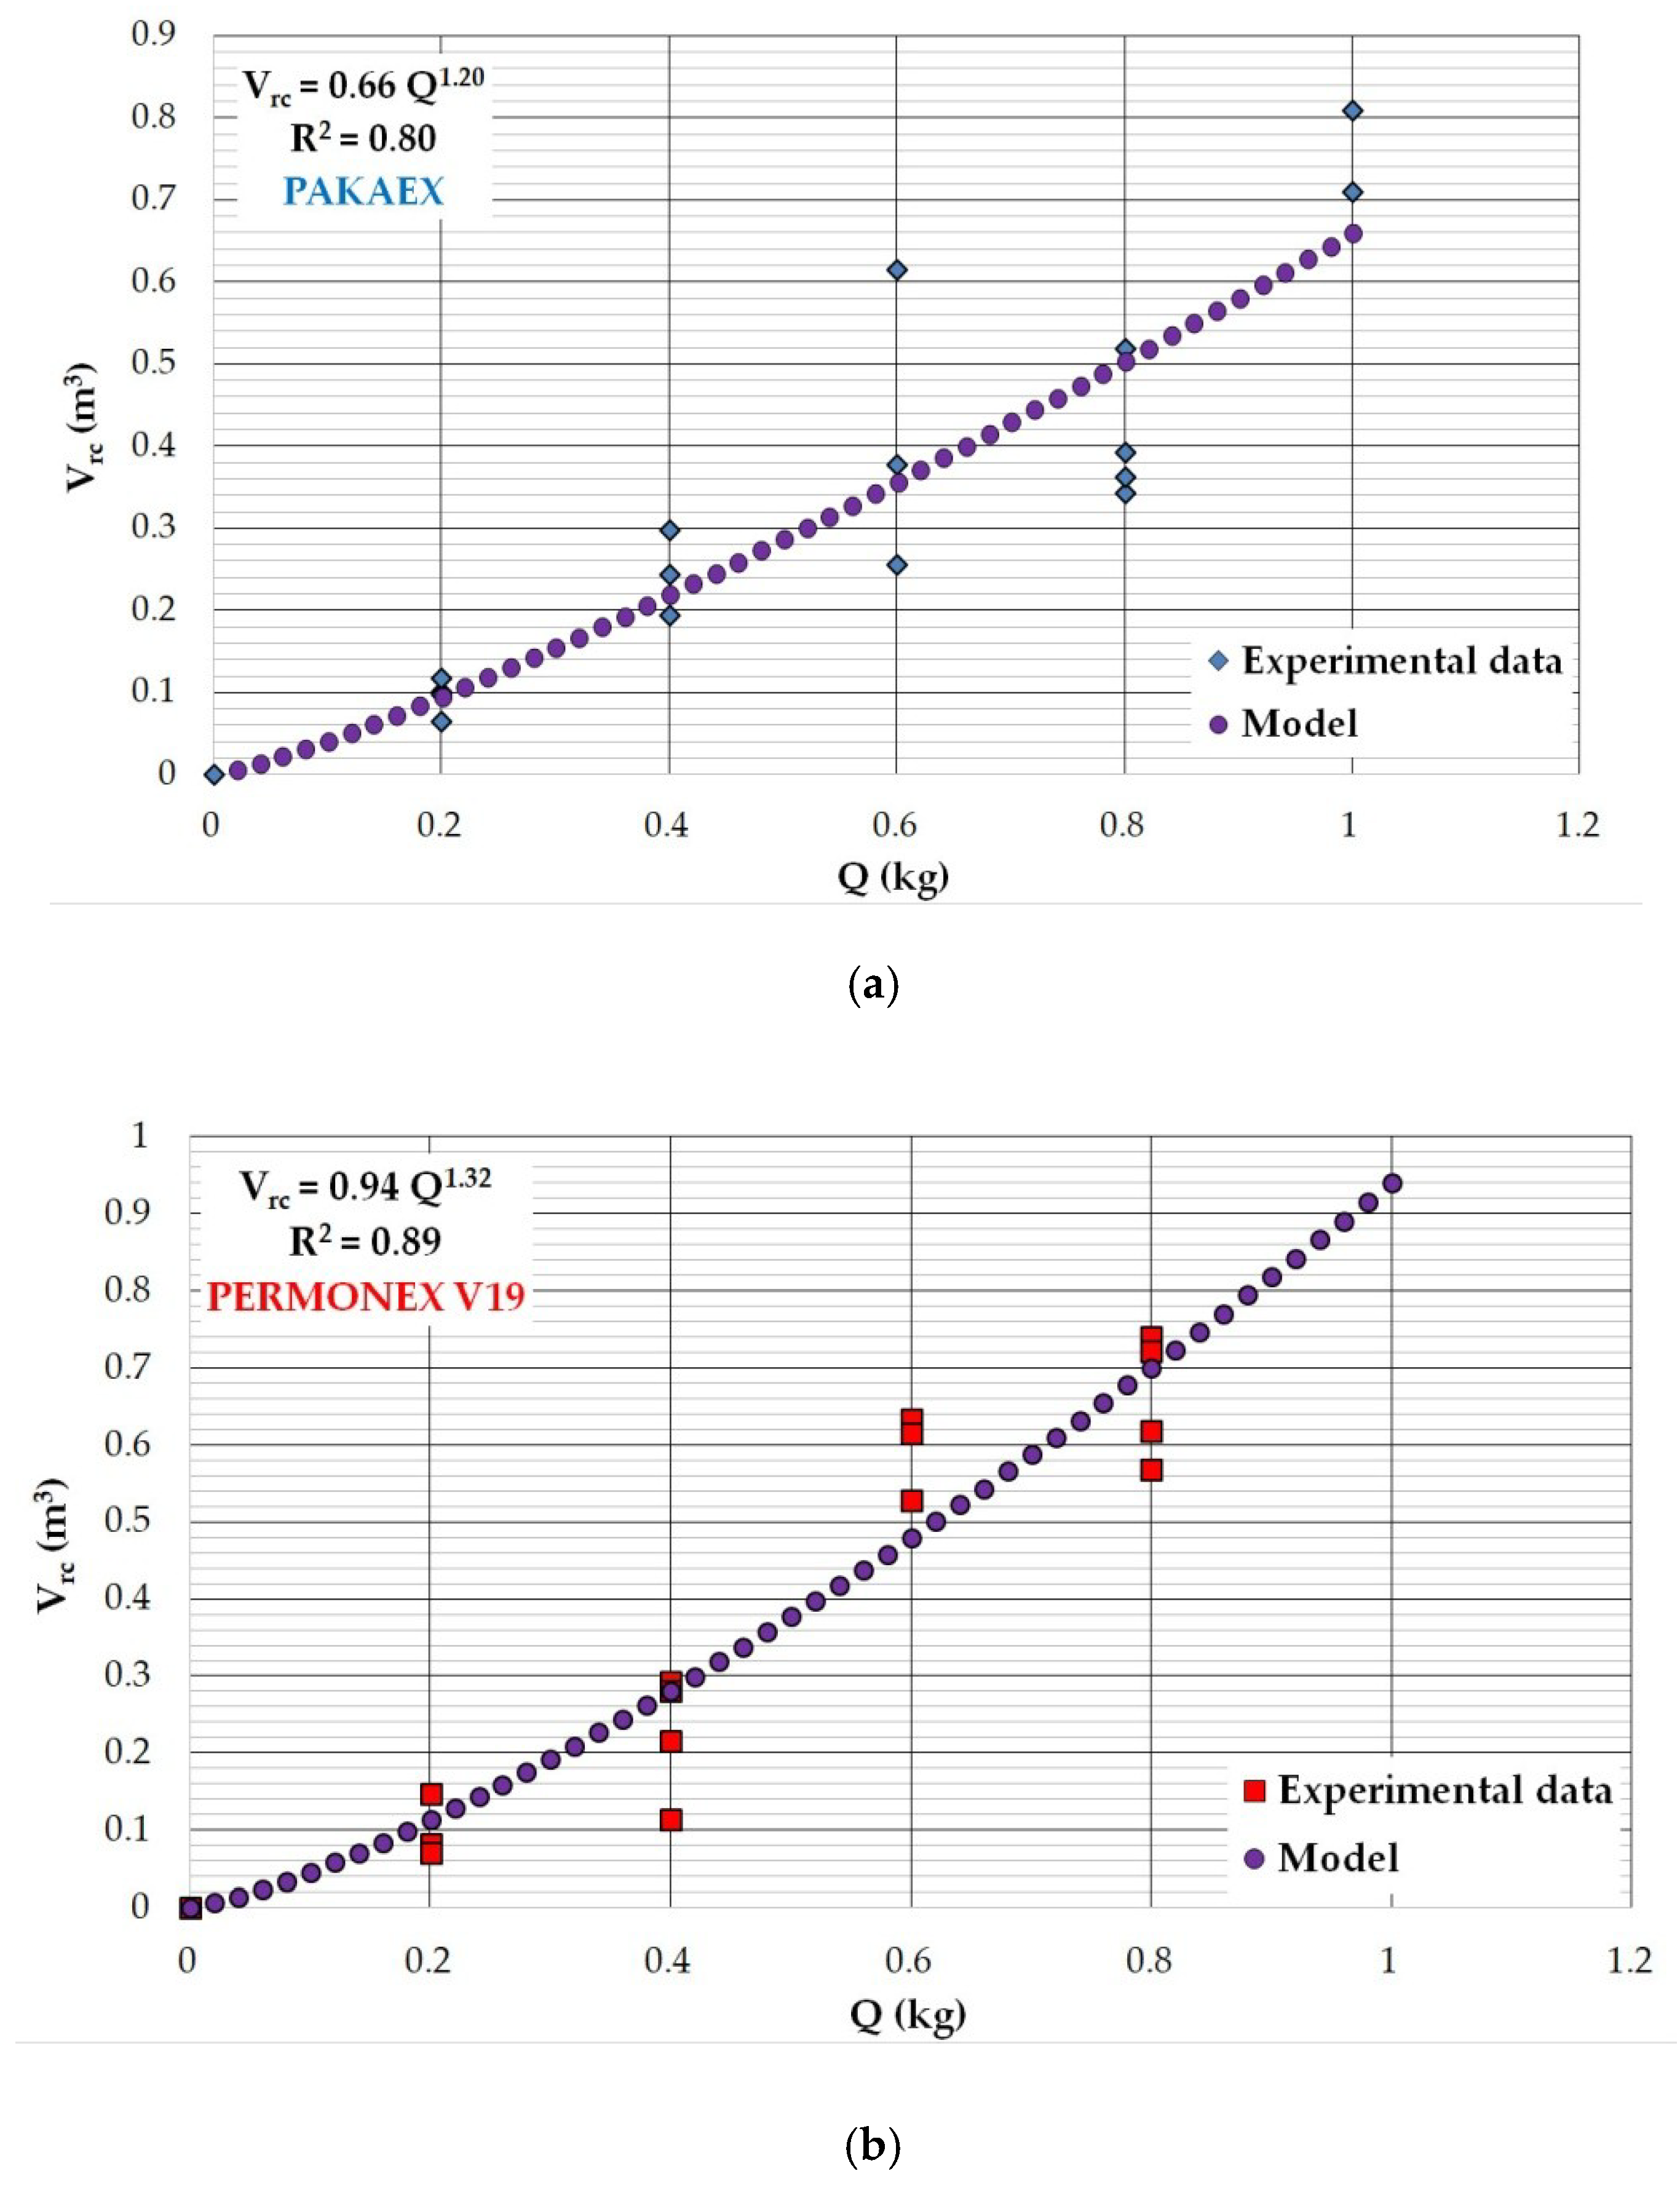
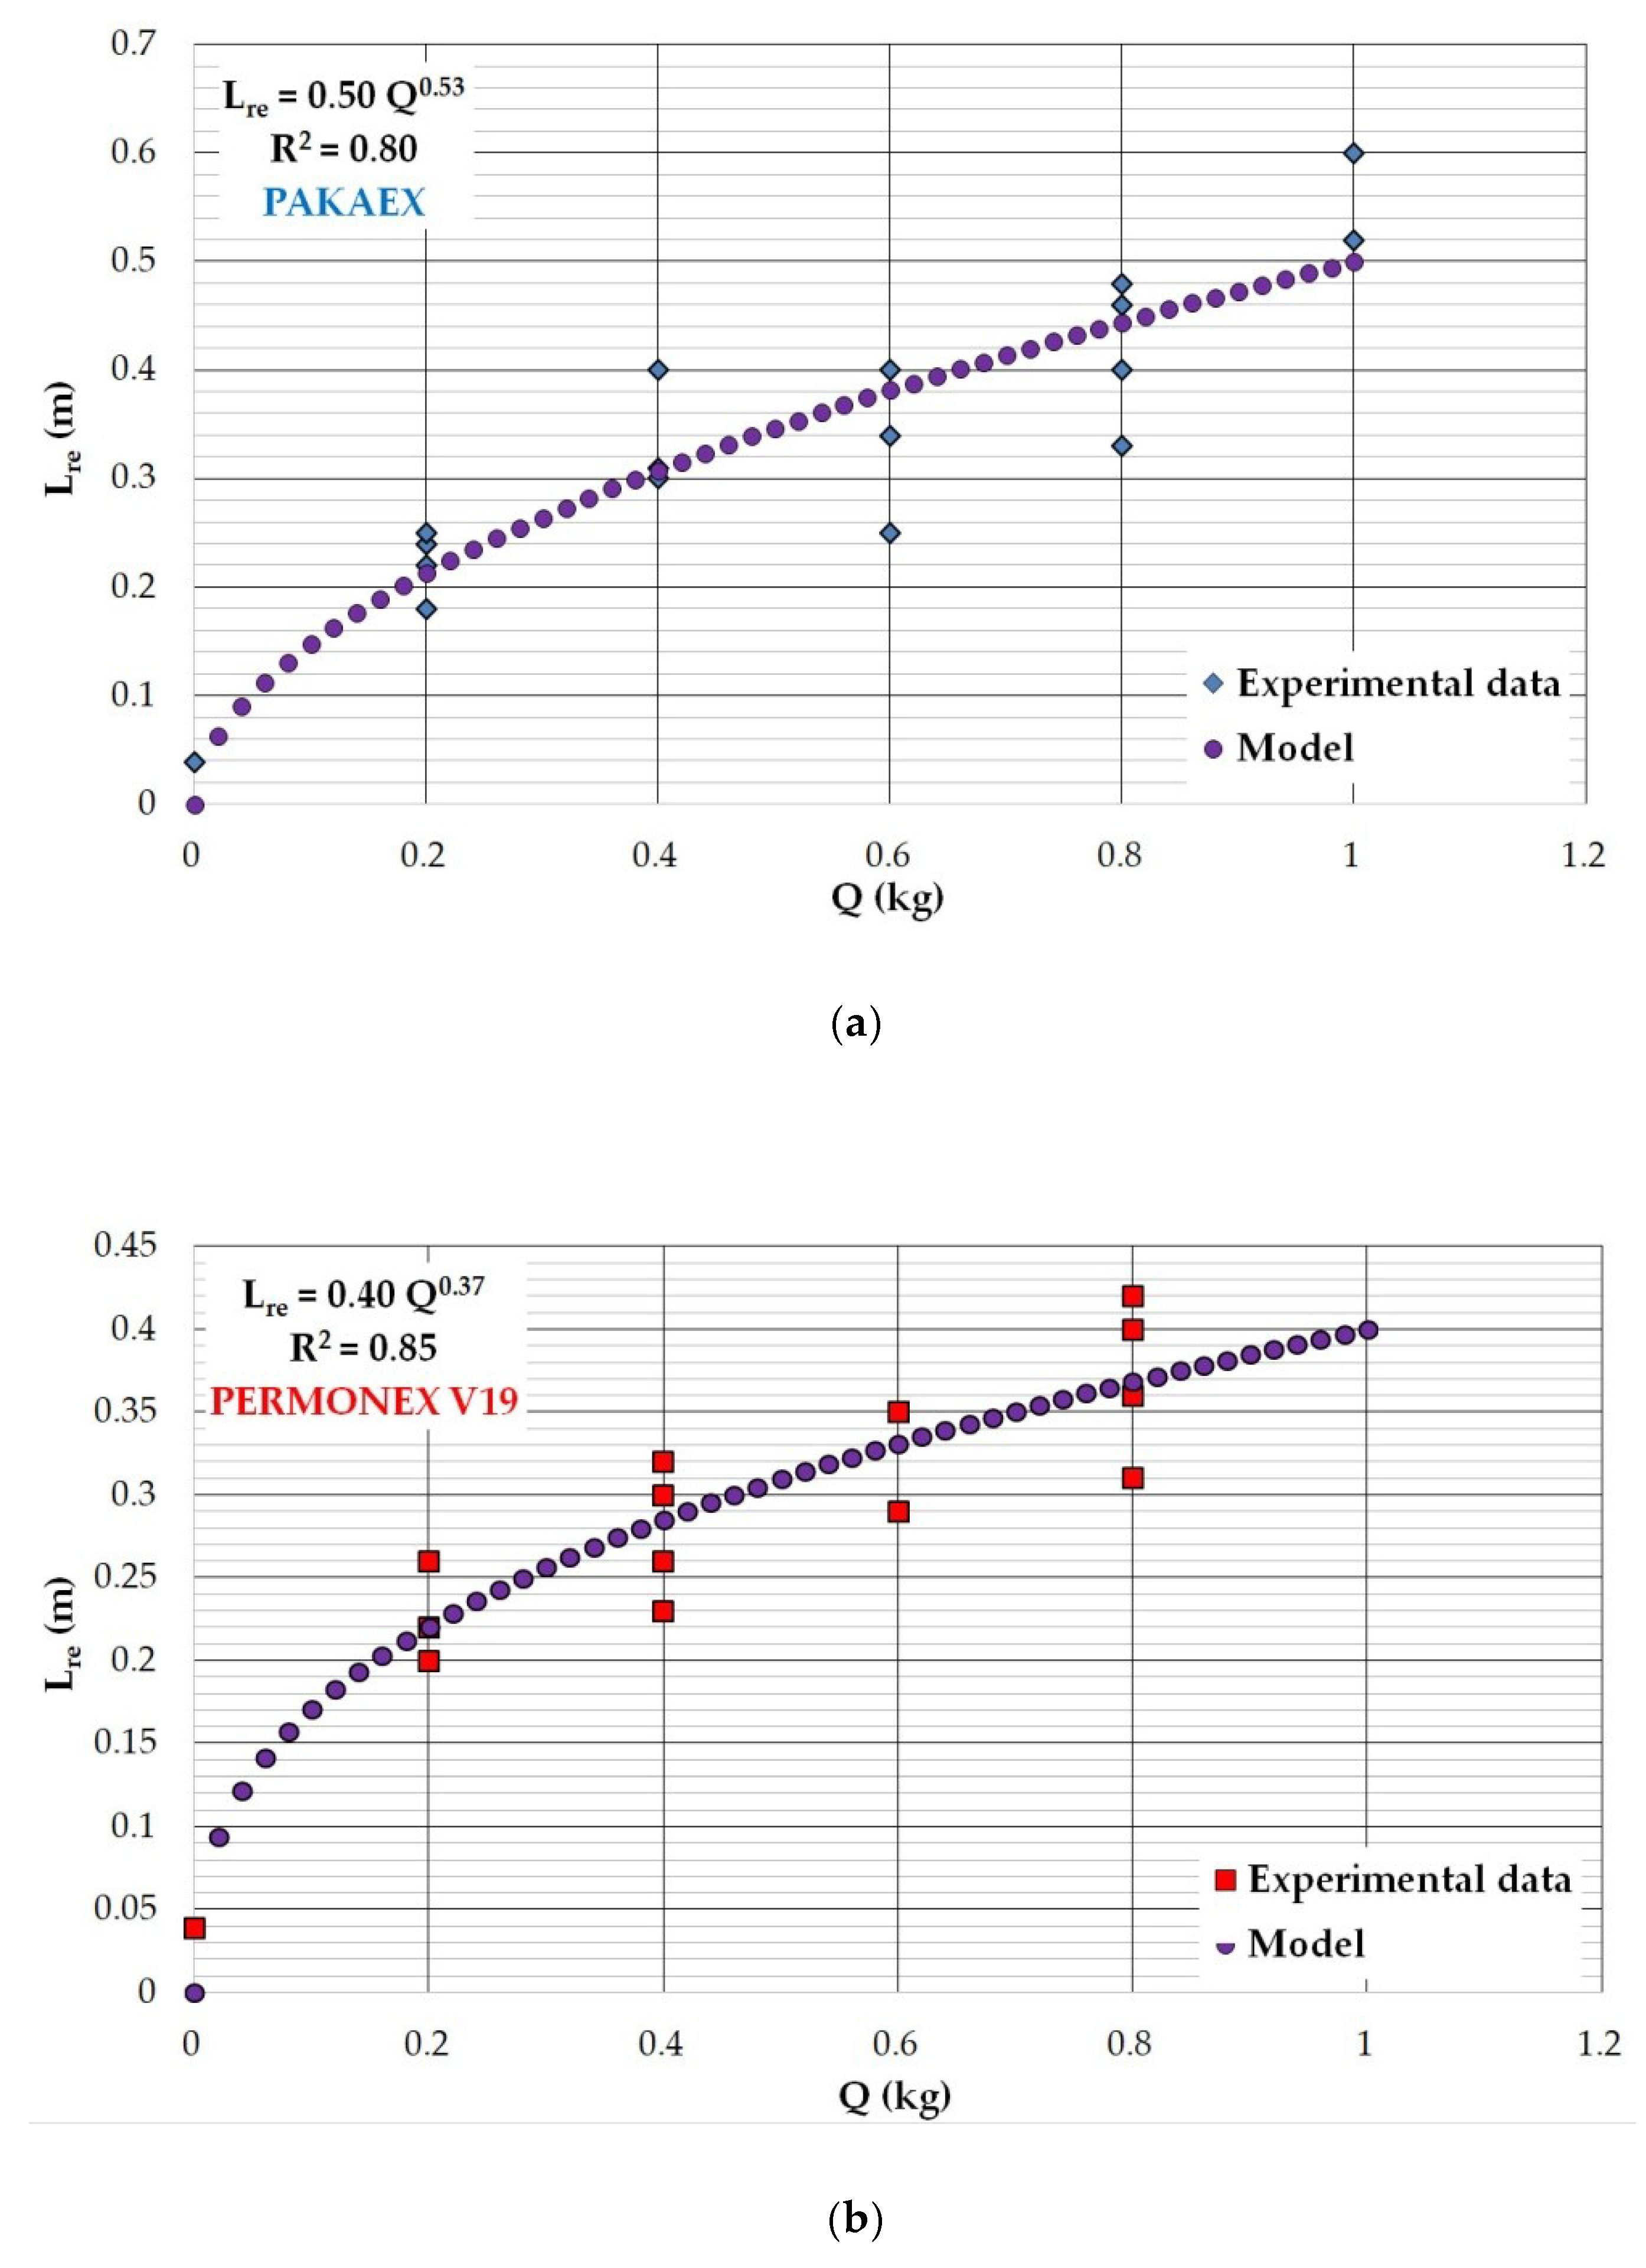
6. Results and Discussion
7. Conclusions
Author Contributions
Funding
Acknowledgments
Conflicts of Interest
References
- Krsnik, J. Miniranje; University of Zagreb: Zagreb, Croatia, 1989; ISBN 8680891088 9788680891088. [Google Scholar]
- Li, Q.; Li, Y.; Dasgupta, G.; Song, D.; Qiao, L.; Wang, L.; Dong, J. Analysis of the Blasting Compaction on Gravel Soil. J. Chem. 2015, 2015. [Google Scholar] [CrossRef]
- Wang, Z.; Lu, Y. Numerical analysis on dynamic deformation mechanism of soils under blast loading. Soil Dyn. earthqake Eng. 2003, 23, 705–714. [Google Scholar] [CrossRef]
- Hudec, M.; Krsnik, J.; Abramović, V.; Frgić, L.; Krajcer, M.; Gotić, I.; Meštrić, M.; Mesec, J.; Fingerhut, L. Supporting with anchors in soft rock and soil. In Proceedings of the international Congress on Progress and Innovation in Tunnelling, Toronto, Canada, 1989; pp. 111–117. [Google Scholar]
- Muhovec, I. Uloga i karakter geotehničkih sidara s osvrtom na značenje injekcijskog zahvata. Geotehnička sigra i sidrene Konstr. 1987, 3–25. [Google Scholar]
- Frgic, L.; Hudec, M.; Krsnik, J.; Krajcer, M.; Moon, J. Underground grounding by anchoring in soil. In Proceedings of the I Yugoslavian Symposium on Tunnels, Brijuni, Croatia, 1988; pp. 293–298. [Google Scholar]
- Bakr, R.M. The Impact of the unsupported excavation on the boundary of the active zone in medium, stiff and very stiff clay. J. Civ. Environ. Eng. 2019, 9, 1–9. [Google Scholar] [CrossRef]
- Soltani, A.; Deng, A.; Taheri, A.; Mirzababaei, M.; Vanapalli, S.K. Swell–Shrink Behavior of Rubberized Expansive Clays During Alternate Wetting and Drying. Minerals 2019, 9, 224. [Google Scholar] [CrossRef]
- Shakeran, M.; Eslami, A.; Ahmadpour, M. Geotechnical Aspects of Explosive Compaction. Shock. Vib. 2016, 2016, 1–14. [Google Scholar] [CrossRef] [Green Version]
- Wu, H.; Pollard, D.D. Imaging 3-D fracture networks around boreholes. Am. Assoc. Pet. Geol. 2002, 4, 593–604. [Google Scholar]
- Schepers, R.; Rafat, G.; Gelbke, C.; Lehmann, B. Application of borehole logging, core imaging and tomography to geotechnical exploration. Int. J. Rock Mech. Min. Sci. 2001, 38, 867–876. [Google Scholar] [CrossRef]
- McCarthy, J.D.; Graniero, P.A. A GIS-based borehole data management and 3D visualization system. Comput. Geosci. 2006, 32, 1699–1708. [Google Scholar] [CrossRef]
- Mesec, J.; Težak, D.; Grubešić, M. The use of explosives for improvement of clay soils. Environ. Eng. 2015, 2, 95–101. Varaždin,.(In Croatia) [Google Scholar]
- Težak, D. Influence of the blasting features on the expansion in clay soil. Ph.D. Thesis, University of Zagreb, Zagreb, Croatia, 20 July 2018. [Google Scholar]
- Araya, K.; Gao, R.; Tsunematsu, S.; Ochi, K. Loosening of dense clay soils by linear blasting. J. Agric. Eng. Res. 1993, 54, 113–126. [Google Scholar] [CrossRef]
- Pribičević, B.; Medak, D. Geodesy in Civil Engineering; University of Rijeka—Faculty of Civil Engineering: Zagreb, Croatia, 2003; ISBN 953-201-293-1. [Google Scholar]
- Marjanović, M. CROPOS hrvatski pozicijski sustav. Ekscentar 2010, 12, 28–34. [Google Scholar]
- Heavy Duty Geo Vision Borehole Camera. Available online: http://www.geovision.org/ (accessed on 12 April 2019).
- EDS-C, Dimetix EDS-C distance sensor. Available online: https://dimetix.com/en/?product=eds-c (accessed on 12 April 2019).
- Gabriels, P.; Snieder, R.; Nolet, G. In situ measurements of shear-wave velocity in sediments with higher-mode rayleigh waves. Geophys. Prospect. 1987, 35, 187–196. [Google Scholar] [CrossRef]
- Park, C.B.; Miller, R.D.; Xia, J. Multichannel analysis of surface waves. Geophysics 1999, 64, 800–808. [Google Scholar] [CrossRef] [Green Version]
- Sućeska, M. Eksplozije i eksplozivi-njihova mirnodopska primjena; Brodarski institut: Zagreb, Croatia, 2001; ISBN 953-6017-11-3. [Google Scholar]
- Dobrilović, M. Raspoloživa energija tlačnog udarnog vala udarne cjevčice i njezina primjena u iniciranju elektroničkog detonatora. Ph.D. Thesis, University of Zagreb, Zagreb, Croatia, 2008. [Google Scholar]


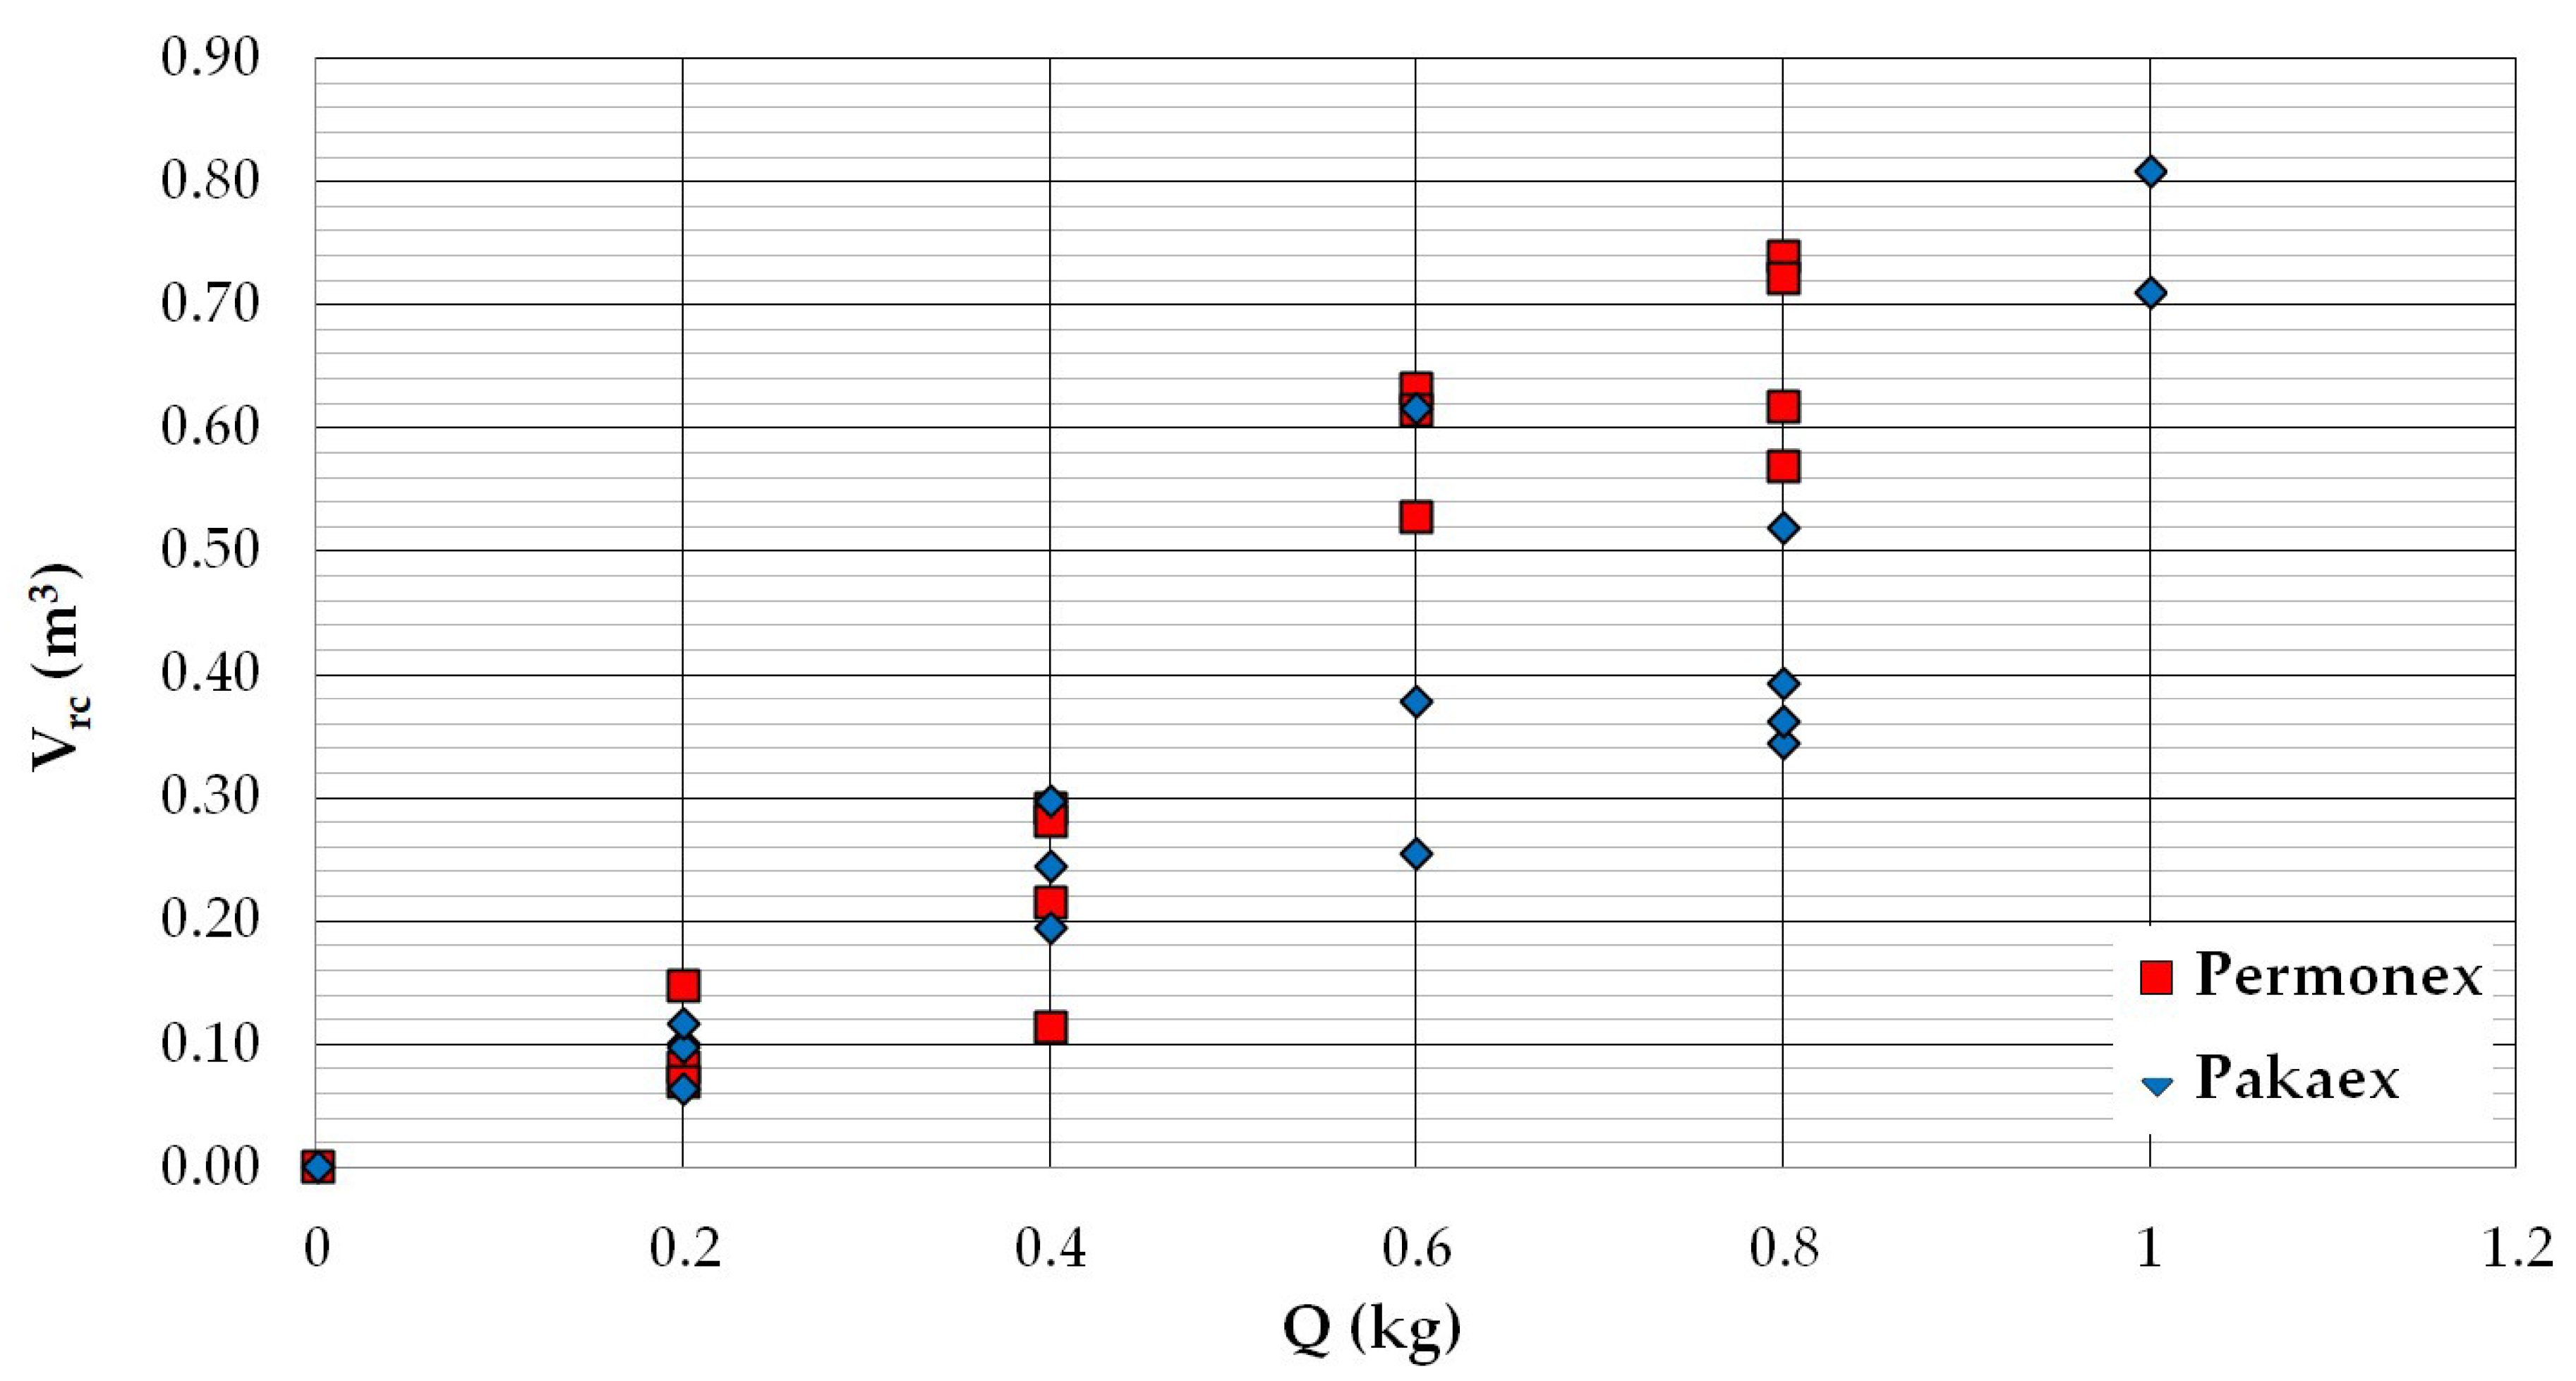
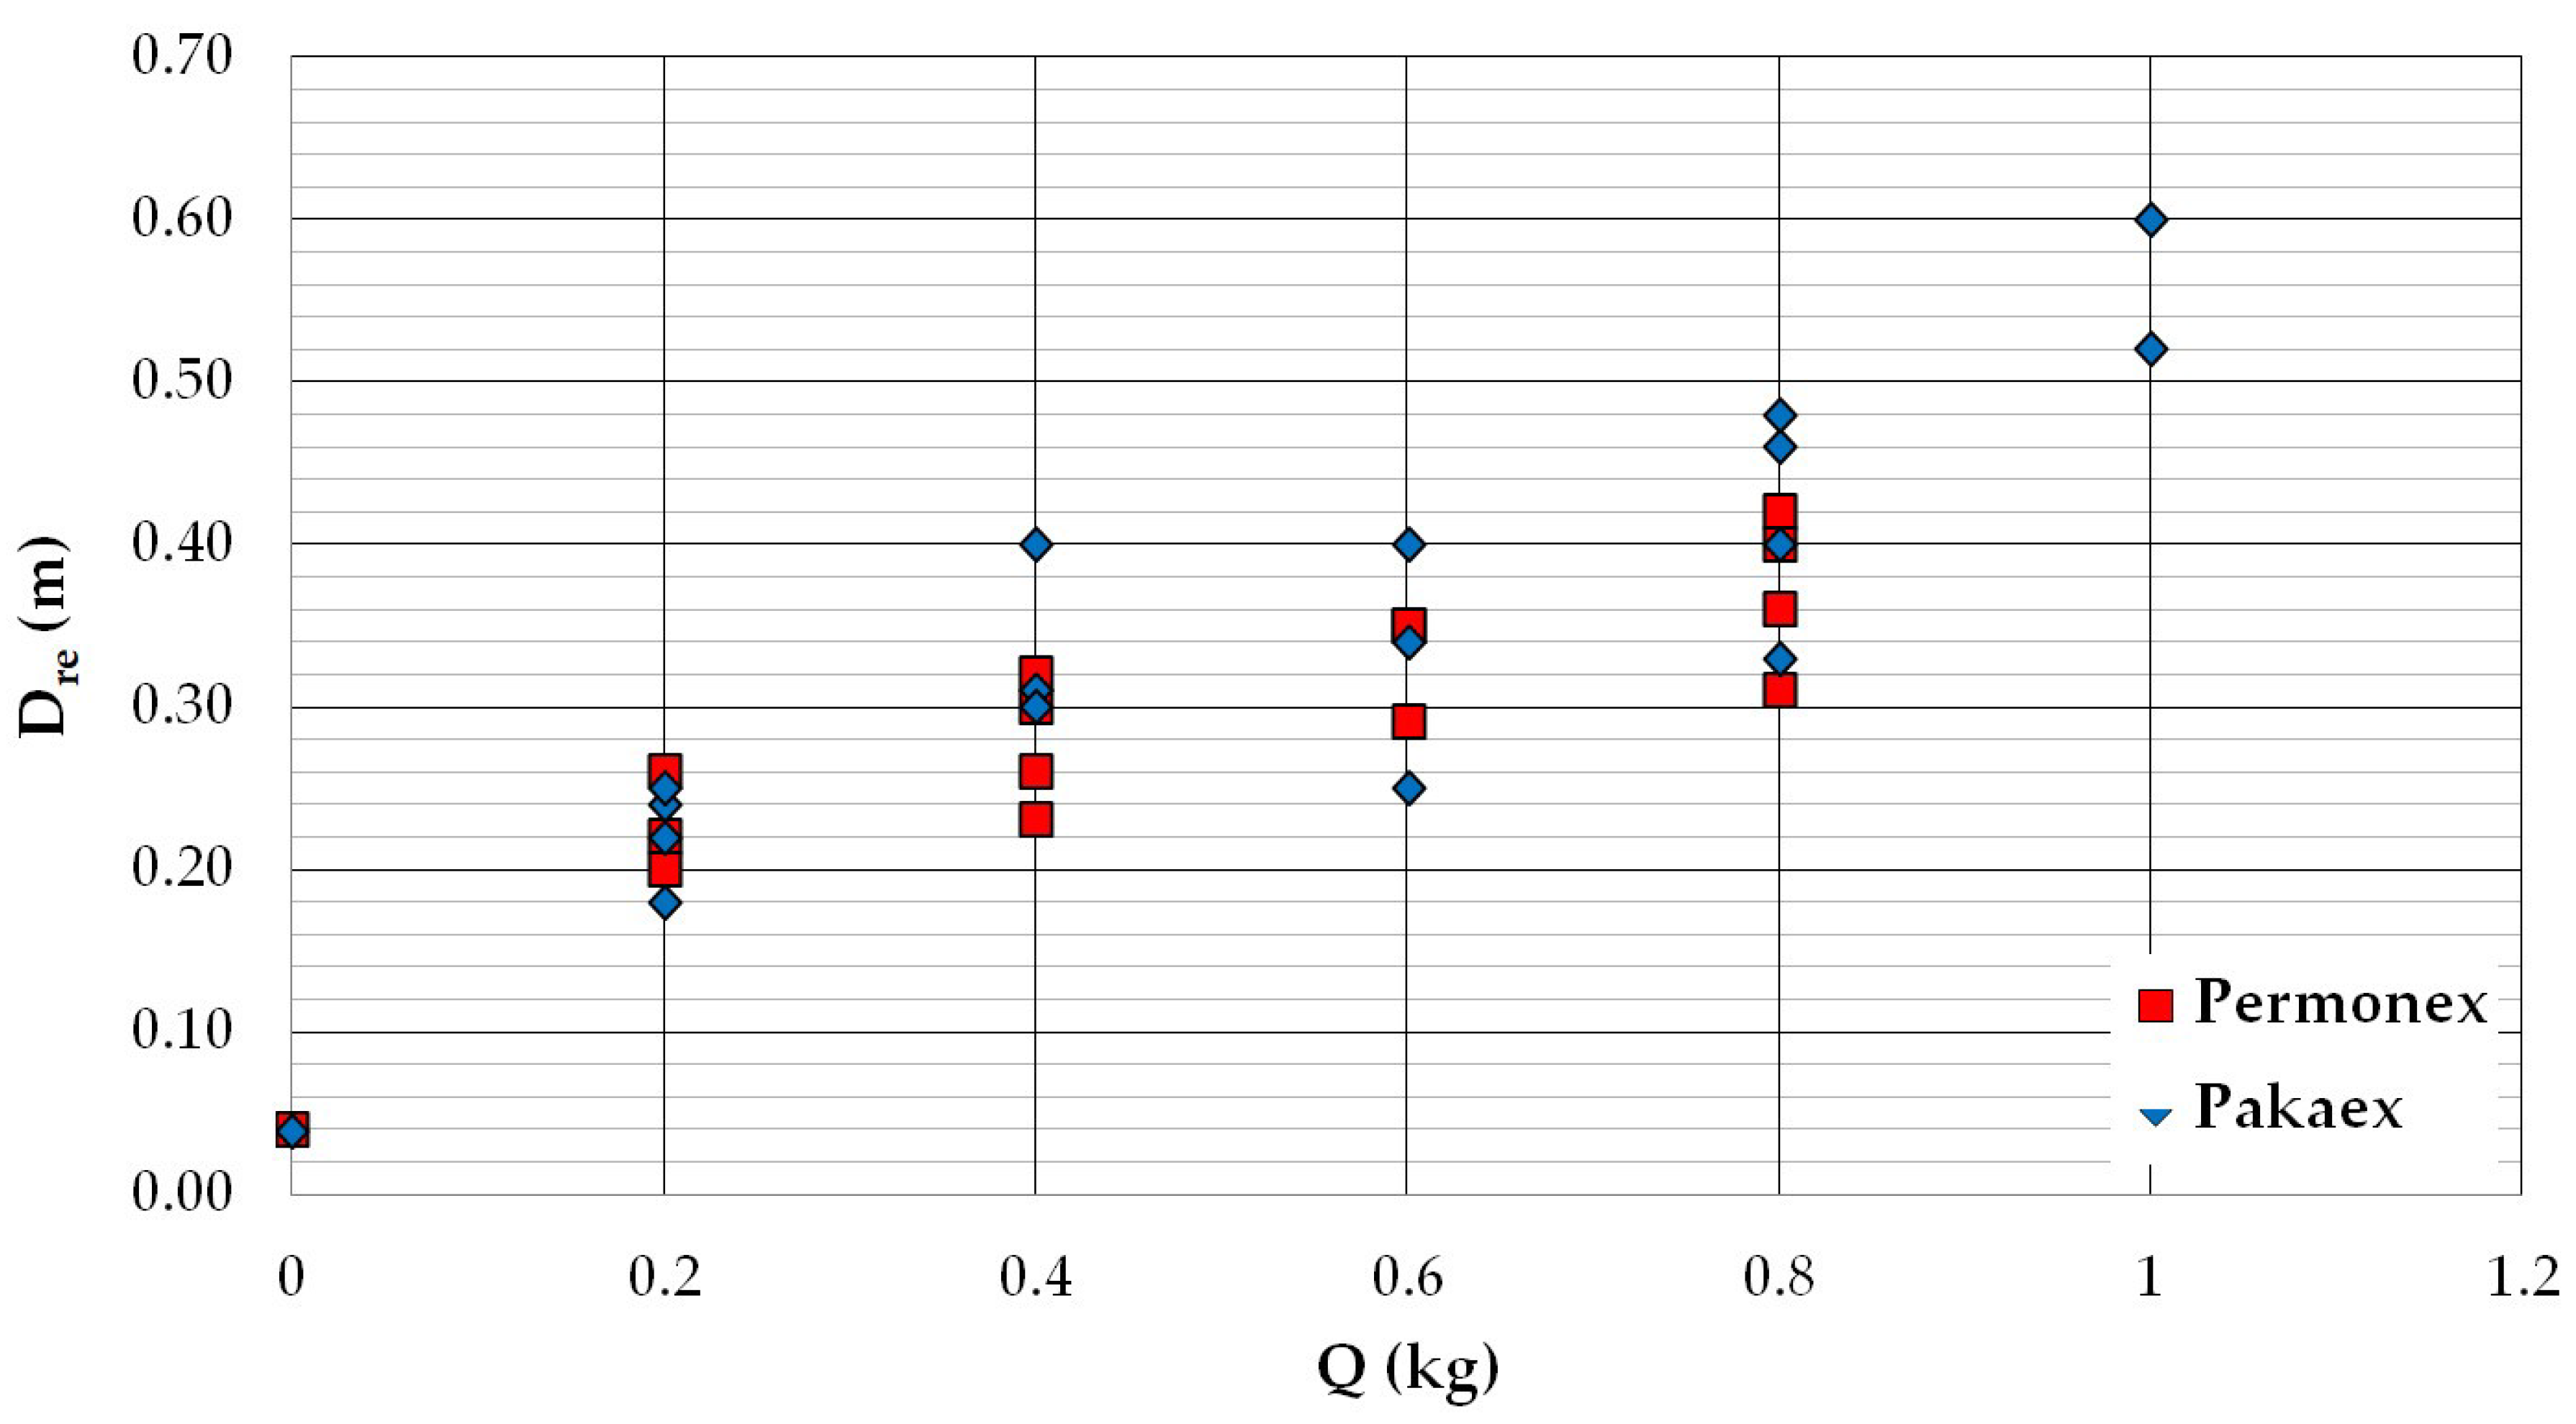
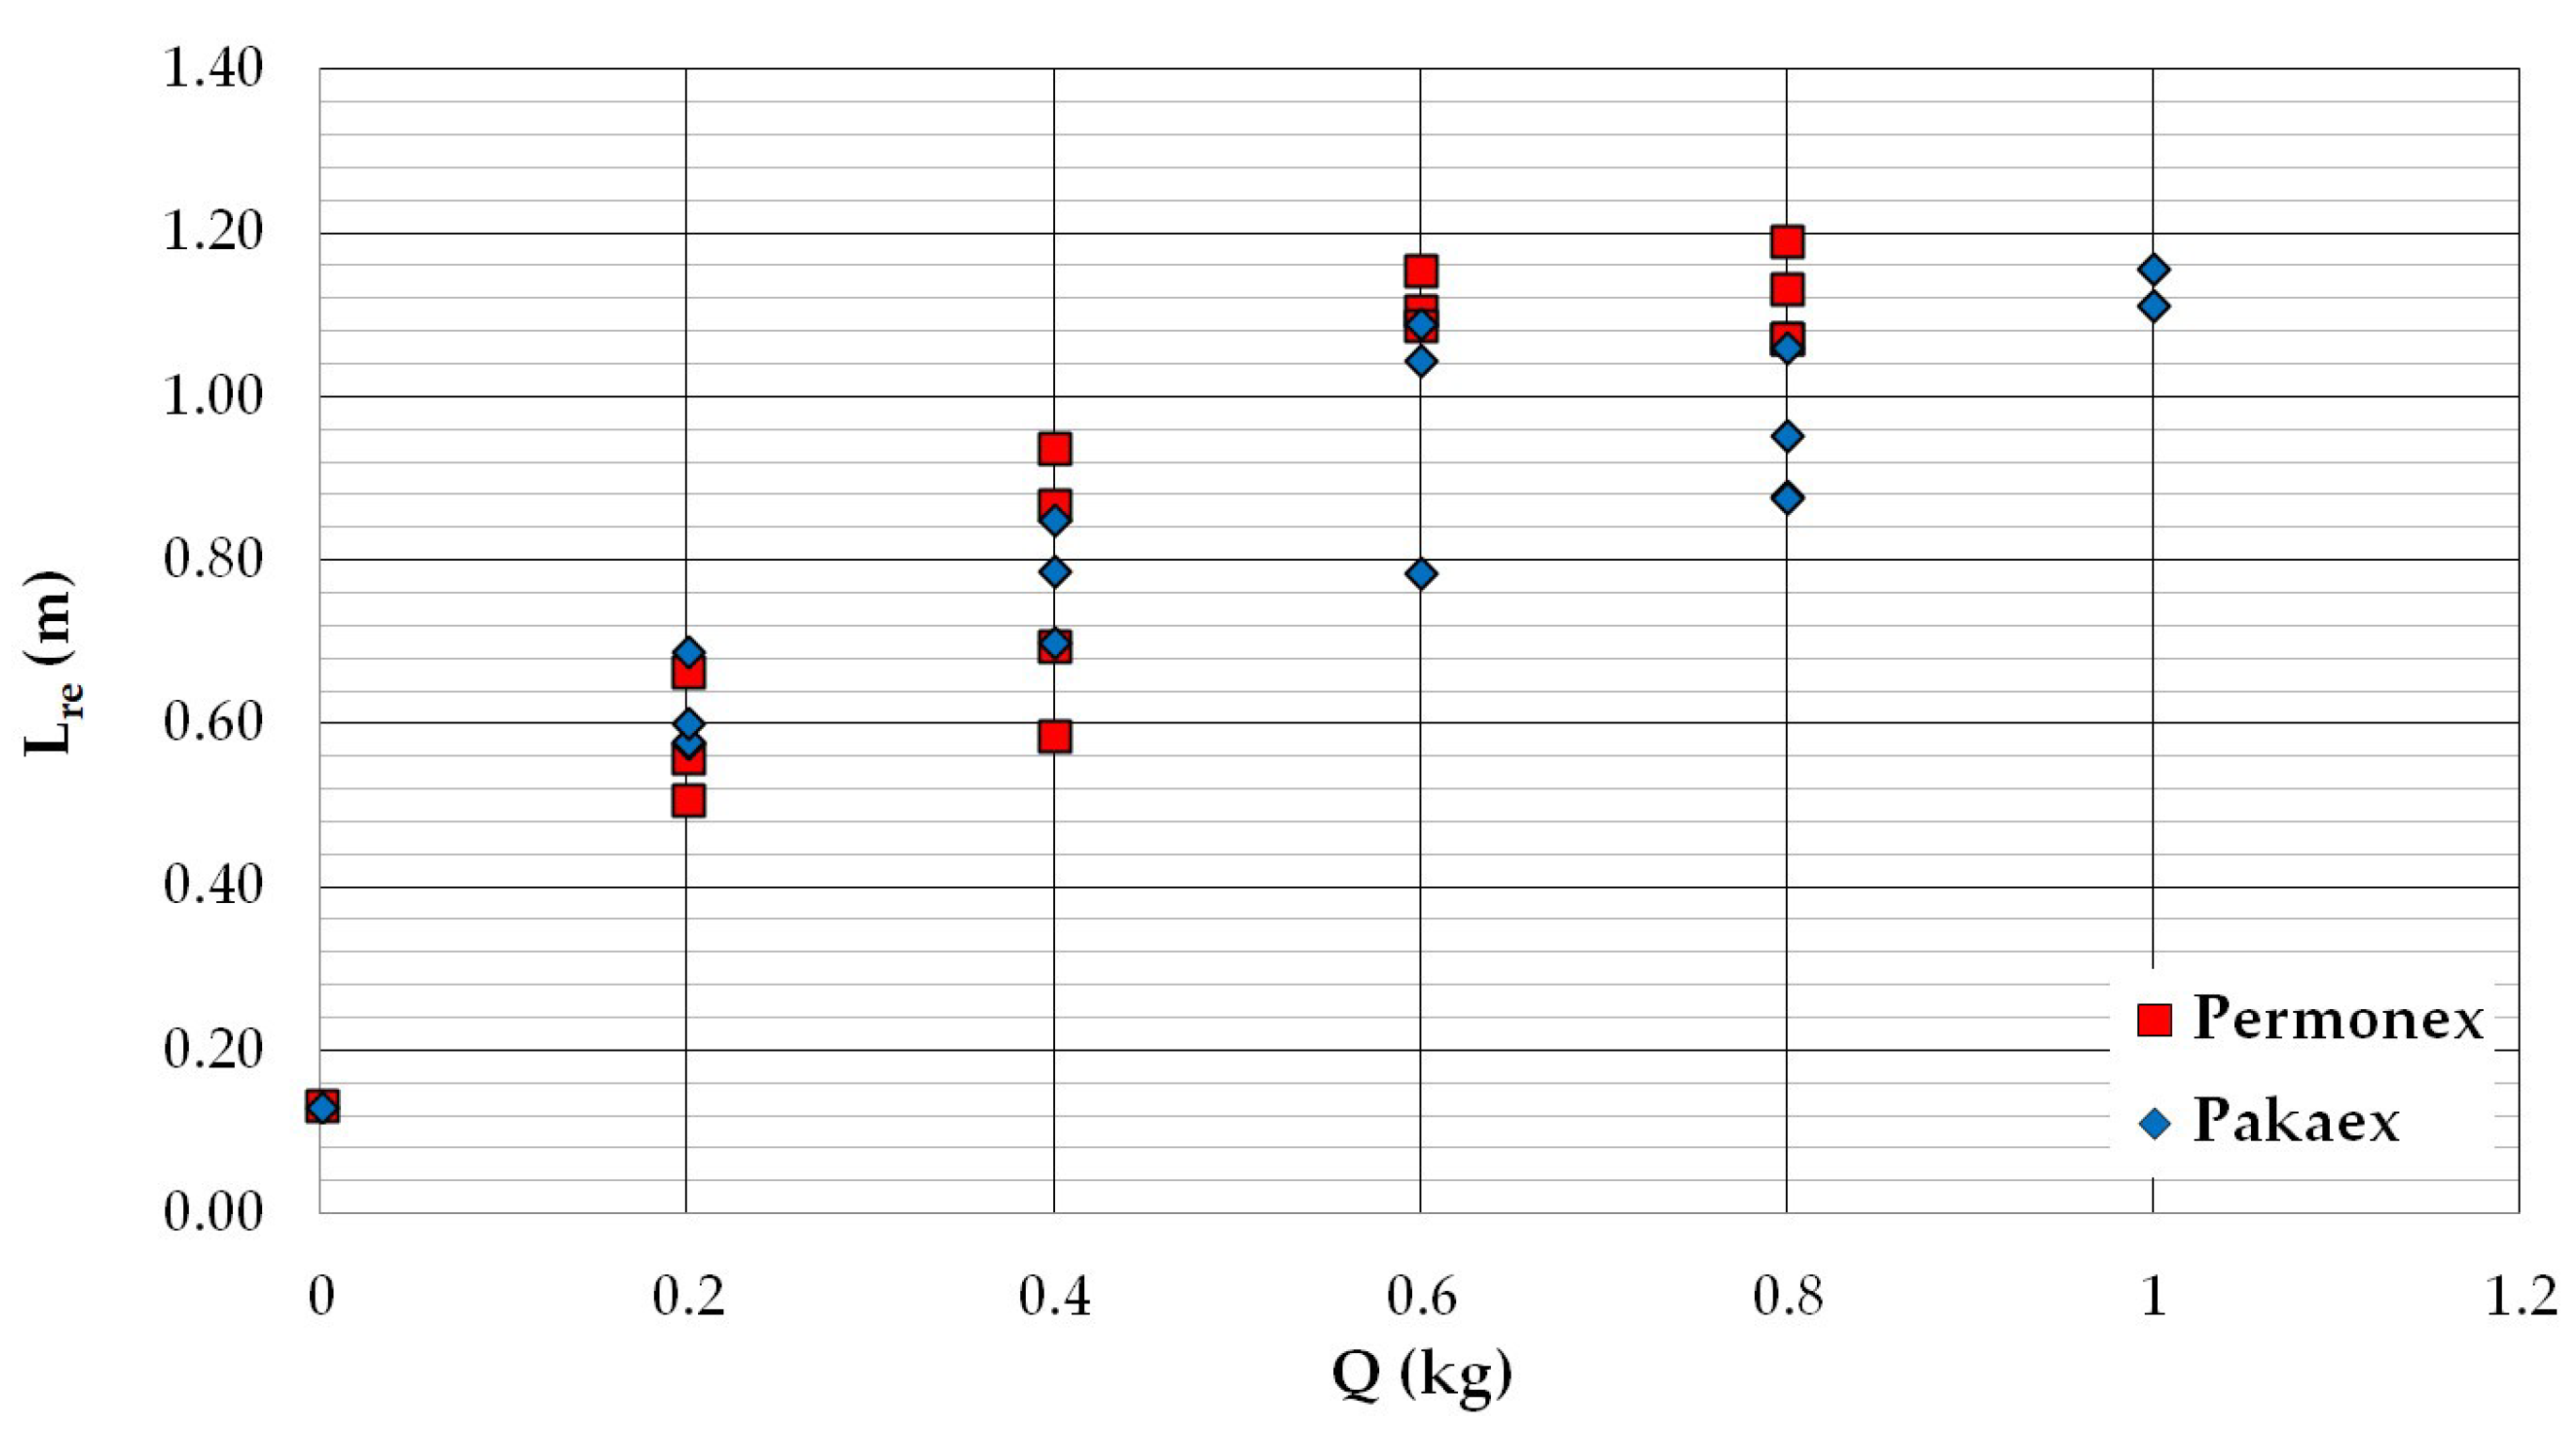
| Pakaex | Permonex V19 | ||||||||
|---|---|---|---|---|---|---|---|---|---|
| Borehole | Explosive Charge Mass | Volume of the Resulting Cavity | Resulting Expansion of the Borehole | Deepening of the Resulting Expansion | Borehole | Explosive Charge Mass | Volume of the Resulting Cavity | Resulting Expansion of the Borehole | Deepening of the Resulting Expansion |
| Q (kg) | Vrc (m3) | Lre (m) | Dre (m) | Q (kg) | Vrc (m3) | Lre (m) | Dre (m) | ||
| MB20 | 1.00 | 0.7100 | 1.1570 | 0.5200 | MB24 | 0.80 | 0.6184 | 1.1900 | 0.3100 |
| MB41 | 1.00 | 0.8095 | 1.1110 | 0.6000 | MB26 | 0.80 | 0.5690 | 1.1310 | 0.3600 |
| MB34 | 0.80 | 0.3935 | 0.9530 | 0.3300 | MB45 | 0.80 | 0.7405 | 1.0700 | 0.4000 |
| MB18 | 0.80 | 0.3440 | 0.8770 | 0.4600 | PMB5 | 0.80 | 0.7227 | 1.0710 | 0.4200 |
| MB19 | 0.80 | 0.3626 | 0.8750 | 0.4800 | MB23 | 0.60 | 0.5276 | 1.1040 | 0.3500 |
| MB40 | 0.80 | 0.5190 | 1.0600 | 0.4000 | MB25 | 0.60 | 0.6330 | 1.0850 | 0.2900 |
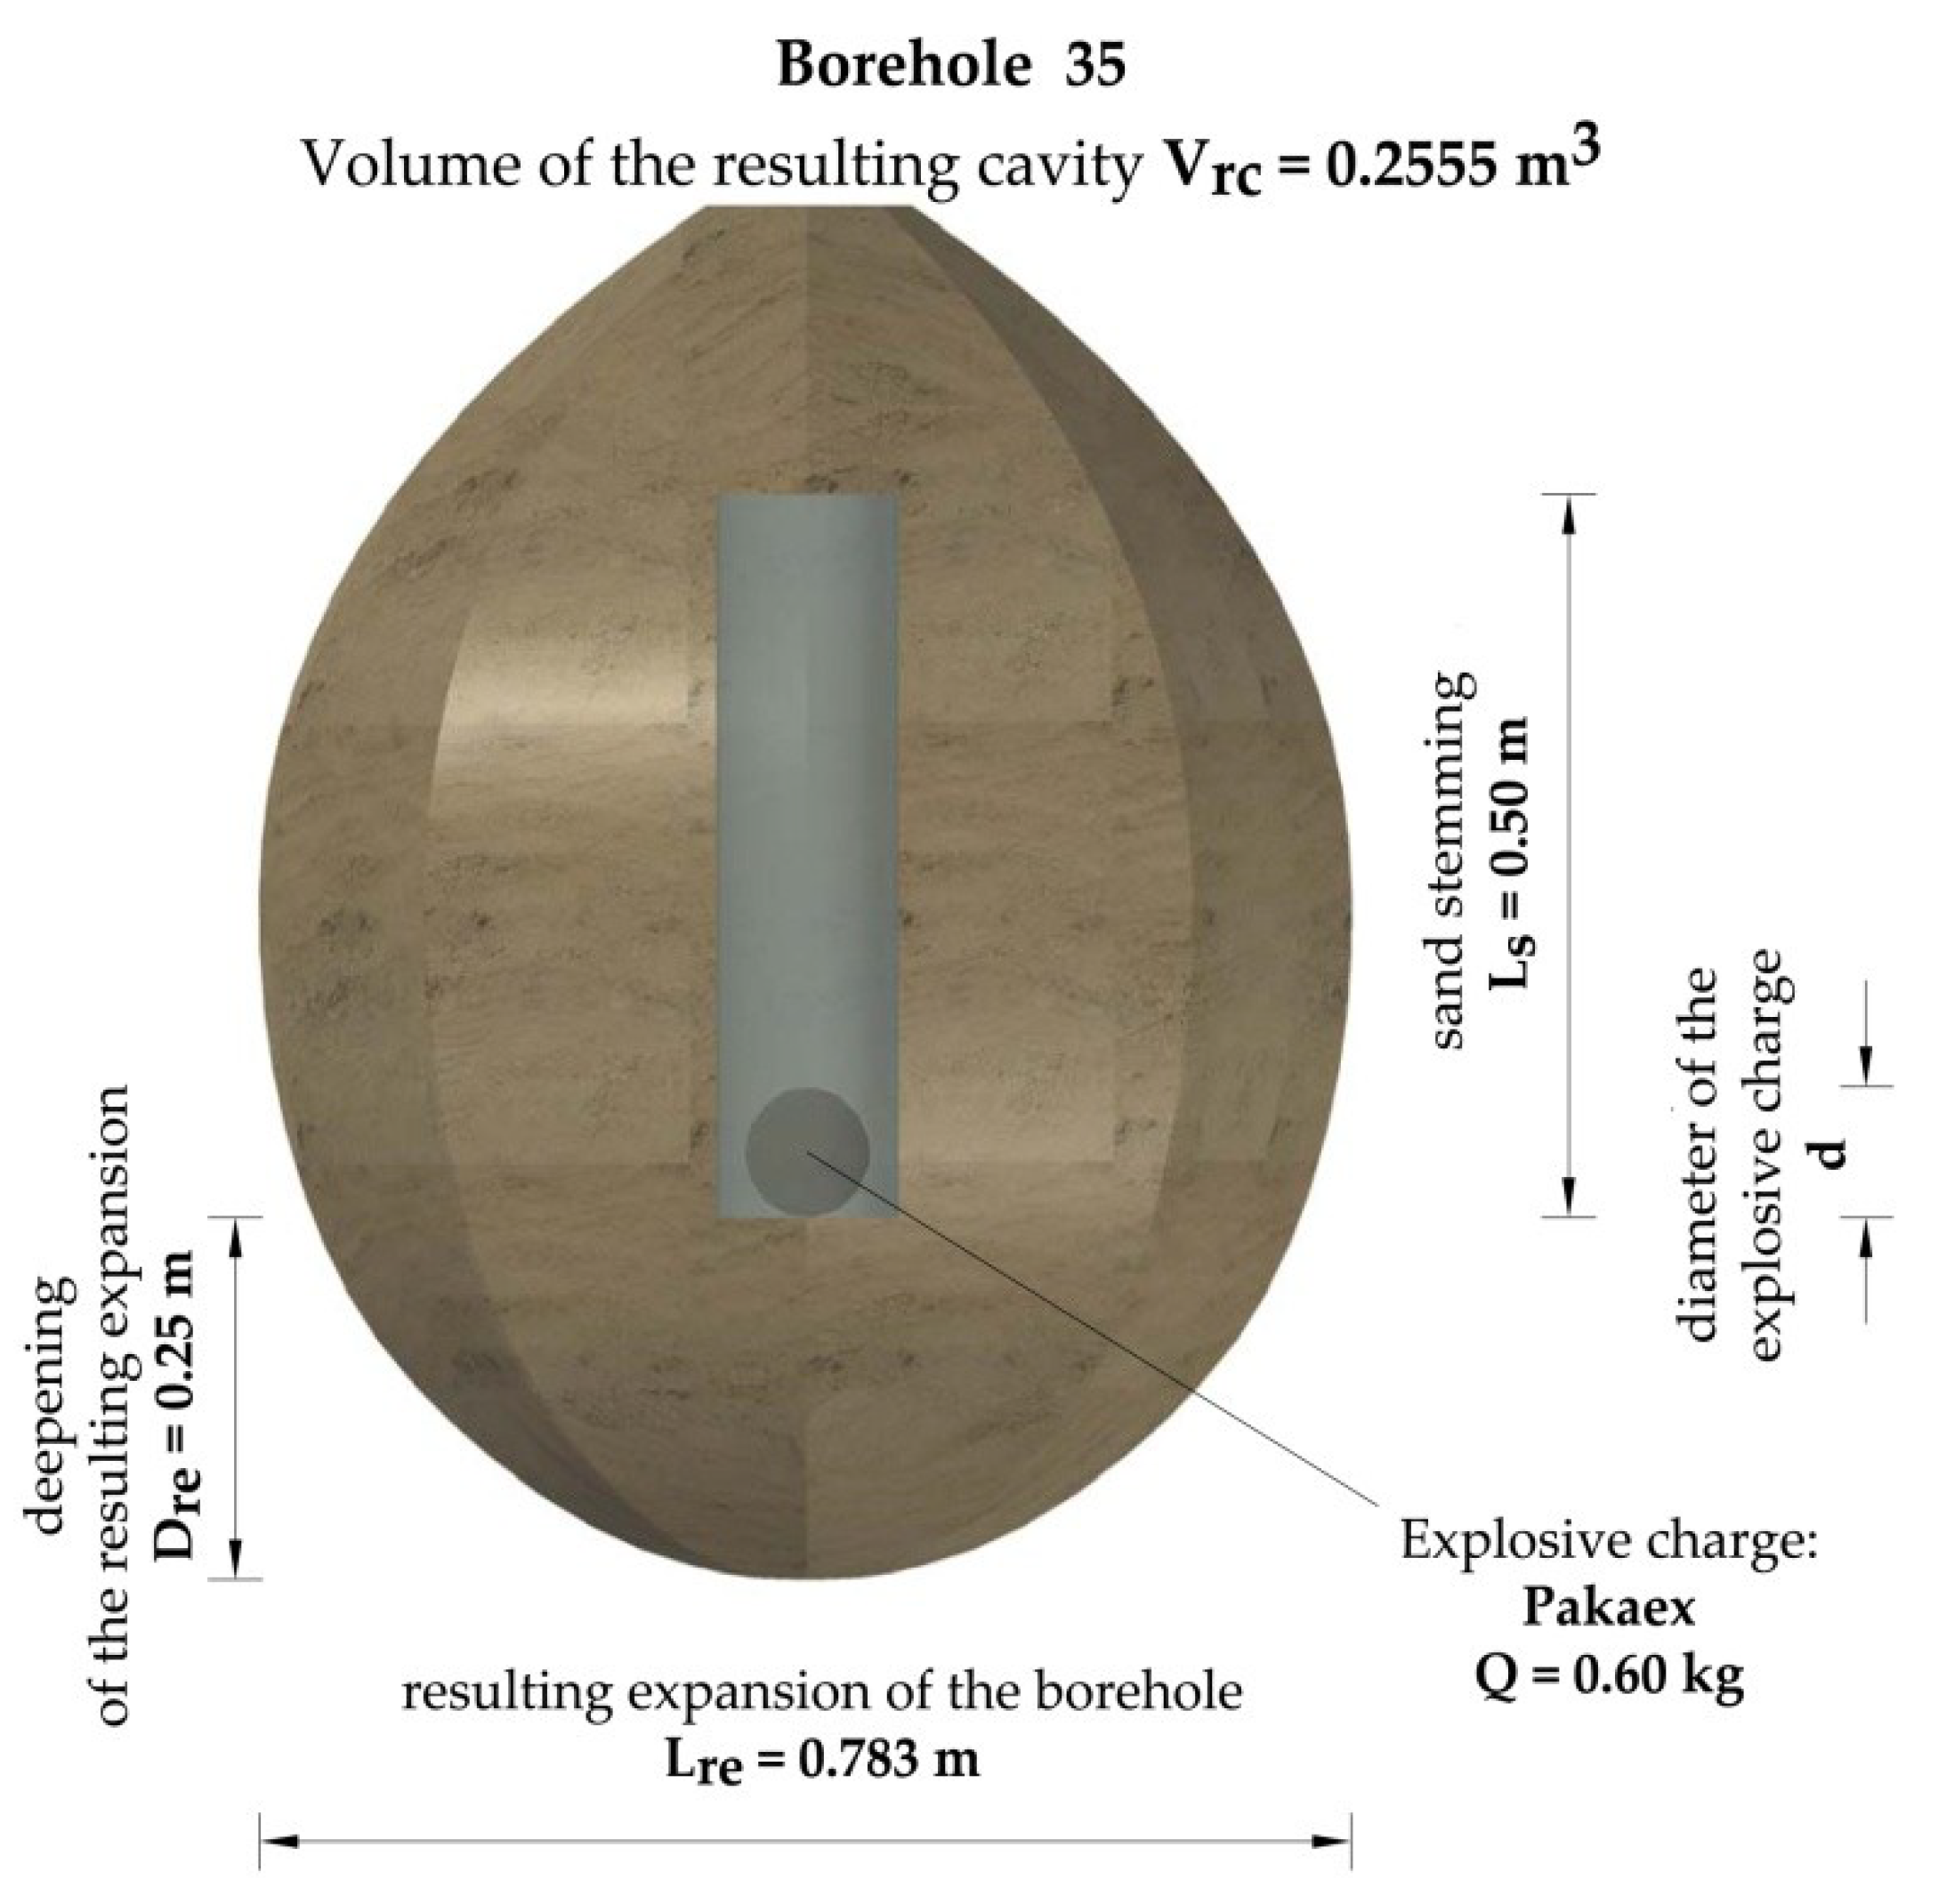
| MB35 | 0.60 | 0.2555 | 0.7830 | 0.2500 | PMB6 | 0.60 | 0.6151 | 1.1520 | 0.3500 |
| MB17 | 0.60 | 0.6160 | 1.0430 | 0.3400 | MB36 | 0.40 | 0.1135 | 0.6930 | 0.2300 |
| MB39 | 0.60 | 0.3785 | 1.0880 | 0.4000 | MB21 | 0.40 | 0.2925 | 0.9360 | 0.2600 |
| MB15 | 0.40 | 0.2445 | 0.6980 | 0.3100 | MB27 | 0.40 | 0.2160 | 0.5850 | 0.3200 |
| MB16 | 0.40 | 0.1945 | 0.7870 | 0.3000 | MB43 | 0.40 | 0.2815 | 0.8660 | 0.3000 |
| MB38 | 0.40 | 0.2980 | 0.8480 | 0.4000 | MB22 | 0.20 | 0.0825 | 0.5570 | 0.2600 |
| MB13 | 0.20 | 0.1005 | 0.5760 | 0.1800 | MB28 | 0.20 | 0.0700 | 0.5050 | 0.2200 |
| MB14 | 0.20 | 0.0645 | 0.5770 | 0.2200 | MB42 | 0.20 | 0.1480 | 0.6620 | 0.2000 |
| MB29 | 0.20 | 0.0980 | 0.6870 | 0.2400 | |||||
| MB37 | 0.20 | 0.1175 | 0.6010 | 0.2500 | |||||
| Model | Basic | Linearized |
|---|---|---|
| Exponential | y = a*e^(b*x) | ln(y) = b*x + ln(a) |
| Logarithmic | y = a*ln(x) + b | e^((y - b)/a) = x |
| Modified logarithmic | y = a*ln(x + b) | e^((y/a)) = x + b |
| Power | y = a*x^b | (y/a)^(1/b) = x |
| Volume | Expansion | Deepening | |||||||||||
|---|---|---|---|---|---|---|---|---|---|---|---|---|---|
| Pakaex | Permonex V19 | Pakaex | Permonex V19 | Pakaex | Permonex V19 | Pakaex | Permonex V19 | ||||||
| Basic | Bs.+ nul.v. | Basic | Bs.+ nul.v. | Basic | Bs.+ nul.v. | Basic | Bs.+ nul.v. | Basic | Bs.+ nul.v. | Basic | Bs.+ nul.v. | ||
| Exp. | a | 0.09 | 0.09 | 0.10 | 0.10 | 0.57 | 0.51 | 0.52 | 0.46 | 0.19 | 0.17 | 0.20 | 0.17 |
| b | 2.03 | 2.10 | 2.38 | 2.47 | 0.68 | 0.84 | 1.02 | 1.20 | 1.04 | 1.16 | 0.79 | 1.03 | |
| Log. | a | 0.31 | 0.93 | 0.44 | 1.24 | 0.29 | 1.37 | 0.43 | 1.77 | 0.16 | 0.66 | 0.11 | 0.54 |
| b | 0.57 | 0.92 | 0.75 | 0.90 | 1.07 | 1.31 | 1.23 | 1.15 | 0.47 | 1.16 | 0.39 | 1.24 | |
| Pow. | a | 0.66 | 0.66 | 0.94 | 0.94 | 1.09 | 1.09 | 1.30 | 1.30 | 0.50 | 0.50 | 0.40 | 0.40 |
| b | 1.20 | 1.20 | 0.21 | 1.32 | 0.35 | 0.35 | 0.51 | 0.51 | 0.53 | 0.53 | 0.37 | 0.37 | |
| Linearized Models | PAKAEX | PERMONEX V19 | |||||||
|---|---|---|---|---|---|---|---|---|---|
| Basic | Supplemented | Basic | Supplemented | ||||||
| r | t | r | t | r | t | r | t | ||
| Volume | Exp. | 0.9054 | 7.979 | 0.7614 | 4.549 | 0.9125 | 7.727 | 0.9125 | 8.043 |
| Log. | 0.8458 | 5.932 | 0.8543 | 6.366 | 0.9299 | 8.758 | 0.9418 | 10.101 | |
| Pow. | 0.8893 | 7.276 | 0.9088 | 8.436 | 0.9369 | 9.284 | 0.9436 | 10.276 | |
| Expansion | Exp. | 0.8754 | 6.776 | 0.7522 | 4.421 | 0.8746 | 6.249 | 0.8269 | 5.302 |
| Log. | 0.8602 | 6.311 | 0.8866 | 7.424 | 0.8935 | 6.893 | 0.9225 | 8.536 | |
| Pow. | 0.7308 | 5.816 | 0.8624 | 6.598 | 0.8944 | 6.927 | 0.9182 | 8.358 | |
| Deepening | Exp. | 0.863 | 6.394 | 0.787 | 4.934 | 0.913 | 7.727 | 0.936 | 9.604 |
| Log. | 0.848 | 5.984 | 0.890 | 7.572 | 0.916 | 7.883 | 0.935 | 9.466 | |
| Pow. | 0.846 | 5.937 | 0.872 | 6.889 | 0.893 | 6.889 | 0.896 | 7.275 | |
| df | 14 | 15 | 12 | 13 | |||||
| t(α) | 1.761 | 1.753 | 1.782 | 1.771 | |||||
| Volume | Expansion | Deepening | |||||||||||
|---|---|---|---|---|---|---|---|---|---|---|---|---|---|
| Pakaex | Permonex V19 | Pakaex | Permonex V19 | Pakaex | Permonex V19 | ||||||||
| Measured | Me.+ Vrc0 | Measured | Me.+ Vrc0 | Measured | Me.+ Dre0 | Measured | Me.+ Dre0 | Measured | Me.+Lre0 | Measured | Me.+ Lre0 | ||
| N | 16 | 17 | 14 | 15 | 16 | 17 | 14 | 15 | 16 | 17 | 14 | 15 | |
| Exponential | R2 | 0.78 | 0.80 | 0.82 | 0.83 | 0.74 | 0.70 | 0.75 | 0.76 | 0.77 | 0.77 | 0.71 | 0.70 |
| R2adj | 0.75 | 0.77 | 0.78 | 0.81 | 0.70 | 0.66 | 0.71 | 0.72 | 0.73 | 0.74 | 0.66 | 0.65 | |
| SS | 0.16 | 0.17 | 0.15 | 0.16 | 0.15 | 0.32 | 0.20 | 0.33 | 0.05 | 0.07 | 0.02 | 0.04 | |
| AIC | −69.35 | −74.12 | −59.37 | −63.95 | −70.45 | −63.56 | −55.42 | −53.34 | −88.58 | −89.59 | −90.24 | −85.83 | |
| AICC | −68.55 | −73.37 | −58.44 | −63.09 | −69.65 | −62.81 | −54.49 | −52.14 | −87.78 | −88.84 | −89.32 | −84.97 | |
| Logarithmic | R2 | 0.72 | 0.78 | 0.84 | 0.87 | 0.77 | 0.80 | 0.81 | 0.87 | 0.69 | 0.80 | 0.70 | 0.79 |
| R2adj | 0.67 | 0.74 | 0.81 | 0.84 | 0.74 | 0.77 | 0.77 | 0.84 | 0.64 | 0.77 | 0.64 | 0.76 | |
| SS | 0.21 | 0.19 | 0.13 | 0.13 | 0.13 | 0.22 | 0.16 | 0.18 | 0.07 | 0.06 | 0.02 | 0.03 | |
| AIC | −69.05 | −72.10 | −61.22 | −66.98 | −72.78 | −70.13 | −58.93 | −62.01 | −83.95 | −91.55 | −89.58 | −91.42 | |
| AICC | −68.25 | −71.35 | −60.30 | −66.13 | −71.98 | −69.38 | −58.01 | −61.16 | −83.15 | −90.80 | −88.66 | −90.57 | |
| Power | R2 | 0.77 | 0.80 | 0.87 | 0.89 | 0.78 | 0.86 | 0.81 | 0.87 | 0.72 | 0.80 | 0.71 | 0.85 |
| R2adj | 0.74 | 0.77 | 0.85 | 0.87 | 0.74 | 0.84 | 0.77 | 0.85 | 0.68 | 0.78 | 0.66 | 0.83 | |
| SS | 0.17 | 0.17 | 0.11 | 0.11 | 0.13 | 0.15 | 0.16 | 0.17 | 0.06 | 0.06 | 0.02 | 0.02 | |
| AIC | −68.70 | −74.28 | −64.26 | −70.17 | −72.92 | −76.67 | −59.01 | −62.97 | −85.92 | −92.13 | −90.32 | −96.80 | |
| AICC | −67.90 | −73.53 | −63.34 | −69.32 | 72.12 | −75.92 | −58.09 | −62.12 | −85.12 | −91.38 | −89.41 | −95.94 | |
© 2019 by the authors. Licensee MDPI, Basel, Switzerland. This article is an open access article distributed under the terms and conditions of the Creative Commons Attribution (CC BY) license (http://creativecommons.org/licenses/by/4.0/).
Share and Cite
Težak, D.; Stanković, S.; Kovač, I. Dependence Models of Borehole Expansion on Explosive Charge in Spherical Cavity Blasting. Geosciences 2019, 9, 383. https://doi.org/10.3390/geosciences9090383
Težak D, Stanković S, Kovač I. Dependence Models of Borehole Expansion on Explosive Charge in Spherical Cavity Blasting. Geosciences. 2019; 9(9):383. https://doi.org/10.3390/geosciences9090383
Chicago/Turabian StyleTežak, Denis, Siniša Stanković, and Ivan Kovač. 2019. "Dependence Models of Borehole Expansion on Explosive Charge in Spherical Cavity Blasting" Geosciences 9, no. 9: 383. https://doi.org/10.3390/geosciences9090383
APA StyleTežak, D., Stanković, S., & Kovač, I. (2019). Dependence Models of Borehole Expansion on Explosive Charge in Spherical Cavity Blasting. Geosciences, 9(9), 383. https://doi.org/10.3390/geosciences9090383