Estimating Tsunami Economic Losses of Okinawa Island with Multi-Regional-Input-Output Modeling
Abstract
1. Introduction
1.1. Tsunami Model
1.2. Economic Model
1.3. Objective of this Study
2. Materials and Methods
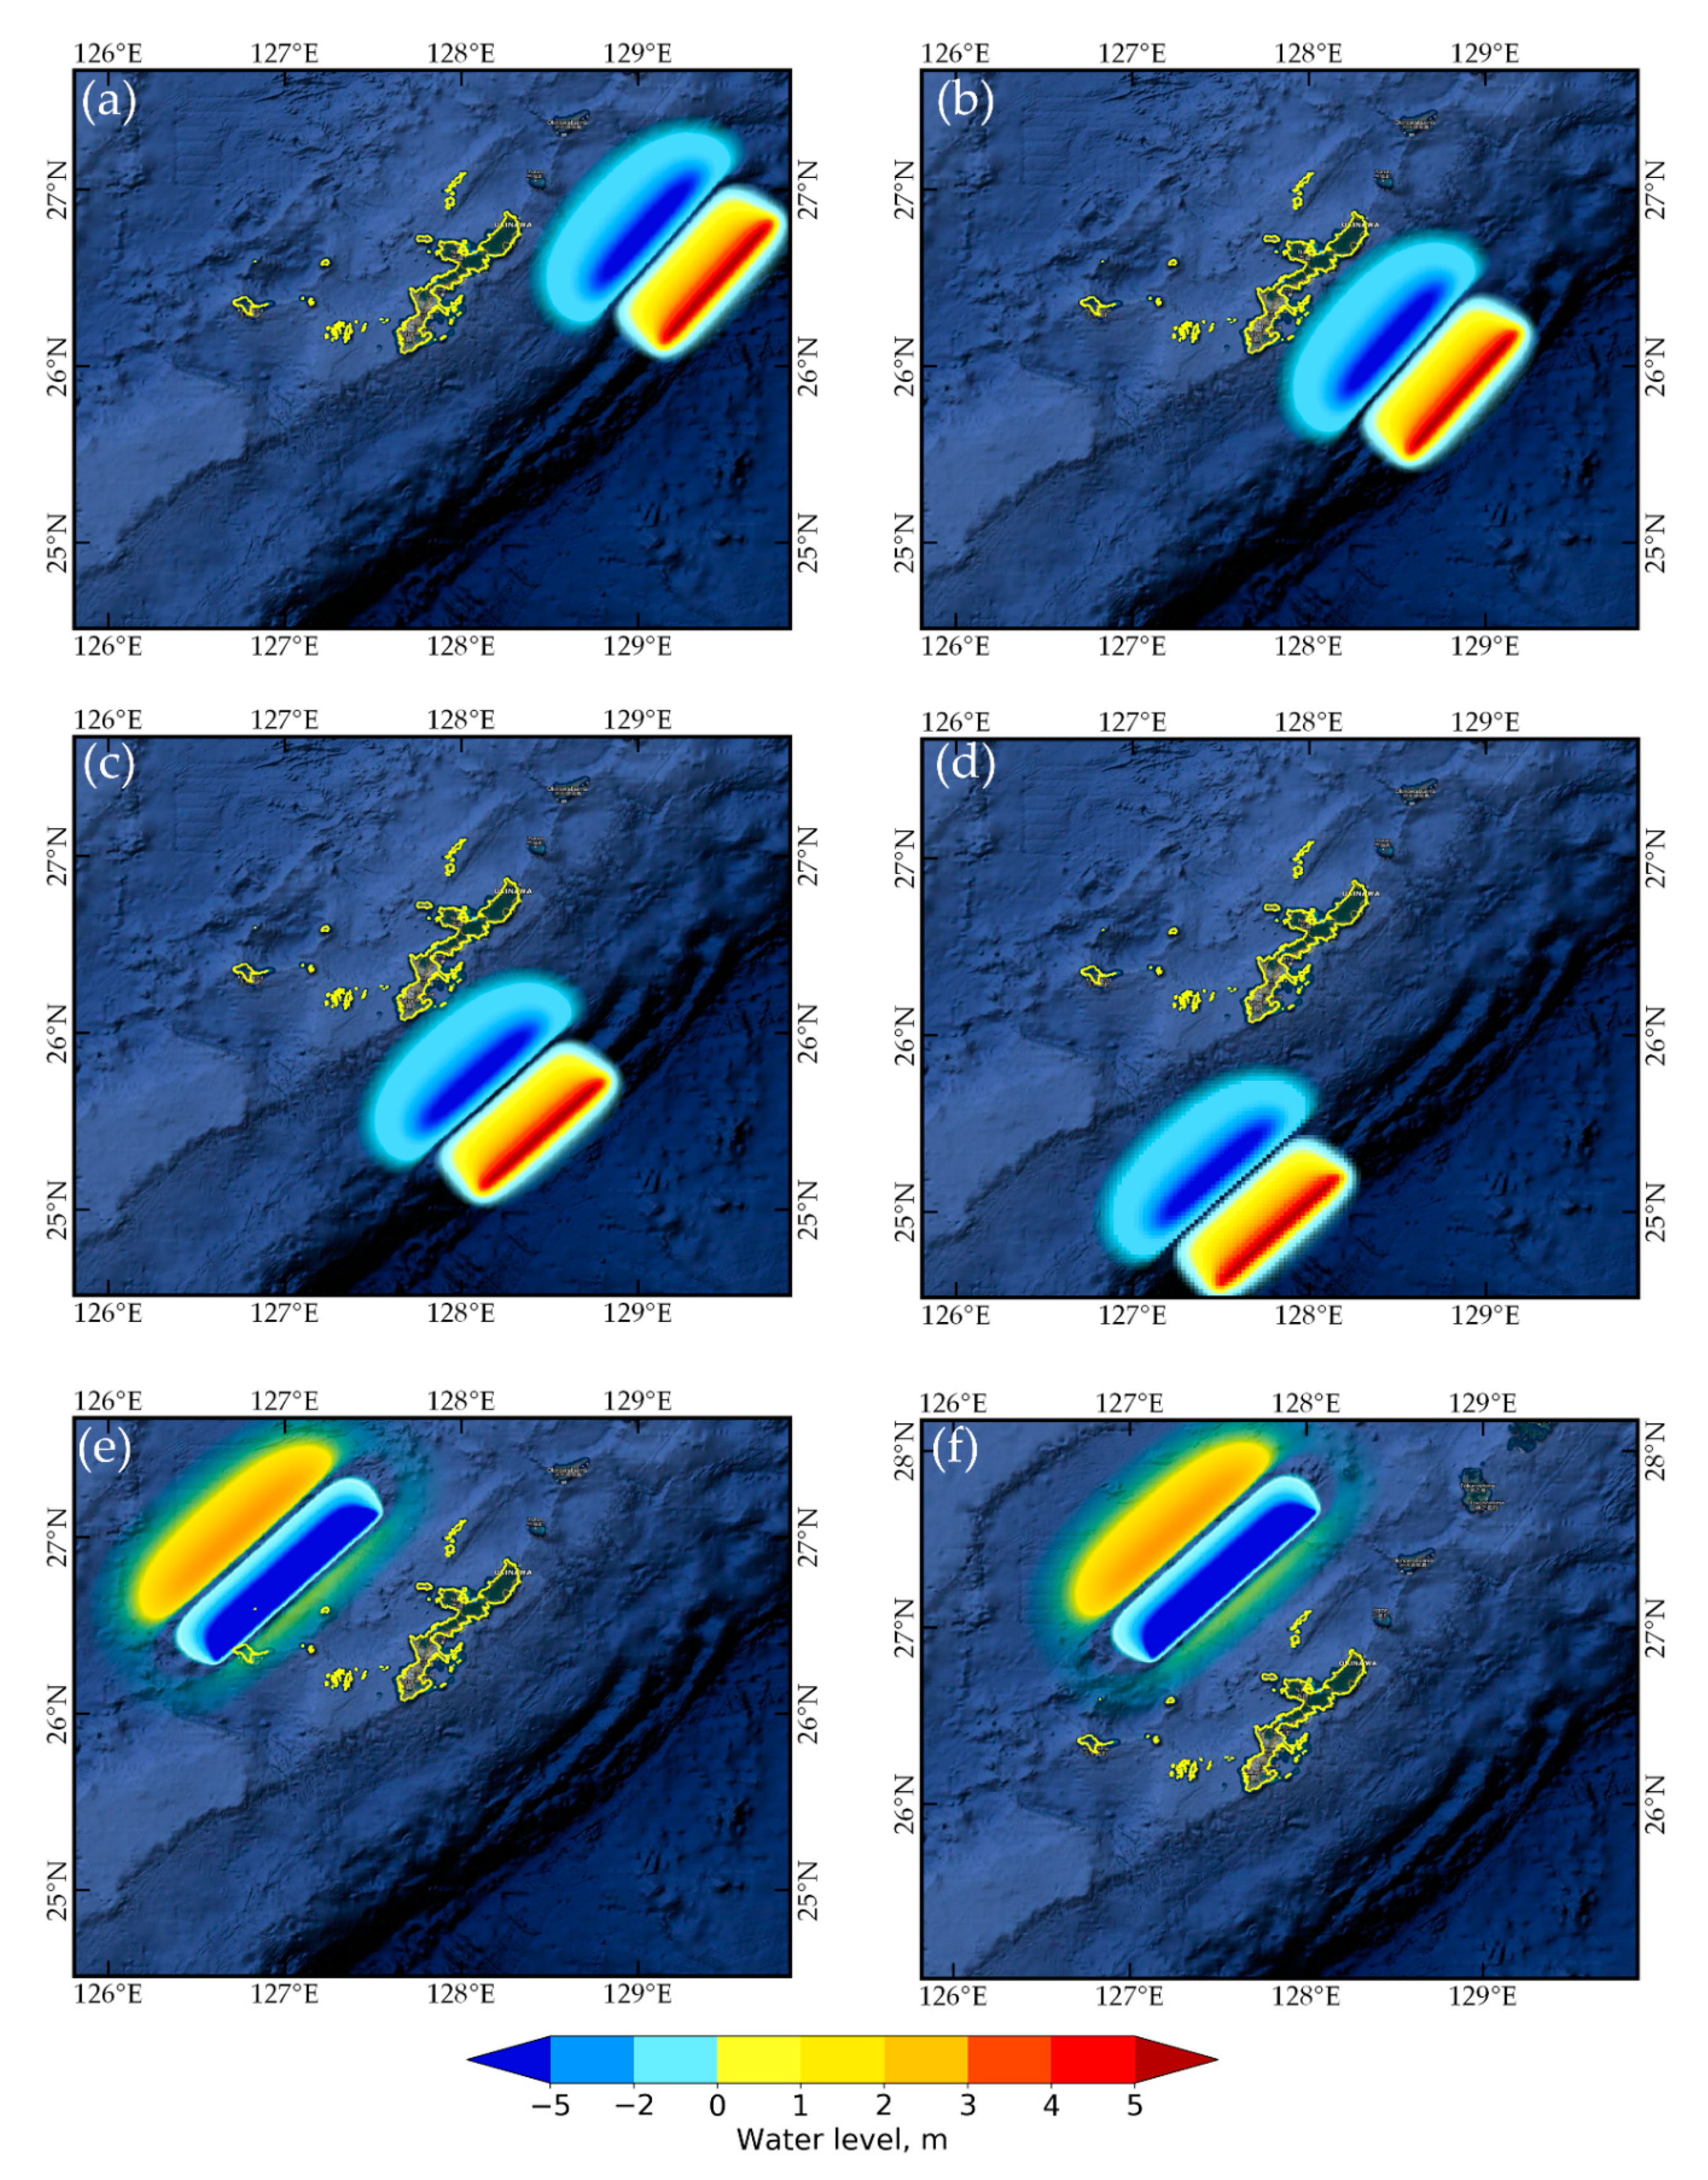
2.1. Tsunami Source Model from Earthquake Fault Scenario
2.2. Tsunami Modeling
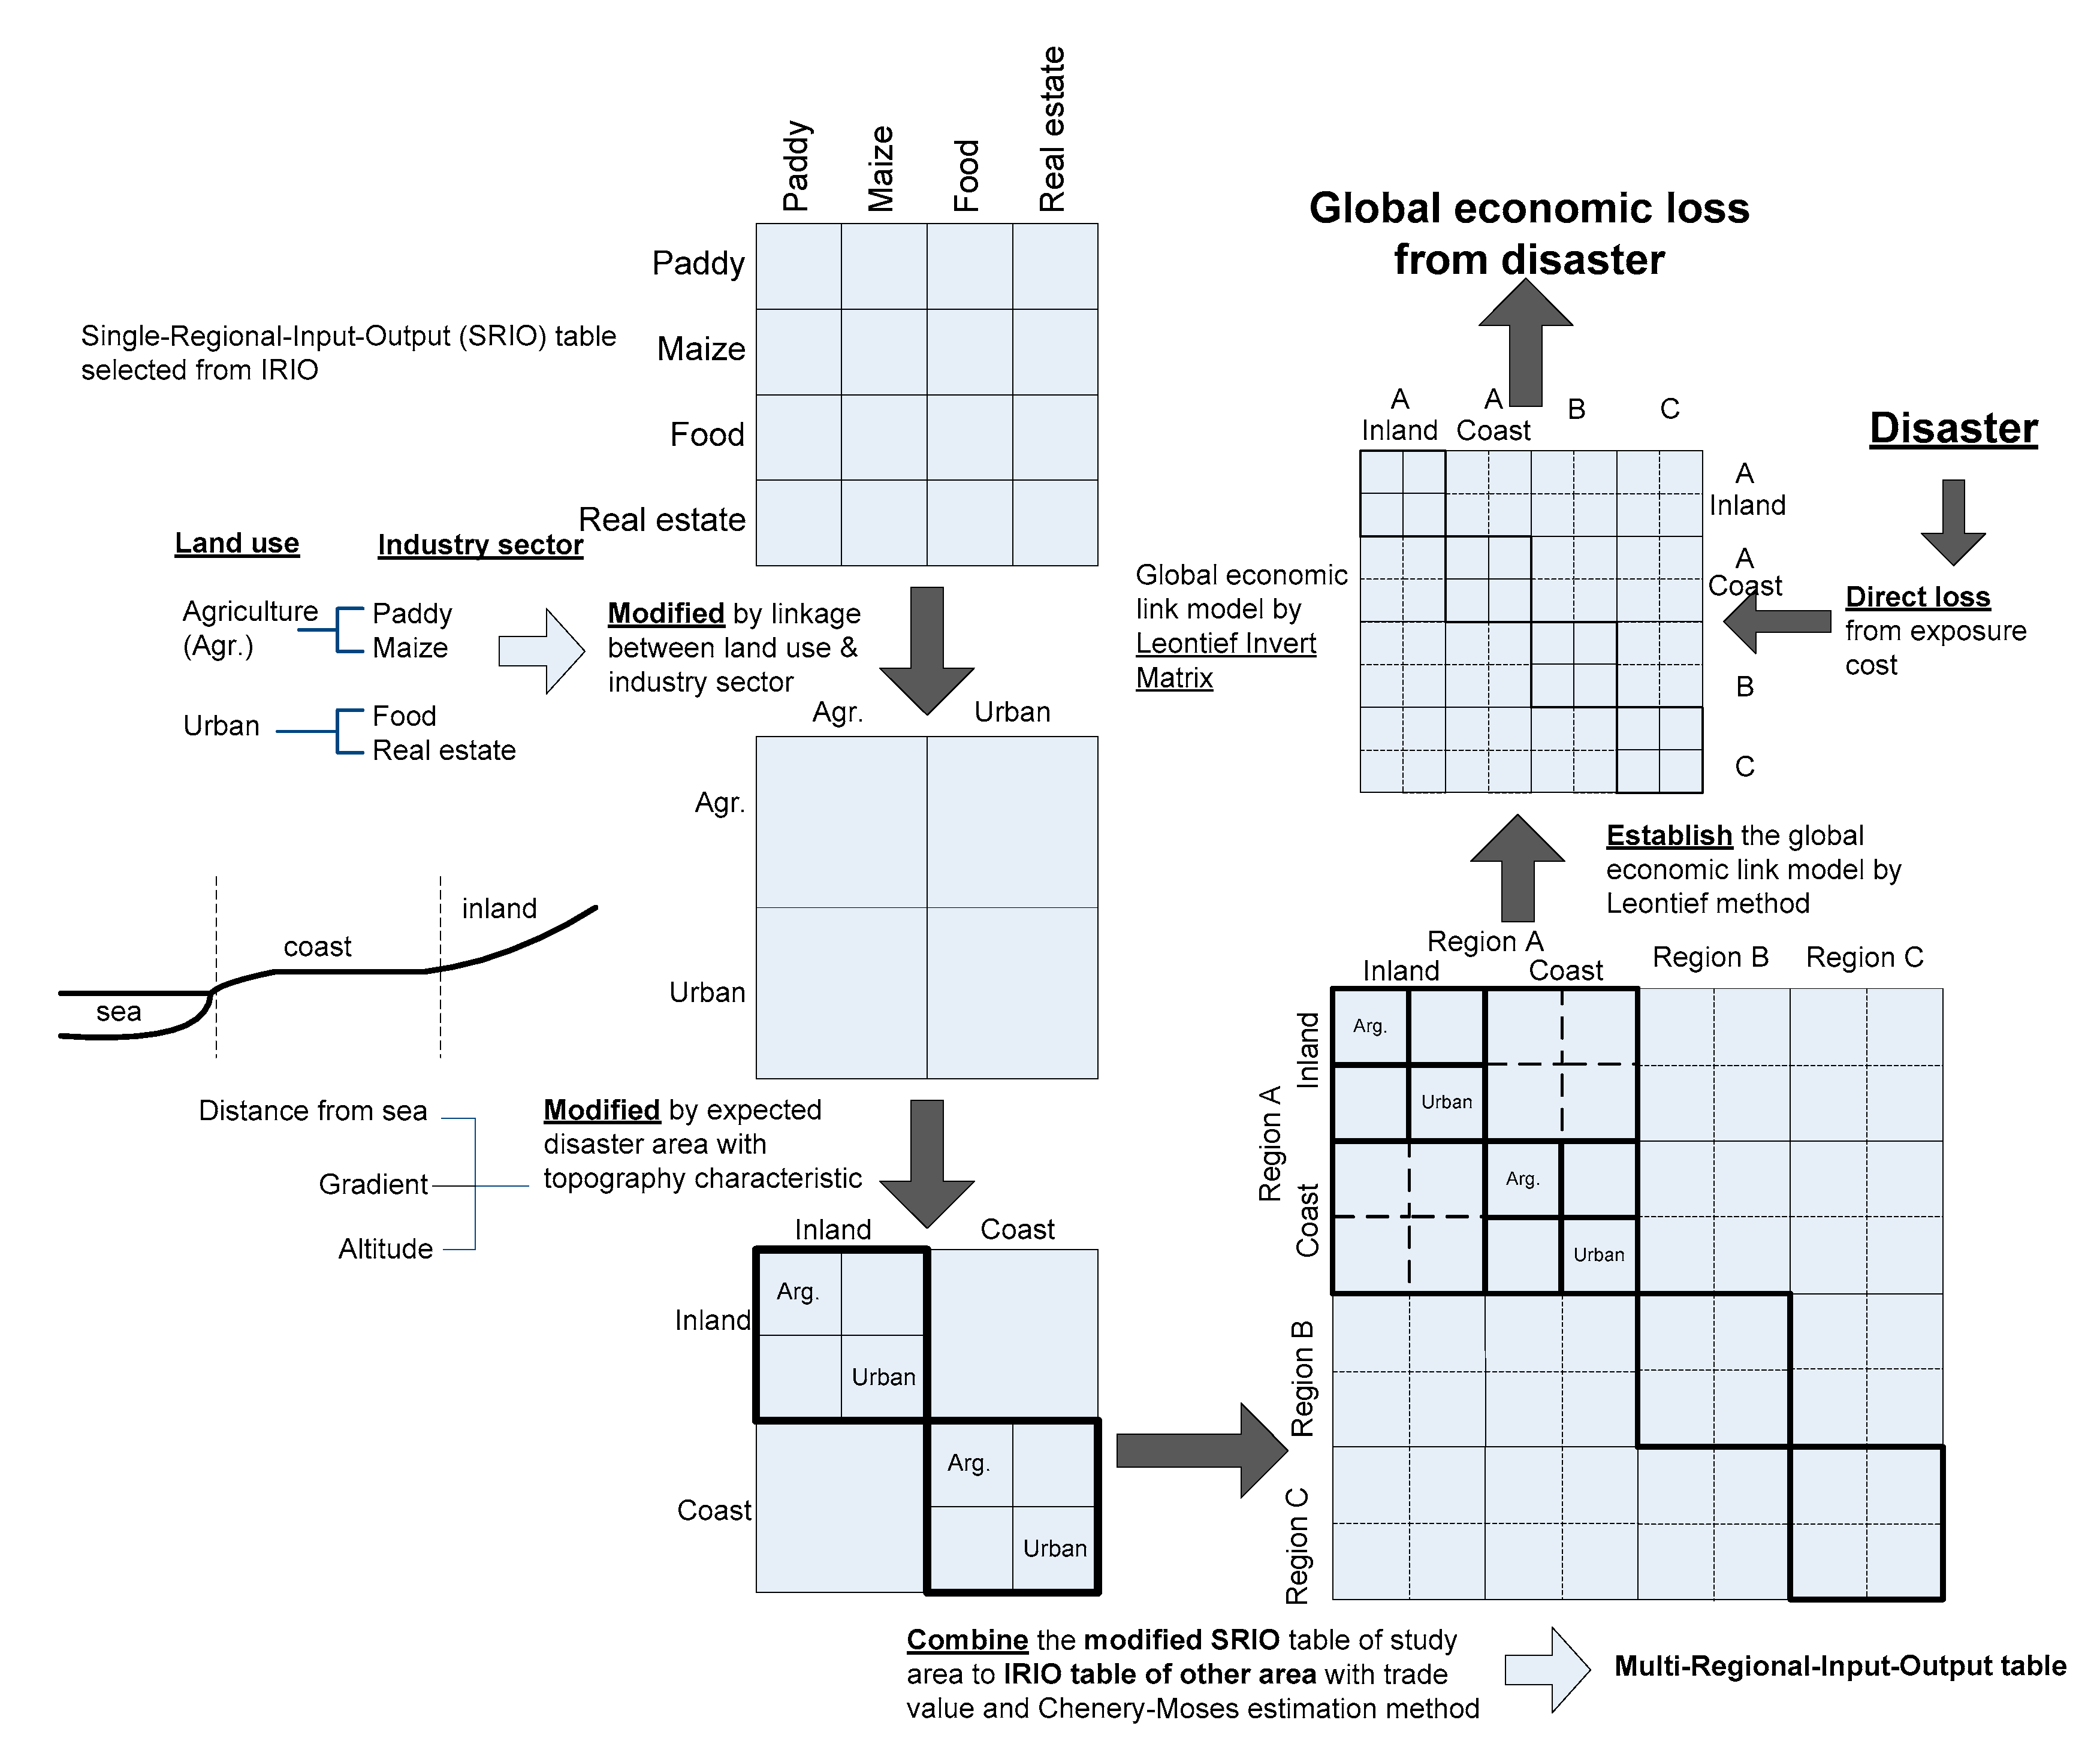
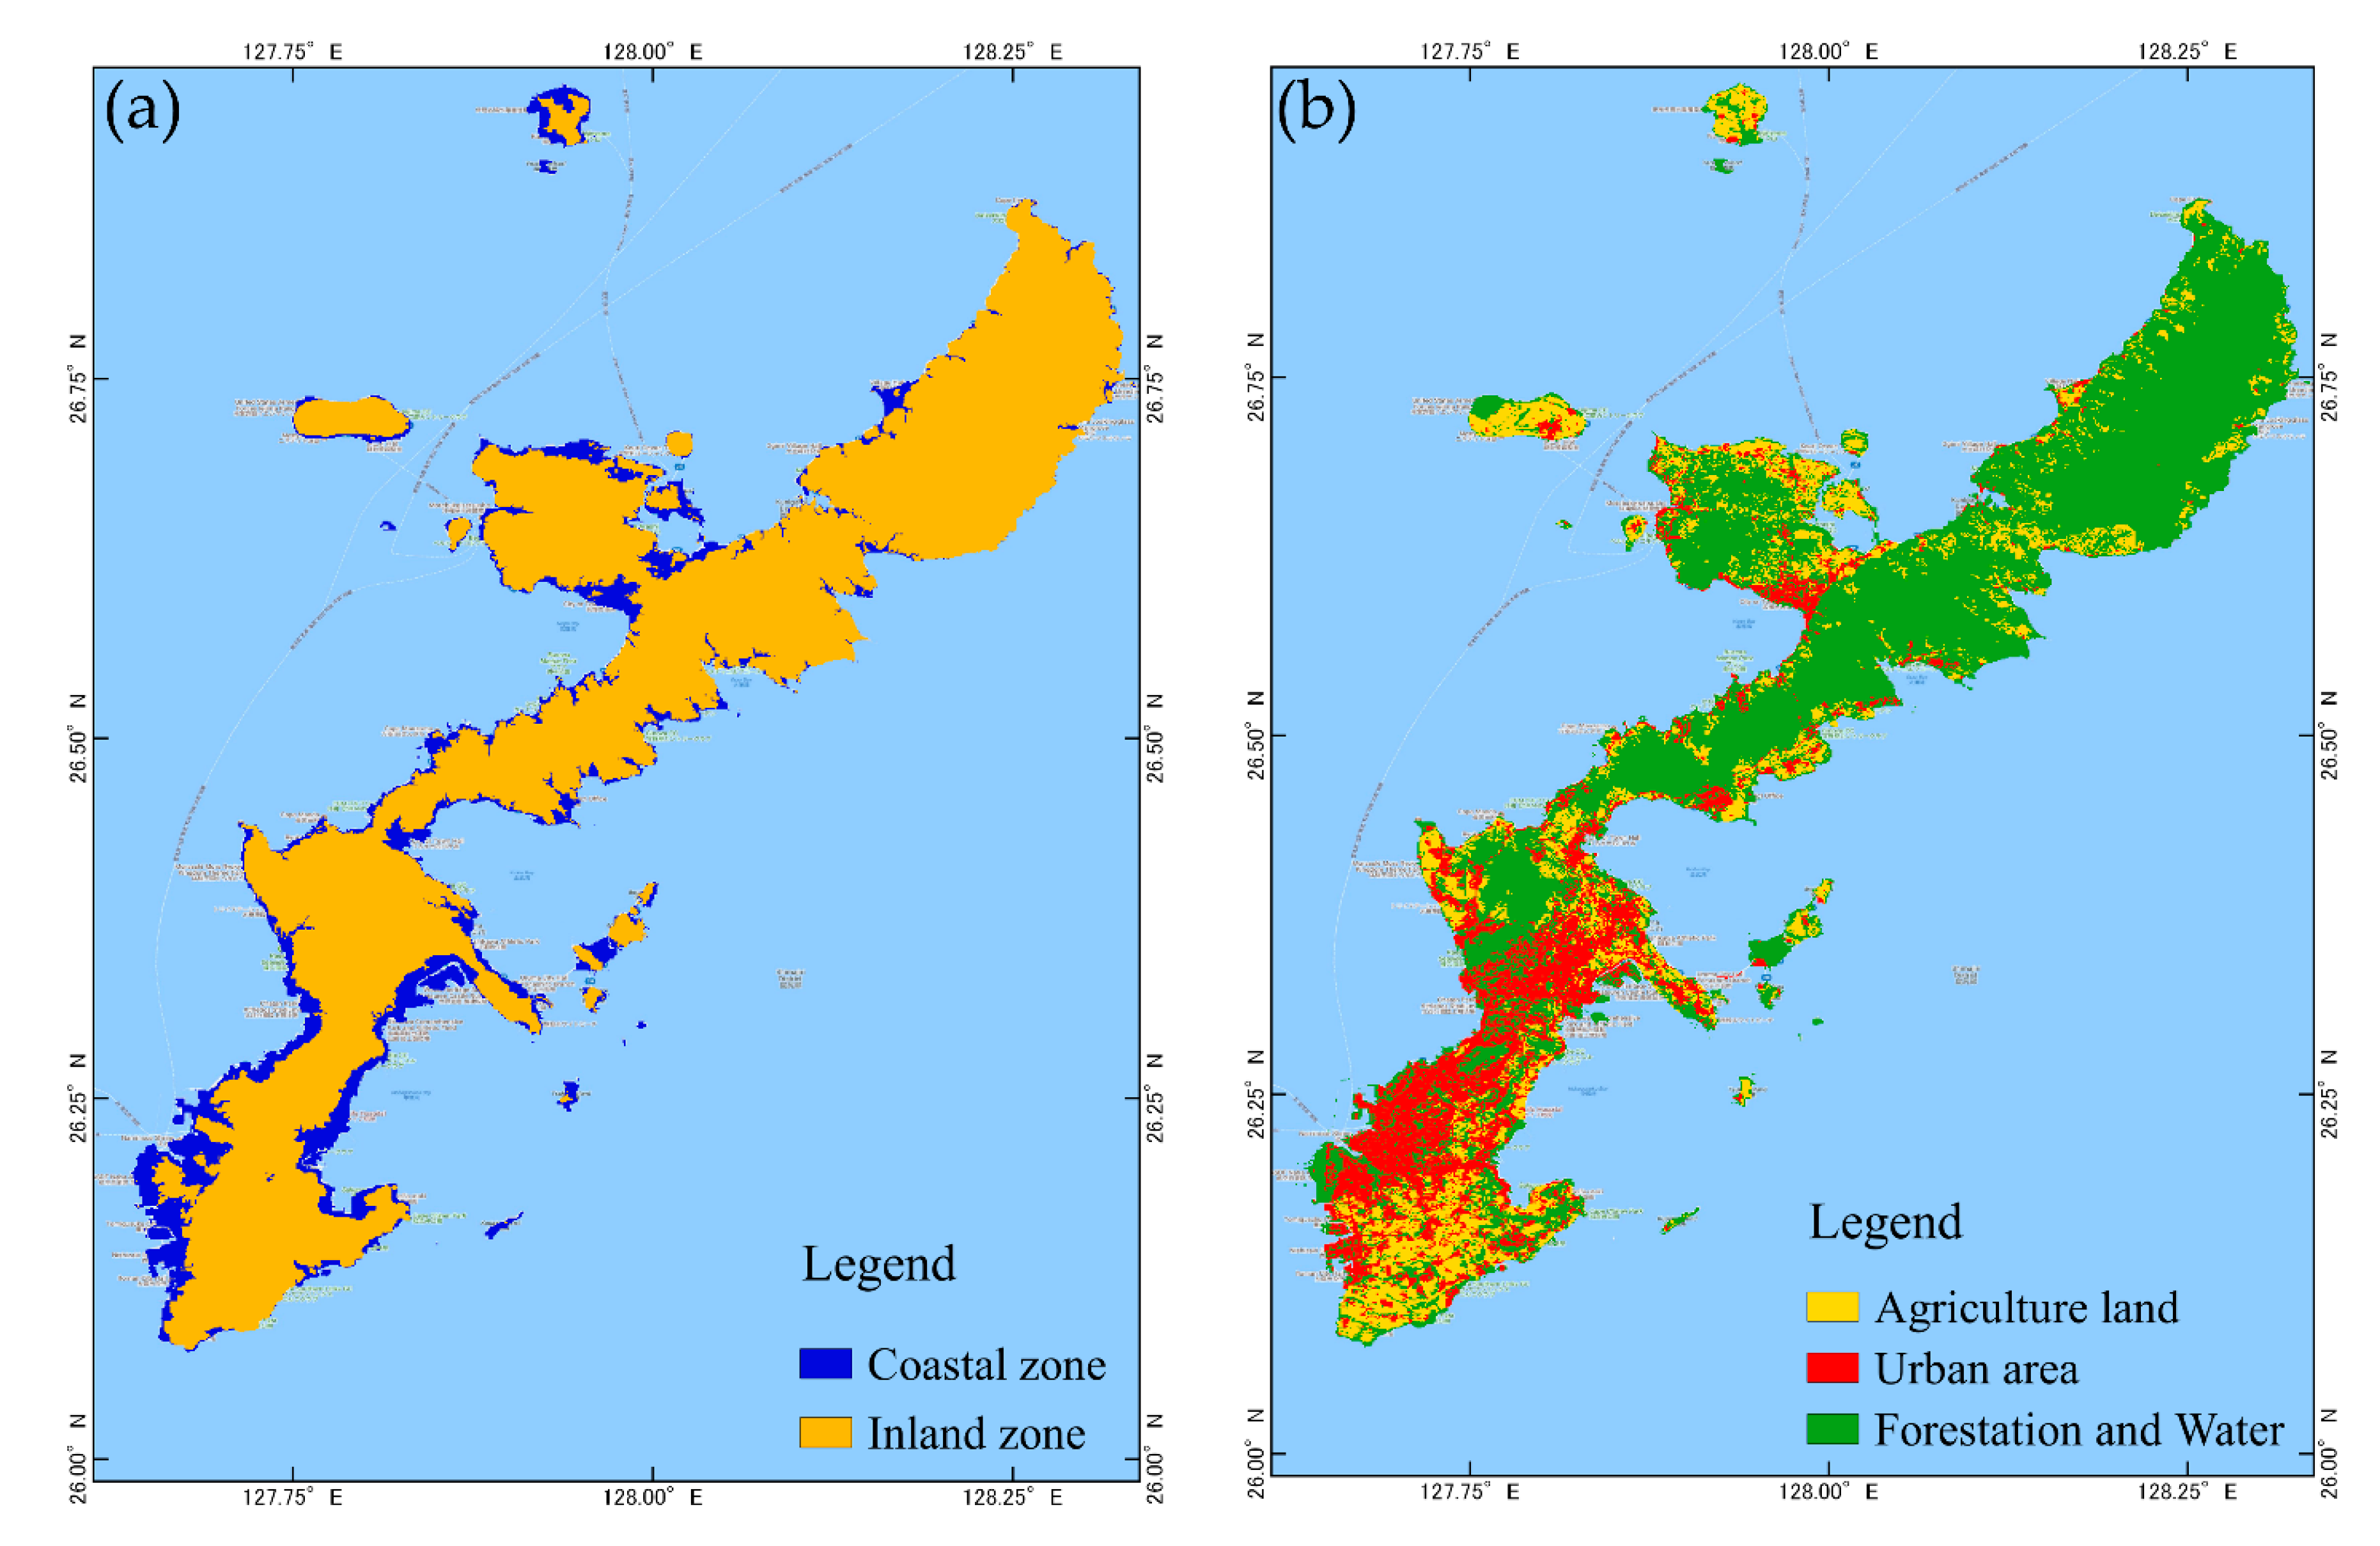
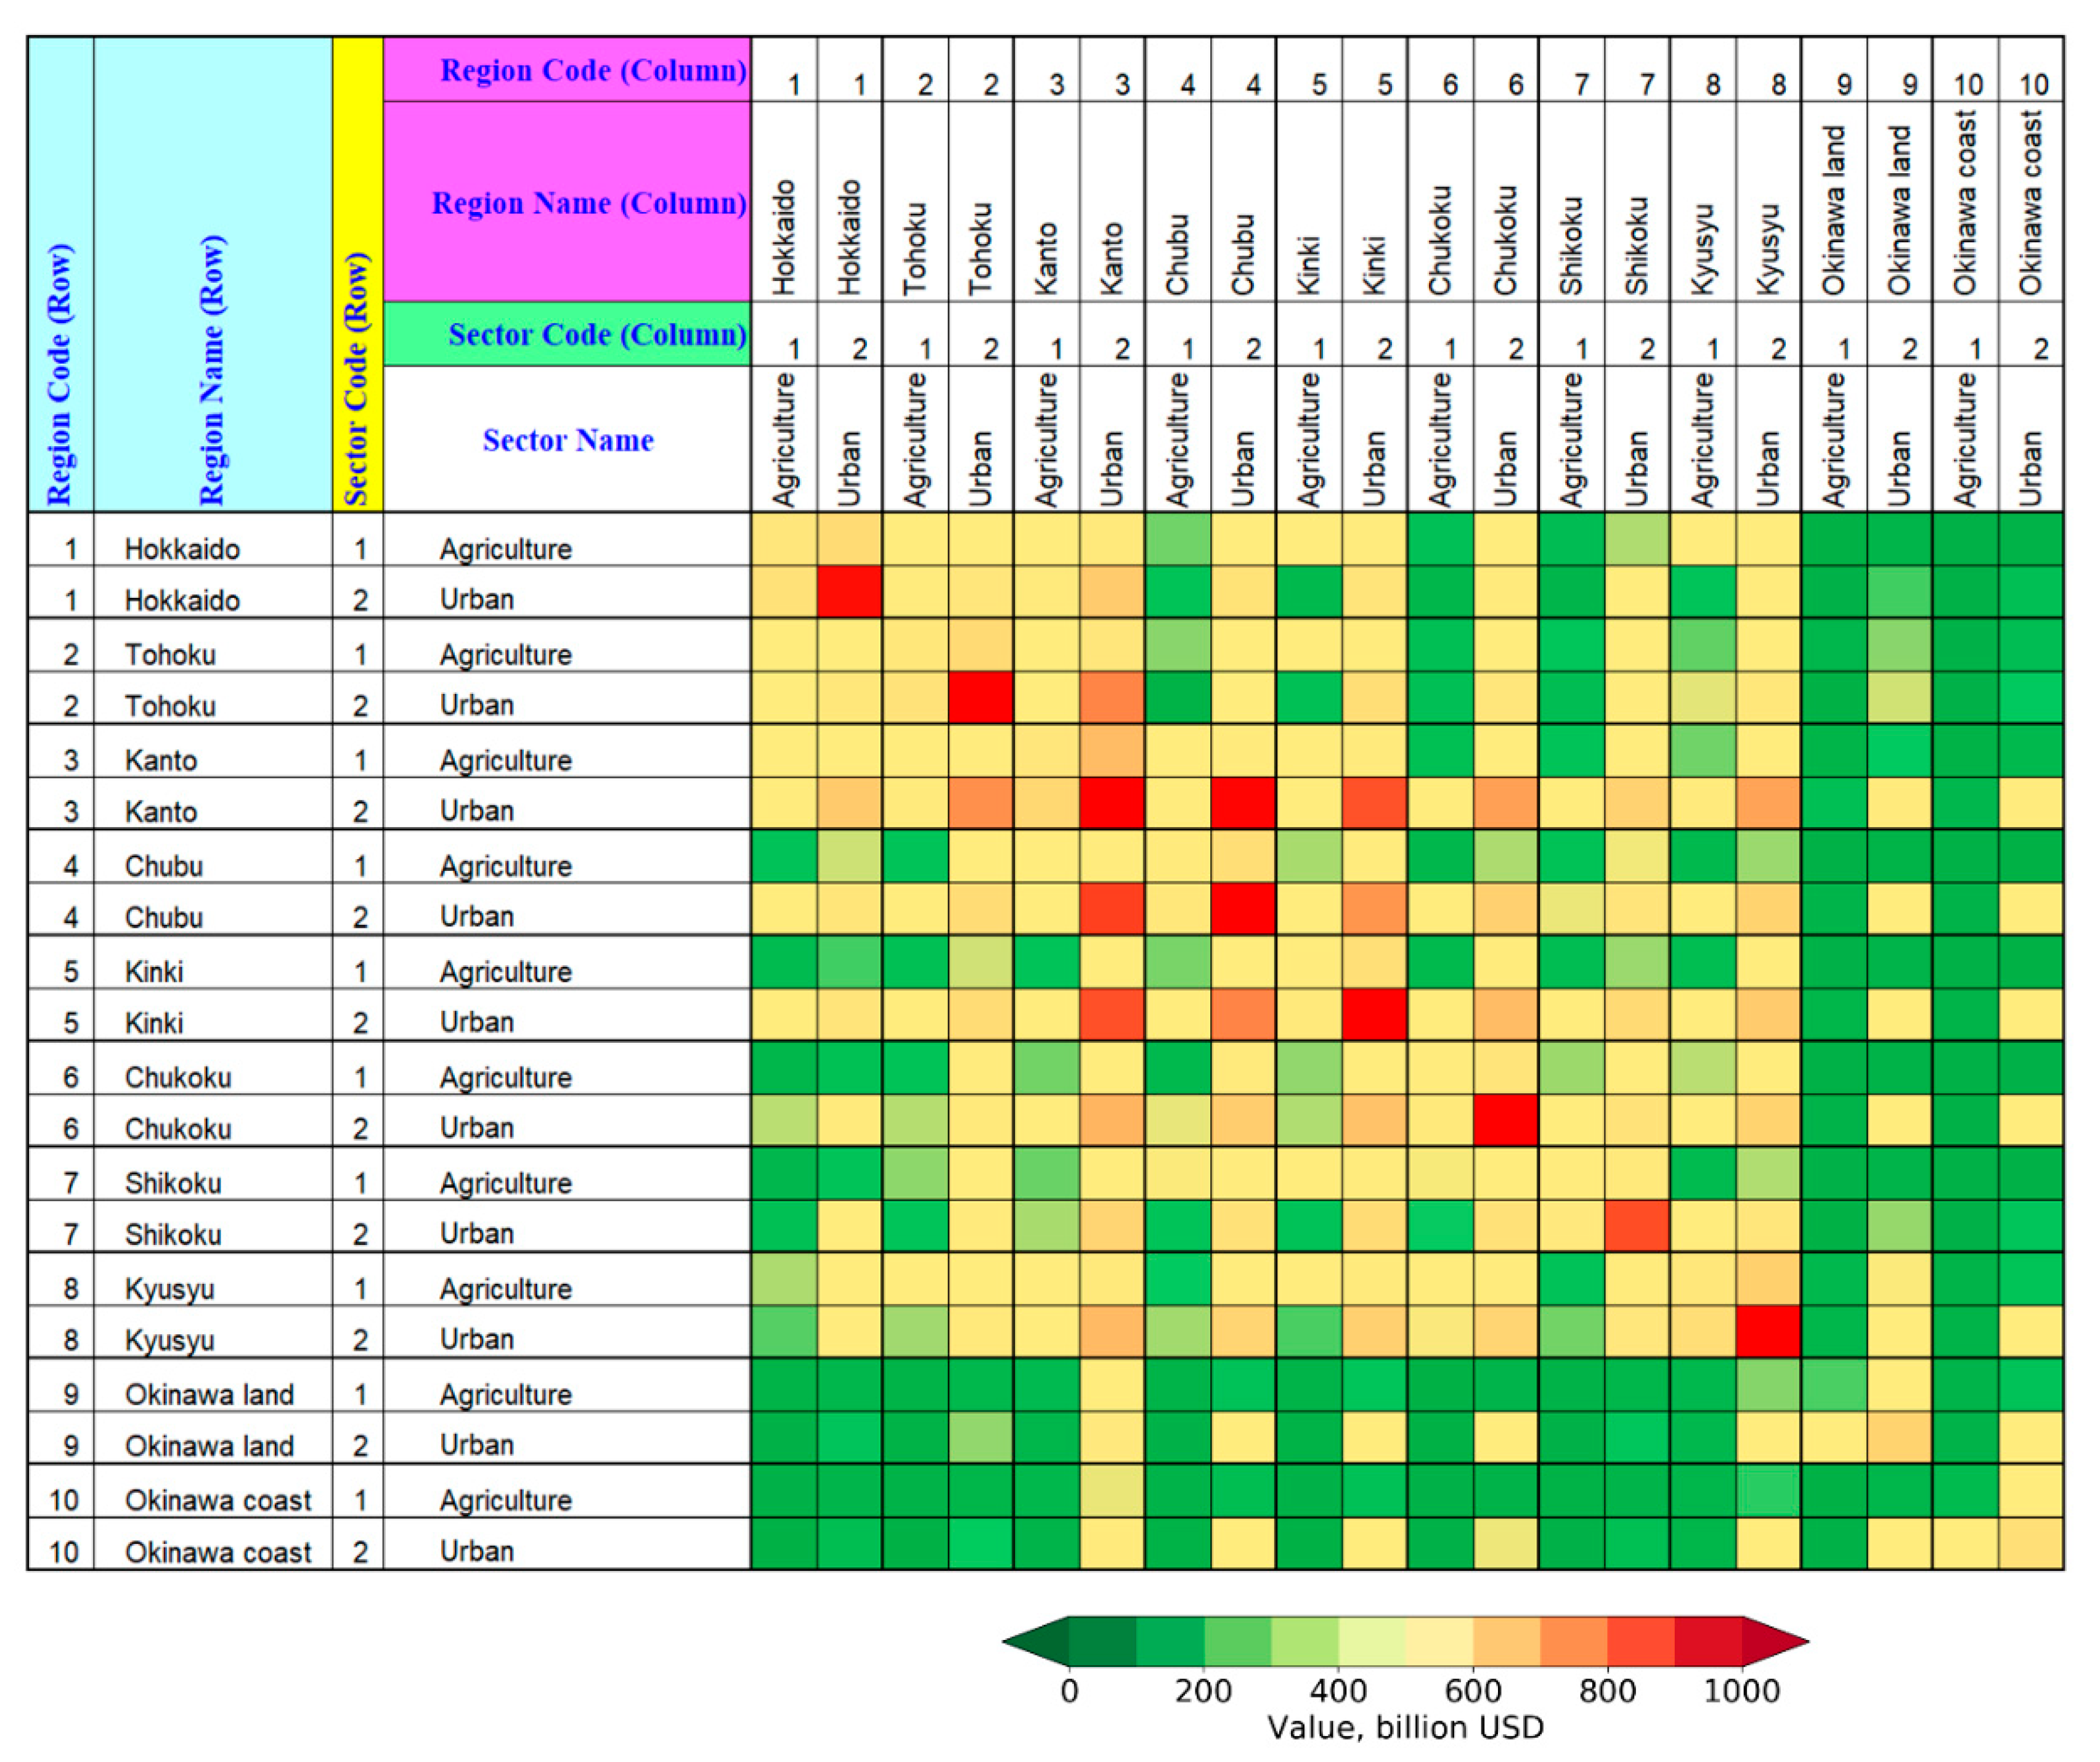
2.3. Multi-Regional-Input-Output Table
3. Results and Discussion
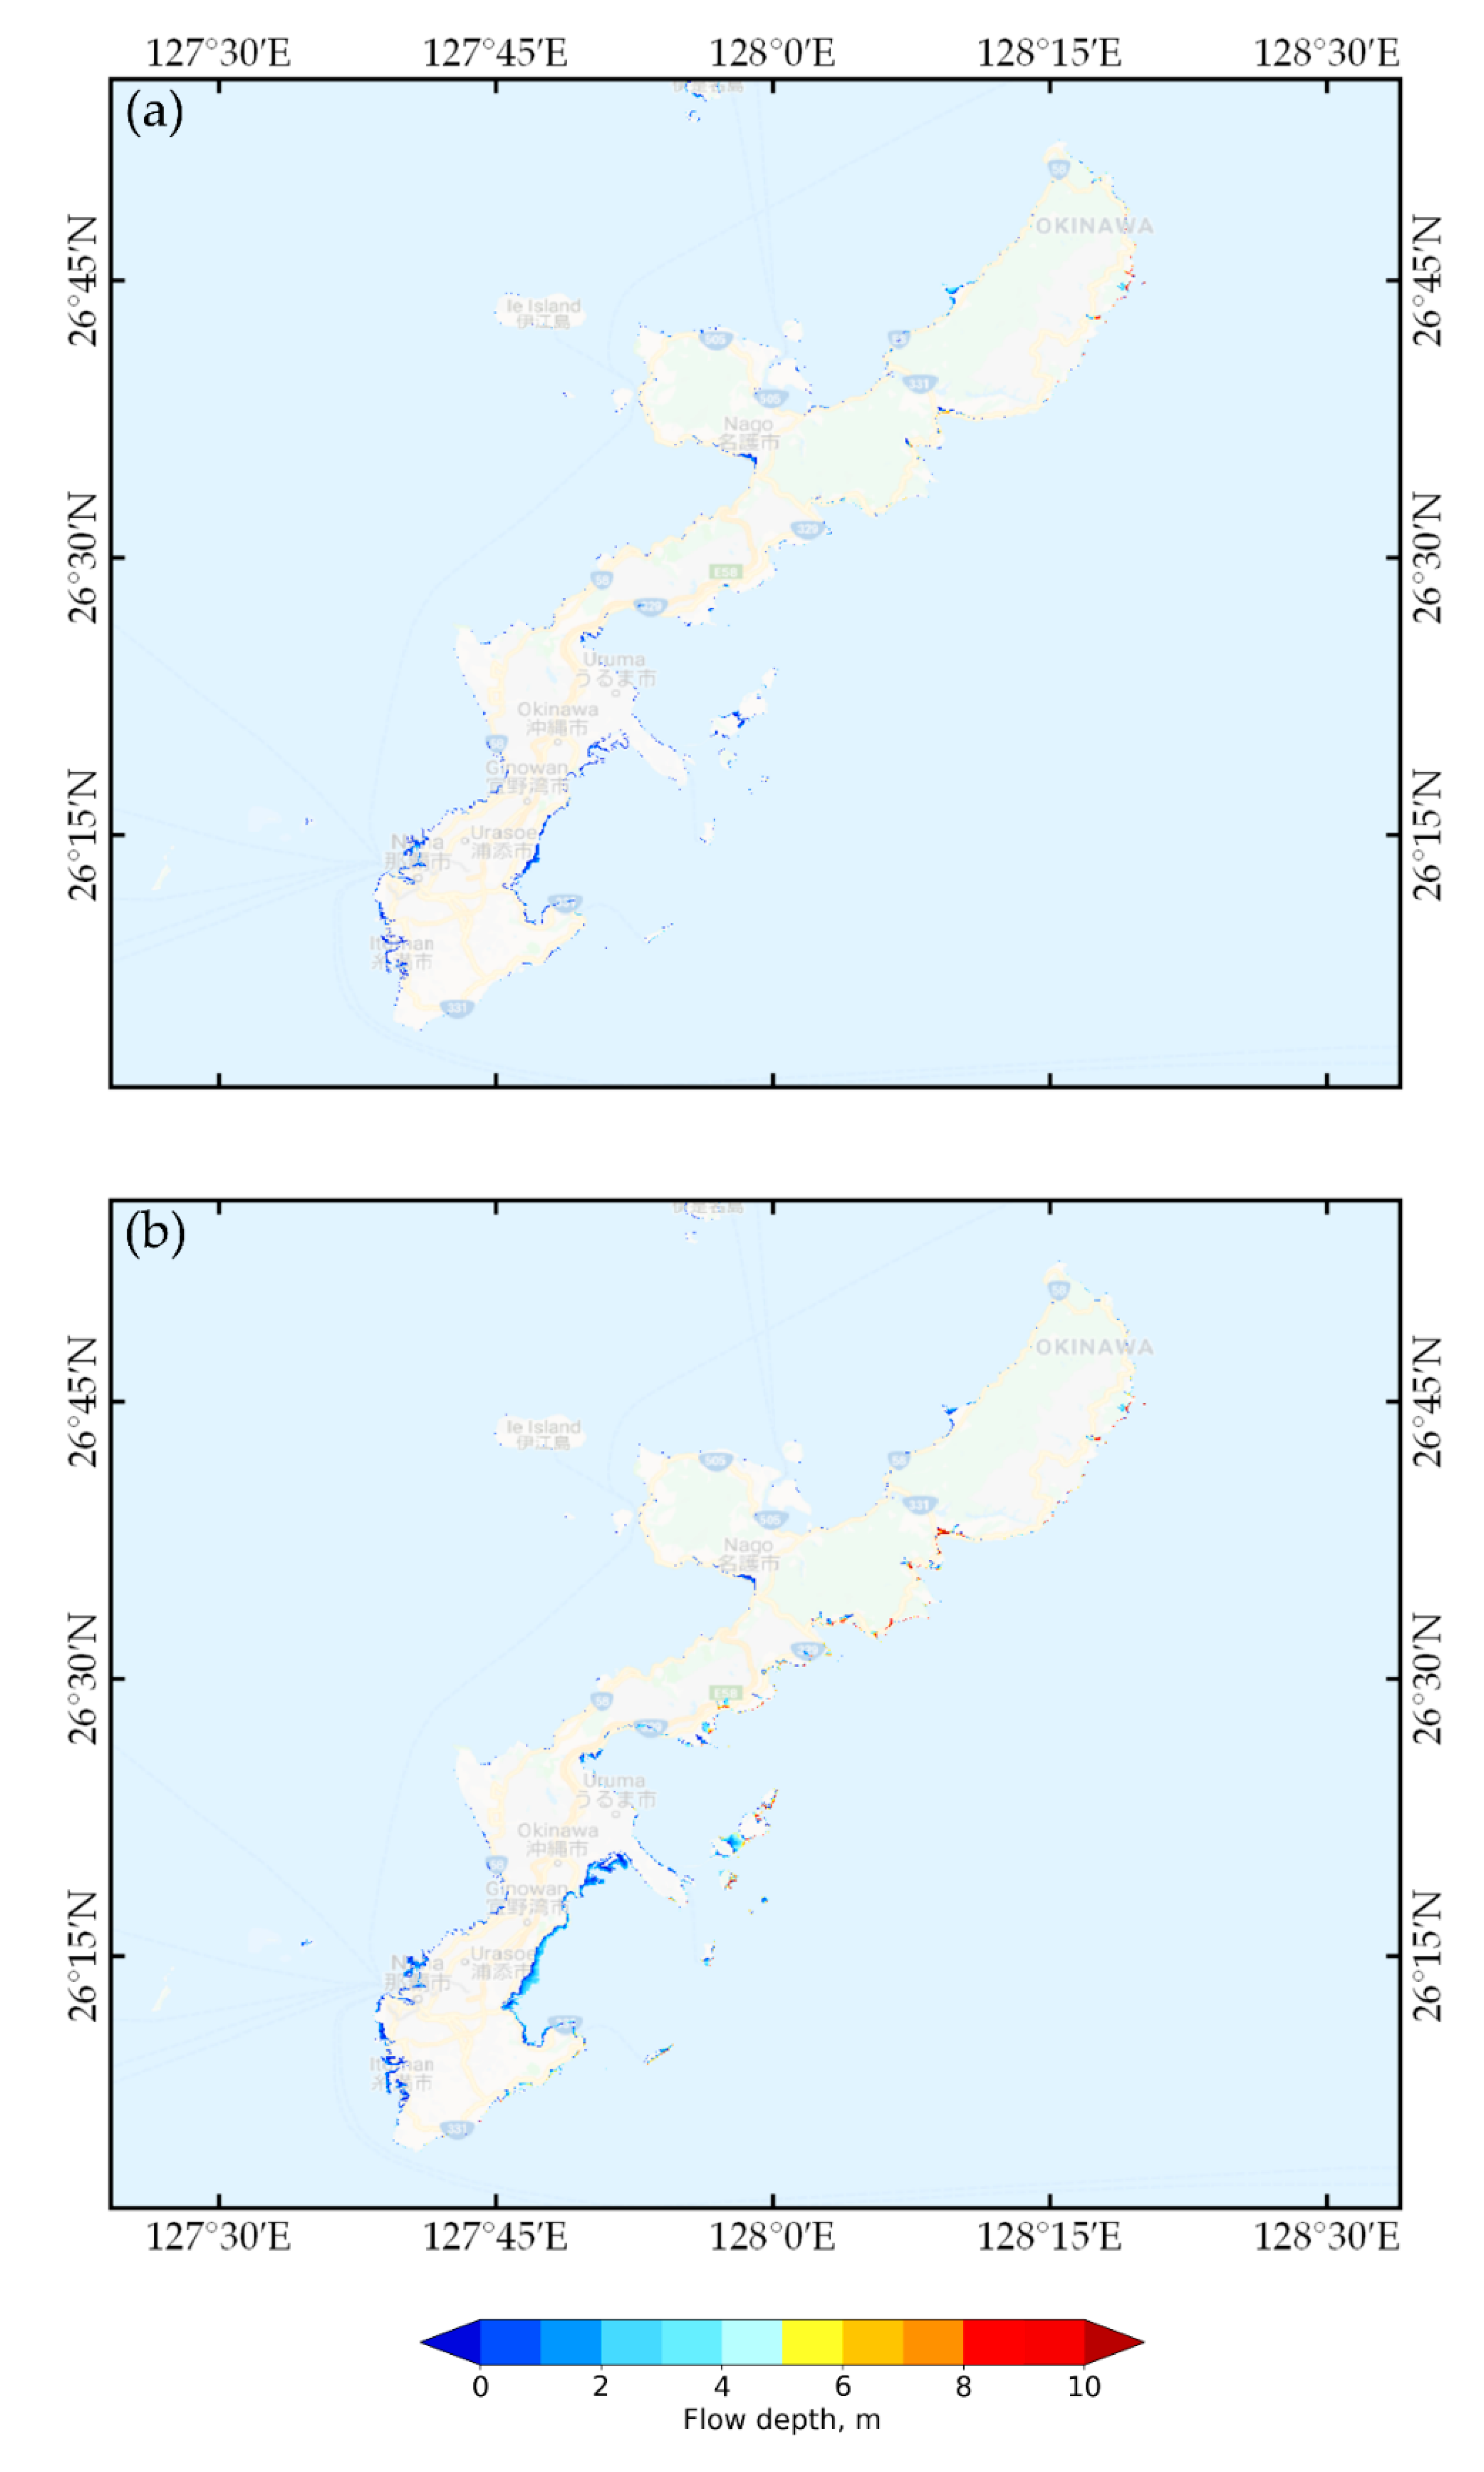
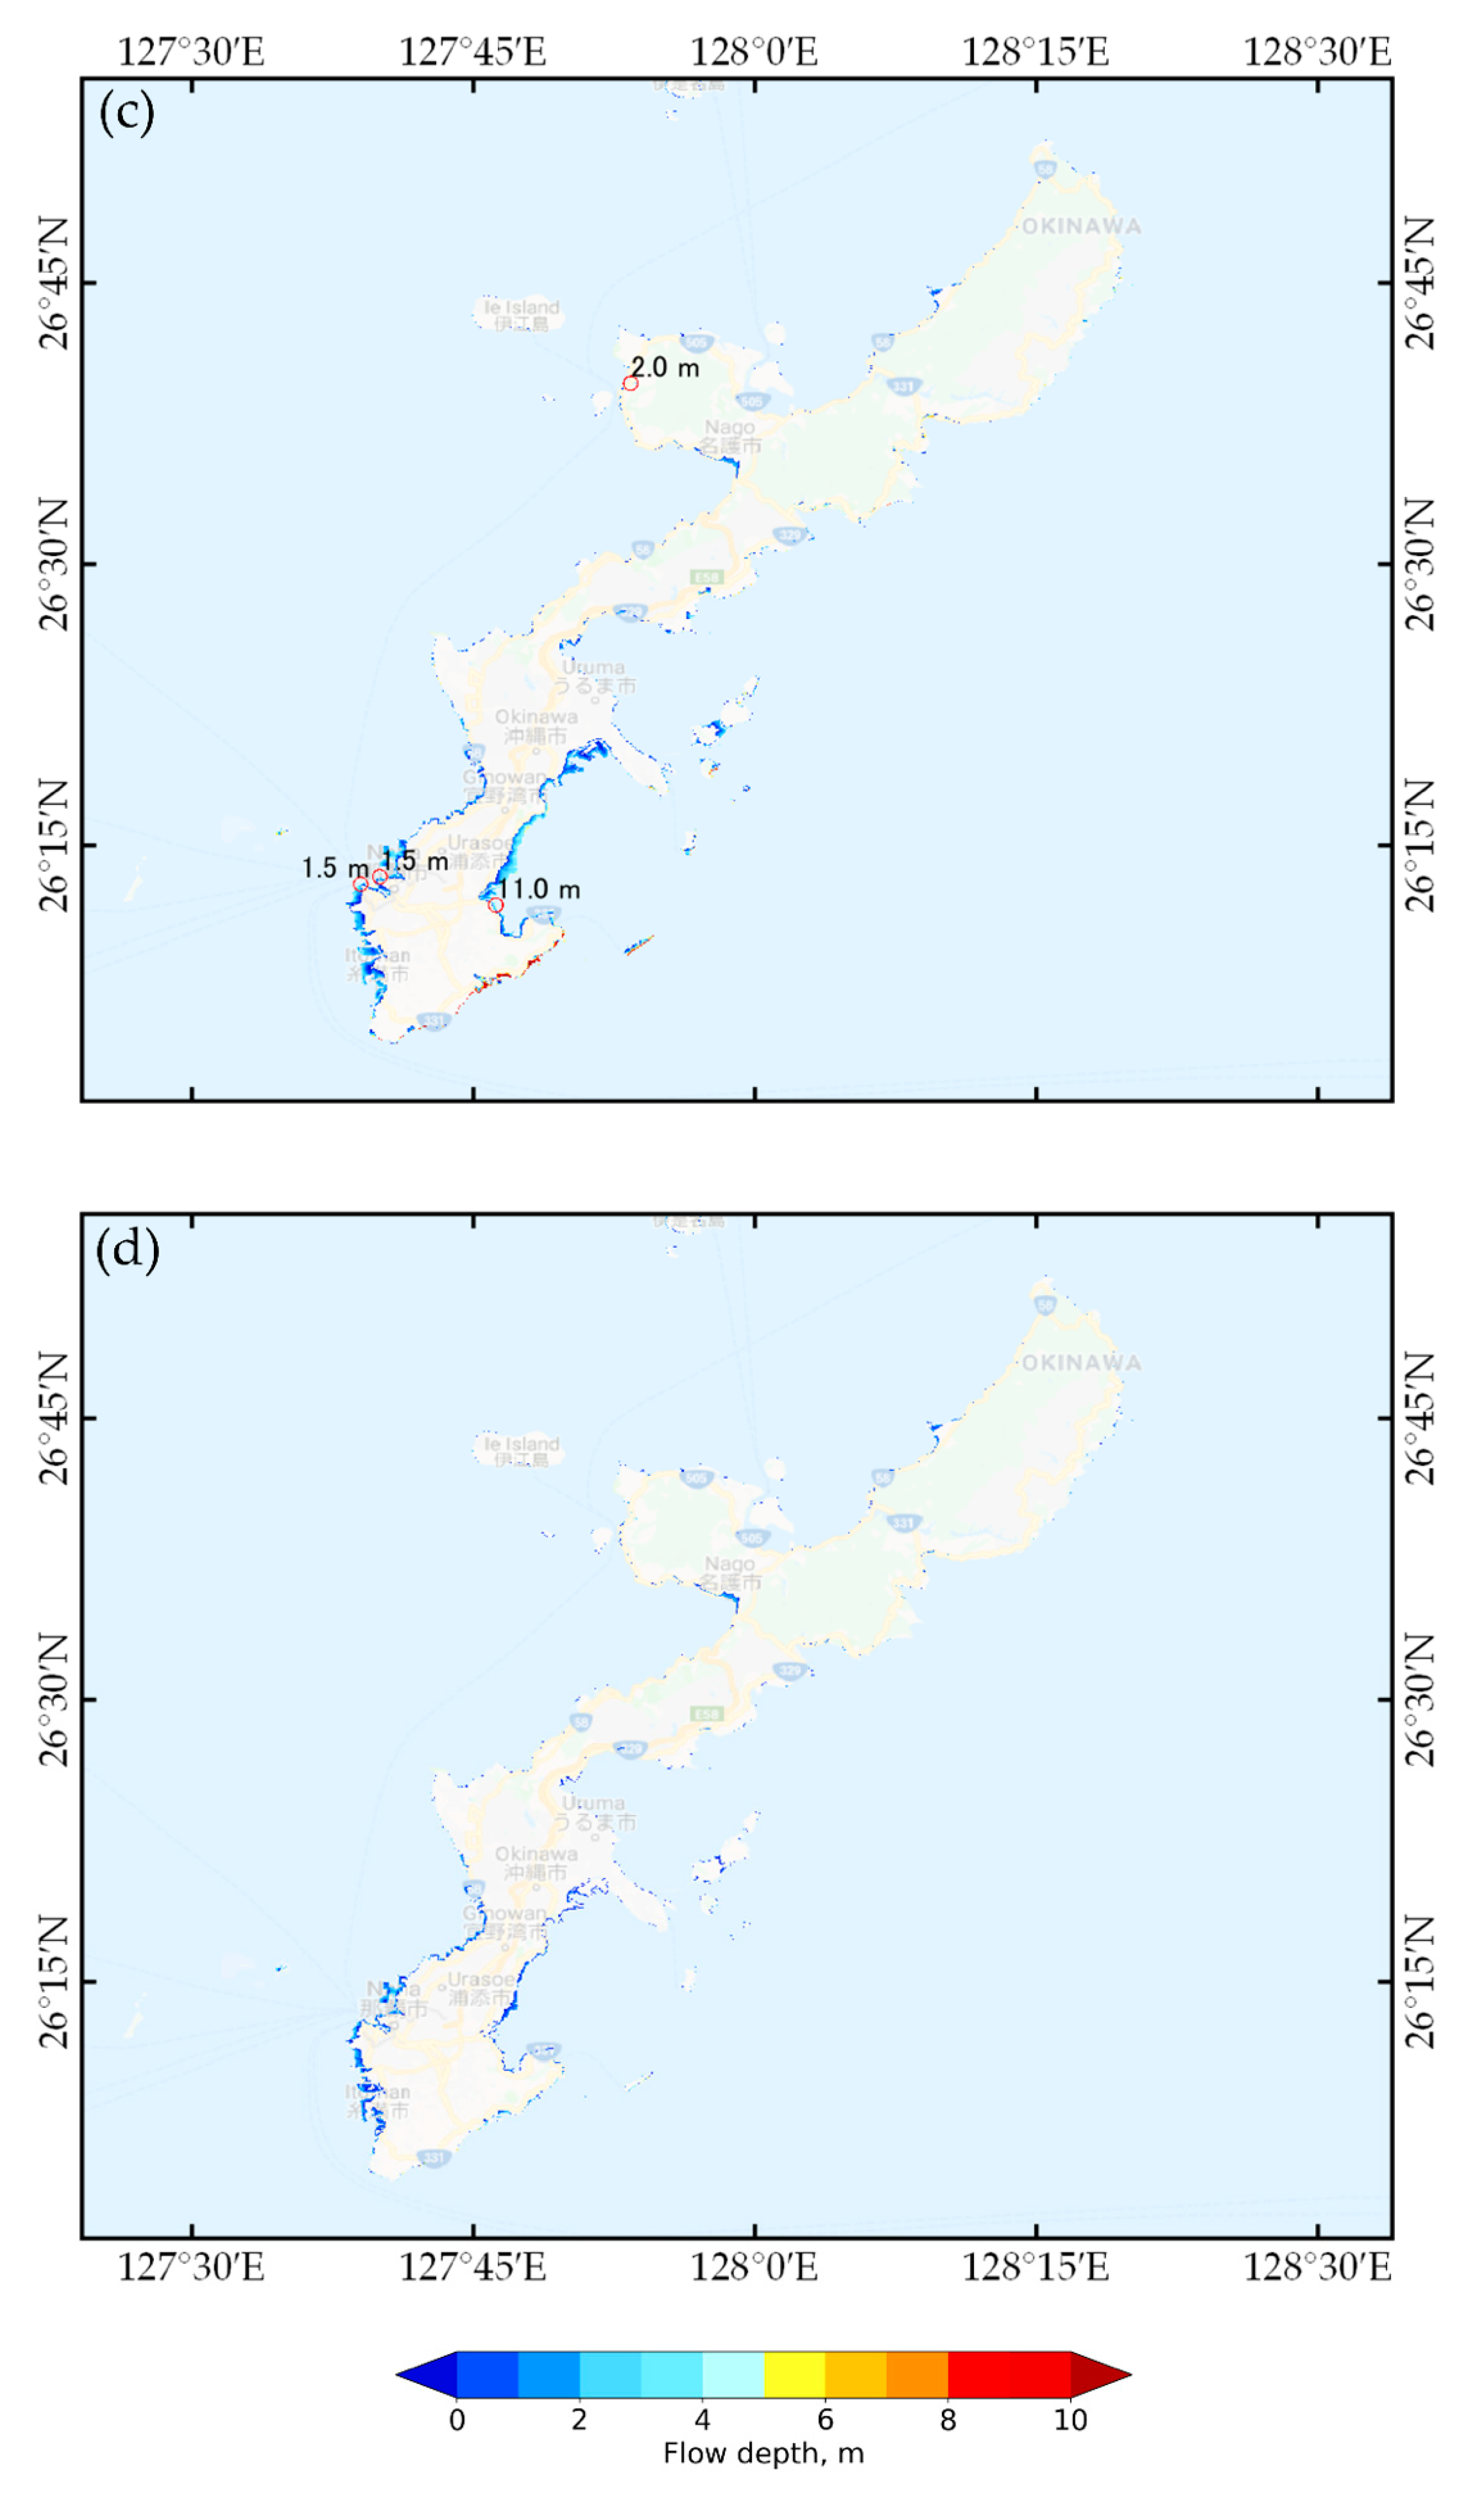
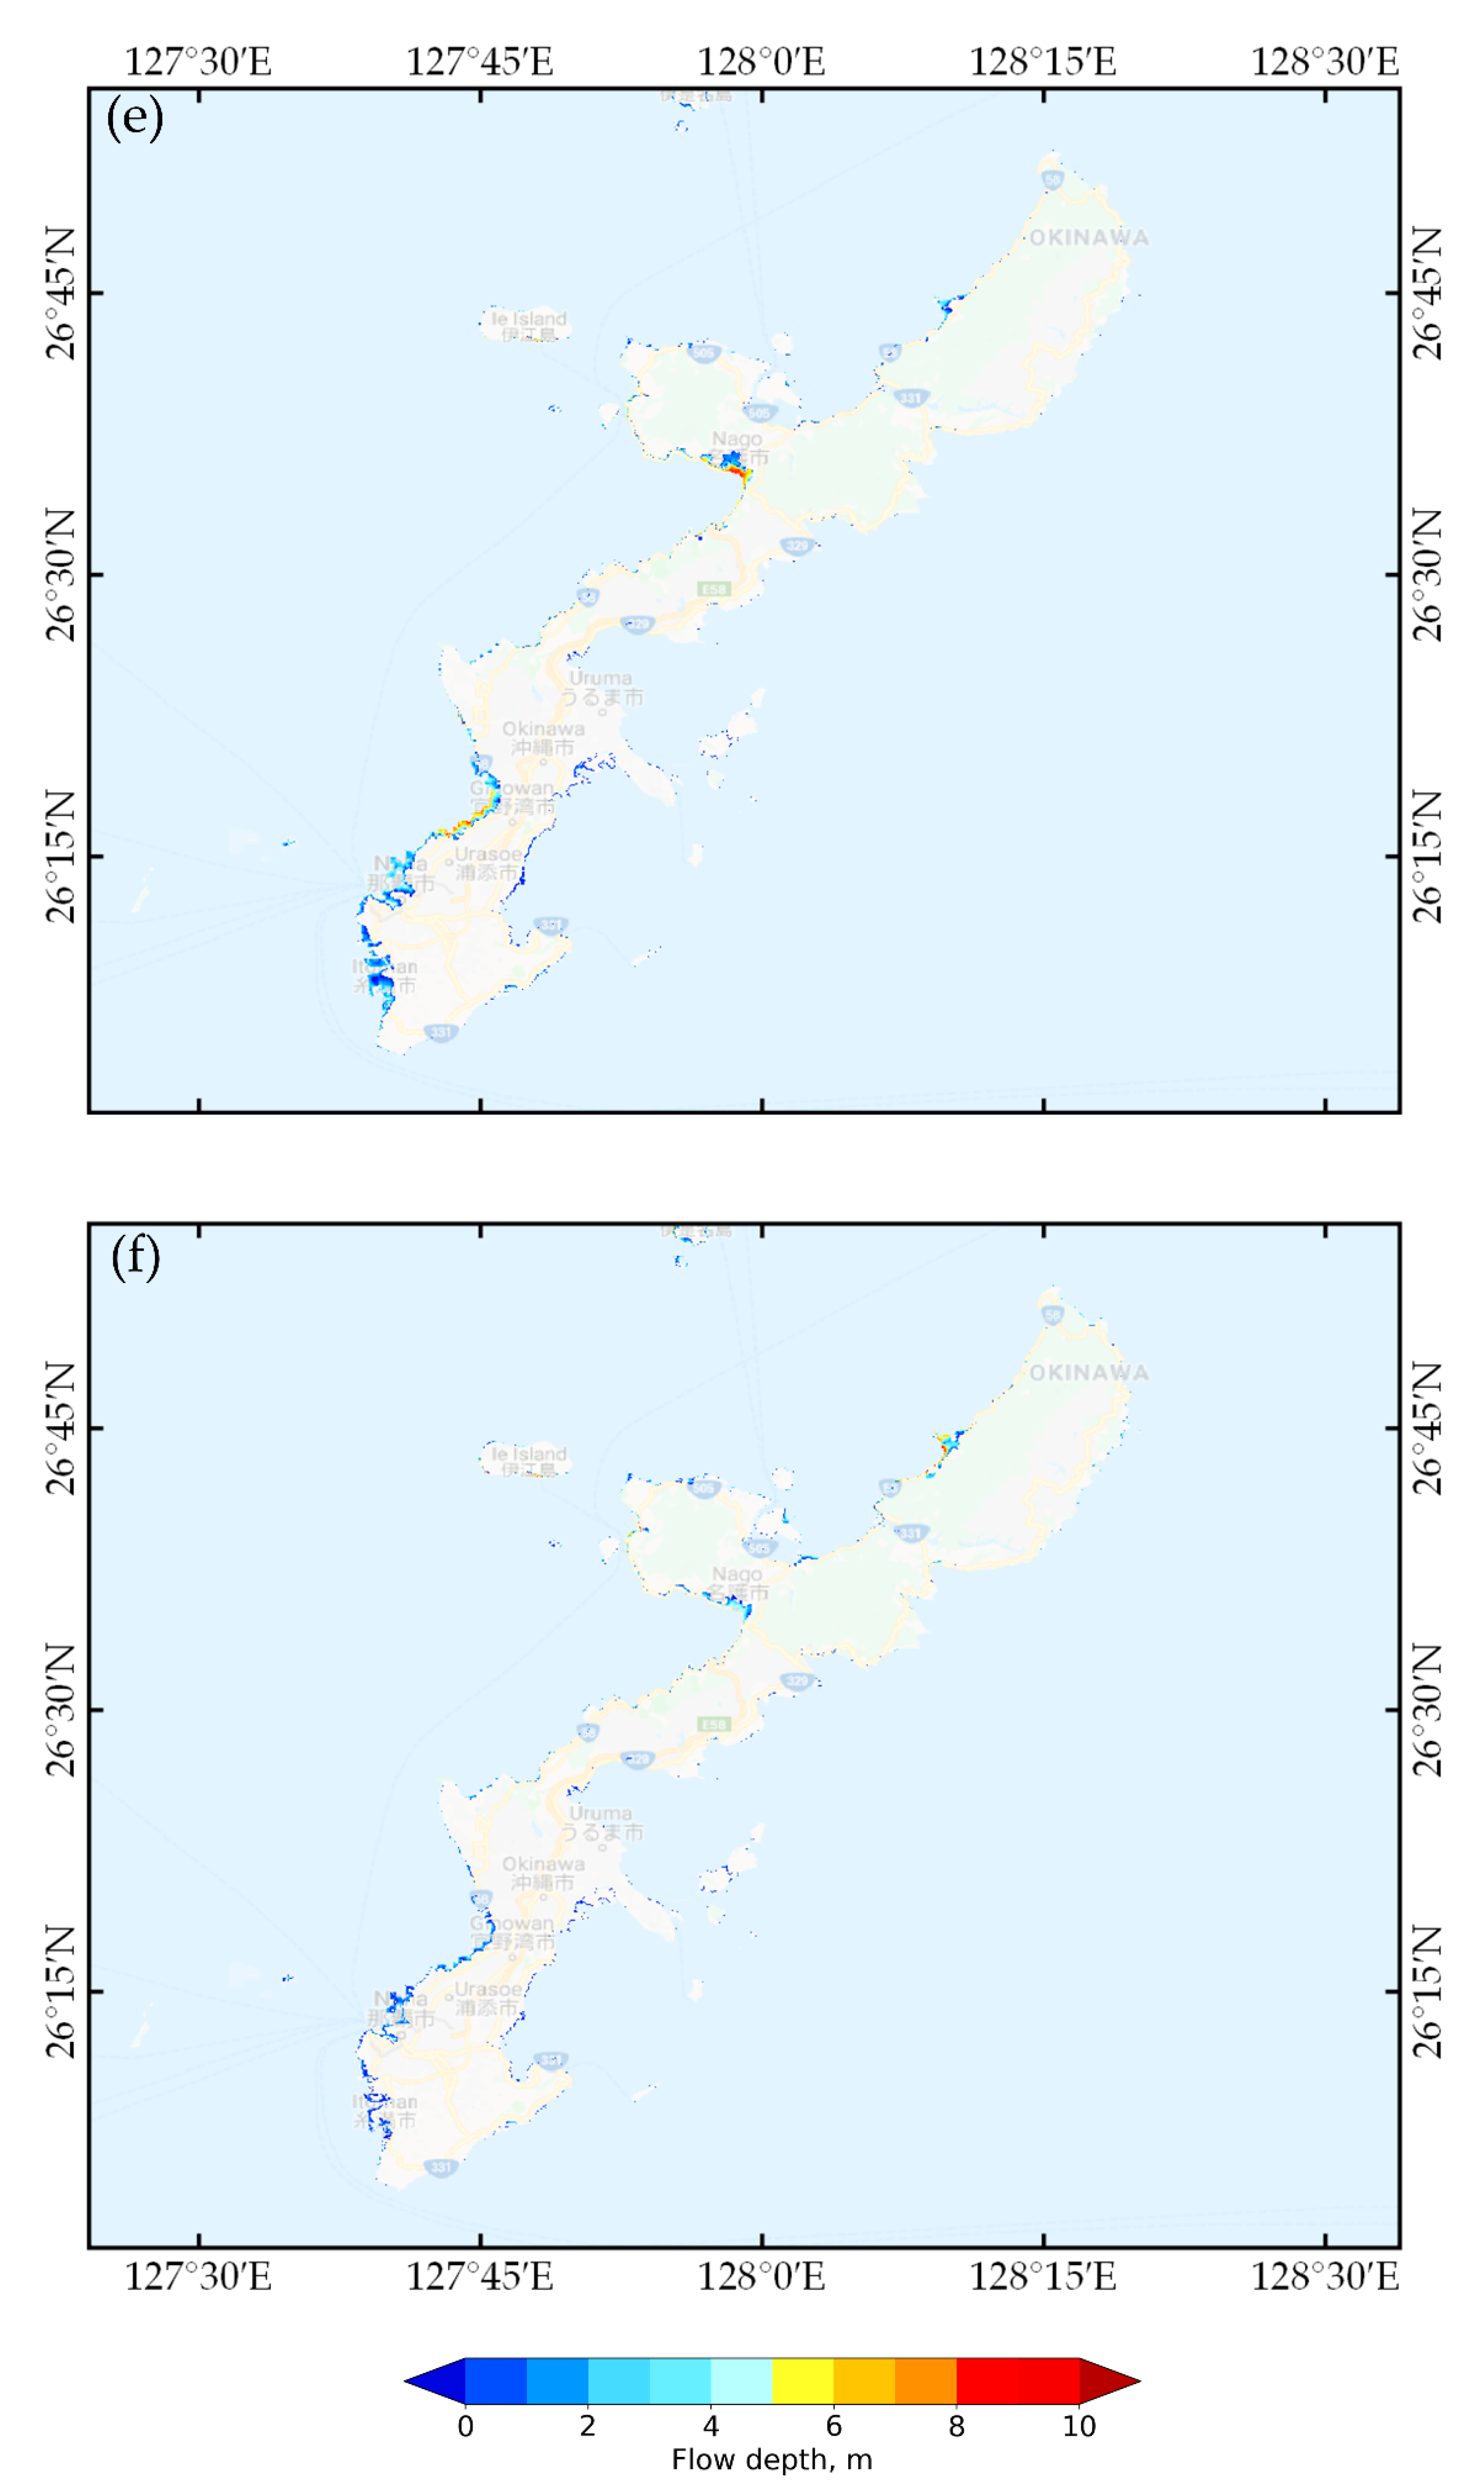
3.1. Tsunami Flood Map
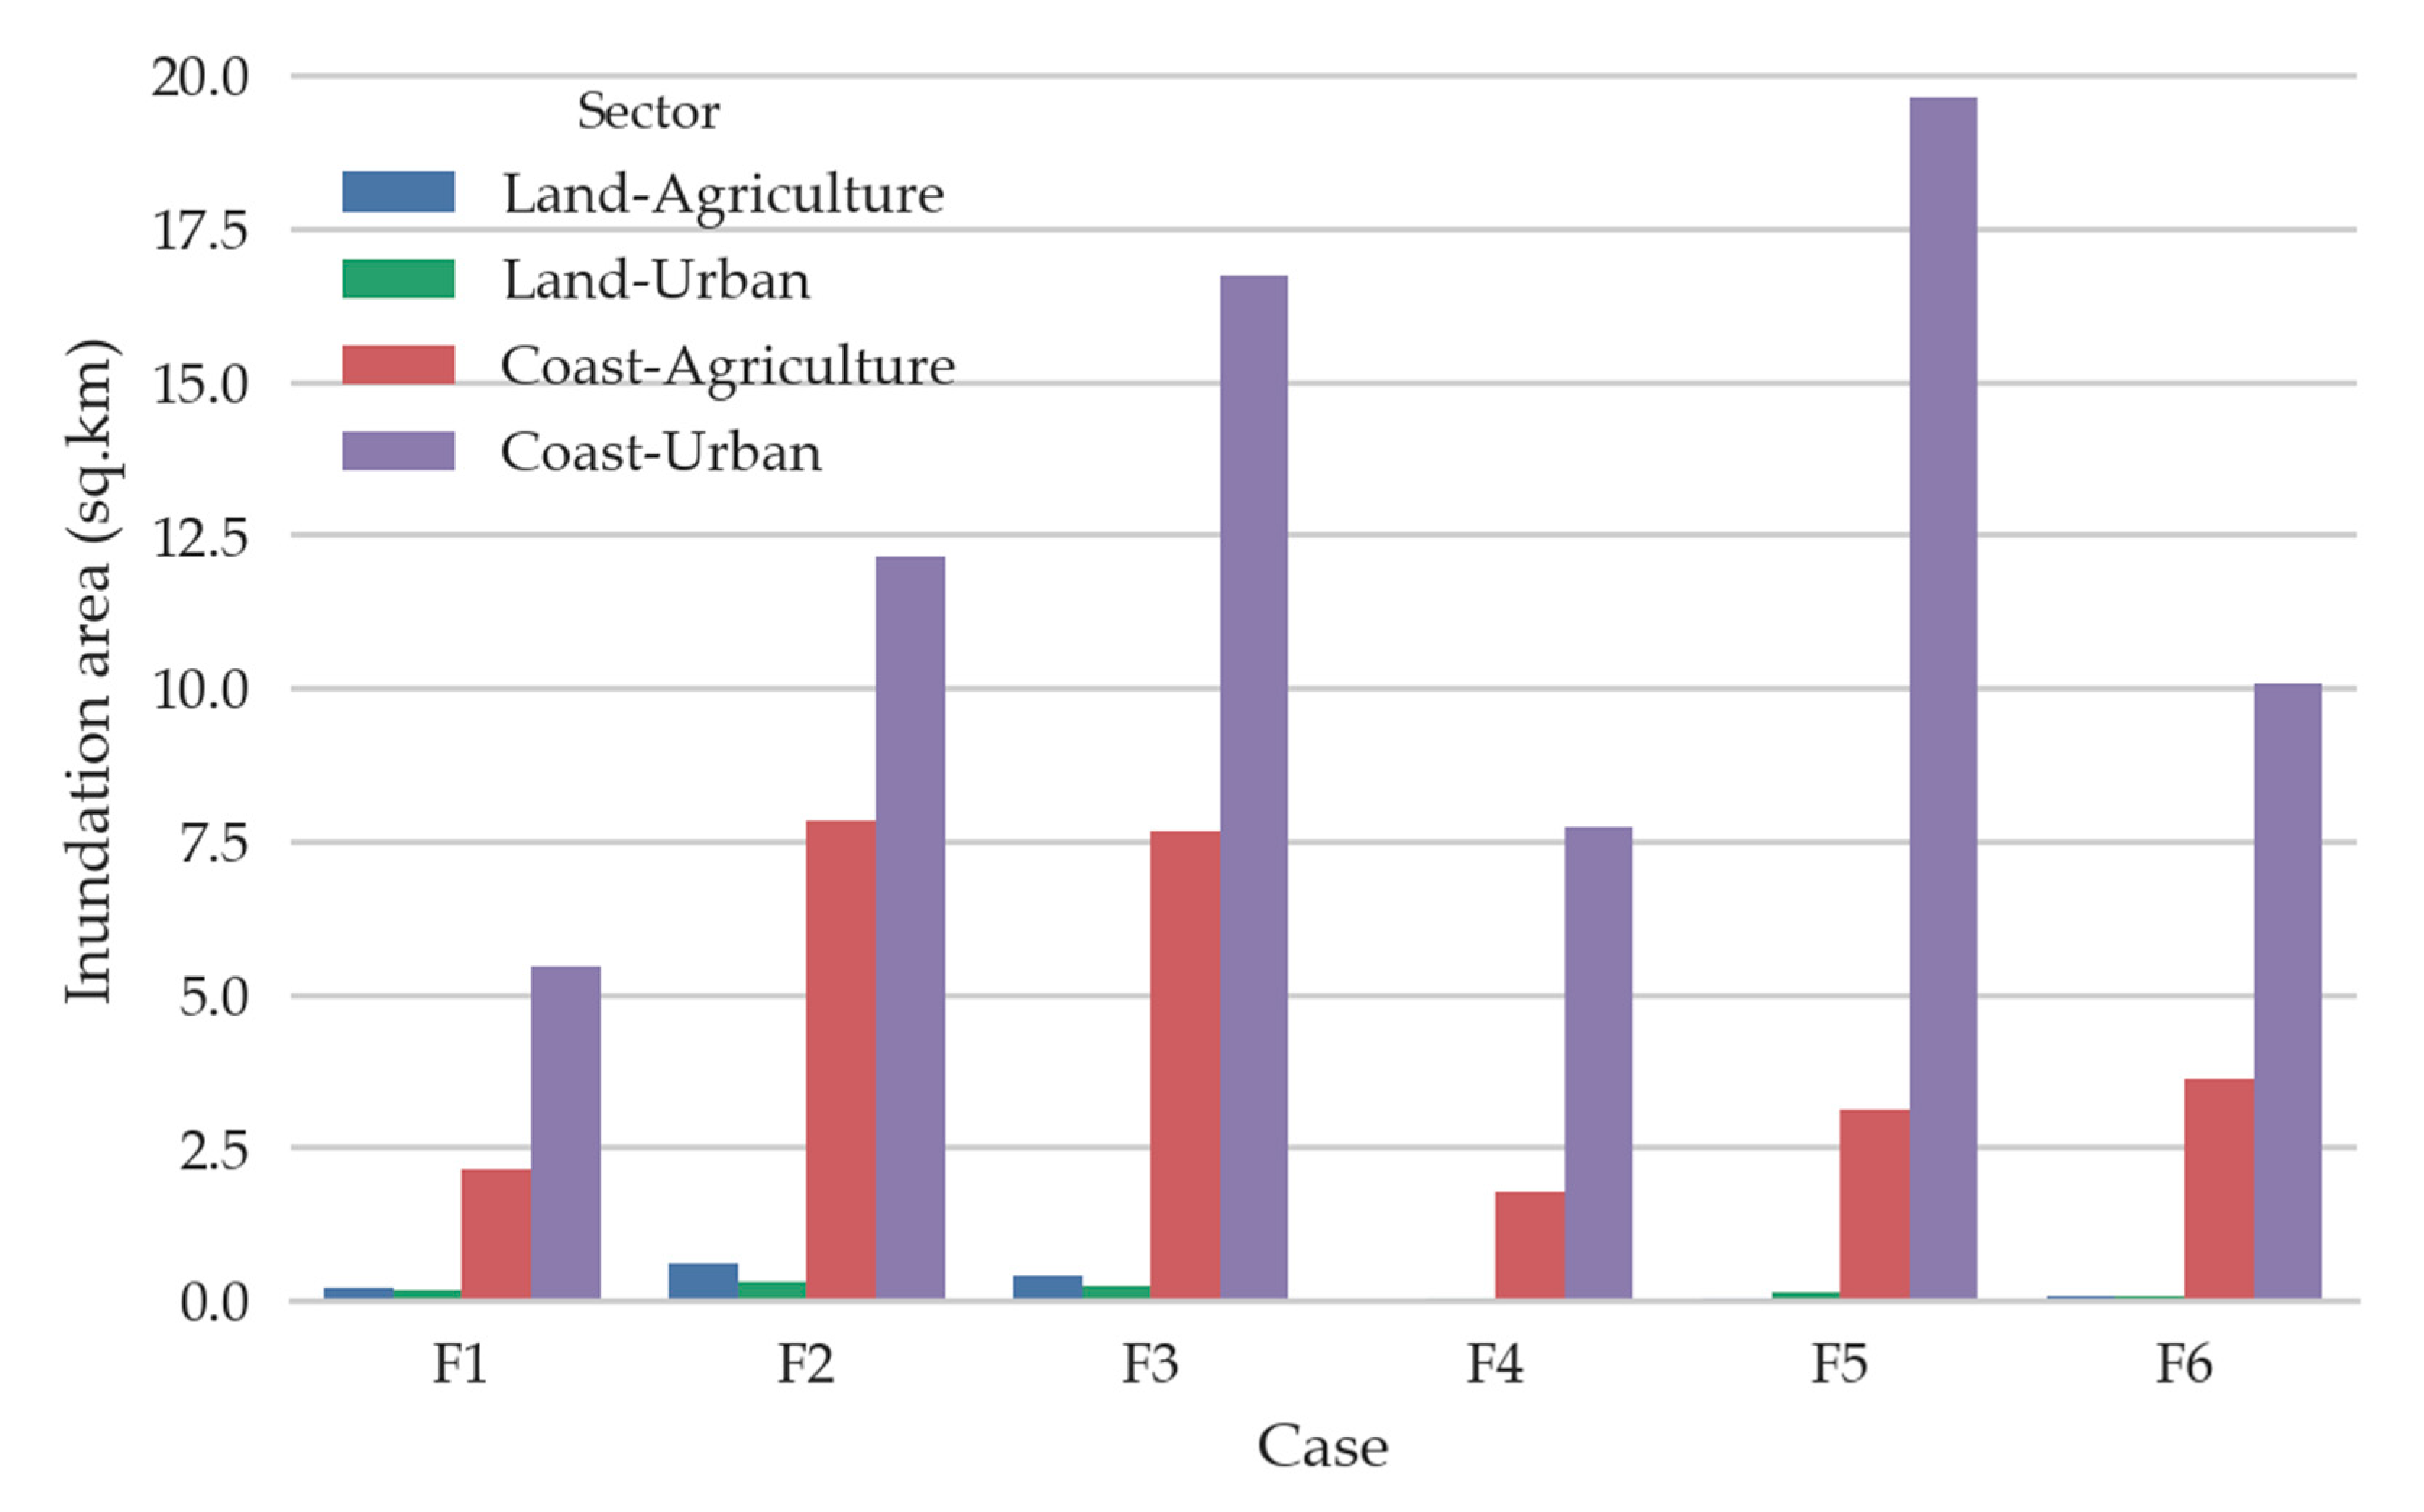
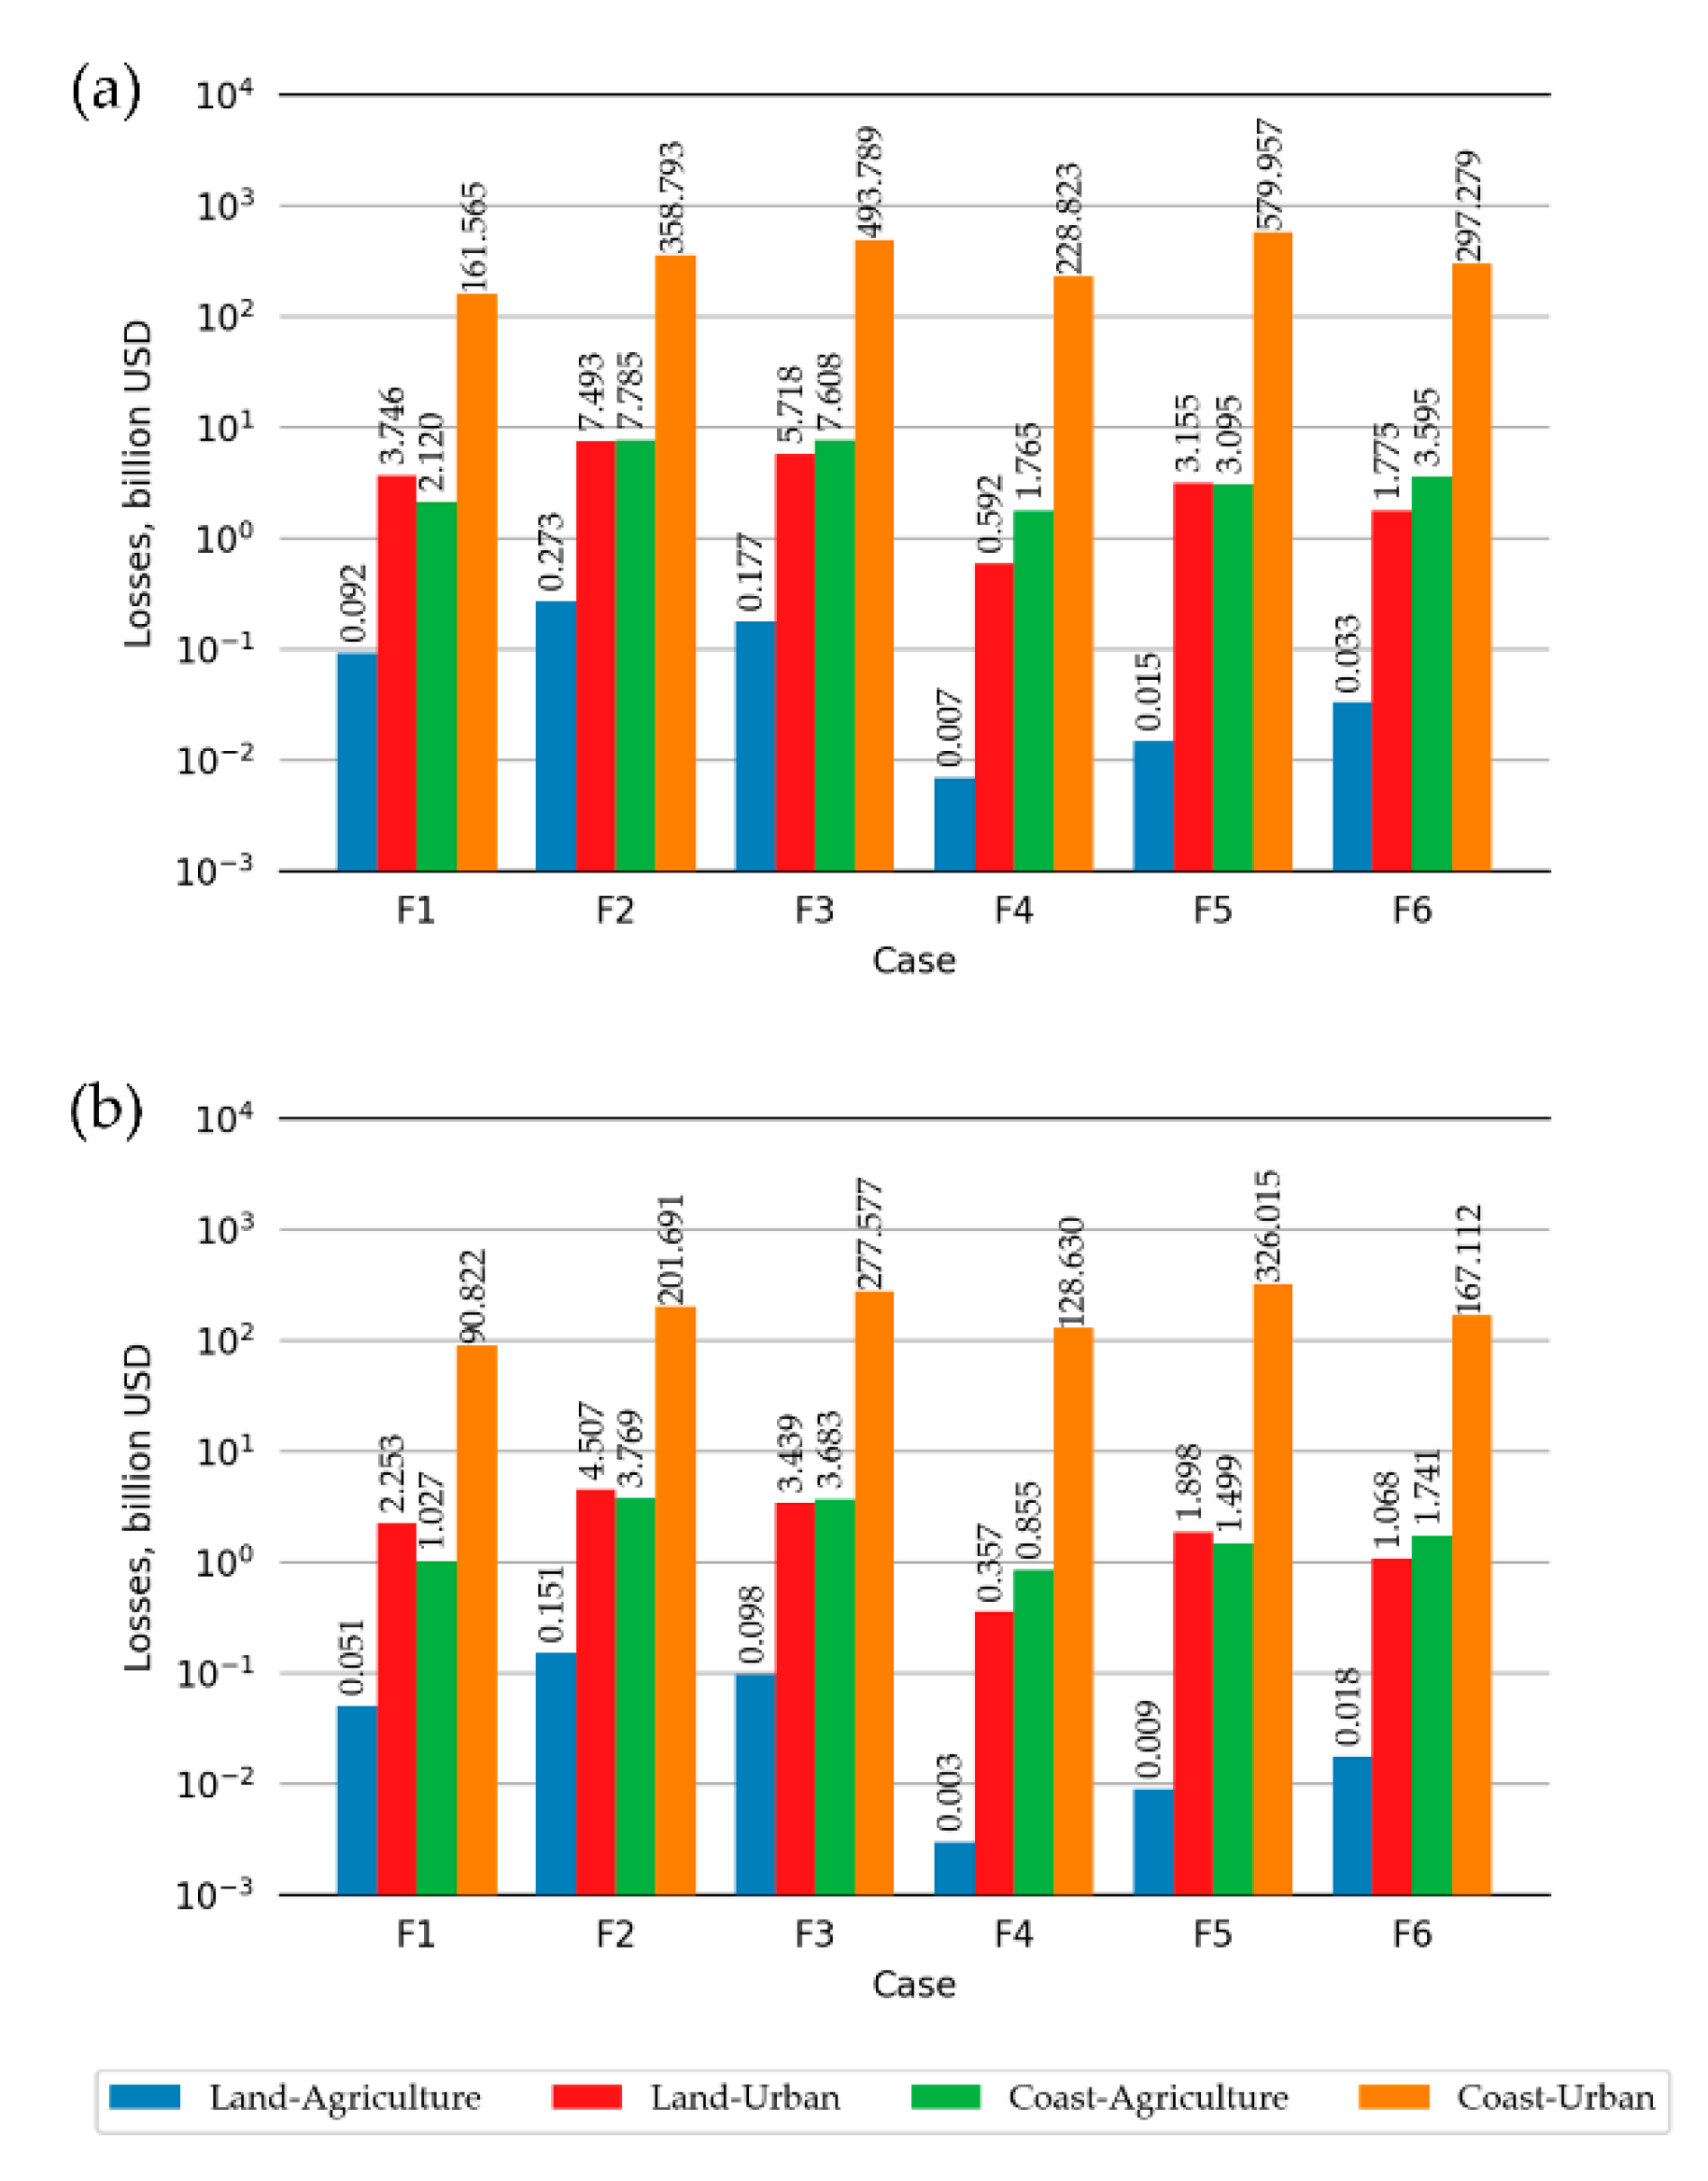
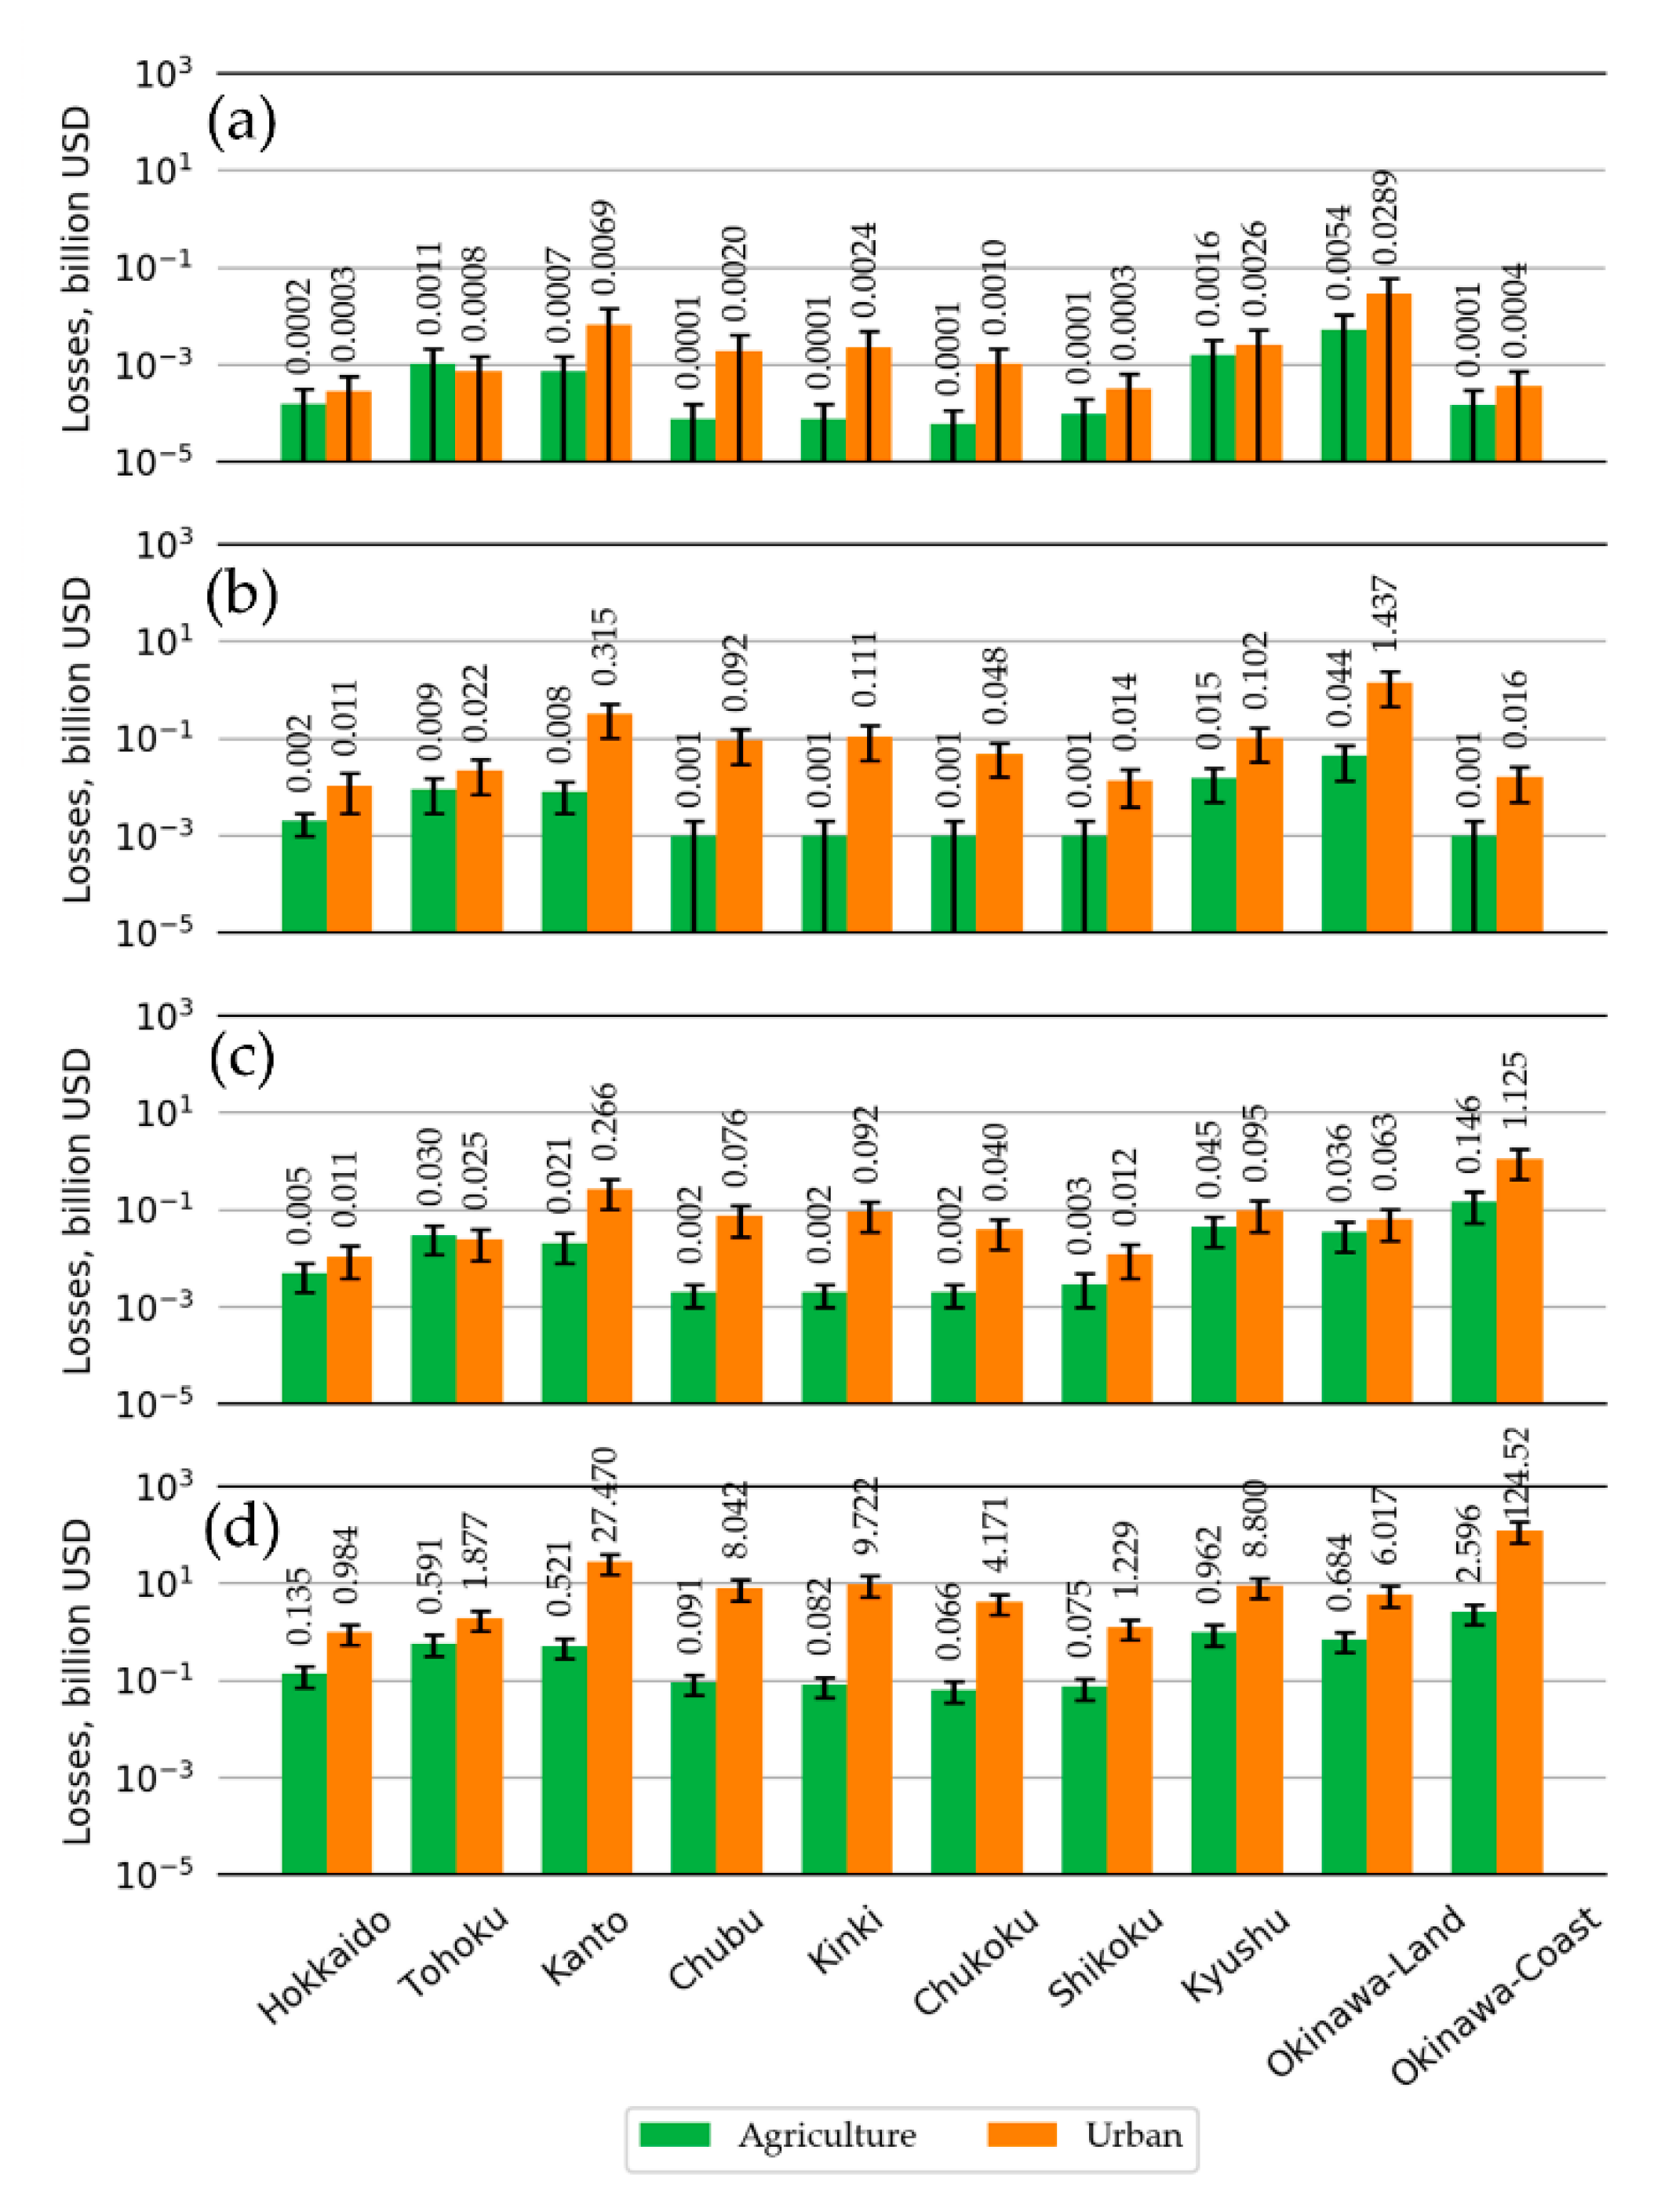
3.2. Tsunami Economic Losses
4. Conclusions
Author Contributions
Funding
Acknowledgments
Conflicts of Interest
References
- Feyen, L.; Vrugt, J.A.; Ó Nualláin, B.; van der Knijff, J.; de Roo, A. Parameter optimisation and uncertainty assessment for large-scale streamflow simulation with the LISFLOOD model. J. Hydrol. 2006, 332, 236–289. [Google Scholar] [CrossRef]
- Geospatial Information Authority of Japan (GSI). Available online: http://www.gsi.go.jp/ (accessed on 14 March 2011).
- Koshimura, S.; Hayashi, S.; Gokon, H. The impact of the 2011 Tohoku earthquake tsunami disaster and implications to the reconstruction. Soils Found. 2014, 54, 560–572. [Google Scholar] [CrossRef]
- Mori, N.; Takahashi, T.; The 2011 Tohoku Earthquake Tsunami Joint Survey Group. Nationwide post event survey and analysis of the 2011 Tohoku earthquake tsunami. Coast. Eng. J. 2012, 54, 125001. [Google Scholar]
- Lacharote, P.; Leelawat, N.; Suppasri, A.; Thamarax, P.; Imamura, F. Estimation of fatality ratios and investigation of influential factors in the 2011 Great East Japan Tsunami. Int. J. Disaster Risk Reduct. 2018, 29, 37–54. [Google Scholar] [CrossRef]
- Suppasri, A.; Koshimura, S.; Imai, K.; Mas, E.; Gokon, H.; Muhari, A.; Imamura, F. Damage characteristic and field survey of the 2011 Great East Japan tsunami in Miyagi prefecture. Coast. Eng. J. 2012, 54, 1250005. [Google Scholar] [CrossRef]
- National Police Agency. Report of the Damage Caused by the 2011 Tohoku Earthquake and Tsunami (in Japanese). Available online: http://www.npa.go.jp/archive/keibi/biki/higaijokyo.pdf (accessed on 9 December 2016).
- Ministry of Finance Japan. Japan’s Fiscal Condition. 2011. Available online: www.mof.go.jp/english/budget/budget/ (accessed on 20 December 2011).
- Ministry of Land, Infrastructure, Transport and Tourism (MLIT). Report of The Great East Japan Earthquake. 2011. Available online: http://www.mlit.go.jp/common/000138154.pdf (accessed on 3 March 2014).
- Liu, P.L.F.; Cho, Y.S.; Yoon, S.B.; Seo, S.N. Numerical Simulation of the 1960 Chilean Tsunami Propagation and Inundation as Hilo, Hawaii, Recent Development in Tsunami Research. Kluwer Acad. Publ. 1994, 4, 99–115. [Google Scholar]
- Liu, P.L.F.; Woo, S.B.; Cho, Y.S. Computer Programe for Tsunami Propagation and Inundation; Technical Report; Cornell University: Ithaca, NY, USA, 1998. [Google Scholar]
- Titov, V.; Synolakis, C.E. Numerical modeling of tidal wave run-up. J. Waterw. Port Coast. Ocean Eng. 1998, 124, 157–171. [Google Scholar] [CrossRef]
- Imamura, F. Review of tsunami with a finite difference method. In Long-Wave Runup Models; World Scientific Press: River Edge, NJ, USA, 1995; pp. 25–42. [Google Scholar]
- Jais wal, R.K.; Singh, A.P.; Rastogi, B.K. Simulation of the Arabian Sea tsunami propagation generated due to 1945 Makran earthquake and its effect on the western parts of Gujarat, India. Nat. Hazard 2008, 48, 245–248. [Google Scholar] [CrossRef]
- Usha, T.; Ramana Murthy, M.V.; Murthy, N.T.; Murty, T.S. Vulnerability assessment of car nicobar to tsunami hazard using numerical model. Sci. Tsunami Hazards 2009, 28, 15–34. [Google Scholar]
- Chenthamil Selvan, S.; Kankara, R.S. Tsunami model simulation for 26 December 2004 and its effect on Koodankulam region of Tamil Nadu Coast. Int. J. Ocean Clim. Syst. 2016, 7, 62–69. [Google Scholar] [CrossRef]
- Suppasri, A.; Koshimura, S.; Imamura, F. Developing tsunami fragility curves based on the satellite remote sensing and the numerical modeling of the 2004 Indian Ocean tsunami in Thailand. Nat. Hazards Earth Syst. Sci. 2011, 11, 173–189. [Google Scholar] [CrossRef]
- Suppasri, A.; Fukui, K.; Yamashita, K.; Leelawat, N.; Ohira, H.; Imamura, F. Developing fragility functions for aquaculture rafts and eelgrass in the case of the 2011 Great East Japan tsunami. Nat. Hazards Earth Syst. Sci. 2018, 18, 145–155. [Google Scholar] [CrossRef]
- Sugawara, D.; Goto, K. Numerical modeling of the 2011 Tohoku-oki tsunami in the offshore and onshore of Sendai Plain, Japan. Sediment. Geol. 2012, 282, 110–123. [Google Scholar] [CrossRef]
- Pakoksung, K.; Suppasri, A.; Imamura, F. Systematic evaluation of different infrastructure systems for tsunami defense in Sendai City. Geosciences 2018, 8, 173. [Google Scholar] [CrossRef]
- Kajitani, Y.; Chang, S.E.; Tatano, H. Economic impact of the 2011 Tohoku-Oki earthquake and tsunami. Earthq Spectra 2013, 29, 457–478. [Google Scholar] [CrossRef]
- Muhari, A.; Charvet, I.; Tsuyoshi, F.; Suppasri, A.; Imamura, F. Assessment of tsunami hazards in ports and their impact on marine vessels derived from tsunami models and the observed damage data. Nat. Hazards 2015, 75, 1309–1328. [Google Scholar] [CrossRef][Green Version]
- Pakoksung, K.; Suppasri, A.; Imamura, F. Approach of estimating tsunami economic losses in The Okinawa Island with scenario-based of input-output table and Okinawa Earthquake Sources. Internet J. Soc. Soc. Manag. Systems 2017, 11, 4567. [Google Scholar]
- Carter, H.O.; Ireri, D. Linkage of california-arizona input–output models to analyze water transfer patterns. In Application of Input–Output Analysis; Carter, A.P., Brody, A., Eds.; University of California: Berkeley, CA, USA, 1968. [Google Scholar]
- Tate, D.M. Structural change implications for industrial water use. Water Resour. Res. 1986, 22, 1526–1530. [Google Scholar] [CrossRef]
- Niizawa, H. Inter-Regional dependence of water demand due to import and export of goods. Stud. Reg. Sci. 1987, 18, 19–38. [Google Scholar] [CrossRef][Green Version]
- Ishiro, T. Water footprint analysis in Kanto Basin Zone, Japan by compiling the Kanto Interregional Input–Output Table. In Proceedings of the 19th International Input–Output Table Conference, Alexandria, VA, USA, 13–17 June 2011. [Google Scholar]
- Hasegawa, R.; Tamura, M.; Kuwahara, Y.; Yokoki, H.; Mimura, N. An input-output analysis for economic losses of flood caused by global warming—A case study of Japan at the River Basin’s Level. In Proceedings of the International Input-output Conference, Sao Paulo, Brazil, 13–17 July 2009; pp. V1–10. [Google Scholar]
- Miller, R.E.; Blair, P.D. Input–Output Analysis: Foundations and Extensions, 2nd ed.; Cambridge University Press: New York, NY, USA, 2009. [Google Scholar]
- Yamada, M. Construction of a Multi-Regional Input-Output Table for Nagoya metropolitan area, Japan. J. Econ. Struct. 2015, 4, 1–18. [Google Scholar] [CrossRef]
- Suttinon, P.; Nasu, S. Regional virtual water of the Shikoku Island: Inter-regional input-output table. Internet J. Soc. Soc. Manag. Syst. 2012, 8, 1–10. [Google Scholar]
- 2005 Inter-Regional Input-Output Table Statistics; Statistics Report; METI: Chiyoda-ku, Japan, 7 April 2011.
- Nakamura, M. Source fault model of the 1771Yaeyama Tsunami, southern Ryukyu Island, Japan, Interred from Numerical Simulation. Pure Appl. Geophys. 2006, 163, 41–54. [Google Scholar] [CrossRef]
- Goto, K.; Kawana, T.; Imamura, F. Historical and geological evidence of boulders deposited by tsunamis, southern Ryukyu Island, Japan. Earth-Sci. Rev. 2010, 102, 77–99. [Google Scholar] [CrossRef]
- Okinawa Prefectural Government, Okinawa Tsunami Inundation Assumption. Available online: https://www.pref.okinawa.jp/site/doboku/kaibo/h27tunami/h27tunami_a.html (accessed on 24 July 2015).
- Ando, M.; Nakamura, M.; Matsumoto, T.; Furukawa, M.; Tadokoro, K.; Furumoto, M. Is the Ryukyu subduction zone in Japan coupled or decoupled? – The necessity of seafloor crustal deformation observation. Earth Planets Space 2009, 61, 1031–1039. [Google Scholar] [CrossRef]
- Okada, Y. Surface deformation due to shear and tensile faults in a half-space. Bull. Seismol. Soc. Am. 1985, 75, 1135–1154. [Google Scholar]
- Geist, E.L.; Dmowska, R. Local tsunamis and distributed slip at the source. In Seismogenic and Tsunamigenic Processes in Shallow Subduction Zones; Birkhäuser: Basel, Switzerland, 1999; pp. 485–512. [Google Scholar]
- Li, L.; Switzer, A.D.; Chan, C.H.; Wang, Y.; Weiss, R.; Qiu, Q. How heterogeneous coseismic slip affects regional probabilistic tsunami hazard assessment: A case study in the South China Sea. J. Geophys. Res. Solid Earth 2016, 121, 6250–6272. [Google Scholar] [CrossRef]
- Sepúlveda, I.; Liu, P.L.F.; Grigoriu, M.; Pritchard, M. Tsunami hazard assessments with consideration of uncertain earthquake slip distribution and location. J. Geophys. Res. Solid Earth 2017, 122, 7252–7271. [Google Scholar] [CrossRef]
- Bricker, J.D.; Gibson, S.; Takagi, H.; Imamura, F. On the need for larger Manning’s roughness coefficients in depth-integrated tsunami inundation models. Coast. Eng. J. 2015, 57, 1550005. [Google Scholar] [CrossRef]
- Leonteif, W.W. Input–Output Economics; Oxford University Press: New York, NY, USA, 1965. [Google Scholar]
- United Nations. Handbook on Supply, Use and Input-Output Tables with Extensions and Applications. Available online: https://unstats.un.org/unsd/nationalaccount/docs/SUT_IOT_HB_wc.pdf (accessed on 4 March 2019).
- Suttinon, P. Water Demand Management Model in the Lower Chaophraya River Basin, Thailand. Ph.D. Thesis, Kochi University of Technology, Kochi Prefecture, Japan, March 2008; pp. 44–57. [Google Scholar]
- Sambah, A.B.; Miura, F. Integration of spatial analysis for tsunami inundation and impact assessment. J. Geogr. Inf. Syst. 2014, 6, 11–22. [Google Scholar] [CrossRef]
- Chenery, H.B. Interregional and International Input–Output Analysis, the Structure Interdependence of the Economy. In Proceeding on Input–Output Analysis; Barna, T., Ed.; Giuffre: Milano, Italy, 1954. [Google Scholar]
- Suttinon, P.; Nasu, S.; Ihara, T.; Bongochgetsakul, N.; Uemoto, K. Water resources management in shikoku region by Inter-Regional Input-Output Table. Rev. Urban Reg. Dev. Stud. 2013, 25, 107–127. [Google Scholar] [CrossRef]
- Goda, K.; Abilova, K. Tsunami hazard warning and risk prediction based on inaccurate earthquake source parameters. Nat. Hazards Earth Syst. Sci. 2016, 16, 577–593. [Google Scholar] [CrossRef]
- Song, J.; De Risi, R.; Goda, K. Influence of flow velocity on tsunami loss estimation. Geosciences. 2017, 7, 114. [Google Scholar] [CrossRef]
- Suppasri, A.; Mas, E.; Charvet, I.; Gunasekera, R.; Imai, K.; Fukutani, Y.; Abe, Y.; Imamura, F. Building damage characteristics based on surveyed data and fragility curves of the 2011 Great East Japan tsuanmi. Natural Hazards 2013, 66, 319–341. [Google Scholar] [CrossRef]
- Ruangrassamee, A.; Yanagisawa, H.; Foytong, P.; Lukkunaprasit, P.; Koshimura, S.; Imamura, F. Investigation of tsunami induced damage and fragility of buildings in Thailand after the December 2004 Indian Ocean tsunami. Earthq. Spectra 2006, 22, 377–401. [Google Scholar] [CrossRef]
- Koshimura, S.; Namegaya, Y.; Yanagisawa, H. Tsunami Fragility: A new measure to assess tsunami damage. J. Disaster Res 2009, 4, 479–488. [Google Scholar] [CrossRef]
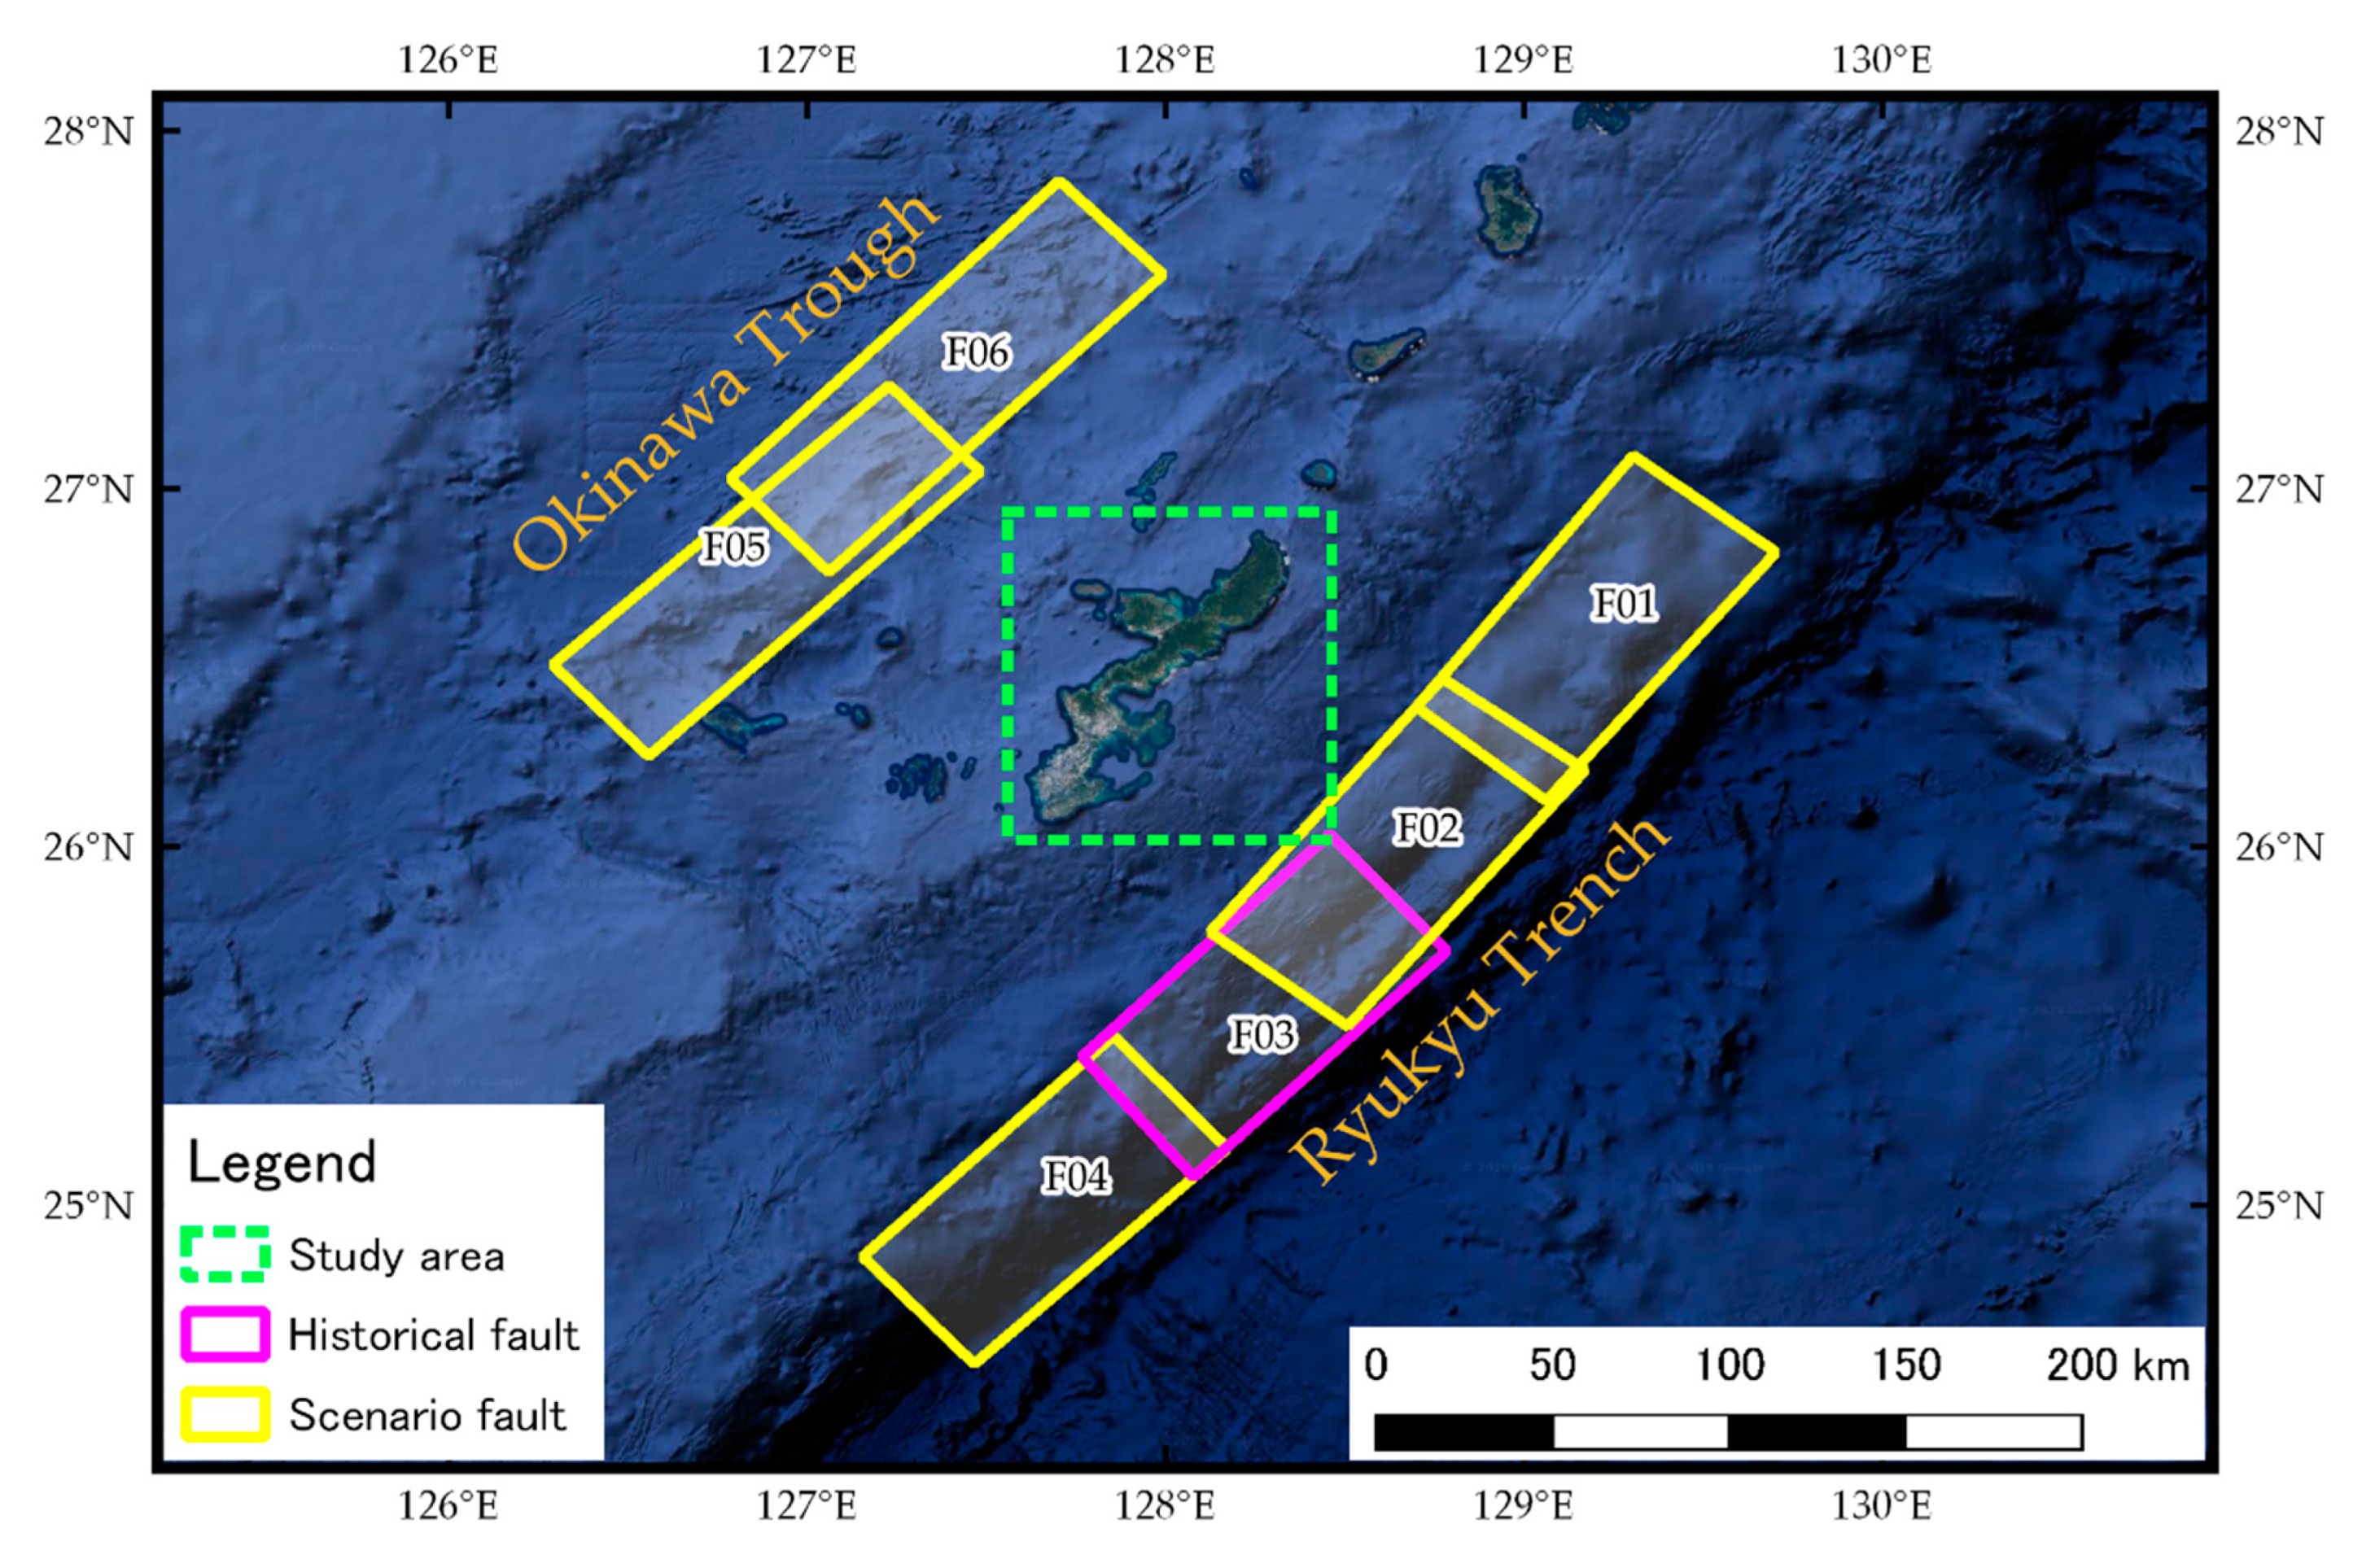
| No | Name | Lat. | Lon. | Width, km | Length, km | Depth, km | Strike, deg. | Dip, deg. | Rake, deg. | Slip, m | Mw |
|---|---|---|---|---|---|---|---|---|---|---|---|
| 1 | F01 | 26.812 | 129.756 | 100 | 50 | 5 | 218 | 12 | 90 | 12 | 8.2 |
| 2 | F02 | 26.196 | 129.172 | 100 | 50 | 5 | 218 | 12 | 90 | 12 | 8.2 |
| 3 | F03 * | 25.728 | 128.806 | 100 | 50 | 5 | 225 | 12 | 90 | 12 | 8.2 |
| 4 | F04 | 25.181 | 128.163 | 100 | 50 | 5 | 225 | 12 | 90 | 12 | 8.2 |
| 5 | F05 | 27.126 | 127.519 | 130 | 40 | 2 | 225 | 30 | 270 | 8 | 8.1 |
| 6 | F06 | 27.650 | 128.050 | 130 | 40 | 2 | 225 | 30 | 270 | 8 | 8.1 |
| Topography Characteristic | Criteria |
|---|---|
| Distance from sea | <3.0 km |
| Gradient | <7.5 degree |
| Altitude | <20 m. MSL |
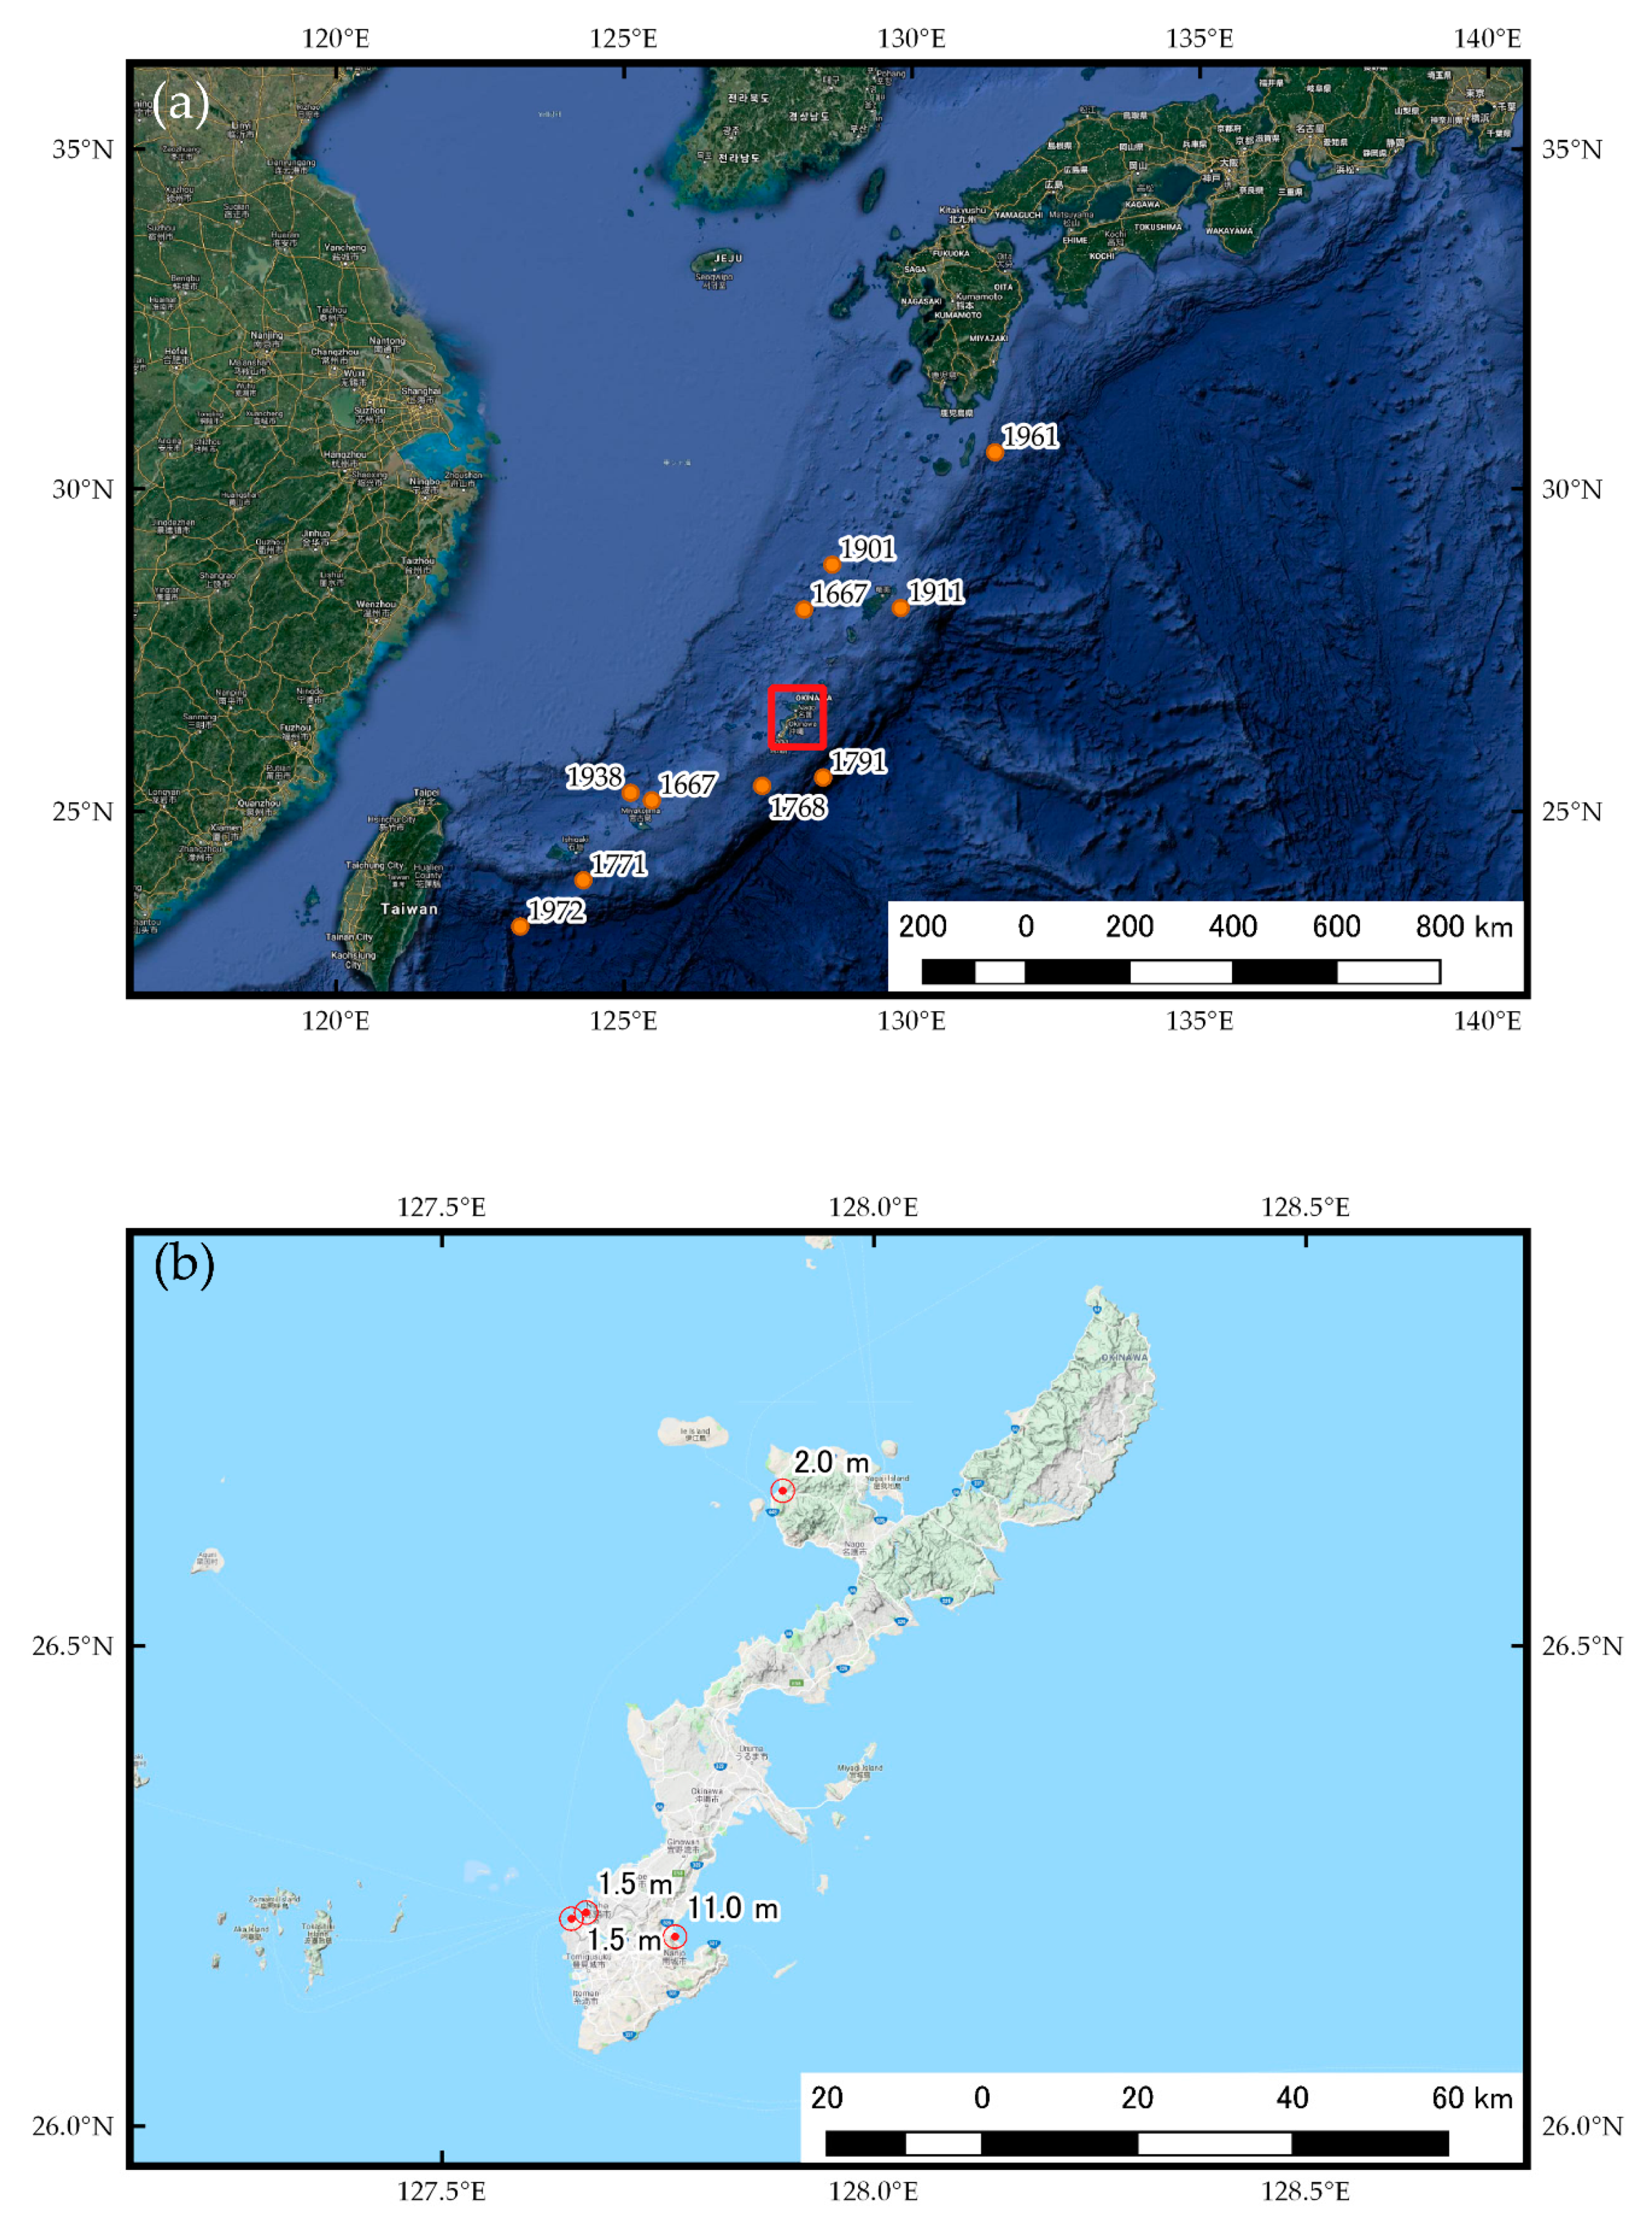
| No | Observed Flow Depth, m | Simulated Flow Depth, m | Different, m |
|---|---|---|---|
| 1 | 1.5 | 1.62 | 0.12 |
| 2 | 1.5 | 1.70 | 0.20 |
| 3 | 2.0 | 1.80 | 0.20 |
| 4 | 11.0 | 6.20 | 4.80 |
| Information | Land-Agriculture | Land-Urban | Coast-Agriculture | Coast-Urban |
|---|---|---|---|---|
| Total interaction, billion USD | 29.7 | 1465.5 | 14.1 | 727.8 |
| Value added, billion USD | 59.3 | 2553.6 | 32.8 | 1367.3 |
| Total economic value, billion USD | 89.0 | 4019.1 | 46.9 | 2095.1 |
| Area, sq.km | 195.4 | 165.1 | 47.1 | 70.9 |
| Unit cost, billion USD / sq.km | 0.455 | 24.343 | 0.995 | 29.550 |
© 2019 by the authors. Licensee MDPI, Basel, Switzerland. This article is an open access article distributed under the terms and conditions of the Creative Commons Attribution (CC BY) license (http://creativecommons.org/licenses/by/4.0/).
Share and Cite
Pakoksung, K.; Suppasri, A.; Matsubae, K.; Imamura, F. Estimating Tsunami Economic Losses of Okinawa Island with Multi-Regional-Input-Output Modeling. Geosciences 2019, 9, 349. https://doi.org/10.3390/geosciences9080349
Pakoksung K, Suppasri A, Matsubae K, Imamura F. Estimating Tsunami Economic Losses of Okinawa Island with Multi-Regional-Input-Output Modeling. Geosciences. 2019; 9(8):349. https://doi.org/10.3390/geosciences9080349
Chicago/Turabian StylePakoksung, Kwanchai, Anawat Suppasri, Kazuyo Matsubae, and Fumihiko Imamura. 2019. "Estimating Tsunami Economic Losses of Okinawa Island with Multi-Regional-Input-Output Modeling" Geosciences 9, no. 8: 349. https://doi.org/10.3390/geosciences9080349
APA StylePakoksung, K., Suppasri, A., Matsubae, K., & Imamura, F. (2019). Estimating Tsunami Economic Losses of Okinawa Island with Multi-Regional-Input-Output Modeling. Geosciences, 9(8), 349. https://doi.org/10.3390/geosciences9080349


