Article

The Components of the Glacial Runoff of the Tsambagarav Massif from Stable Water Isotope Data

by
Dmitry V. Bantcev
1,*,
Dmitry A. Ganyushkin
1,
Kirill V. Chistyakov
1,
Ilya V. Volkov
1,
Alexey A. Ekaykin
1,2,
Arina N. Veres
1,2,
Igor V. Tokarev
3,
Natalya B. Shtykova
1 and
Tatiana A. Andreeva
1
1
Institute of Earth Science, Saint-Petersburg State University, Universitetskaya nab. 7/9, 199034 Saint-Petersburg, Russia
2
Arctic and Antarctic research institute, Beringa 38, 199397 Saint-Petersburg, Russia
3
Research Park, Saint-Petersburg State University, Universitetskaya nab. 7/9, 199034 Saint-Petersburg, Russia
*
Author to whom correspondence should be addressed.
Geosciences 2019, 9(7), 297; https://doi.org/10.3390/geosciences9070297
Submission received: 10 May 2019 / Revised: 24 June 2019 / Accepted: 3 July 2019 / Published: 5 July 2019
(This article belongs to the Special Issue Cryosphere II)

Abstract

:
The aim of this study was to determine the contribution of snow and glacial ice to the river fluxes, and to identify the type of ice formation in the Tsambagarav massif (the northwestern part of Mongolia). The main method for this study was isotopic analysis of water samples. The isotopic separation showed that the shares of the main components in the total runoff differed for different rivers of the massif. Alongside with that, glacial meltwater prevailed in all the investigated fluxes. The share of snow and firn in the meltwater coming from the surface of the large valley glaciers in the middle of the ablation season in 2017 changed by only 10%—from 20% to 30%. Thus, further reduction of glaciation caused by global climate change could significantly affect the water balance of the study area. The isotopic composition of glacial ice proves that its alimentation primarily comes from precipitation during the transitional seasons. Superimposed ice is not the basis for nourishment of the glaciers of the Tsambagarav massif.

1. Introduction

Understanding the water balance in snow and glacier feeding of high-mountain rivers is a key to water management, especially within the framework of global climate change. The northwestern part of Mongolia has an arid climate, and its area is characterized by a deficiency of water resources. Annual precipitation range amounts to 78–87 mm in hollows and approximately to 270 mm in high mountains. Glacier runoff in this area, due to the small amount of precipitation, plays a significant role in maintaining the economic status of the local population. Therefore, it is important to understand the contribution of water from different sources in order to model the possible impact of climate change on the future water supply. Stable isotopes are a powerful tool to identify and quantify in a river the contribution of waters from different sources. Investigations of stable isotopes aimed to determine the proportion of glacier runoff began in the 1970s in the Alps [1]. Currently, such work is carried out in many high mountainous regions of the world, for example, in the Rocky Mountains [2], the Andes [3], and the Himalayas [4,5].
In Russia, isotope separation of meltwater was carried out for several years near the Dzhankuat glacier in the Central Caucasus. The authors estimated the contribution of winter and spring snow to the runoff [6,7,8].
The closest areas where the similar research has been carried out are in China. Sun et al. (2015) [9] determined the prevalence of glacier and precipitation runoff in the total runoff for the Urumqi River for the period from June to August, and the predominance of groundwater during the winter period in 2012 [9]. In the north of the Tibetan Highlands, the role of glacier systems in nourishing the studied rivers was evaluated using water isotope data [10,11,12]. In all the above-mentioned studies, the emphasis was primarily on assessing the contribution of groundwater and glacier systems in general to the runoff, but the structure of melted glacial waters was not in focus.
Isotopic studies in the Tsambagarav region are of interest because deep ice core drilling was carried out twice in its territory. These drillings may provide us with extra data about the isotopic contents of snow, firn, and ice. In 1991, a 10 m long ice core was obtained from the top of Tsast-Ula mountain, and in 2009, a dome-shaped glacier was drilled to the glacier bed in the southeastern part of the massif and a 72 m long core was obtained. Based on the drilling results, the authors concluded that the formation of the glaciers of the massif took place 6000 years ago, and they reconstructed the climatic conditions [13,14].
Despite a relatively large number of glaciological studies on the Tsambagarav massif, the isotopic composition of the glacier runoff has not been reported yet. This work aimed to fill this gap. In this study, unlike most other isotopic hydrological works, the emphasis was on the melt water formed in the highlands directly at the edges of the glaciers.
The main object of the study was the glacier runoff of the Tsambagarav massif. The aim of the research was to determine the contribution of glacier ice and seasonal snow from the surface of the glaciers to the formation of the glacier runoff, using stable water isotopic composition (δ18O and δD) as a tracer. An additional objective was to reveal the type of ice formation of the largest glaciers of the massif using data on the isotope compositions of their ice.

2. Data and Methods

2.1. Research Area

The Tsambagarav massif extends from the north-west to the south-east by approximately 40 km. In plain view, it has the shape of triangle, facing a wide base to the north. The main summit of the massif, Tsast-Ula mountain, is 4208 m high, its several peaks exceed the height of 4000 m, and the watersheds between these peaks are all above 3600 m altitude.
A recent report [15] showed that there were 67 glaciers in Tsambagarav, with a total area of 68.41 km2, and the weighted average equilibrium line of altitude (ELA) was about 3750 m [15]. The main glaciers of the Tsambagarav Range are grouped into seven glacier complexes. The main glacier complex belongs to the slopes of the Tsast-Ula peak (4208 m a.s.l.). It includes 21 glaciers with a total area of 20.05 km2. The complex cirques are developed on the northeastern slope, and from the west to the east, the depth of dissection of the relief increases. As a result, there are large valley and cirque-valley glaciers on the northeastern slope; the tongues of the largest of them descend to an altitude of 3000 m. The ELA on the glaciers of this complex lies within the range of 3500–3750 m [15]. In Reference [16], the authors stated a less intense retreat and thinning of the Tsambagarav glaciers compared to the Potanin glacier (the largest one in the Altai).
The climate of the Tsambagarav Range is arid, with low annual precipitation. The moisture is mainly brought by westerlies. Available climatic data refer to the foothills where the hydrometeorological stations Bayannur (approximately 35 km to the north-east from the glacial part of the ridge at an altitude of 1364 m) and Erdenburen (at an altitude of 1250 m, 35 km to the south-east from the glaciers) are located. According to the data received at the Bayannur station, the average summer temperature is 16.5 °C, and the average annual precipitation rate is 87 mm (1995–2004). At Erdenburen station, these values are 16.6 °C and 78 mm, respectively (1962–2002) [15]. The precipitation at the level of the firn boundary was estimated to be 270 mm [17].

2.2. Field Observations and Data Collection

One of the main objectives of the study was Glacier No. 7 (Figure 1). This is the largest glacier of the massif, which produces more meltwater than the others. The average thickness of the glacier tongue is 132 meters [15].
The first stage of the isotope studies was carried out at the end of July 2016, in the basin of the Eregtiyn-Gol River, originating from valley glacier No. 7. Water was taken from the streams. In July 2017, the second stage of water, ice, and snow sample collection was carried out. In total, 187 samples were collected. In addition, temporary hydrological and meteorological observations were established. Hydrological observations were carried out at two temporary stations (Figure 1).
Emphasis was laid on determining the isotopic composition of water in streams of glacial origin, In addition, differences in δ18O from different streams and the temporal variability of δ18O were investigated.
The main field investigations were carried out in the basin of the Eregtiyn-Gol River at the edge of the snout of the Eregtiyn glacier (No. 7), and in the basin of the Yamat-Gol River near the snout of glacier No. 9 (Figure 1).
Two temporary hydrological stations were allocated to two main streams that originate at the edge of the glacier No. 7 (Figure 1). Discharge measurements were taken by the method of ionic flood during the period from 21–27 July. At hydrological station No. 1, measurements were taken three times a day, while at hydrological station No. 2, six measurements were performed at different times during the day. Each flow measurement was accompanied by collecting samples for isotope analysis. The third meltwater isotopic composition monitoring point was located on a stream from glacier No. 9. Discharge measurements were not taken there, but the isotopic composition of the meltwater in this stream is of interest, since all the melt water from glacier No. 9 forms a single watercourse.
The meteorological observations were carried out in 2017 using the HOBA portable meteorological station in the valley of the Eregtiyn-Gol River (22–27 July 2017)) and in the valley of the Yamat-Gol River (29 July–2 August). The average daily temperature varied from 8 °C (2 August) to 16 °C (29 July). In total 8 mm of precipitation fell during the works (everything on the 1st and on the 2nd of August), mostly in the form of rain.
To determine the average isotopic composition of glacier ice, 26 samples were collected from different parts of the Eregtiyn glacier tongue (No. 7) at altitudes from 3000 to 3680 m, and 25 samples were collected from the glacier No. 9 at altitudes from 3000 to 3450 m. Ice samples were taken from a depth of approximately 5 cm, and each sample volume was about 200 ml. After melting, the sample was mixed, and 40 ml was poured into test tubes.
Samples of snow and firn were taken in the accumulation zones of glacier No. 7 and of the flat-summit glacier No. 55. At the main summit of Tsast Mountain, a shallow pit was dug or excavated. Its depth was only 20 cm because of low thickness of the snow–firn layer. A 77 cm deep snow–firn pit was also dug on dome-shaped glacier No. 55 in the same place as the ice core had been retrieved in 2009 [14].

2.3. Methods

Stable isotopic ratios (d18O and dD) were measured at the AARI’s Climate and Environmental Research Laboratory using a Picarro L2120-i laser analyzer. After every five samples, a laboratory standard SPB (−9.79‰ for δ18O and −75.47‰ for δD) was measured. SPB standard was prepared from distilled St. Petersburg tap water and calibrated against the IAEA standards «V-SMOW2», GISP-2, and SLAP. The measurement accuracy was 0.05‰ for δ18O and 0.5 for δD.
Some measurements were made at the Resource Center “Centre for X-ray Diffraction Studies” of the Science Park of St. Petersburg State University using the USGS45, USGS46, and GISP standards, with a measurement accuracy of 0.13% for δ18O and 1.5 for δD.
Aside from d18O and dD values, the following “deuterium excess” values were used [18]:
dexs = δD − 8δ18O.
Partitioning of the water from the two components was done using the following mixing equation:
d18Og·fg + d18Os fs = d18Or,
where subscripts refer to glacial (g) and snow/firn (s) component of the total runoff (r), and fg and fs are the fractions of these two components (fg + fs = 1) [8].

3. Results

3.1. Isotopic Composition of Meltwater

In Table 1, values of δ18O in melt waters at the edges of glaciers of the massif in July 2016 and July 2017 are shown. The average value is given in cases of several samplings.
The difference between the isotopic values in 2016 and 2017 did not exceed 0.6‰, while in three water streams, the δ18O value practically did not change. This indicates the relative constancy of the ratio of the runoff components in the streams of glacial origin. The maximal difference between isotopic values of meltwater near the glacier No. 8 and 7 (HS2) may be explained by a larger contribution of seasonal snow to the runoff in 2016.
The results show that the heaviest isotopic composition is typical for the streams that form from small hanging glaciers, and the lightest values are inherent for the water samples collected at the edge of the large valley glacier No. 7 (the source of the Eregniyn-Gol River).
A correlation between air temperature and isotopic values of melt water and precipitation was not detected. Thus, intensity of melting did not change the contribution of snow or ice in meltwater during short-term measurements.
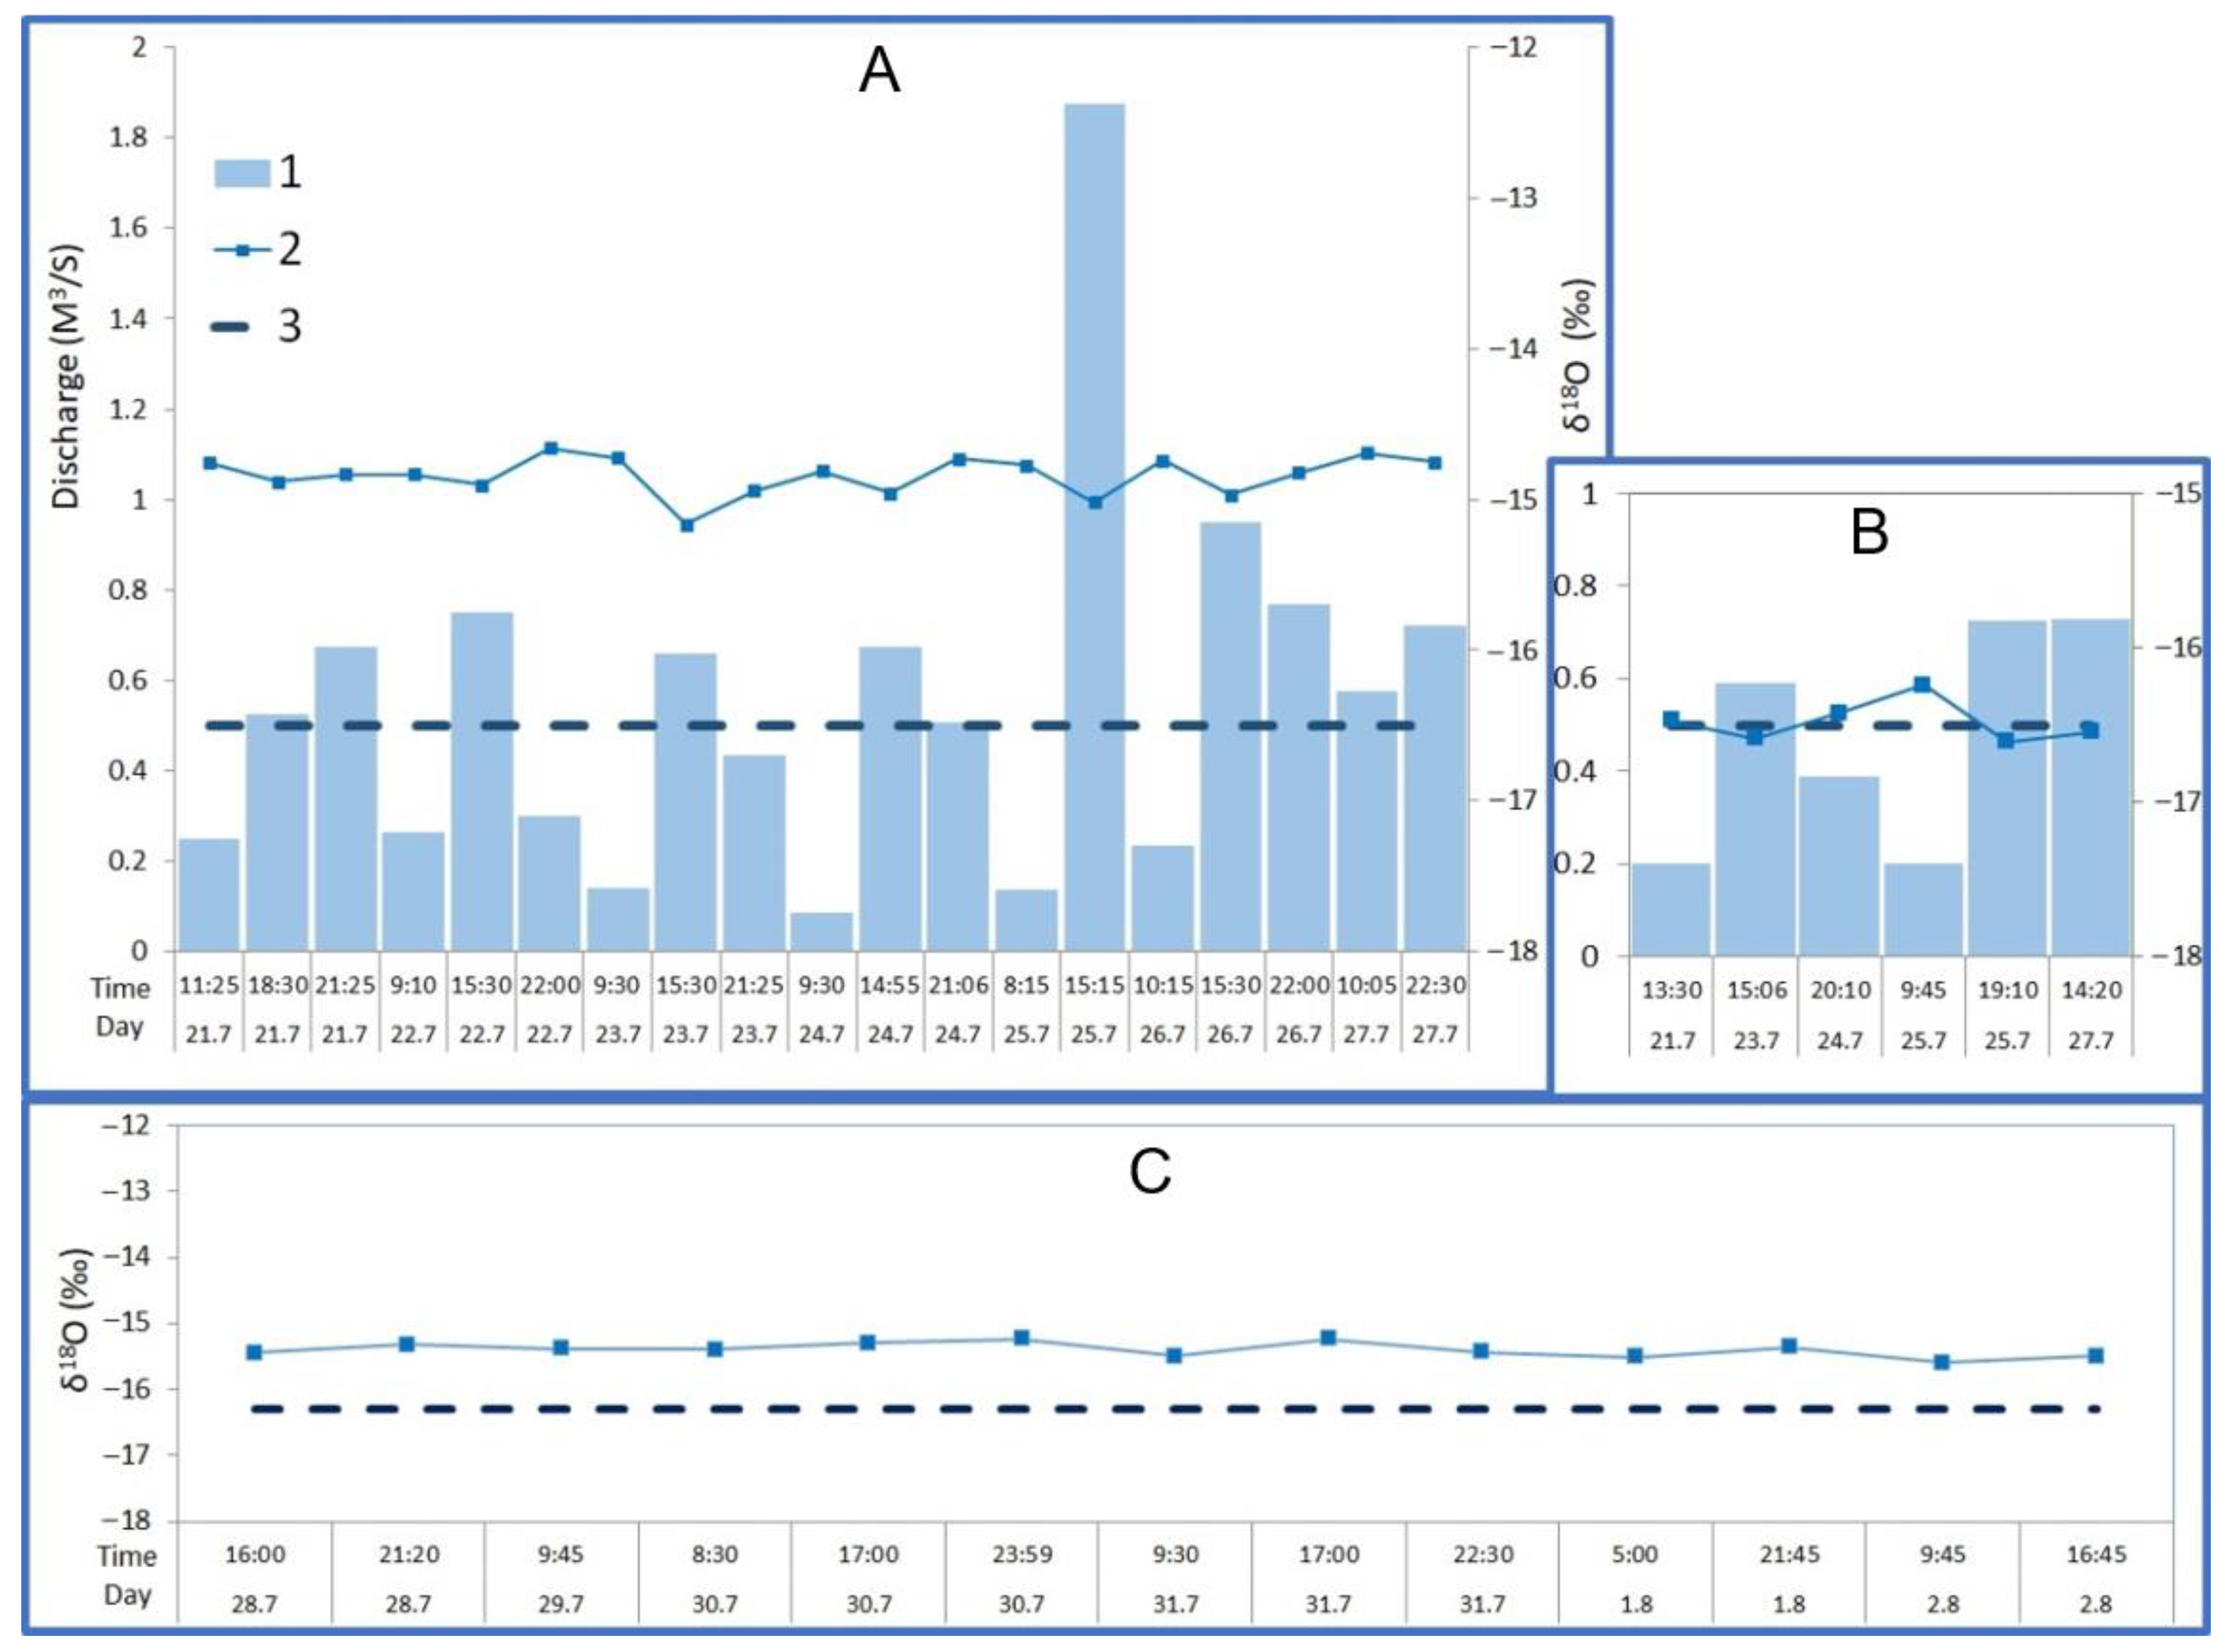
The variability of the isotopic values of river water at hydrological station No. 1, regardless of water discharge and time, was very small (Figure 2A). No significant diurnal variability in the isotopic values was found. Only a slight change of the isotopic composition (up to −15; −15.2) could be noted in the daytime. The increase in discharge was regularly observed in the daytime, and the daily discharge increased along with the increase of average daily temperature.
The situation at the hydrological station No. 2 near the edge of the glacier No. 7 (Figure 2B) was similar to the situation at station No. 1. The variability of δ18O values was also small, and the dependence between δ18O and discharge or air temperature was also not detected.
Isotopic values of melt water from No. 9 (Figure 2C) also remained stable at different times of the day (δ18O changed from −15.2 to −15.6). There was no trend towards changes in the isotopic composition with respect to time, which was typical for all three monitoring points.
The isotopic composition of precipitation was the heaviest among all the groups of samples (Average δ18O in 12 samples was −9.8), but its contribution to the formation of the runoff by the isotopic composition was not traced, because the isotopic composition of river water after precipitation remained unchanged. Precipitation did not change the isotopic content of river water due to the insignificant amount during the research period.

3.2. Isotopic Composition of Glacier Ice and Snow-Firn Layer

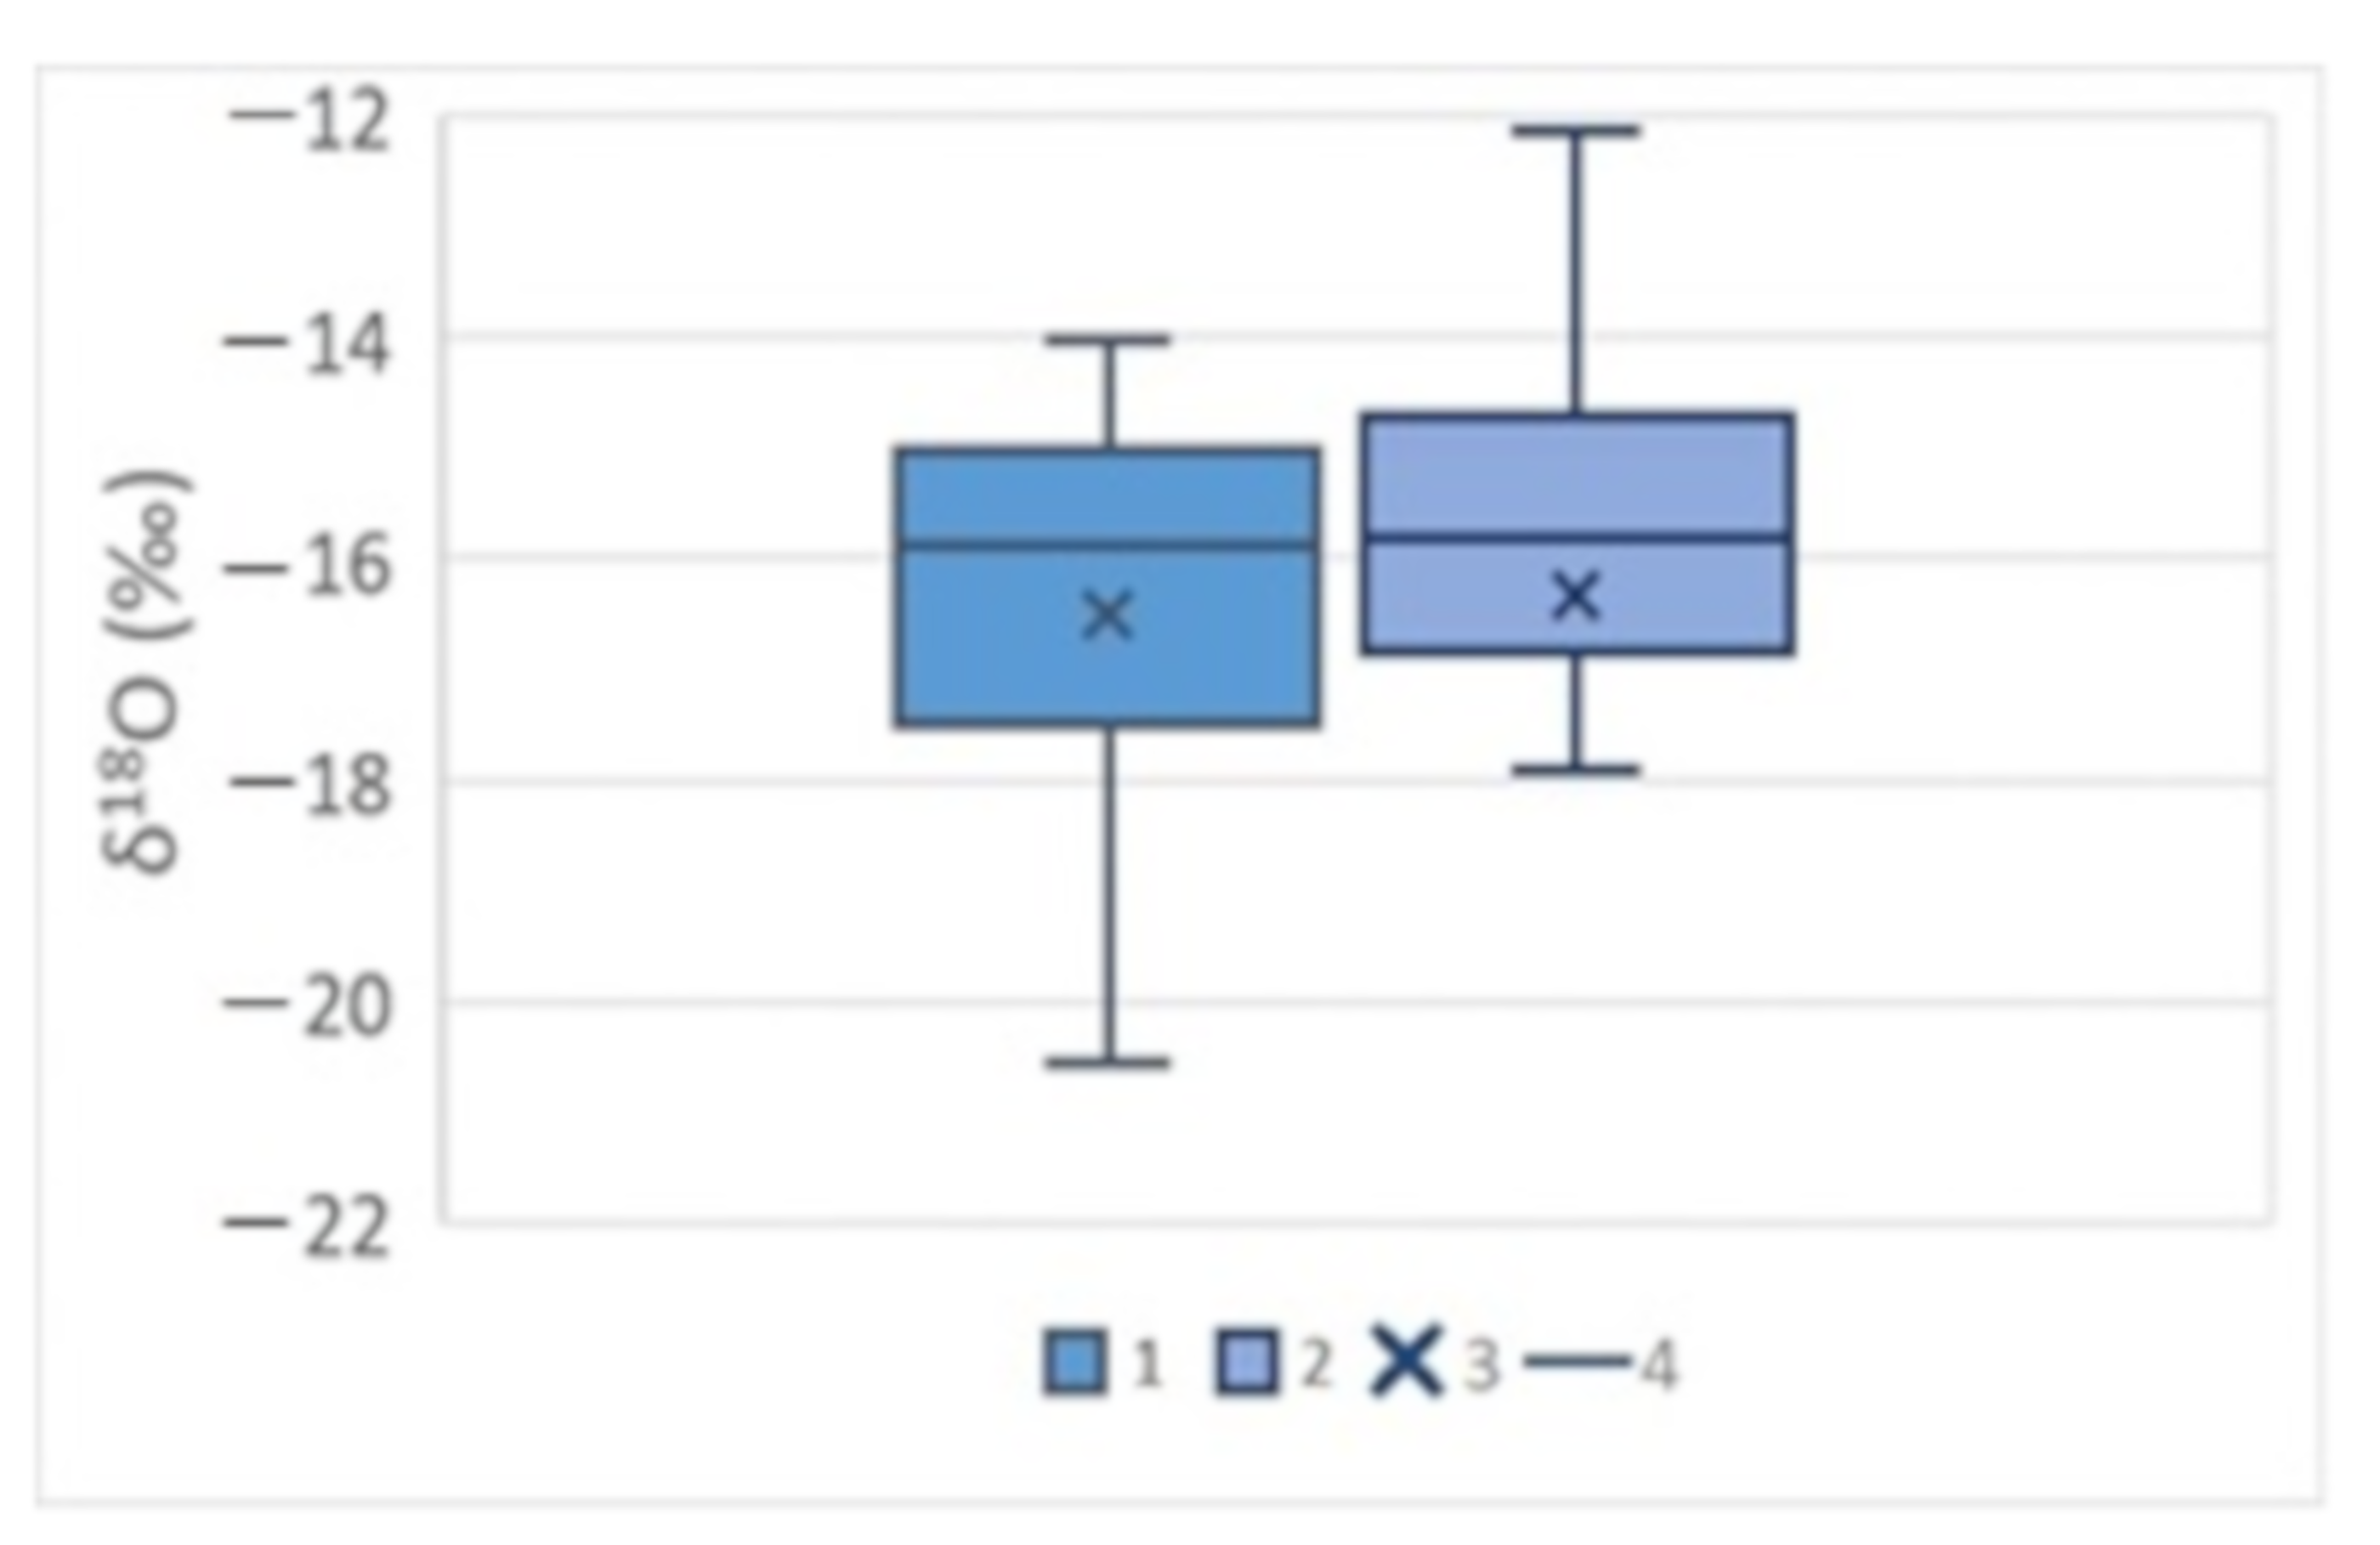
The average isotopic composition of ice on two studied glaciers was very close: −16.5‰ on glacier No. 7 and −16.3‰ on glacier No. 9. This shows that the average isotopic characteristics reflect the isotopic composition of glacial ice of the whole Tsambagarav glacial center, and can be used in further calculations. The average and median δ18O values of the ice of two glaciers practically coincided (Figure 3), even though there were lower values of δ18O among the samples on the glacier No. 7 than among the samples of the glacier No. 9.
No thick firn layer was formed in the zone of accumulation of glacier No. 7; accumulation of snow was mainly confined to the kars and cirques. The average δ18O for the snow pit on the Tsast-Ula mountain top was −12.6‰. The surface firn samples in other parts of the accumulation zone showed similar values.
The surface of snow and firn in the accumulation zone of the study area is formed by warm season precipitation, which melts during the ablation period. Glacier ice is mainly formed by spring or autumn precipitation. Therefore, isotopic composition of snow–firn thickness was different from the glacier ice.
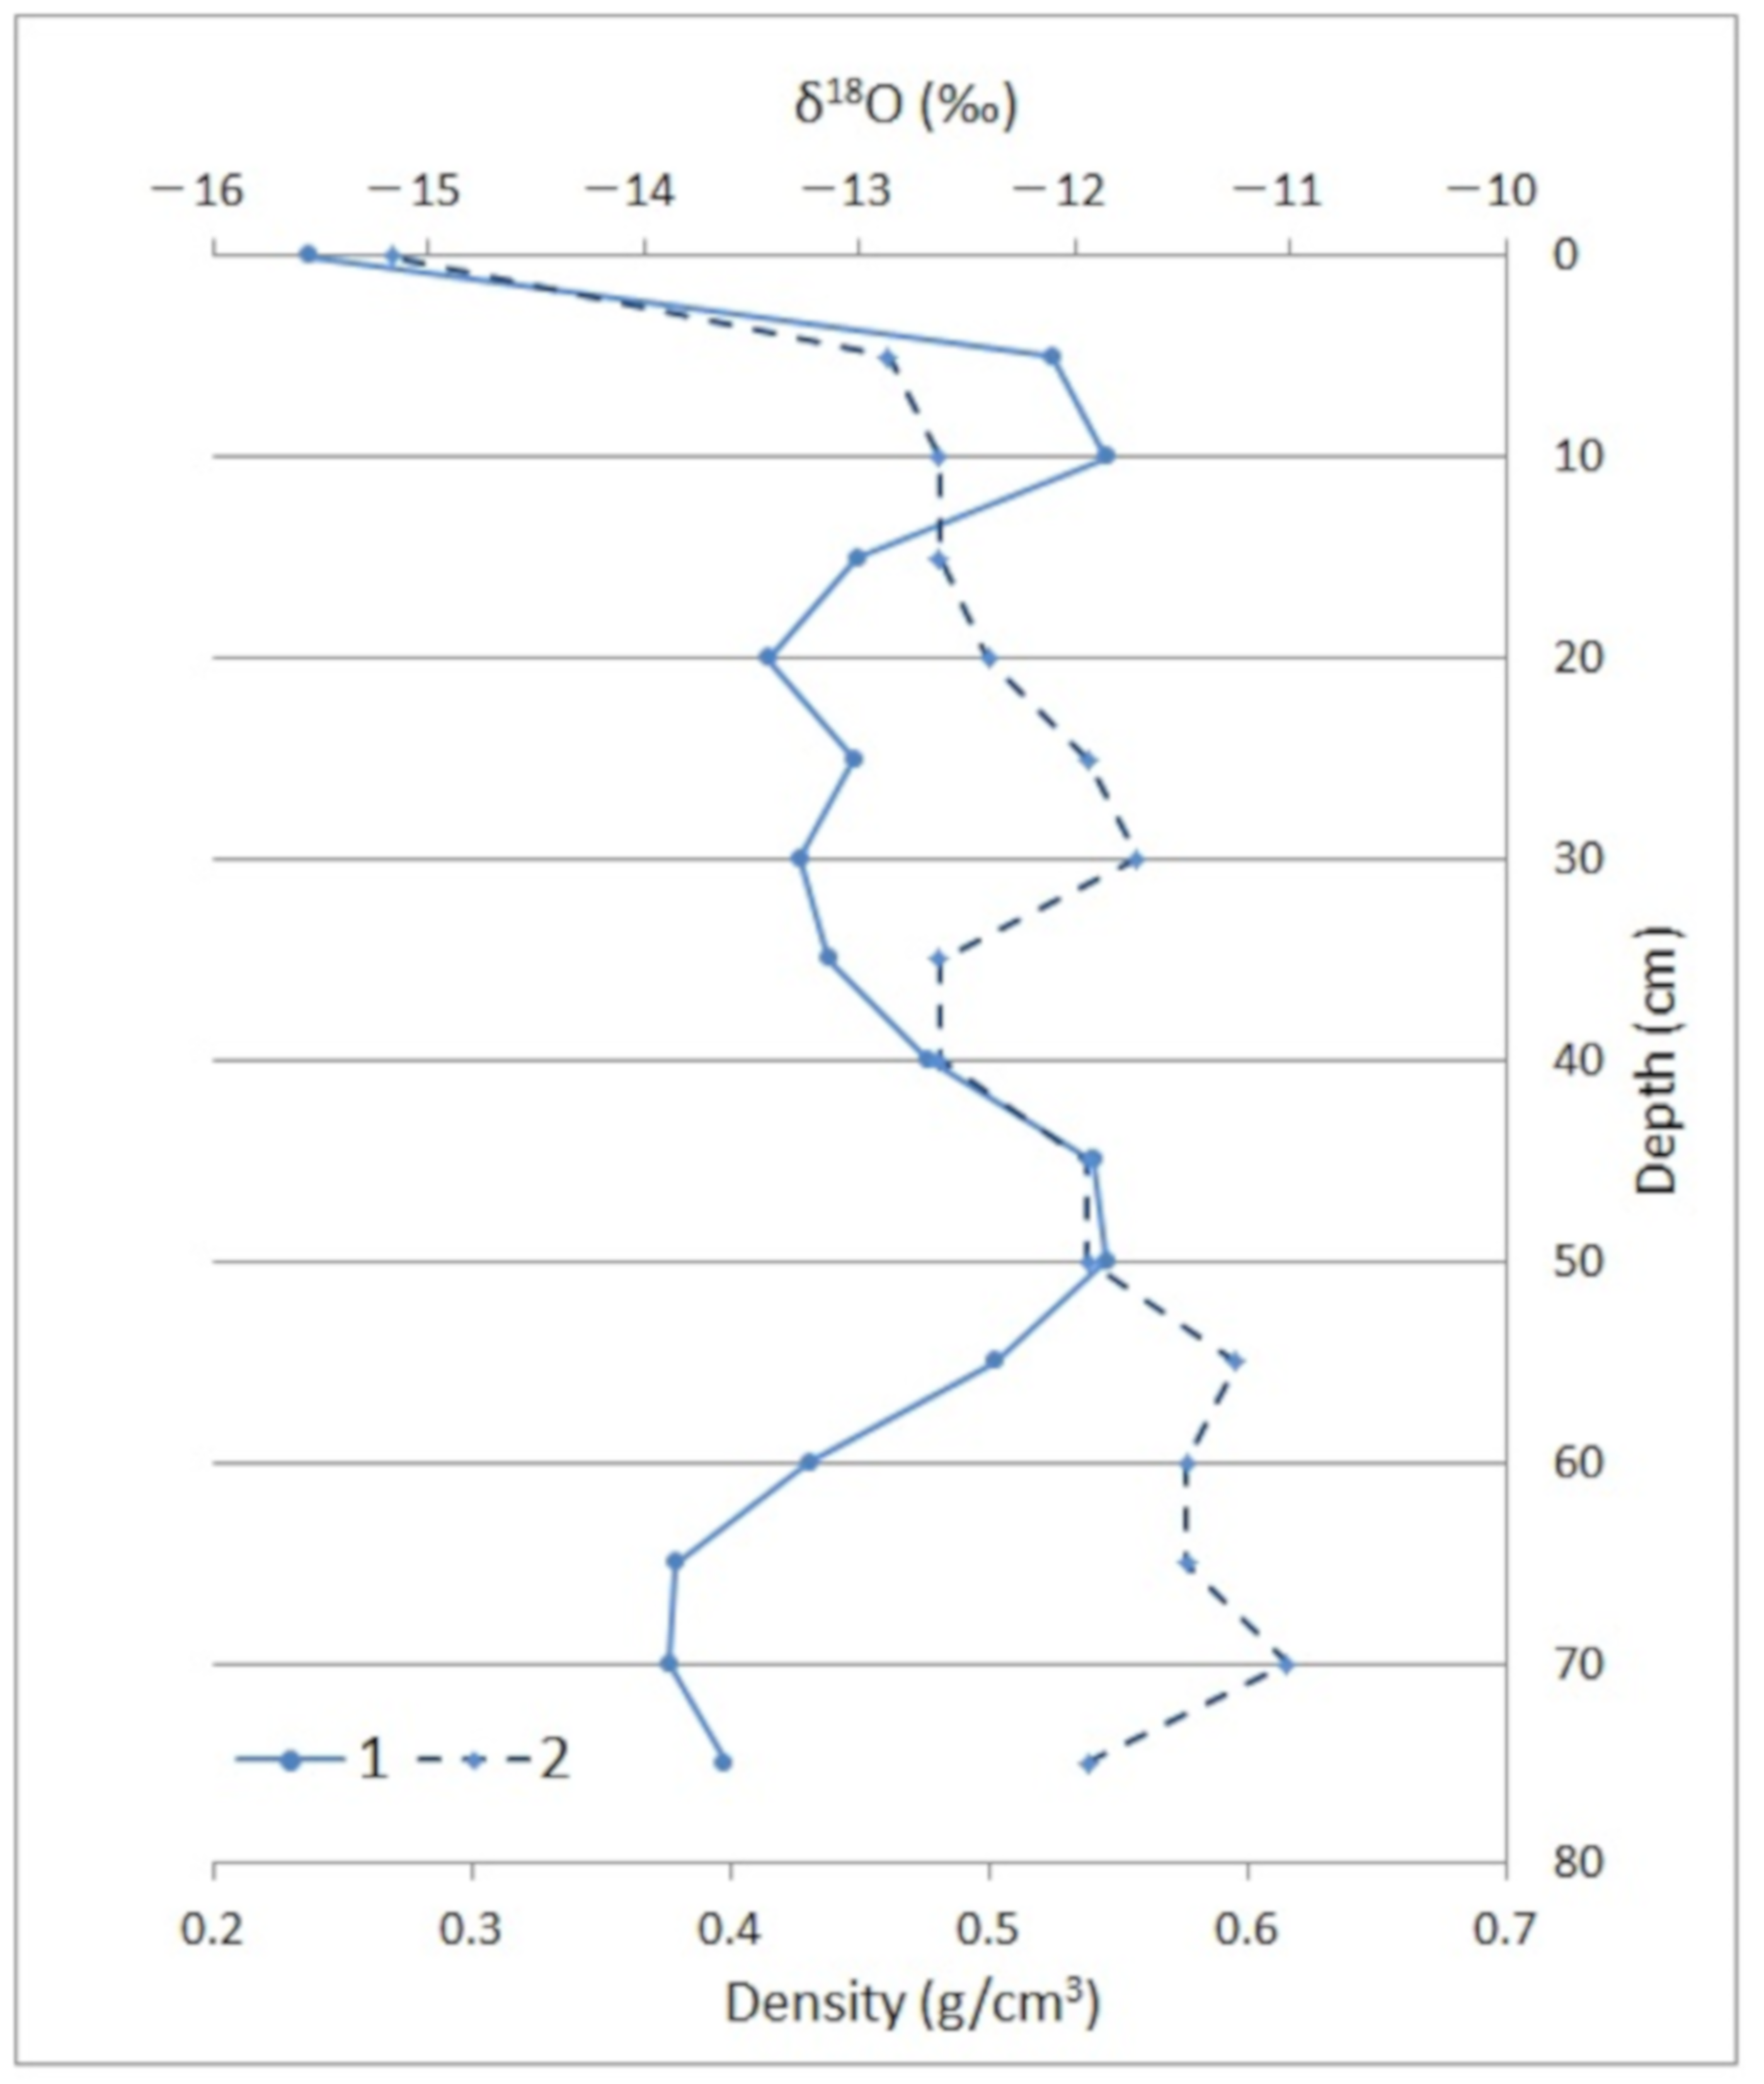
According to the results of the analysis of the samples collected at the snow pit of the flat summit glacier No. 55 (Figure 4), almost the entire snow–firn layer is composed of isotopically heavy snow, except for the top 5 cm of snow, in which the δ18O variation range was equal to 2.1‰.
The average value of δ18O in this pit was −13.0‰, which is close to δ18O in the accumulation zone of glacier No. 7. Annual layers cannot be distinguished, although, according to the ice core data [14], the annual accumulation for the period 1999–2009 was 335 mm w. e. [13]. The δ18O values allow attribution of all snow and firn to warm season precipitation.
Precipitation samples, since they were collected in July, naturally had the heaviest isotopic composition of the presented groups of samples (Table 2). Differences in the isotopic composition of the runoff-forming components (ice and snow) and in the isotopic composition of the water of various watercourses were also observable.

3.3. Isotopic Separation

As was mentioned in Section 2.3, hydrograph separation was made according to mixing Equation (2). In our study, the average isotopic composition of snow and firn from glaciers and the isotopic composition of glacier ice were taken as components. Since sampling of snow and firn in the accumulation zone of each glacier was not performed, the average value of the isotopic composition of snow and firn in the accumulation zone of glacier No. 7 was used for all three isotopic separation points. The isotopic composition of the water stream, for which isotopic separation was carried out, was taken as the resulting isotopic composition (Table 3).
After obtaining data on the isotopic composition of the runoff components, an isotopic separation was made for each isotopic composition monitoring point of the river water.
The results of the analysis show that the share of glacier ice and snow in the formation of runoff varied slightly, regardless of water flow. Glacial ice prevailed, but for the hydrological station No. 1, the proportion of snow and firn from the surface of the glacier was maximal across all monitoring points. Isotopic separation was also carried out for other isotopic composition monitoring points. For all three studied streams, the ratio of the runoff components varied (Table 4).

4. Discussion

The obtained isotopic analysis results provide us with data on the seasons of glacier ice formation and snow–firn layer accumulation on the surface of the glacier.
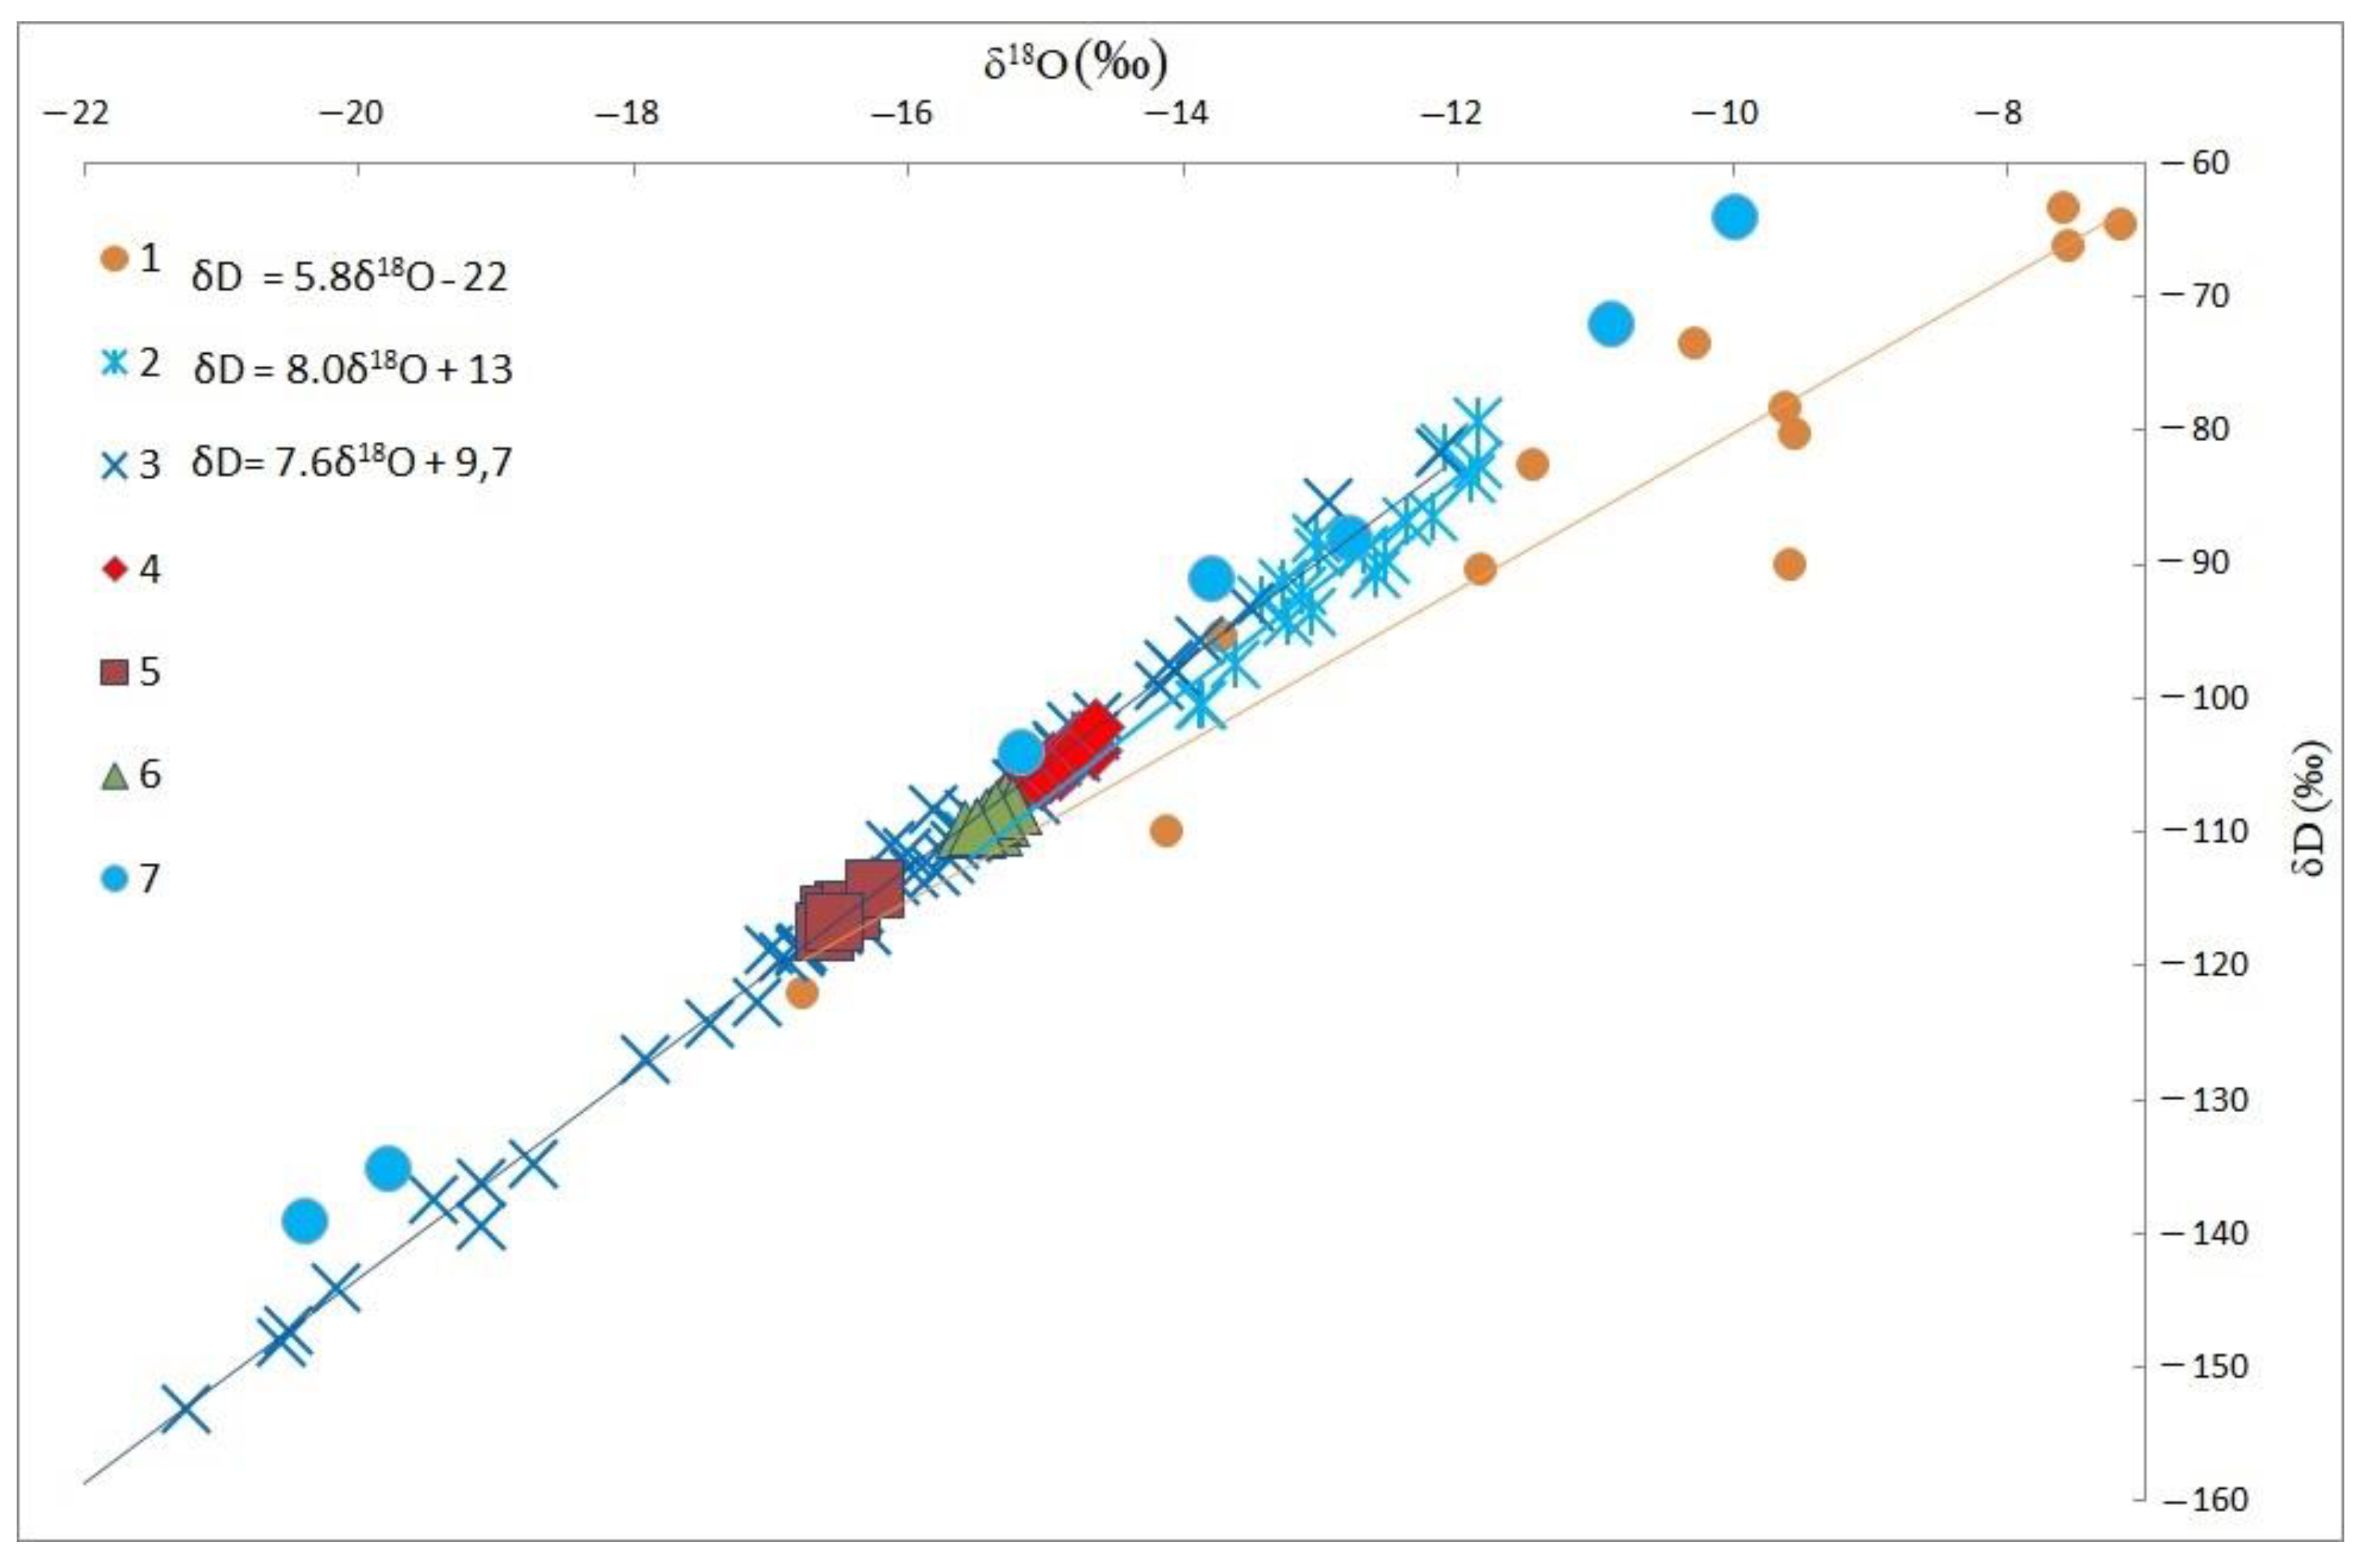
The differences between the isotopic composition of glacier ice and snow–firn layer are presented in Figure 5.
A comparison of the results to the model data on the isotopic composition of precipitation at the firn boundary [19,20,21] obtained from the OIPC (Online Isotopes in Precipitation Calculator) allows us to make conclusions regarding the season of precipitation prevailing in the formation of glacier ice and snow–firn layer.
Isotope analysis results show that the snow–firn mass is primarily composed of warm season precipitation. Wide variability in δ18O values indicates that glacial ice was formed from precipitation of all seasons. However, the average value of δ18O (−16.4) in ice samples indicated that precipitation of transitional seasons (spring-autumn) played the most important role in the nourishment of glaciers. We suggest that summer precipitation with heavy isotopic composition is not well-preserved in glacier ice, because the major part of that precipitation has time to melt till the end of ablation period.
The relationships between δ18O and δD for the main groups of samples may also provide us with extra information about precipitation. The slope of the regression line between δ18O and δD for snow, firn, and ice was close to the GMWL (δD = 8δ18O + 10). The slope, where the samples of precipitation were collected, was much lower. This implies a large impact of evaporation on the isotopic composition of the sampled precipitation, caused by rather high temperature and low relative humidity during the investigation period. Most likely, during the process of precipitation in liquid form, active evaporation caused isotopic fractionation and distorted the isotopic values. This is proven by low, in many cases negative, values of deuterium excess in the samples of atmospheric precipitation.
Based on the data about the isotopic content of water samples obtained at the hydrological stations, and considering the difference of isotopic abundance of runoff components, we can evaluate their contribution to the meltwater.
As was mentioned above, the variability of the isotopic composition of water at three hydrological stations was low. The absence of significant variations was observed in the isotopic composition of water, despite the changes in discharge over the observation period at all three sites. This means that despite the intensity of melting or water flow during the investigation period, the share of ice and snow from the surface of glaciers did not change in the meltwater. A change in the ratio of melt glacial and snow waters would be expressed in more significant variations in the isotopic composition of melt water.
However, the average isotopic composition of water at two hydrological stations and in the stream from glacier No. 9 differed significantly. These data allow conclusions to be drawn regarding different shares of snow–firn layer and glacier ice in the formation of melt water. It is worth noting that this ratio was different for the streams originating from one glacier as well.
Differences in the contribution of snow and ice in melt water are explained by the origin of the analyzed streams. The water flow, where hydrological station No. 1 was organized, originates from above the edge of the glacier, and, accordingly, it is fed to a greater degree with firn and snow from the accumulation zone. Consequently, the average proportion of snow from the surface of the glacier there was 42%. The stream at the edge of glacier No. 7 (Hydrological station No. 2) begins at the snow-free tongue. Accordingly, the proportion of glacial ice in its nutrition is almost always 100%. Melted snow and firn enter the stream, which starts above the edge of the glacier (Hydrological station No. 1).
Several measurements of discharge and isotopic composition at two hydrological stations were carried out simultaneously, which allowed calculation of the share of the runoff components for both streams from glacier No. 7. The calculated share of snow and firn from the surface of glacier No. 7 eventually varied from 18% to 31%, with an average of 23%.
All meltwater from glacier No. 9 forms a single stream. The share of snow and firn on the surface of the glacier in the supply of melt water did not exceed 30%, with an average of 24%. The share of the snow–firn layer in the nourishment of the stream from this glacier was equal to the share of melt water from glacier No. 7.
According to the above presented results, for large valley glaciers, the contribution of melted snow water from the surface of glaciers in the middle of the ablation season varies between 20% and 30%. Therefore, ancient glacial ice plays a significant role in the formation of the water balance of the territory. A similar investigation at the northern slope of Tavan-Bogd mountain massif (the border between Russia, China, and Mongolia) showed that the contribution of melted seasonal snow in glacier runoff at this massif was more significant than at the Tsambagarav [22].
These results were obtained only for the mid-ablation season. Of course, during ablation, the proportions of runoff components change. Conducting more long-term and detailed isotope studies of the glacier runoff of the Tsambagarav massif is our next aim.
This research also aimed to identify the type of ice formation for main glaciers of the massif. The glaciers of the South-Eastern Altai are supposed to exist primarily due to the supply of cold and congelation ice formation; thus, the superimposed ice plays the most important role in the nourishment of the glacier [23]. The isotopic composition of glacial ice can provide information on the prevailing processes of ice formation.
If the ice is formed from precipitation, the slope of the regression line between δ18O and δD is close to the slope of the local meteoric water line, which reflects the relationship between δ18O and δD in local precipitation [24].
If the values of δ18O and δD are related by a coefficient close to the local meteoric water line (LMWL), then, on the δD d-excess diagram, the values of deuterium excess will be located without a pronounced trend. In case of congelation formation of ice, the slope in the δ18O-δD diagram will be significantly lower than the slope of the local meteoric water line, and, as a result, the inverse dependence of d-excess on δD will be expressed on the dexs versus δD diagram [24].
The local line of meteoric water for the precipitation accumulated on the glacier was calculated for all snow and firn samples taken over 2 years (2016–2017). The LMWL almost coincided with GMWL, and had the form δD = 8 δ18O + 13 with R2 = 0.999.
The slope of the linear relationship between δ18O and δD for all glacier ice samples taken on the territory of the Tsambagarav massif was insignificant—less than LMVL: δD = 7.6·δ18O + 9.7 with R2 = 0.999. There was also a weak negative correlation between δD and deuterium excess: Dexs = −0.04 δD + 10.7.
Isotopic analysis of the surface glacier ice samples may indicate the insignificant contribution of congelation ice formation to the nourishment of glaciers of the massif, but currently, available data are not enough to evaluate this contribution accurately. Besides, superimposed ice is not the basis for the nourishment of the glaciers of the Tsambagarav massif, which is indicated by the fact that the δ18O-δD slope differed slightly from LMWL, and the inverse dependence of deuterium excess on δD was poorly expressed. Study of the glaciers of the Polar Urals has shown that, with full prevalence of congelation ice formation, the differences between ice and LMWL are more significant, and the negative trend δD - d - excess is more pronounced [24].

5. Conclusions

According to the results of isotope studies on the Tsambagarav massif in 2016 and 2017, significant differences in the isotopic composition of the main runoff components were identified, which allowed isotopic separation of the flow for the main watercourses to be carried out.
The ratio of runoff components was different for the streams and rivers of the Tsambagarav massif. The proportion of seasonal snow from the surfaces of two largest glaciers of the massif in the middle of the ablation season only changed from 20% to 30%, which shows the important role of ancient glacier ice in feeding the massif rivers. Consequently, further reduction of glaciation caused by global climate change will significantly affect the water balance of the study area.
The isotopic composition of glacial ice proves that its nourishment primarily comes from precipitation of transitional seasons. Due to climate aridity, congelation ice formation probably takes part in the glacier alimentation, which was slightly reflected in the isotopic composition of surface samples of glacier ice, but at this stage we cannot with a high degree of confidence estimate the role of superimposed ice.

Author Contributions

Conceptualization, A.A.E., I.V.T. and K.V.C.; methodology, A.A.E., I.V.T. and D.V.B.; software, T.A.A.; validation, A.N.V. and I.V.T.; formal analysis, A.N.V.; investigation, D.V.B., D.A.G., I.V.T., N.B.S.; resources, A.A.E.; data curation, A.A.E. and A.N.V.; writing—original draft preparation, D.V.B.; writing—review and editing, D.A.G. and A.A.E.; visualization, N.B.S. and T.A.A.; supervision, K.V.C.; project administration, D.A.G., funding acquisition, D.A.G.

Funding

This research was funded by Russian Foundation for Basic Research (RFBR), grant number №19-05-00535.

Acknowledgments

RFBR 19-05-00535 Natural catastrophes and transformation of the landscapes of the southeastern Altai and northwestern Mongolia in the period from the maximum of the last glaciation.

Conflicts of Interest

The authors declare no conflict of interest.

References

  1. Behrens, H.; Moser, H.; Oerter, H.; Rauert, W.; Stichler, W.; Ambach, W. Models for the runoff from a glaciated catchment area using measurements of environmental isotope contents. In Proceedings of the International Atomic Energy Agency Symposium in Neuherberg, International Atomic Energy Agency, Vienna, Austria, 19–23 June 1978. [Google Scholar]
  2. Cable, J.; Ogle, K.; Williams, D. Contribution of glacier meltwater to streamflow in the Wind River Range, Wyoming, inferred via a Bayesian mixing model applied to isotopic measurements. Hydrol. Process. 2011, 25, 2228–2236. [Google Scholar] [CrossRef]
  3. Ohlanders, N.; Rodriguez, M.; McPhee, J. Stable water isotope variation in a Central Andean watershed dominated by glacier and snowmelt. Hydrol. Earth Syst. Sci. 2013, 17, 1035–1050. [Google Scholar] [CrossRef] [Green Version]
  4. Williams, M.W.; Wilson, A.; Tshering, D.; Thapa, P.; Kayastha, R.B. Using geochemical and isotopic chemistry to evaluate glacier melt contributions to the Chamkar Chhu (river), Bhutan. Ann. Glaciol. 2016, 57, 339–348. [Google Scholar] [CrossRef] [Green Version]
  5. Wilson, A.M.; Williams, M.W.; Kayastha, R.B. Using hydrochemistry data to constrain the role os snow and ice meltwater in the Langtang Valley, Nepal. In Proceedings of the Western Snow Conference, Durango, CO, USA, 14–17 April 2014; pp. 155–158. [Google Scholar]
  6. Vasil’chuk, Y.K.; Rets, E.P.; Chizhova, J.N.; Tokarev, I.V.; Frolova, N.L.; Budantseva, N.A.; Kireeva, M.B.; Loshakova, N.A. Hydrograph separation of the Dzhankuat River, North Caucasus, with the use of isotope methods. Water Resour. 2016, 43, 847–861. [Google Scholar] [CrossRef]
  7. Chizhova, Y.N.; Budantseva, N.A.; Rets, E.P.; Loshakova, N.A.; Popovnin, V.V.; Vasilchuk, Y.K. Isotopic variation of runoff from the Dzhan Kuat glacier (Central Caucasus). Mosc. Univ. Bull. Ser. 5 Geogr. 2014, 6, 48–56. [Google Scholar]
  8. Chizhova, Y.N.; Rets, E.P.; Vasil’chuk, Y.K.; Tokarev, I.V.; Budantseva, N.A.; Kireeva, M.B. Two approaches to hydrograph separation of the glacial river runoff using isotopic methods. Ice Snow 2016, 56, 161–168. (In Russian) [Google Scholar] [CrossRef]
  9. Sun, C.; Li, W.; Chen, Y.; Li, X.; Yang, Y. Isotopic and hydrochemical composition of runoff in the Urumqi River, Tianshan Mountains, China. Environ. Earth Sci. 2015, 74, 1521–1537. [Google Scholar]
  10. Zhao, L.; Yin, L.; Xiao, H.; Cheng, G.; Zhou, M.; Yang, Y.; Li, C.; Zhou, J. Isotopic evidence for the moisture origin and composition of surface runoff in the headwaters of the Heihe River basin. Chin. Sci. Bull. 2011, 56, 406–415. [Google Scholar] [CrossRef] [Green Version]
  11. Li, Z.; Feng, Q.; Liu, W.; Wang, T.; Guo, X.; Li, Z.; Gao, Y.; Pan, Y.; Guo, R.; Jia, B.; et al. The stable isotope evolution in Shiyi glacier system during the ablation period in the north of Tibetan Plateau, China. Quat. Int. 2015, 380–381, 262–271. [Google Scholar]
  12. Wang, C.; Dong, Z.; Qin, X.; Zhang, J.; Du, W.; Wu, J. Glacier meltwater runoff process analysis using δD and δ18O isotope and chemistry at the remote Laohugou glacier basin in western Qilian Mountains, China. J. Geogr. Sci. 2016, 26, 722–734. [Google Scholar] [CrossRef]
  13. Schotterer, U.; Fröhlich, K.; Gäggeler, H.W.; Sandjordj, S.; Stichler, W. Isotope records from mongolian and alpine ice cores as climate indicators. Clim. Chang. 1997, 36, 519–530. [Google Scholar] [CrossRef]
  14. Herren, P.A.; Eichler, A.; Machguth, H.; Papina, T.; Tobler, L.; Zapf, A.; Schwikowski, M. The onset of Neoglaciation 6000 years ago in western Mongolia revealed by an ice core from the Tsambagarav mountain range. Quat. Sci. Rev. 2013, 69, 59–68. [Google Scholar] [CrossRef]
  15. Ganyushkin, D.A.; Otgonbayar, D.; Chistyakov, K.V.; Kunaeva, E.P.; Volkov, I.V. Recent glacierization of the Tsambagarav ridge (North-Western Mongolia) and its changes since the Little Ice Age maximum. Ice Snow 2016, 56, 437–452. [Google Scholar] [CrossRef]
  16. Kadota, T.; Gombo, D.; Kalsan, P.; Namgur, D.; Ohata, T. Glaciological research in the Mongolian Altai, 2003–2009. Bull. Glaciol. Res. 2011, 29, 41–50. [Google Scholar] [CrossRef]
  17. Ganyushkin, D.A. Glacigenic Complexes of Sharply Continental Area of North-West Inner Asia; Saint Petersburg State University: Saint Petersburg, Russia, 2015. [Google Scholar]
  18. Craig, H. Isotopic Variations in Meteoric Waters. Science 1961, 133, 1702–1703. [Google Scholar] [CrossRef] [PubMed]
  19. Bowen, G.J. The Online Isotopes in Precipitation Calculator. Version X.X. Available online: http://www.waterisotopes.org (accessed on 4 April 2019).
  20. Bowen, G.J.; Revenaugh, J. Interpolating the isotopic composition of modern meteoric precipitation. Water Resour. Res. 2003, 39. [Google Scholar] [CrossRef]
  21. AEA/WMO (2015). Global Network of Isotopes in Precipitation. The GNIP Database. Available online: https://www.iaea.org/services/networks/gnip (accessed on 4 April 2019).
  22. Bantsev, D.V.; Ganyushkin, D.A.; Chistyakov, K.V.; Ekaykin, A.A.; Tokarev, I.V.; Volkov, I.V. Formation of glacier runoff on the northern slope of Tavan Bogd mountain massif based on stable isotopes data. Ice Snow. 2018, 58, 333–342. [Google Scholar] [CrossRef]
  23. Sheinkman, V.S. Glaciation in the high mountains of siberia. In Developments in Quaternary Sciences; Elsevier: Amsterdam, The Netherlands, 2011; Volume 15, ISBN 9780444534477. [Google Scholar]
  24. Vasil’chuk, Y.K.; Chizhova, J.N.; Budantseva, N.A.; Vasil’chuk, A.C.; Oblogov, G.E. Stable isotope composition of snow-patches and glaciers in the polar urals. Mosc. Univ. Bull. Ser. 5 Geogr. 2018, 1, 81–89. (In Russian) [Google Scholar]
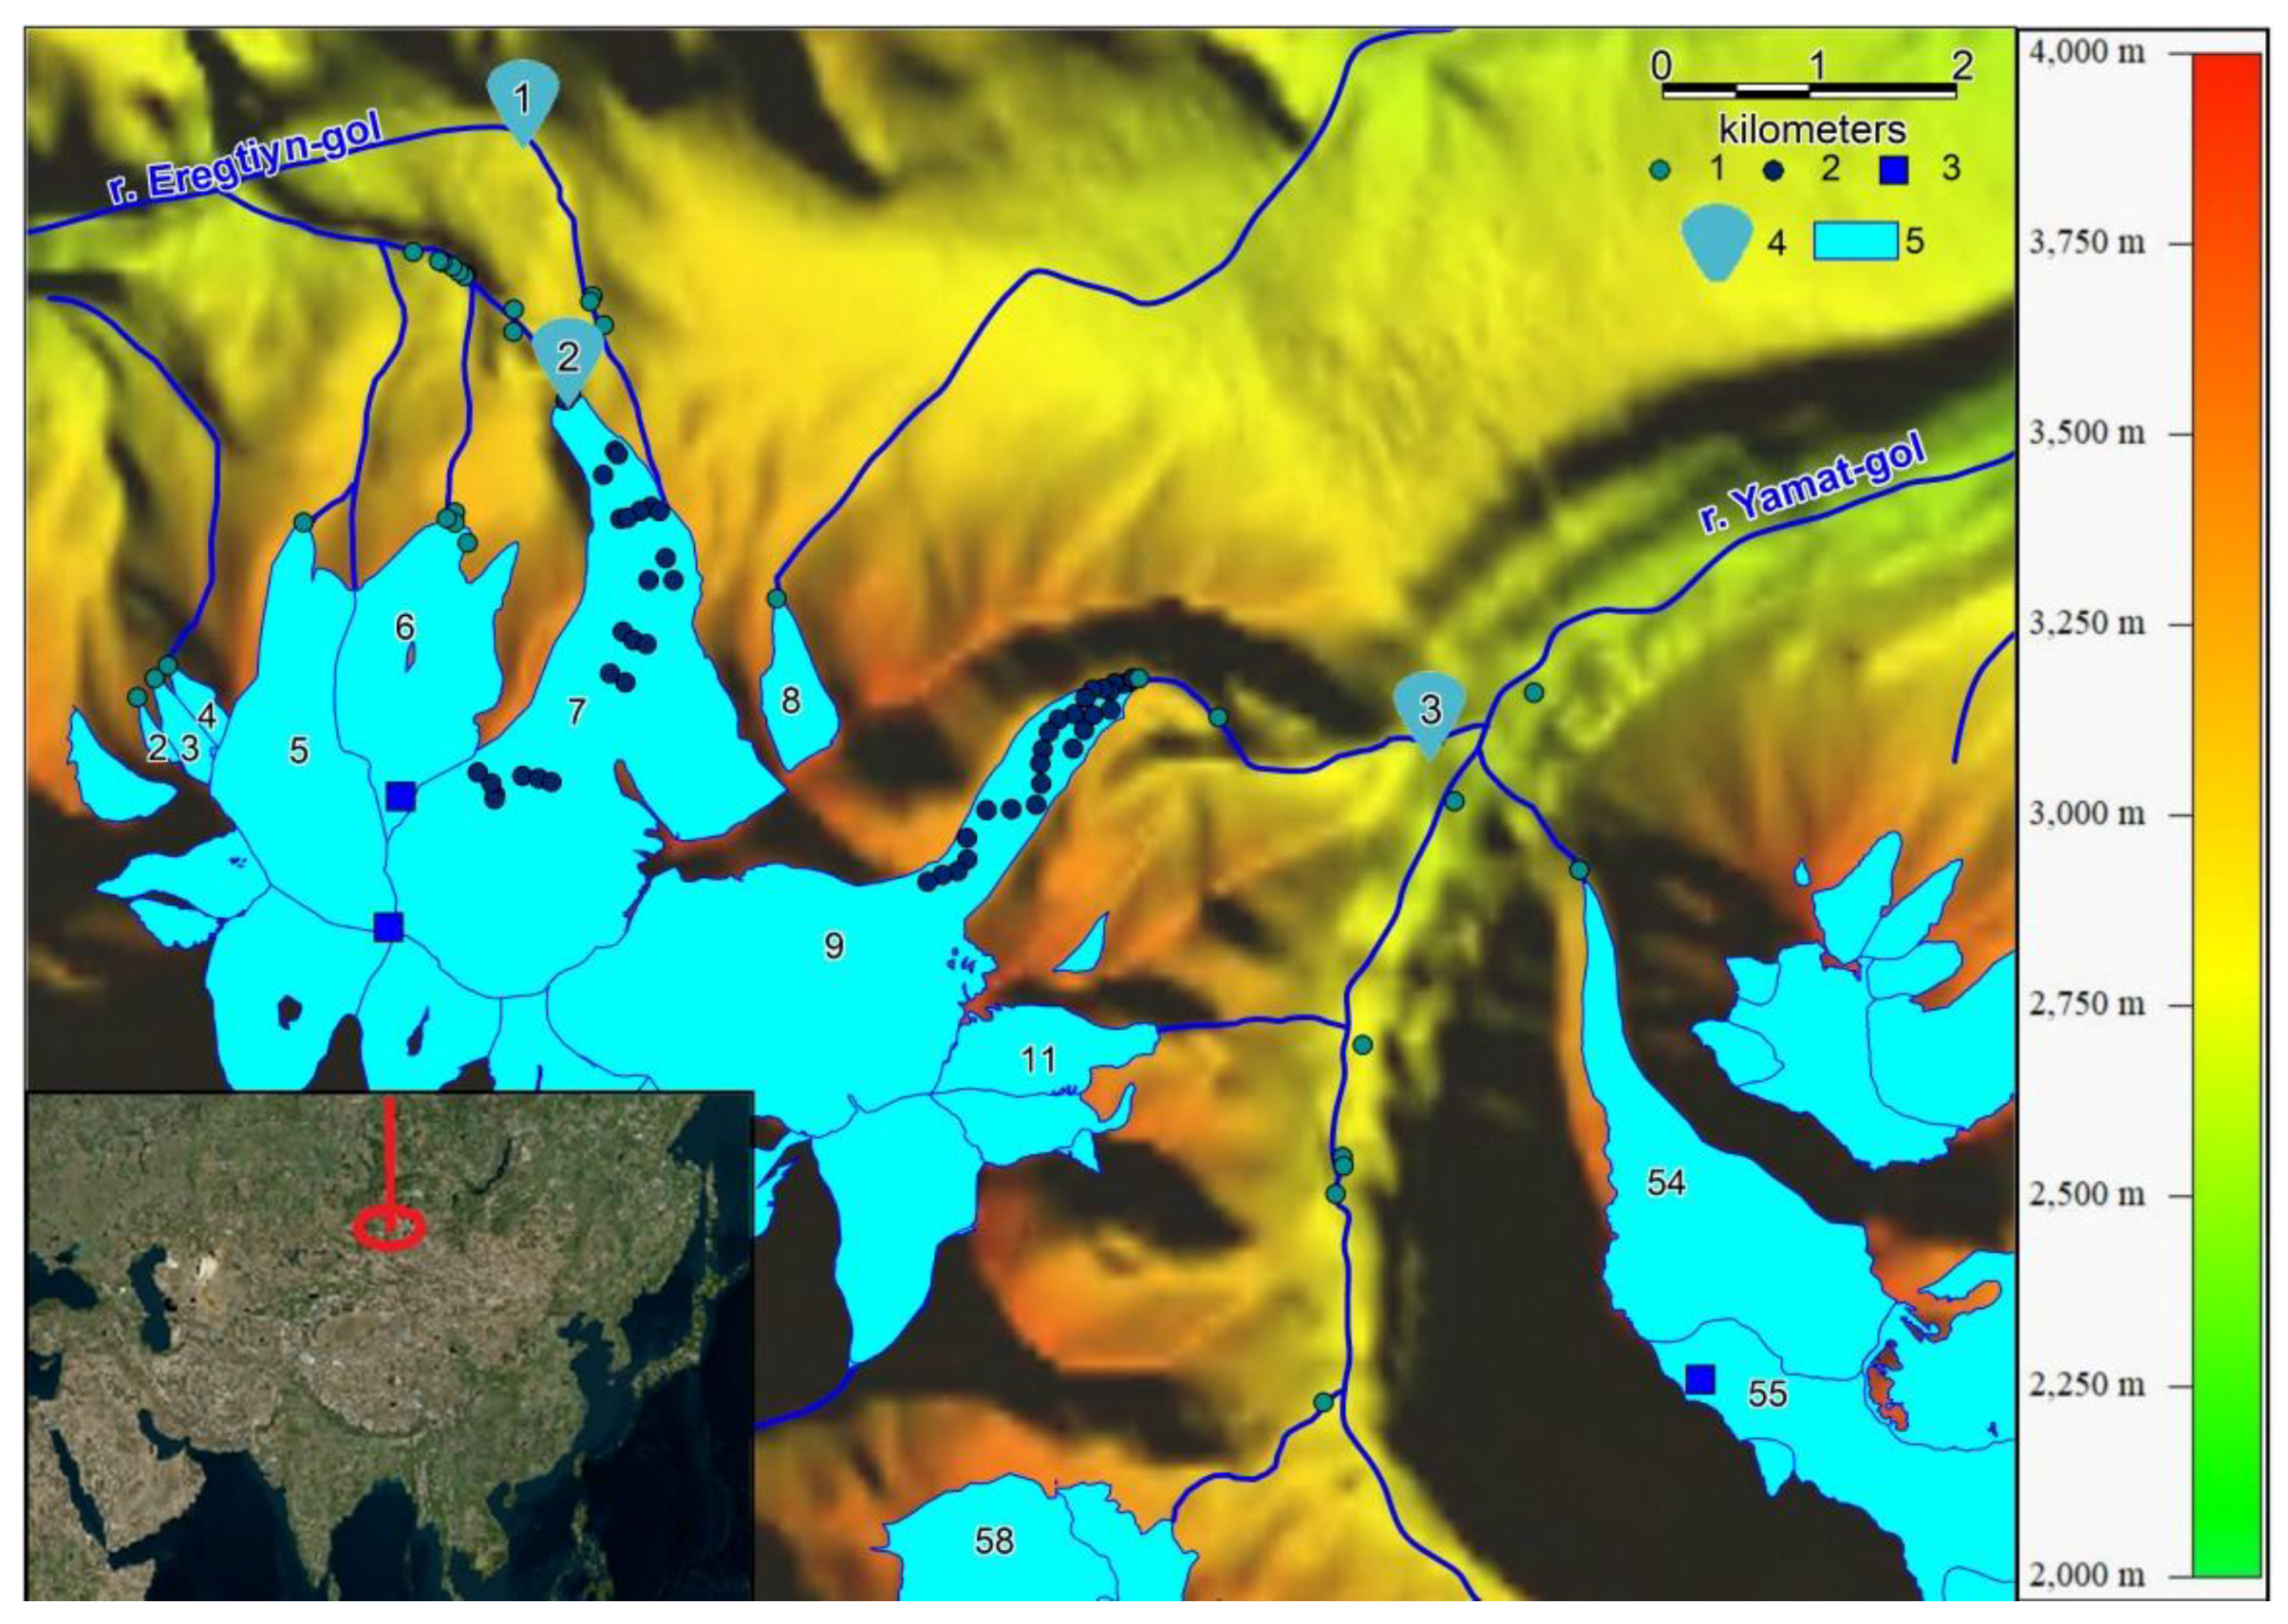
Figure 1. Position of the sampling sites in 2017. Sampling sites: 1—Water from rivers, 2—glacier ice, 3—snow and firn; 4—hydrological and isotopic composition monitoring stations, 5—present glaciers (glacier numbers are indicated).
Geosciences 09 00297 g001
Figure 2. Water discharge and isotopic water composition at Hydrological station No. 1 (A), HS No. 2 (B), and δ18O changes for the melt water near the glacier No. 9 (C). 1—Discharge, 2—Isotopic composition of water, 3—average isotopic composition of ice.
Geosciences 09 00297 g002
Figure 3. Box plot of glacier ice isotopic composition. 1—Glacier No.7, 2—Glacier No.9, 3—mean, 4—median.
Geosciences 09 00297 g003
Figure 4. Isotopic composition of snow and firn on dome-shaped glacier No. 55. 1—δ18O, 2—Density.
Geosciences 09 00297 g004
Figure 5. Relationship between δ18O and δD for the main groups of samples. 1—Precipitation, 2—Snow and firn, 3—Ice, 4—Water from hydrological station No. 1, 5—Water from hydrological station No. 2, 6—Stream from glacier No. 9, Model values of the isotopic composition of precipitation on ELA (number-month number) [19,20,21].
Geosciences 09 00297 g005
Table 1. The isotopic composition of melt water from the glaciers in July 2016 and July 2017. HS—Hydrological station.
Glacier No. (Figure 1)δ18O July 2016 (‰)δ18O July 2017 (‰)
54-−14.8
11-−15.2
9-−15.4
8−13.9−14.5
7 (HS2)−15.9−16.5
7 (HS1)−14.7−14.8
6−14.8−15.0
5−14.9−14.8
4-−14.2
3-−14.4
2-−13.5
Table 2. Average isotopic composition of different groups of samples.
Sampling PointAverage δ18OStandard DeviationNumber of Samples Measured
Hydrological station No. 1−14.80.124
Hydrological station No. 2−16.50.16
Stream from glacier No. 9−15.40.115
Glacier ice−16.42.651
Snow–firn layer−12.90.921
Precipitation−9.82.912
Table 3. The values of the variables of the isotopic balance equation used in isotope separation.
Sampling Pointδ18O of ice ±2SEM
(First Component)
δ18O of Snow/Firn ±2SEM
(Second Component)
Range of δ18O of Stream
(Resulting Composition)
±2SEM
Hydrological station No. 1−16.5 ± 0.7−12.6 ± 0.3−14.8 ± 0.1
Hydrological station No. 1−16.5 ± 0.7−12.6 ± 0.3−16.5 ± 0.2
Stream from glacier No. 1−16.3 ± 1.3−12.6 ± 0.3−15.4 ± 0.1
Table 4. The shares of snow meltwater according to the results of isotope separation.
Sampling PointShare of Snow/Firn Meltwater (%)
Hydrological station No. 142 ± 7
Hydrological station No. 20 + 10
Stream from glacier No. 924 ± 14