The Distribution and Prediction of Summer Near-Surface Water Temperatures in Lakes of the Coterminous United States and Southern Canada


Abstract
1. Introduction
2. Materials and Methods
2.1. United States Lakes
2.2. Canadian Lakes
2.3. Data Analyses
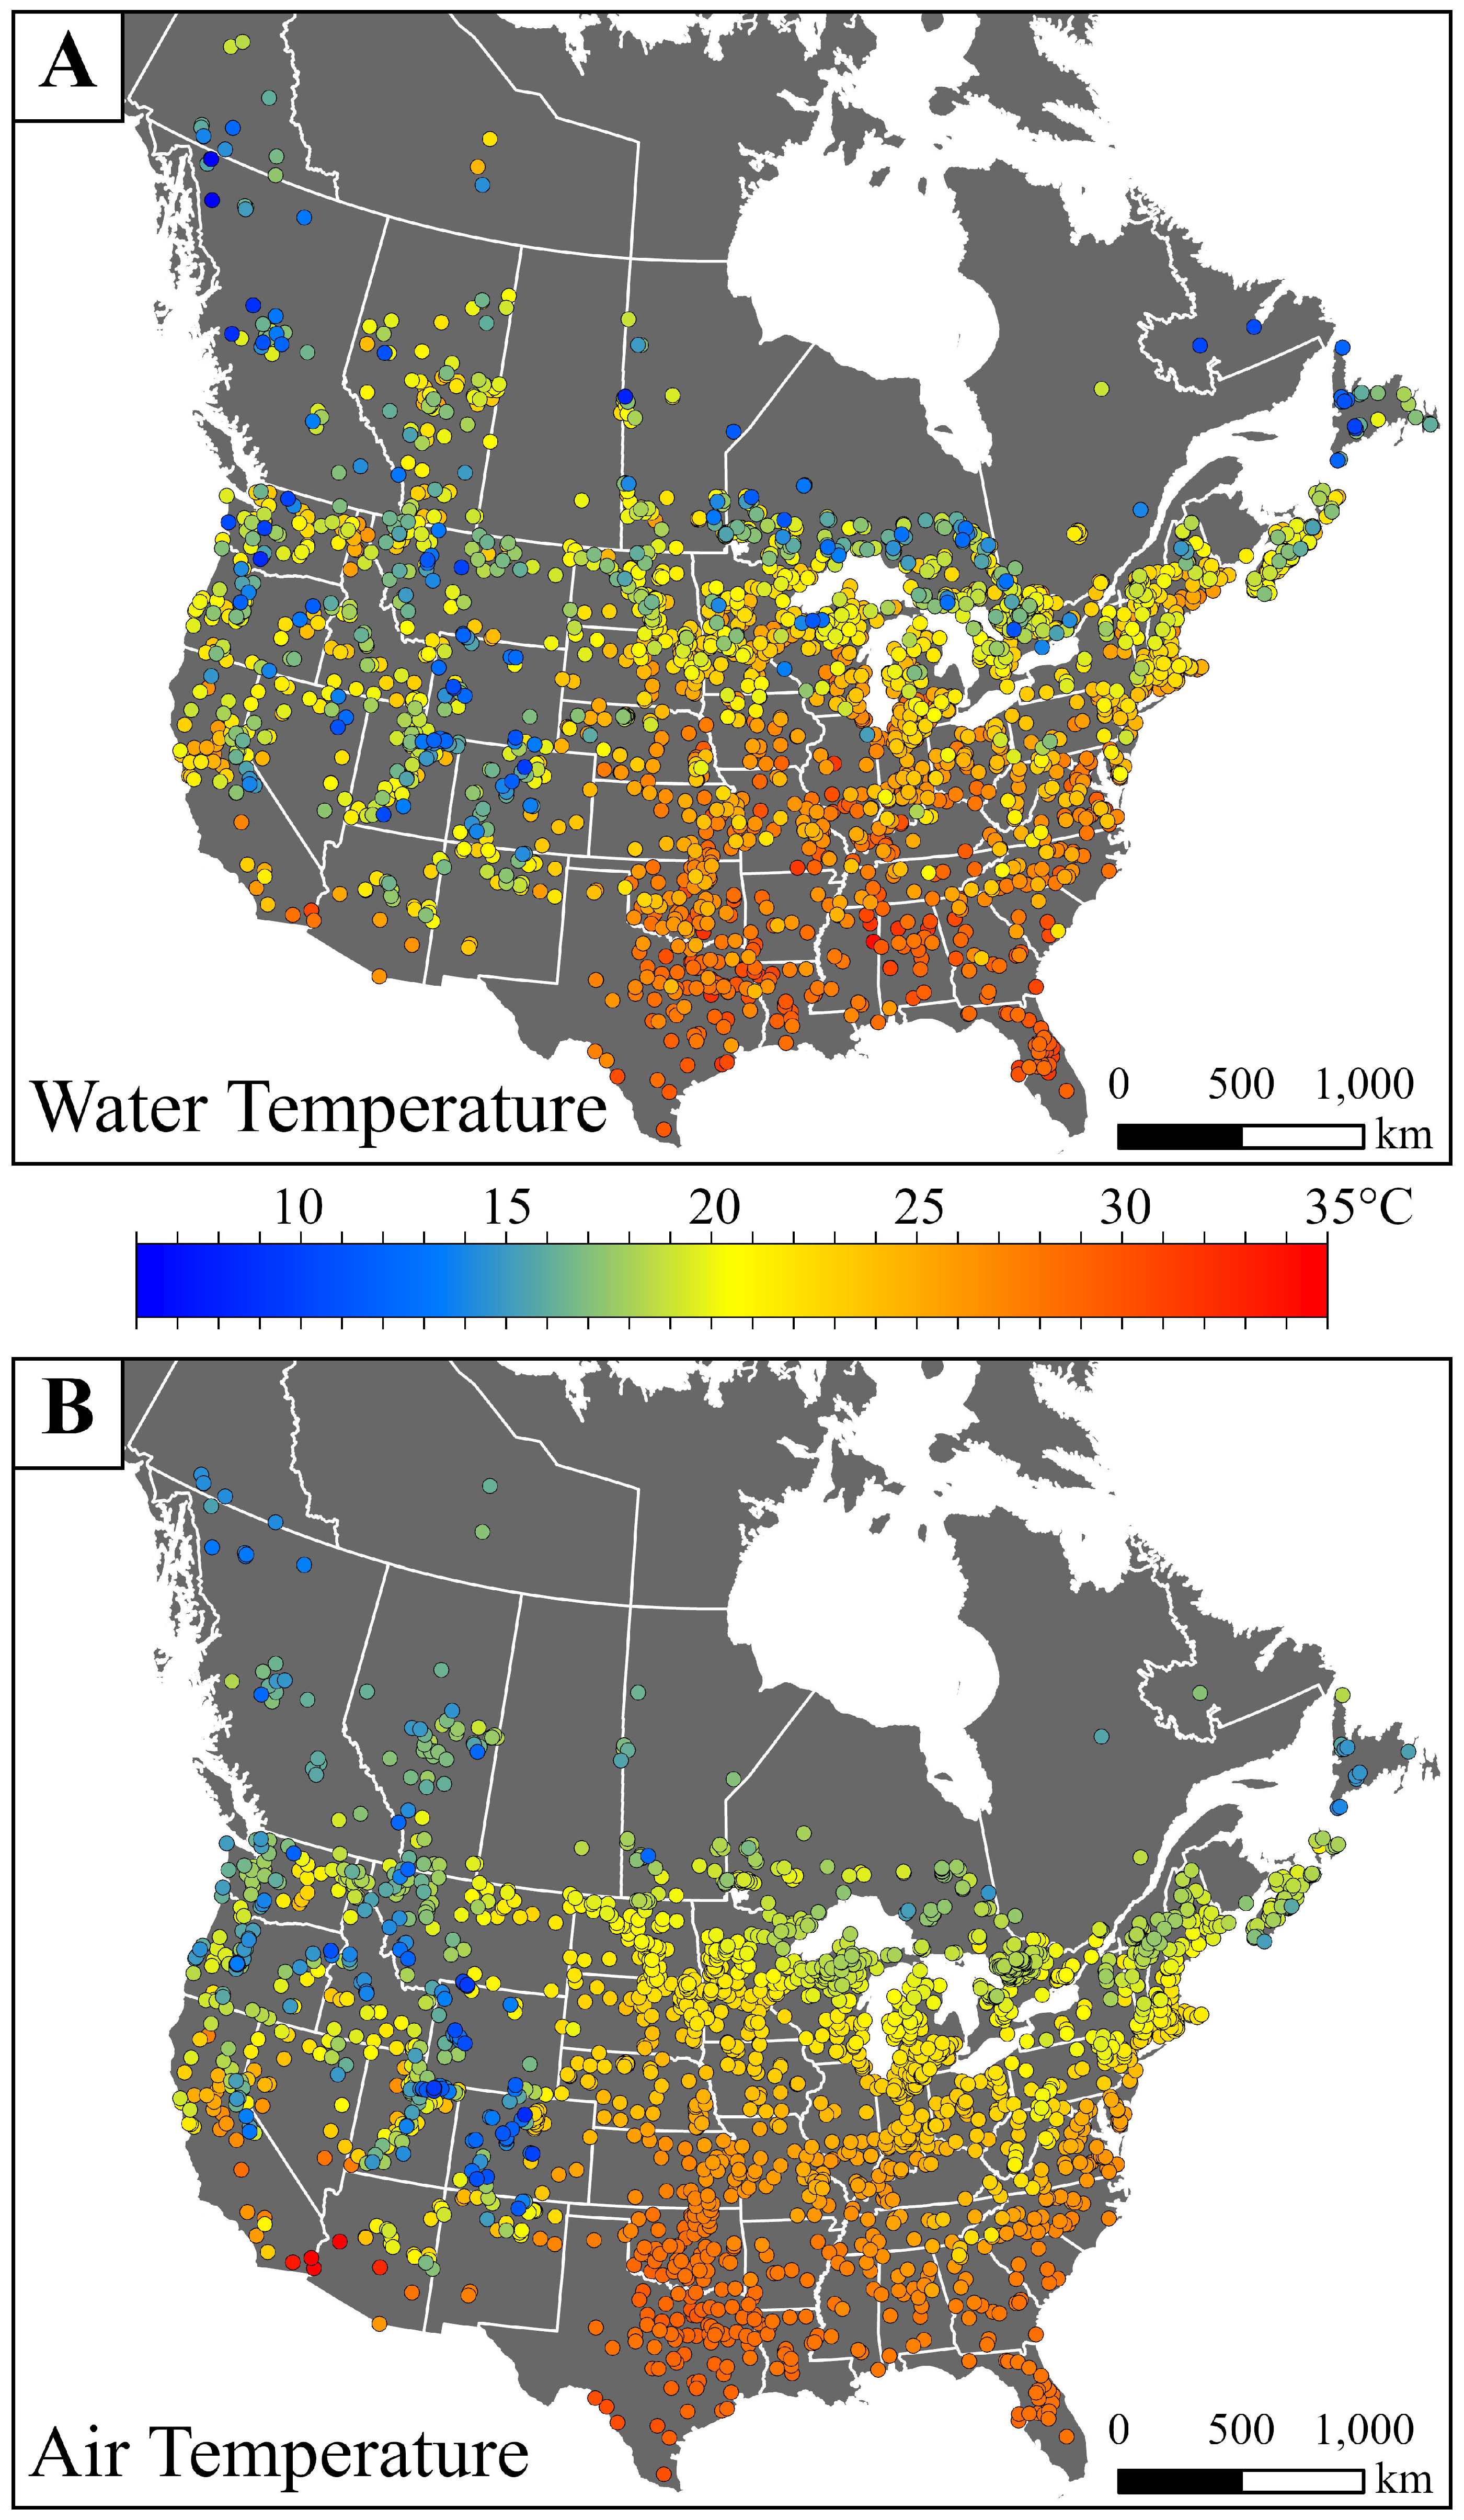
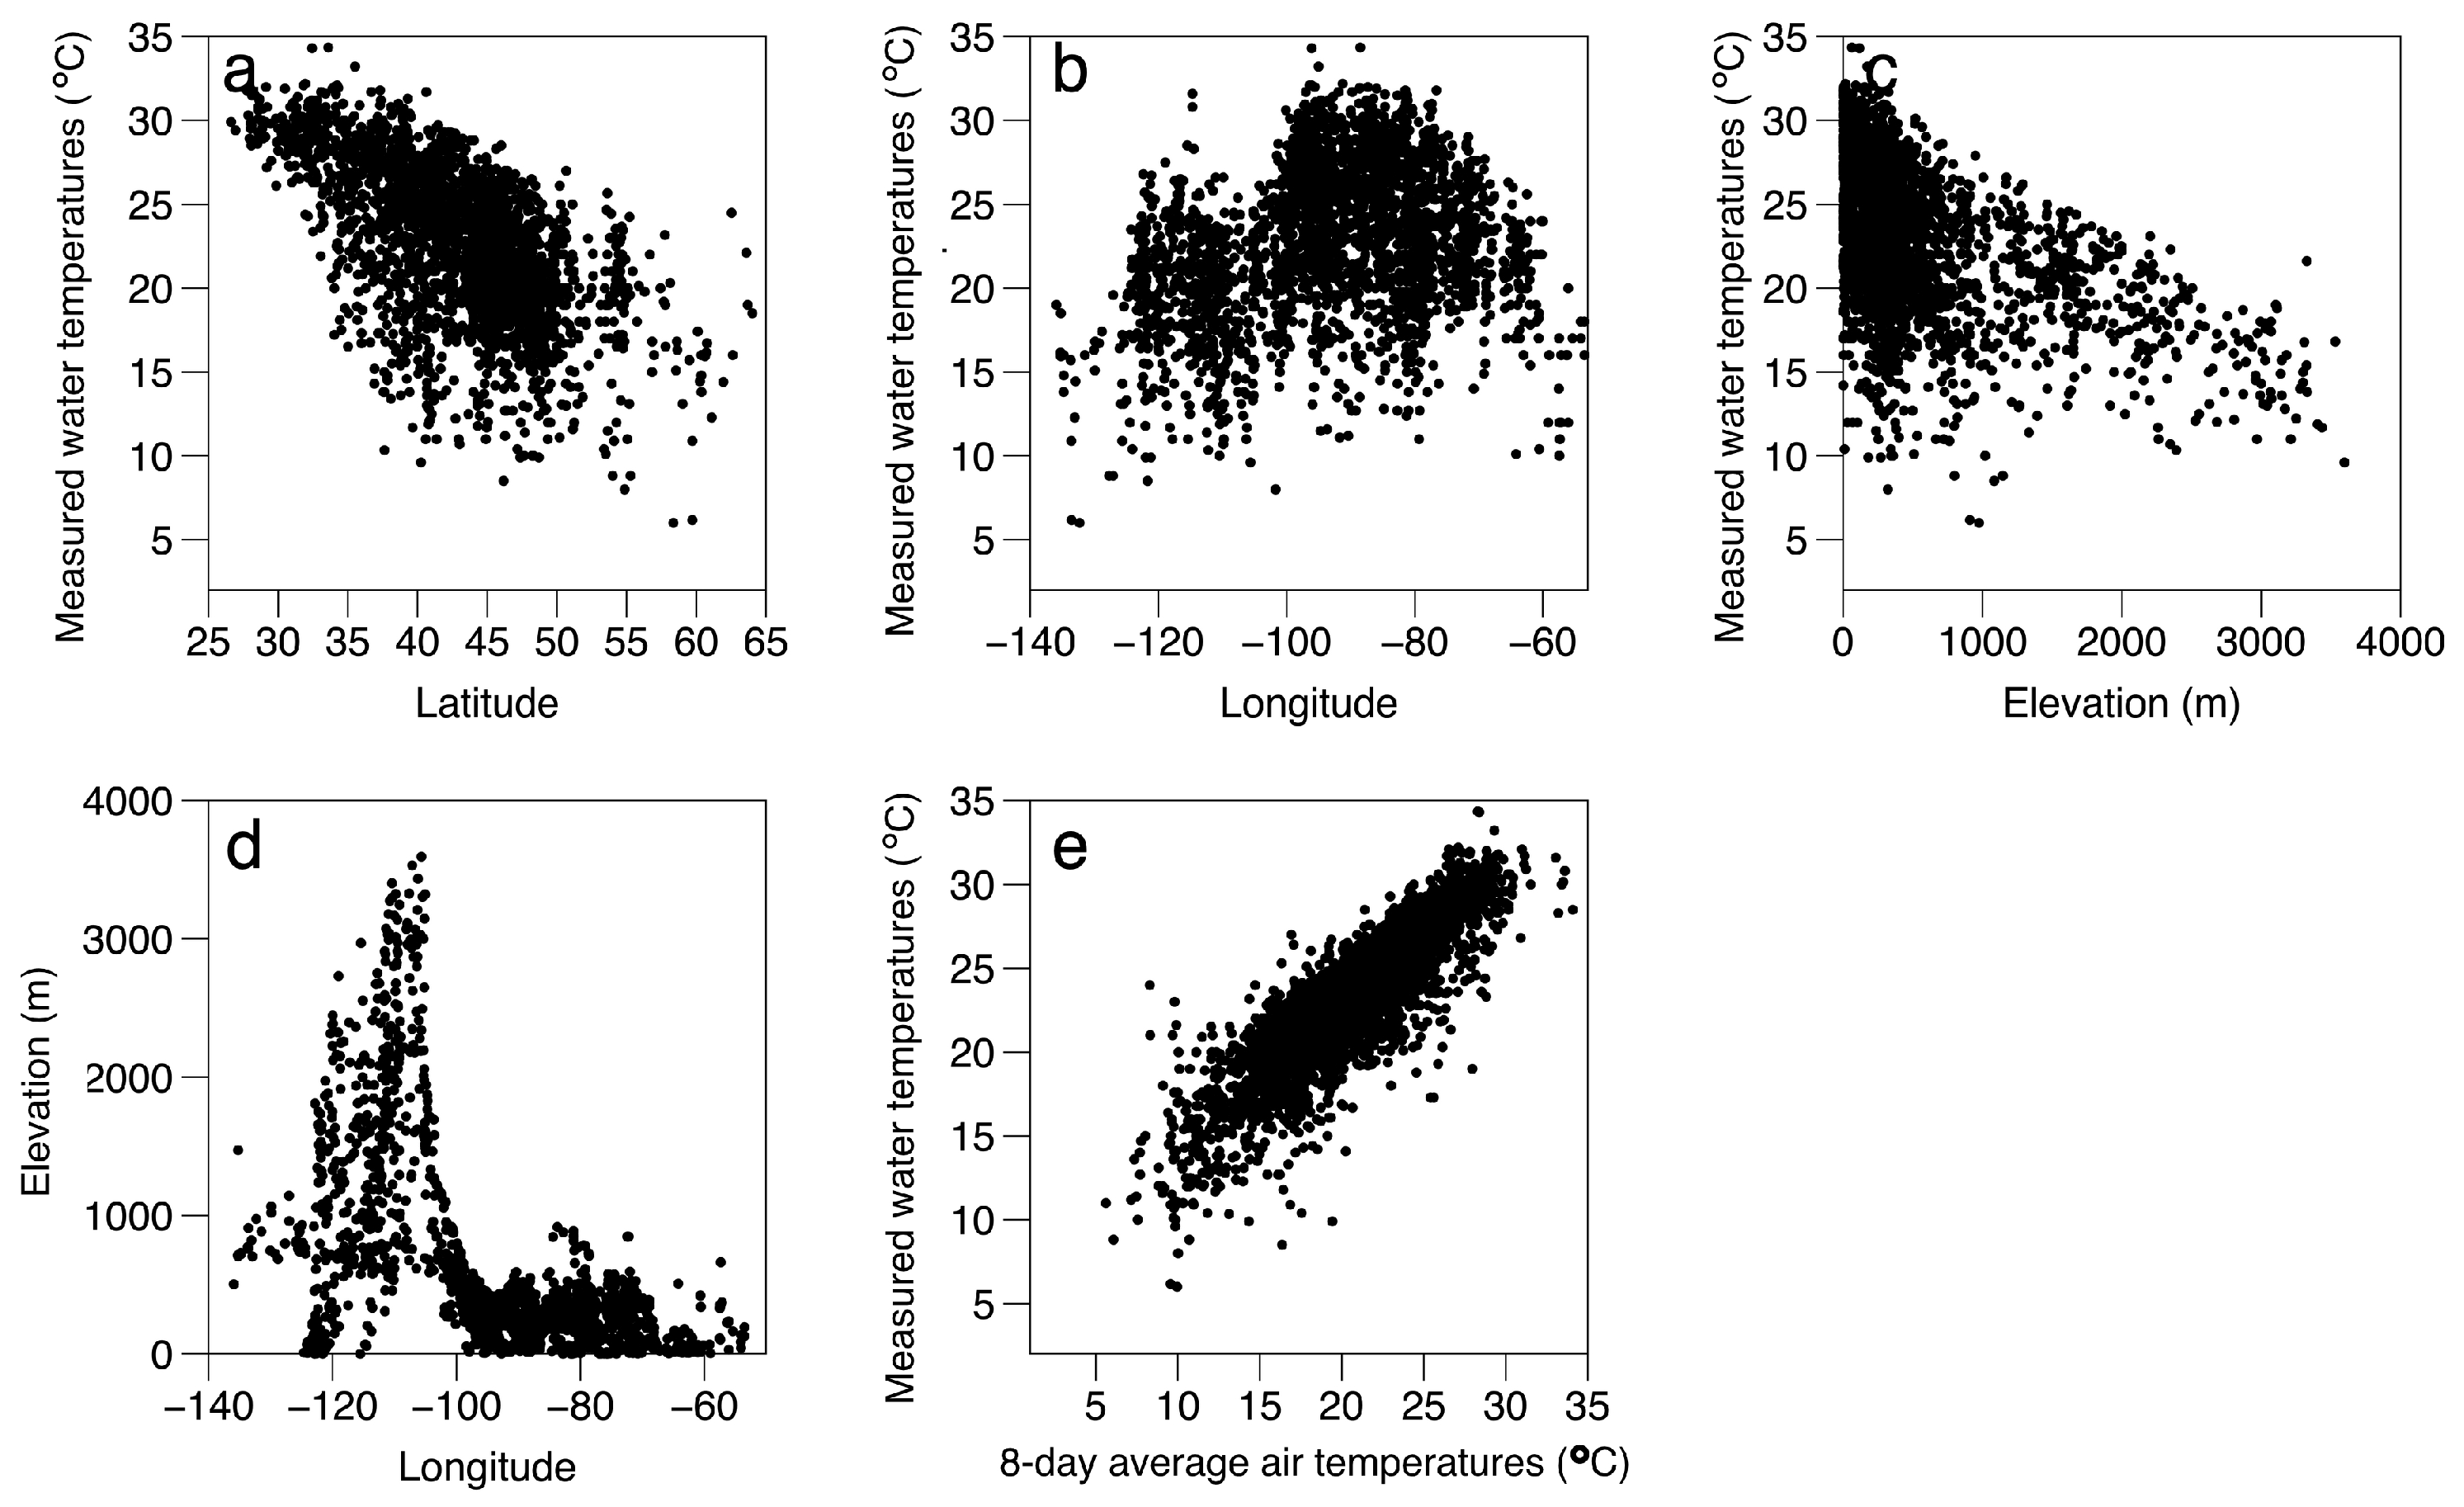
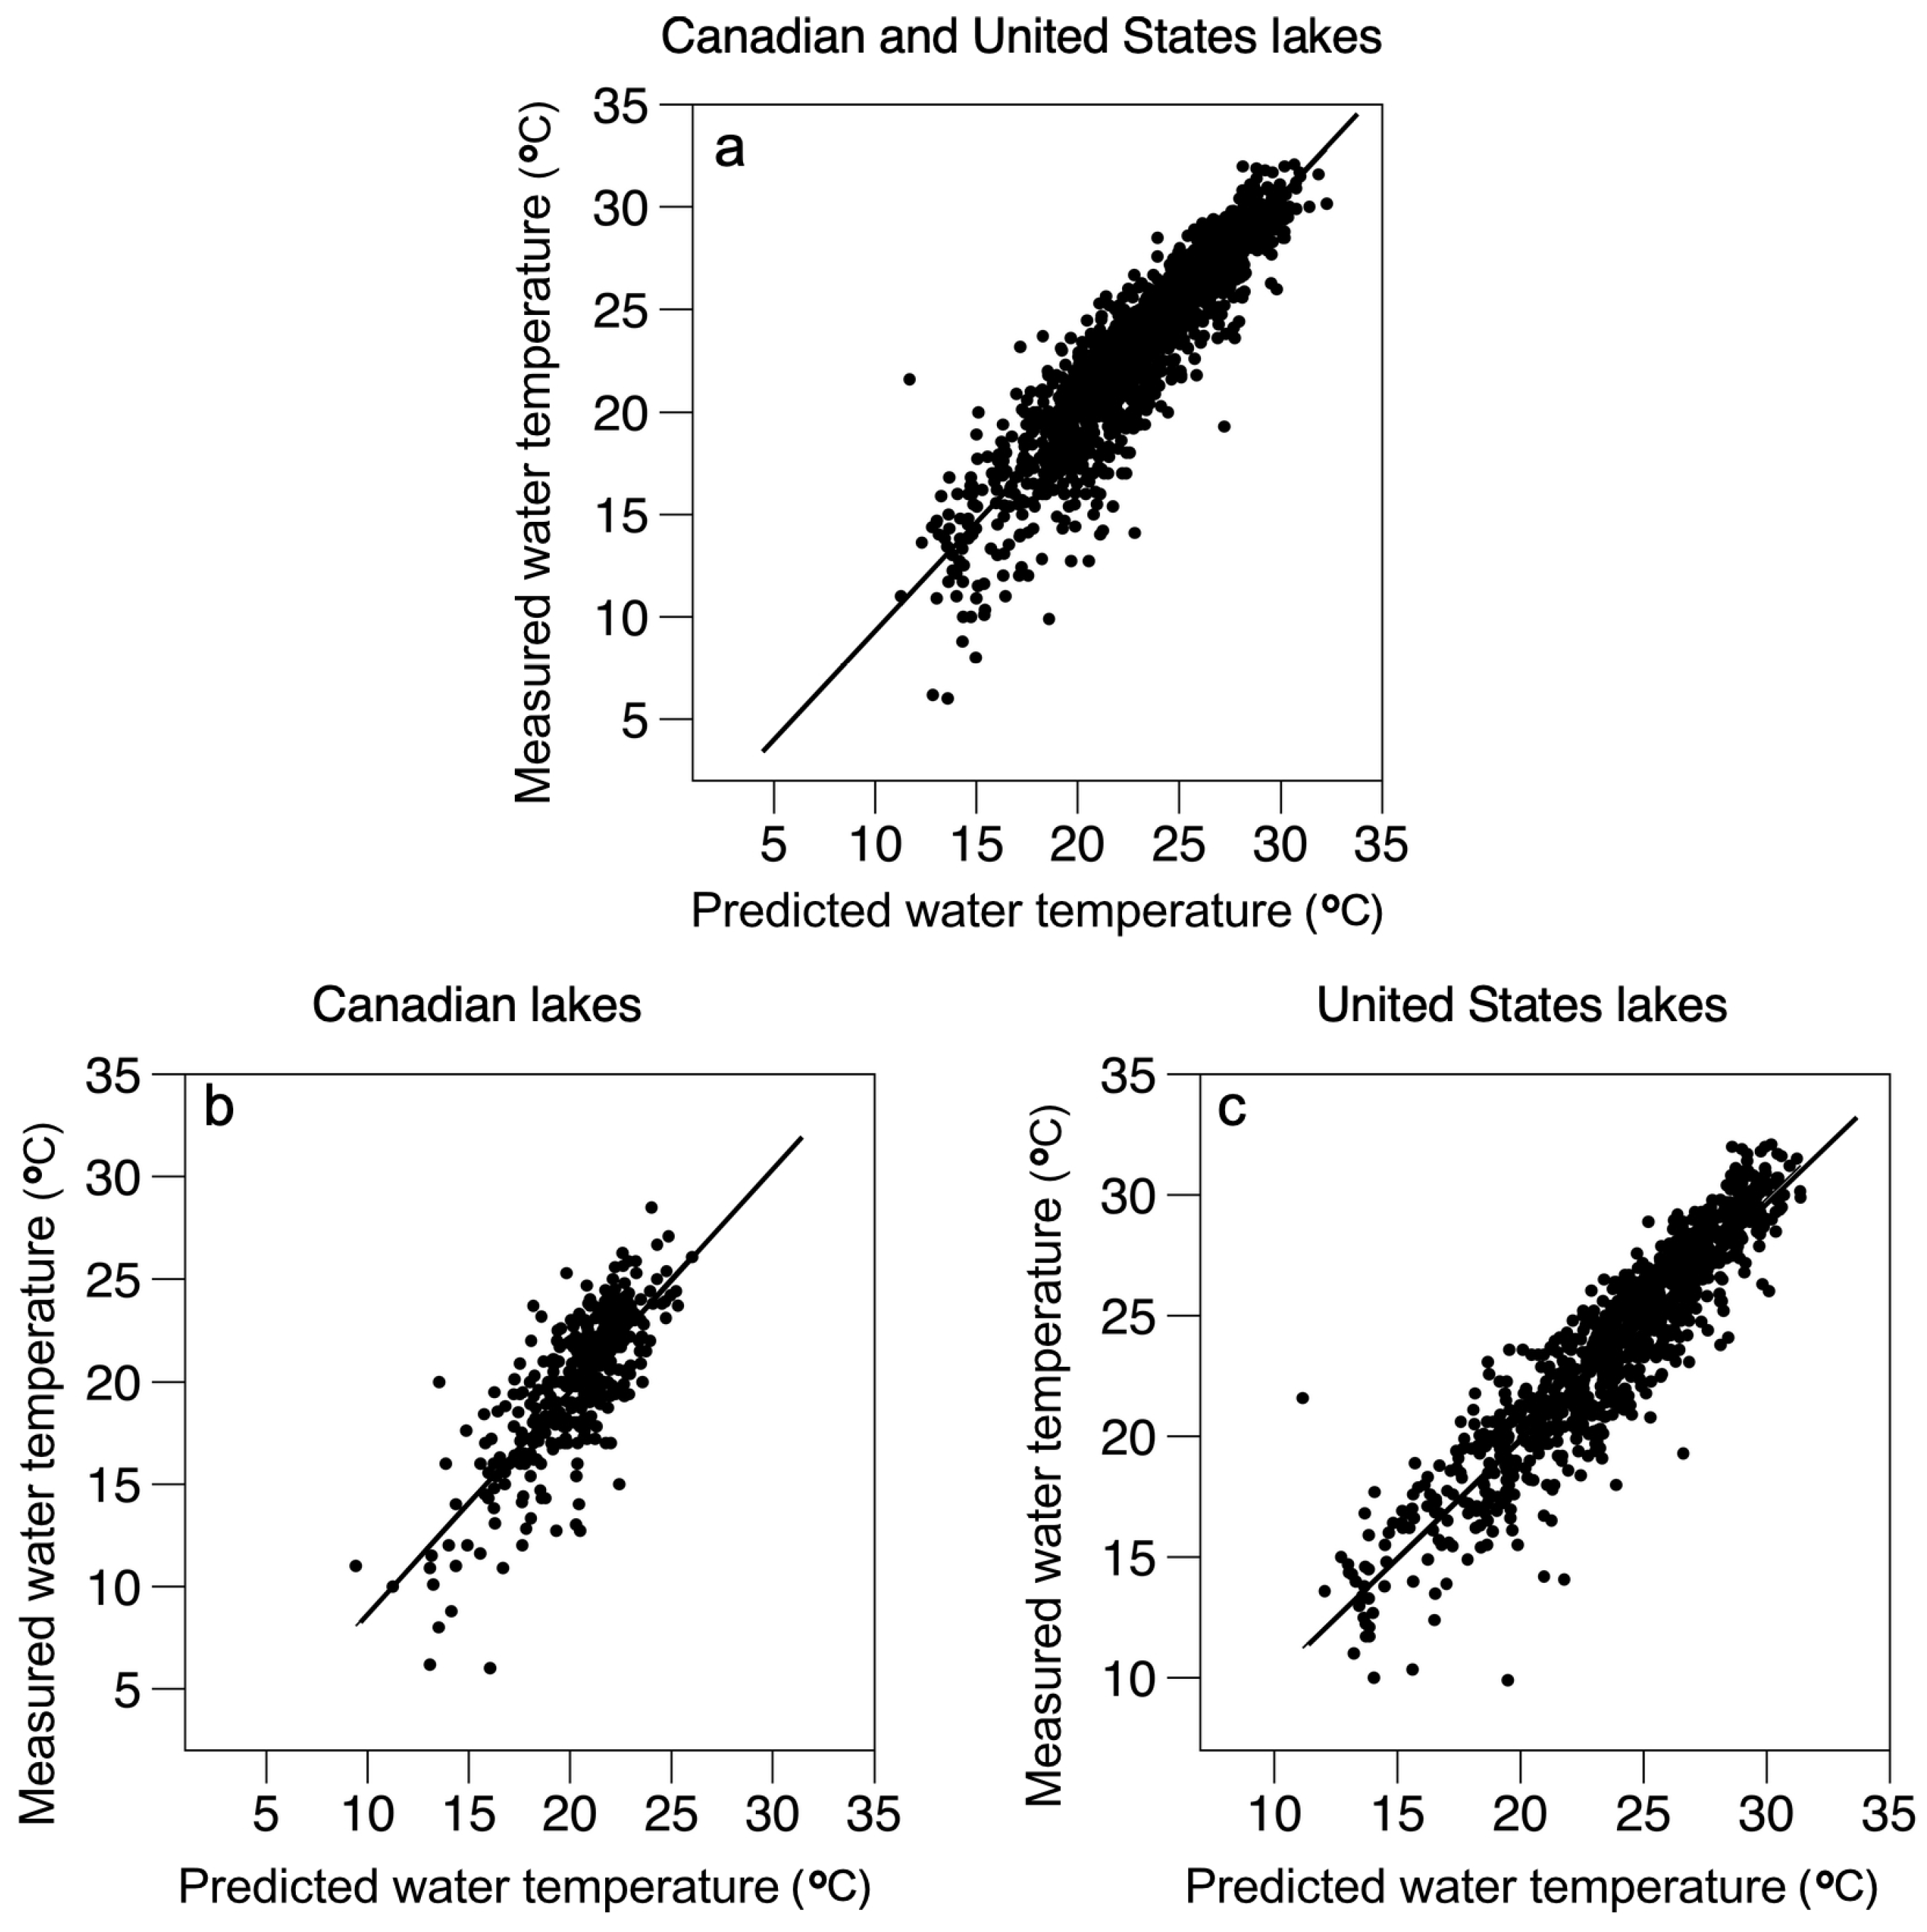
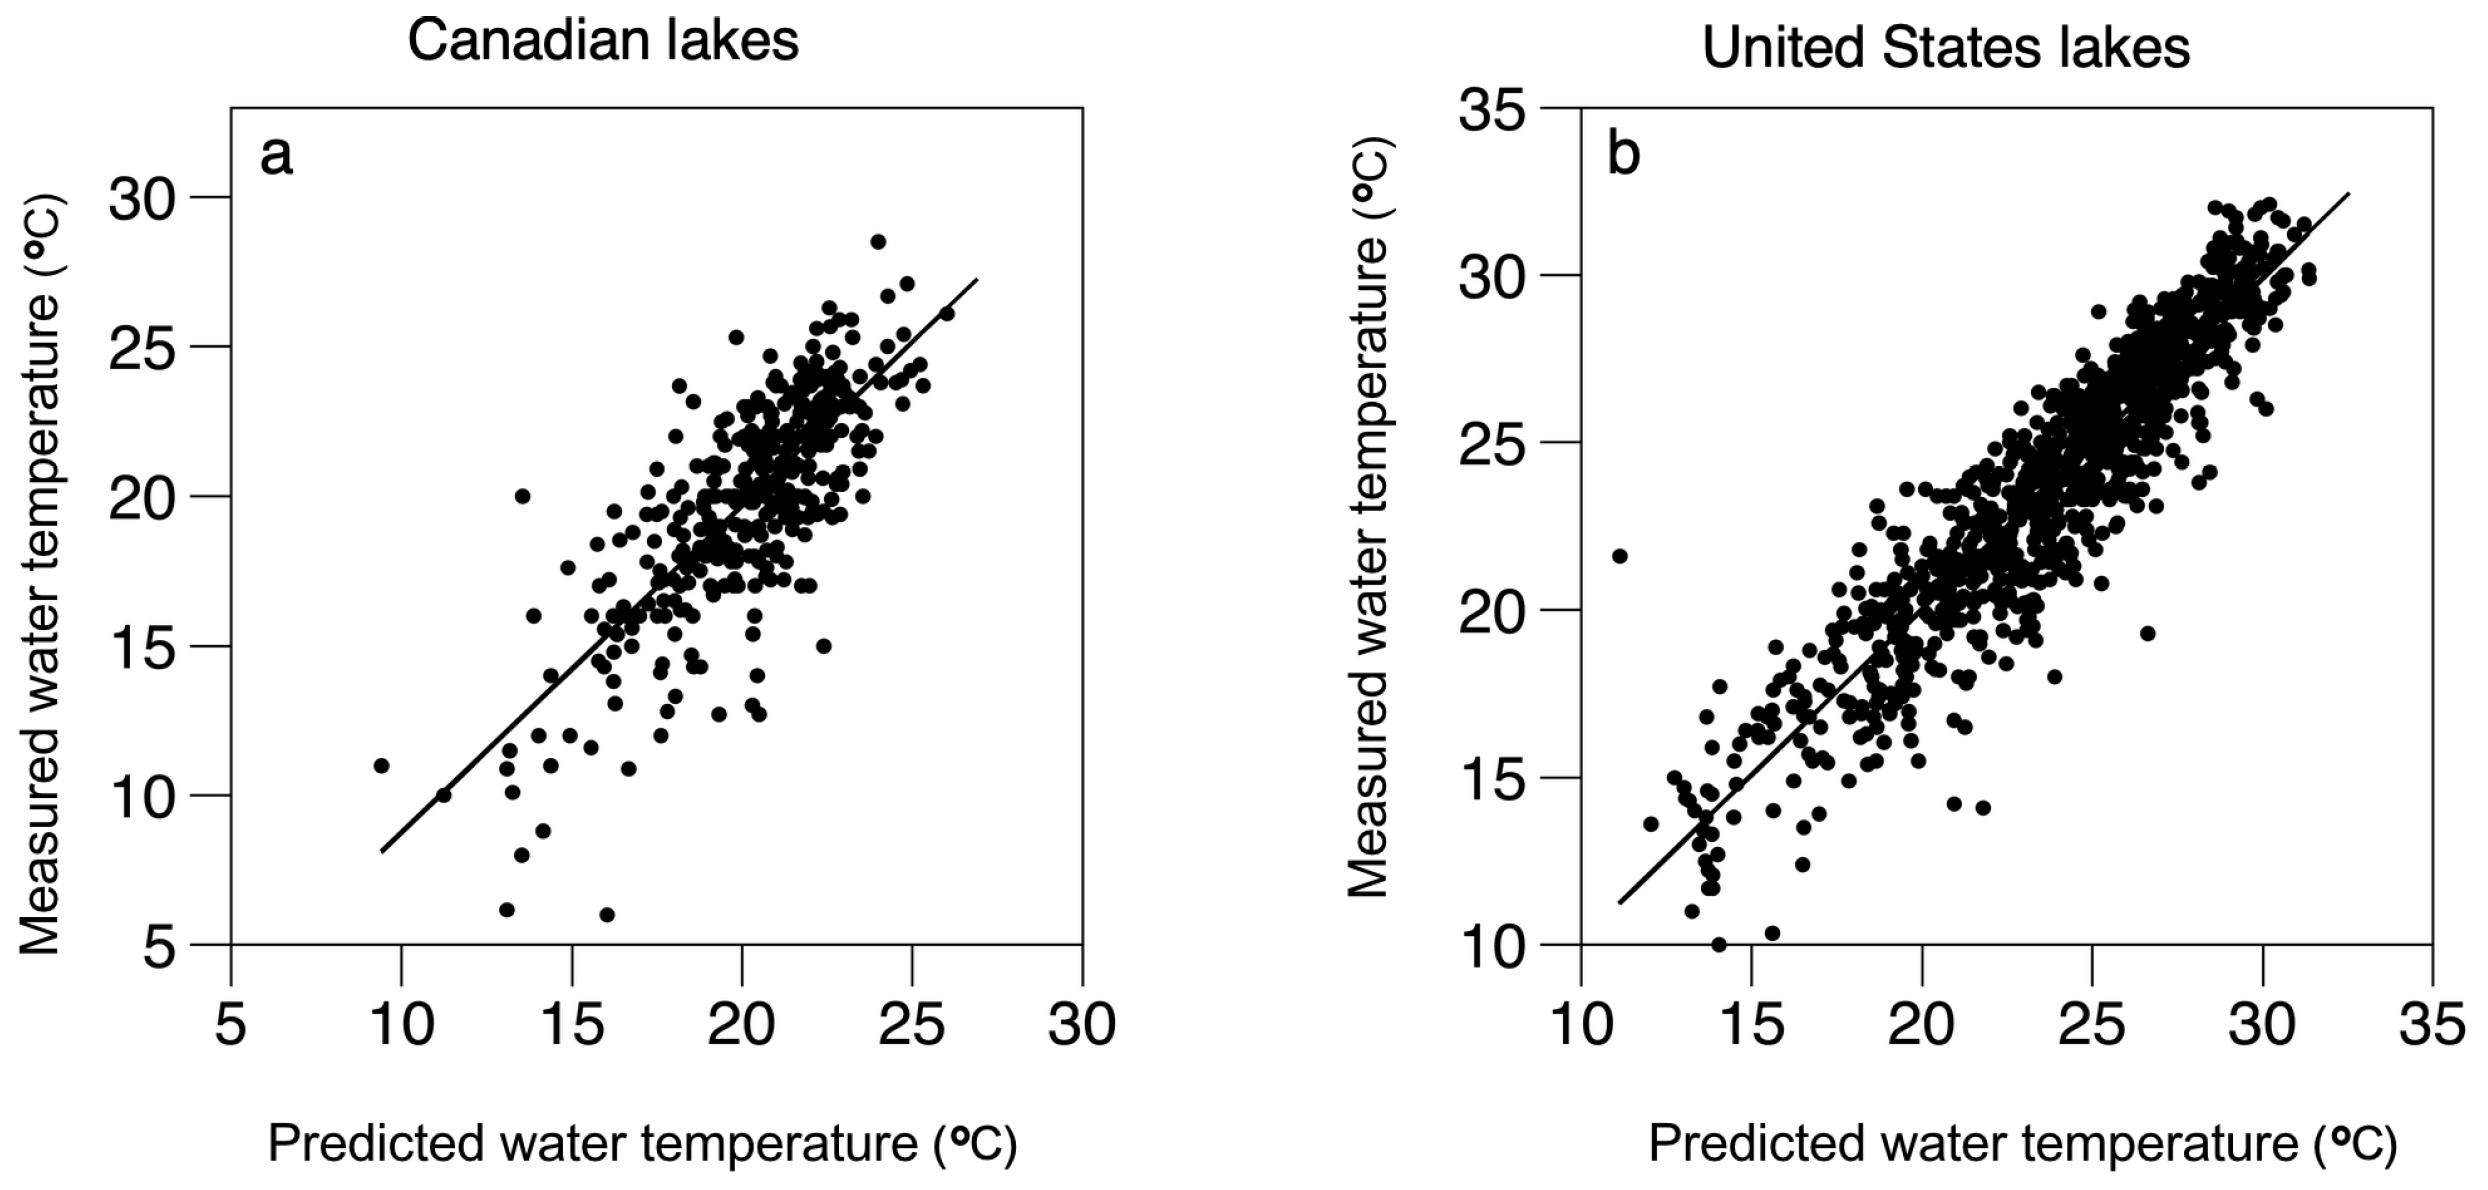
3. Results
4. Discussion
Supplementary Materials
Author Contributions
Funding
Acknowledgments
Conflicts of Interest
References
- Kraemer, B.M.; Anneville, O.; Chandra, S.; Dix, M.; Kuusisto, E.; Livingstone, D.M.; Rimmer, A.; Schladow, S.G.; Silow, E.; Sitoki, L.M.; et al. Morphometry and average temperature affect lake stratification responses to climate change. Geophys. Res. Lett. 2015, 42, 4981–4988. [Google Scholar] [CrossRef]
- Brookes, J.D.; Carey, C.C. Resilience to blooms. Science 2011, 334, 46–47. [Google Scholar] [CrossRef] [PubMed]
- Rigosi, A.; Hanson, P.; Hamilton, D.P.; Hipsey, M.; Rusak, J.A.; Bois, J.; Sparber, K.; Chorus, I.; Watkinson, A.J.; Qin, B.; et al. Determining the probability of cyanobacterial blooms: The application of Bayesian networks in multiple lake systems. Ecol. Appl. 2015, 25, 186–199. [Google Scholar] [CrossRef] [PubMed]
- Jackson, D.A.; Peres-Neto, P.R.; Olden, J.D. What controls who is where in freshwater fish communities—The roles of biotic, abiotic, and spatial factors. Can. J. Fish. Aquat. Sci. 2001, 58, 157–170. [Google Scholar]
- Schneider, P.; Hook, S.J. Space observations of inland water bodies show rapid surface warming since 1985. Geophys. Res. Lett. 2010, 37, 22. [Google Scholar] [CrossRef]
- O’Reilly, C.M.; Sharma, S.; Gray, D.K.; Hampton, S.E.; Read, J.S.; Rowley, R.J.; Schneider, P.; Lenters, J.D.; McIntyre, P.B.; Kraemer, B.M.; et al. Rapid and highly variable warming of lake surface waters around the globe. Geophys. Res. Lett. 2015, 42, 10–773. [Google Scholar]
- Richardson, D.C.; Melles, S.J.; Pilla, R.M.; Hetherington, A.L.; Knoll, L.; Williamson, C.E.; Kraemer, B.M.; Jackson, J.R.; Long, E.C.; Moore, K.; et al. Transparency, geomorphology, and mixing regime explain variability in trends in lake temperature and stratification across northeastern North America (1975–2012). Water 2017, 9, 442. [Google Scholar] [CrossRef]
- Woolway, R.I.; Jones, I.D.; Maberly, S.C.; French, J.R.; Livingstone, D.M.; Monteith, D.T.; Simpson, G.L.; Thackeray, S.J.; Andersen, M.R.; Battarbee, R.W.; et al. Diel surface temperature range scales with lake size. PLoS ONE 2016, 11, e0152466. [Google Scholar] [CrossRef]
- Sharma, S.; Jackson, D.A.; Minns, C.K.; Shuter, B.J. Will northern fish populations be in hot water because of climate change? Glob. Chang. Biol. 2007, 13, 2052–2064. [Google Scholar] [CrossRef]
- Alofs, K.M.; Jackson, D.A.; Lester, N.P. Ontario freshwater fishes demonstrate differing range-boundary shifts in a warming climate. Divers. Distrib. 2014, 20, 123–136. [Google Scholar] [CrossRef]
- Vander Zanden, J.M.; Casselman, J.M.; Rasmussen, J.B. Stable isotope evidence for the food web consequences of species invasions in lakes. Nature 1999, 401, 464–467. [Google Scholar] [CrossRef]
- Hansen, G.J.A.; Read, J.S.; Hansen, J.F.; Winslow, L.A. Projected shifts in fish species dominance in Wisconsin lakes under climate change. Glob. Chang. Biol. 2016, 23, 1463–1476. [Google Scholar] [CrossRef] [PubMed]
- Van Zuiden, T.M.; Chen, M.; Stefanoff, S.; Lopez, L.; Sharma, S. Projected impacts of climate change on three freshwater fishes and potential novel competitive interactions. Divers. Distrib. 2016, 22, 603–614. [Google Scholar] [CrossRef]
- Edinger, J.E.; Duttweiler, D.W.; Geyer, J.C. The response of water temperatures to meteorological conditions. Water Resour. Res. 1968, 4, 1137–1143. [Google Scholar] [CrossRef]
- Kettle, H.; Thompson, R.; Anderson, N.J.; Livingstone, D.M. Empirical modeling of summer lake surface temperatures in southwest Greenland. Limnol. Oceanogr. 2004, 49, 271–282. [Google Scholar] [CrossRef]
- Piccolroaz, S.; Healey, N.C.; Lenters, J.D.; Schladow, S.G.; Hook, S.J.; Sahoo, G.B.; Toffolon, M. On the predictability of lake surface temperature using air temperature in a changing climate: A case study for Lake Tahoe (USA). Limnol. Oceanogr. 2018, 63, 243–261. [Google Scholar] [CrossRef]
- Hondzo, M.; Stefan, H.G. Lake water temperature simulation model. J. Hydraul. Eng. 1993, 119, 1251–1273. [Google Scholar] [CrossRef]
- Shuter, B.J.; Schlesinger, D.A.; Zimmerman, A.P. Empirical predictors of annual surface water temperature cycles in North American lakes. Can. J. Fish. Aquat. Sci. 1983, 40, 1838–1845. [Google Scholar] [CrossRef]
- Livingstone, D.M.; Lotter, A.F. The relationship between air and water temperatures in lakes of the Swiss Plateau: A case study with paleolimnological implications. J. Paleolimnol. 1998, 19, 191–198. [Google Scholar] [CrossRef]
- Sharma, S.; Walker, S.C.; Jackson, D.A. Empirical modelling of lake water-temperature relationships: A comparison of approaches. Freshw. Biol. 2008, 53, 897–911. [Google Scholar] [CrossRef]
- Schmid, M.; Hunziker, S.; Wüest, A. Lake surface temperatures in a changing climate: A global sensitivity analysis. Clim. Chang. 2014, 124, 301–315. [Google Scholar] [CrossRef]
- Rose, K.C.; Winslow, L.A.; Read, J.S.; Hanson, G.J.A. Climate-induced warming of lakes can be either amplified or suppressed by trends in water clarity. Limnol. Oceanogr. Lett. 2016, 1, 44–53. [Google Scholar] [CrossRef]
- Magee, M.R.; Wu, C.H. Response of water temperatures and stratification to changing climate in three lakes with different morphometry. Hydrol. Earth Syst. Sci. 2017, 21, 6253–6274. [Google Scholar] [CrossRef]
- Piccolroaz, S.; Toffolon, M.; Majone, B.A. A simple lumped model to convert air temperature into surface water temperature in lakes. Hydrol. Earth Syst. Sci. 2013, 17, 3323–3338. [Google Scholar] [CrossRef]
- Toffolon, M.; Piccolroaz, S.; Majone, B.; Soja, A.M.; Peeters, F.; Schmid, M.; Wüest, A. Prediction of surface temperature in lakes with different morphology using air temperature. Limnol. Oceanogr. 2014, 59, 2185–2202. [Google Scholar] [CrossRef]
- Piccolroaz, S.; Toffolon, M.; Majone, B. The role of stratification on lakes’ thermal response: The case of Lake Superior. Water Resour. Res. 2015, 51, 7878–7894. [Google Scholar] [CrossRef]
- Livingstone, D.M.; Dokulil, M.T. Eighty years of spatially coherent Austrian lake surface temperatures and their relationship to regional air temperature and the North Atlantic Oscillation. Limnol. Oceanogr. 2001, 46, 1220–1227. [Google Scholar] [CrossRef]
- USEPA. National Lakes Assessment 2007: A Collaborative Survey of Lakes in the United States; EPA 841-R-16-009; United States Environmental Protection Agency: Washington DC, USA, 2009.
- USEPA. National Lakes Assessment 2012: A Collaborative Survey of Lakes in the United States; EPA 841-R-16-113; United States Environmental Protection Agency: Washington DC, USA, 2016.
- Dewald, T.G. Applications of the NHD at the US Environmental Protection Agency. Water Res. Impact. 2006, 8, 5–7. [Google Scholar]
- Peck, D.V.; Olsen, A.R.; Weber, M.H.; Paulsen, S.G.; Peterson, C.; Holdsworth, S.M. Survey design and extent estimates for the National Lakes Assessment. Freshw. Sci. 2013, 32, 1231–1245. [Google Scholar] [CrossRef]
- Daly, C.; Halbleib, M.; Smith, J.I.; Gibson, W.P.; Doggett, M.K.; Taylor, G.H.; Curtis, J.; Pasteris, P.A. Physiographically-sensitive mapping of temperature and precipitation across the conterminous United States. Int. J. Climatol. 2008, 28, 2031–2064. [Google Scholar] [CrossRef]
- SAS Institute Inc. Statistical Analysis System, Cary. In JMP Statistics and Graphics Guide, Version 7; SAS Institute Inc.: Cary, NC, USA, 2007. [Google Scholar]
- Carmack, E.C.; Vagle, S.; Morrison, J.; Laval, B.E. Space-for-time proxy for climate change in deep lakes in the Canadian cordillera: Seasonality along a latitudinal climate gradient. J. Great Lakes Res. 2014, 40, 608–617. [Google Scholar] [CrossRef]
- Ptak, M.; Sojka, M.; Choiński, A.; Nowak, B. Effect of Environmental Conditions and Morphometric Parameters on Surface Water Temperature in Polish Lakes. Water 2018, 10, 580. [Google Scholar] [CrossRef]
- Winslow, L.A.; Hansen, G.J.; Read, J.S.; Notaro, M. Large-scale modeled contemporary and future water temperature estimates for 10774 Midwestern US Lakes. Sci. Data 2017, 4, 170053. [Google Scholar] [CrossRef] [PubMed]
- Woolway, R.I.; Merchant, C.J. Amplified surface temperature response of cold, deep lakes to Inter-annual air temperature variability. Sci. Rep. 2017, 7, 4130. [Google Scholar] [CrossRef] [PubMed]
- Zhong, Y.; Notaro, M.; Vavrus, S.J.; Foster, M.J. Recent accelerated warming of the Laurentian Great Lakes: Physical drivers. Limnol. Oceanogr. 2016, 61, 1762–1786. [Google Scholar] [CrossRef]
- Zhong, Y.; Notaro, M.; Vavrus, S.J. Spatially variable warming of the Laurentian Great Lakes: An interaction of bathymetry and climate. Clim. Dynam. 2018, 52, 5833–5848. [Google Scholar] [CrossRef]
- Matuszek, J.E.; Shuter, B.J. An empirical method for the prediction of daily water temperatures in the littoral zone of temperate lakes. Trans. Am. Fish. Soc. 1996, 125, 622–627. [Google Scholar] [CrossRef]
- McCombie, A.M. Some relations between air temperatures and the surface water temperatures of lakes. Limnol. Oceanogr. 1959, 4, 252–258. [Google Scholar] [CrossRef]
- Livingstone, D.M.; Lotter, A.F.; Walkery, I.R. The decrease in summer surface water temperature with altitude in Swiss Alpine lakes: A comparison with air temperature lapse rates. Artct. Anarct. Alp. Res. 1999, 31, 341–352. [Google Scholar] [CrossRef]
- Minns, C.K.; Shuter, B.J.; Davidson, A.; Wang, S. Factors influencing peak summer surface water temperature in Canada’s large lakes. Can. J. Fish. Aquat. Sci. 2017, 75, 1005–1018. [Google Scholar] [CrossRef]
- Yin, X. Reconstructing monthly global solar radiation from air temperature and precipitation records: A general algorithm for Canada. Ecol. Model. 2011, 334, 46–47. [Google Scholar] [CrossRef]
- Hondzo, M.; Stefan, H.G. Regional water temperature characteristics of lakes subjected to climate change. Clim. Chang. 1993, 24, 187–211. [Google Scholar] [CrossRef]
- Robertson, D.M.; Ragotzkie, R.A. Changes in the thermal structure of moderate to large sized lakes in response to changes in air temperature. Aquat. Sci. 1990, 52, 360–380. [Google Scholar] [CrossRef]


| Variable | Longitude | Latitude | Elevation |
|---|---|---|---|
| Temperature | 0.44 | −0.52 | −0.64 |
| Longitude | - | −0.15 | −0.58 |
| Latitude | - | - | 0.10 |
| Number of Days in Average of Air Temperatures | R2 |
|---|---|
| 1 | 0.66 |
| 2 | 0.70 |
| 3 | 0.71 |
| 4 | 0.73 |
| 5 | 0.74 |
| 6 | 0.74 |
| 7 | 0.75 |
| 8 | 0.75 |
| 9 | 0.75 |
| 10 | 0.75 |
| Variable | Probability | R2 | RMSE | AIC |
|---|---|---|---|---|
| 8-day air temperature | <0.0001 | 0.75 | 2.08 | 7560.4 |
| Elevation | <0.0001 | 0.82 | 1.79 | 7045.2 |
| Longitude | <0.0001 | 0.83 | 1.72 | 69.05.4 |
| Latitude | <0.0001 | 0.84 | 1.69 | 6838.2 |
| Secchi depth | <0.0001 | 0.84 | 1.67 | 6791.3 |
| Water color | <0.0001 | 0.84 | 1.66 | 6771.5 |
| Turbidity | <0.0001 | 0.85 | 1.65 | 6756.8 |
| Lake origin (natural or manmade) | 0.0032 | 0.85 | 1.64 | 6750.1 |
| Surface area | 0.0155 | 0.85 | 1.64 | 6746.2 |
| Maximum depth | 0.5140 | 0.85 | 1.64 | 6747.8 |
| Variable | Probability | R2 | RMSE | AIC |
|---|---|---|---|---|
| 8-day air temperature | <0.0001 | 0.55 | 2.26 | 3354.9 |
| Latitude | <0.0001 | 0.57 | 2.22 | 3328.5 |
| Longitude | 0.001 | 0.58 | 2.20 | 3315.4 |
| Year | 0.1959 | 0.58 | 2.20 | 3315.7 |
| Data Set | Regression Equation | Equation # |
|---|---|---|
| Combined lakes from United States and Canada | ||
| T= 16.14 + 0.673Air − 0.0846Lat + 0.0172Long − 0.00131Elev − 0.147Mon | (1) | |
| United States lakes | ||
| June | T = 24.67 + 0.521 Air − 0.202 Lat + 0.0320Long − 0.00202 Elev | (2) |
| July | T = 22.79 + 0.489 Air − 0.0822 Lat + 0.0478Long − 0.00199 Elev | (3) |
| August | T = 21.70 + 0.592 Air − 0.123 Lat + 0.0529Long − 0.000968 Elev | (4) |
| September | T = 20.04 + 0.551 Air − 0.204 Lat − 0.00167 Elev | (5) |
| Canadian lakes | ||
| June | T = 10.21 + 0.590 Air | (6) |
| July | T = 16.79 + 0.616 Air − 0.143 Lat − 0.00150 Elev | (7) |
| August | T = 23.18 + 0.526 Air − 0.244Lat | (8) |
| September | T = 4.17 + 0.934 Air | (9) |
| Equation and Location | N | R2 | RMSE | Equations |
|---|---|---|---|---|
| Common equation for Canadian and United States Lakes | 1327 | 0.81 | 1.9 | (1) |
| Common equation applied to Canadian lakes | 375 | 0.58 | 2.3 | (1) |
| Common equation applied to United States lakes | 952 | 0.83 | 1.7 | (1) |
| Canadian equations applied to all months | 375 | 0.60 | 2.2 | (6)–(8) |
| Canadian equations applied to June | 83 | 0.54 | 2.1 | (6) |
| Canadian equations applied to July | 148 | 0.46 | 2.2 | (7) |
| Canadian equations applied to August | 116 | 0.47 | 2.1 | (8) |
| Canadian equations applied to September | 28 | 0.48 | 2.9 | (9) |
| United States equations applied to all months | 952 | 0.84 | 1.7 | (2)–(5) |
| United States equations applied to June | 192 | 0.84 | 1.7 | (2) |
| United States equations applied to July | 325 | 0.80 | 1.5 | (3) |
| United States equations applied to August | 300 | 0.84 | 1.6 | (4) |
| United States equations applied to September | 135 | 0.84 | 1.9 | (5) |
© 2019 by the authors. Licensee MDPI, Basel, Switzerland. This article is an open access article distributed under the terms and conditions of the Creative Commons Attribution (CC BY) license (http://creativecommons.org/licenses/by/4.0/).
Share and Cite
Bachmann, R.W.; Sharma, S.; Canfield, D.E., Jr.; Lecours, V. The Distribution and Prediction of Summer Near-Surface Water Temperatures in Lakes of the Coterminous United States and Southern Canada. Geosciences 2019, 9, 296. https://doi.org/10.3390/geosciences9070296
Bachmann RW, Sharma S, Canfield DE Jr., Lecours V. The Distribution and Prediction of Summer Near-Surface Water Temperatures in Lakes of the Coterminous United States and Southern Canada. Geosciences. 2019; 9(7):296. https://doi.org/10.3390/geosciences9070296
Chicago/Turabian StyleBachmann, Roger W., Sapna Sharma, Daniel E. Canfield, Jr., and Vincent Lecours. 2019. "The Distribution and Prediction of Summer Near-Surface Water Temperatures in Lakes of the Coterminous United States and Southern Canada" Geosciences 9, no. 7: 296. https://doi.org/10.3390/geosciences9070296
APA StyleBachmann, R. W., Sharma, S., Canfield, D. E., Jr., & Lecours, V. (2019). The Distribution and Prediction of Summer Near-Surface Water Temperatures in Lakes of the Coterminous United States and Southern Canada. Geosciences, 9(7), 296. https://doi.org/10.3390/geosciences9070296