1. Introduction
Dangerous hydrologic events that are related to an increase in the river water level happen from time to time. Such events need to be anticipated in order to prevent or significantly mitigate the damage caused by them. Rivers in the northern hemisphere flow in specific natural climatic conditions. Given these conditions, flooding of residential areas and communities is almost always a social and environmental emergency [
1].
Territorial analysis of water flow changes driven by the climate and consequent probable determination of patterns in such changes may be helpful for the development of water flow forecast methods with various stages of lead time (most importantly, long-term and very long-term). Such analyses may also provide general information on the expected river water levels that can be used by government bodies, business entities, and the general public, as well as in aquacultural calculations.
Thus, there has been heightened academic interest in long-term water flow fluctuation research.
Whether the warming we witness today is global or not and what the reasons for this warming may be, are issues that are still open for discussion (an overview of main theoretical approaches can be found in the paper under reference [
2]). Nevertheless, a significant and steady increase in the average annual air temperature over the years (particularly in Yakutia) is a reality.
According to some research papers, the global surface air temperature in the northern hemisphere will continue to rise, at least in the coming decades. Specifically, the study [
3] states that the air temperature will rise by an additional 2–3 °C by 2050. Similarly, the studies [
4,
5], and others assume that global warming will progress.
It has been proposed that Russia (especially the arctic and subarctic regions) will find itself among the regions with the most intense warming effect [
6].
The general rule regarding the impact of global warming is an increase in water flow in cases where the increased evaporation does not exceed the increase of precipitation [
6].
Regional research into the expected impact of warming on the water flow predicts the northern hemisphere and Siberian rivers to show the greatest increases in annual water flow (from over 8% in the beginning to 17% at the end of the 21st century) [
6]. For Yakutia, some researchers expect no significant change in the water flow of the Lena river lowland basin in the first half of the 21st century, while they predict that the water flow in that area will increase within the 10% limit [
7]. It is very likely that the increase in the flow of the Lena river proposed in the article [
8] will eventuate.
The studies [
9,
10] on the effects of global warming on actual river discharges indicated discrepancies between the observed discharge and precipitation trends in the Panarctic regions. They assume that the river discharge forecast may be incorrect if based on models of expected long-term changes in air temperature and precipitation.
All these studies were focused on large river systems with large drainage basins located in various natural climate zones. However, it is unclear whether these large areas experience different local effects of global warming that influence the water flow of the tributaries combining into the overall discharge of the transregional rivers. The response of the discharge estimate of a transregional river to global warming could be significantly perturbed due to the complex interference of flow fluctuations over a huge area. Thus, the result of the study [
11] is not unexpected, because the work did not detect a statistically significant association between an increase in the air temperature and discharge of the Lena River, even though significant warming of the Lena River basin has occurred for several decades. According to data from the Institute of Global Climate and Ecology (Moscow, Russia), the average annual air temperature in the Lena River drainage basin increased by 0.3 to 0.7 °C every decade from 1976 to 2016 [
12].
It should be noted that trends in discharge changes are not always linked to active warming. They can result from natural variability.
The influence of global warming on river discharge is not limited to an increase in the discharge; it can also include changes in the properties of long-term flow fluctuations, for example, the durations of high-flow and low-flow phases of the water regimen can either increase or decrease. These changes may significantly influence certain economic characteristics, including navigation, the water supply of residential and business communities, and the functioning of hydroelectric power reservoirs. However, these water discharge reactions are not usually considered in studies.
Moreover, certain authors, including Rawlins et al., anticipate intensification of the hydrologic cycle due to the effects of global warming [
13]. Intensification can result in so-called outbursts that are not routinely observed in specific water bodies. During these outbursts, the water content dramatically exceeds the average, and extreme values that were observed prior to the onset of global warming may occur [
14,
15]. These types of catastrophic changes have been recently observed in the rivers of the Far East [
16].
We seek to identify and evaluate the changes in the water discharge regimen, considering all of these factors and effects related to global warming.
The subarctic region of Yakutia is interesting for a number of reasons. Water discharge and weather are not significantly influenced by regional anthropogenic factors in this area. All manifestations of global warming in the region can be considered background processes. The region is vast, although it is largely located within the same geographical subarctic zone, and essentially, all main rivers of the region (except River Markha) flow in the same direction towards the Arctic Ocean ([
17], pp. 16,17). Thus, considering the similar physical, geographical, and climate conditions of the rivers of the region, a comparative analysis of the changes in the water regimen of various rivers is of importance in the context of global warming, provided that these changes exist.
It should be noted that little study has been done on this region, and there is an insufficient number of publications on the subject. The only directly relevant manuscript published in recent decades is the work [
18] that evaluated the most general changes in the water regimen of rivers in the northern zone of the Far East. This study emphasized the changes in the water content phases from high to low levels in the 1970s and 1980s in the rivers of the region within the western sector of the area, which is also considered in the current study, and found a significantly more pronounced trend in the eastern sector.
Thus, the current study addresses the following questions:
Is the actual overall water content increasing in the rivers, as predicted by prognostic modeling, and are the long-term fluctuations of the water content enhanced?
Are the cycling and outbursts of the annual discharge significantly influenced by climate change?
2. Materials and Methods
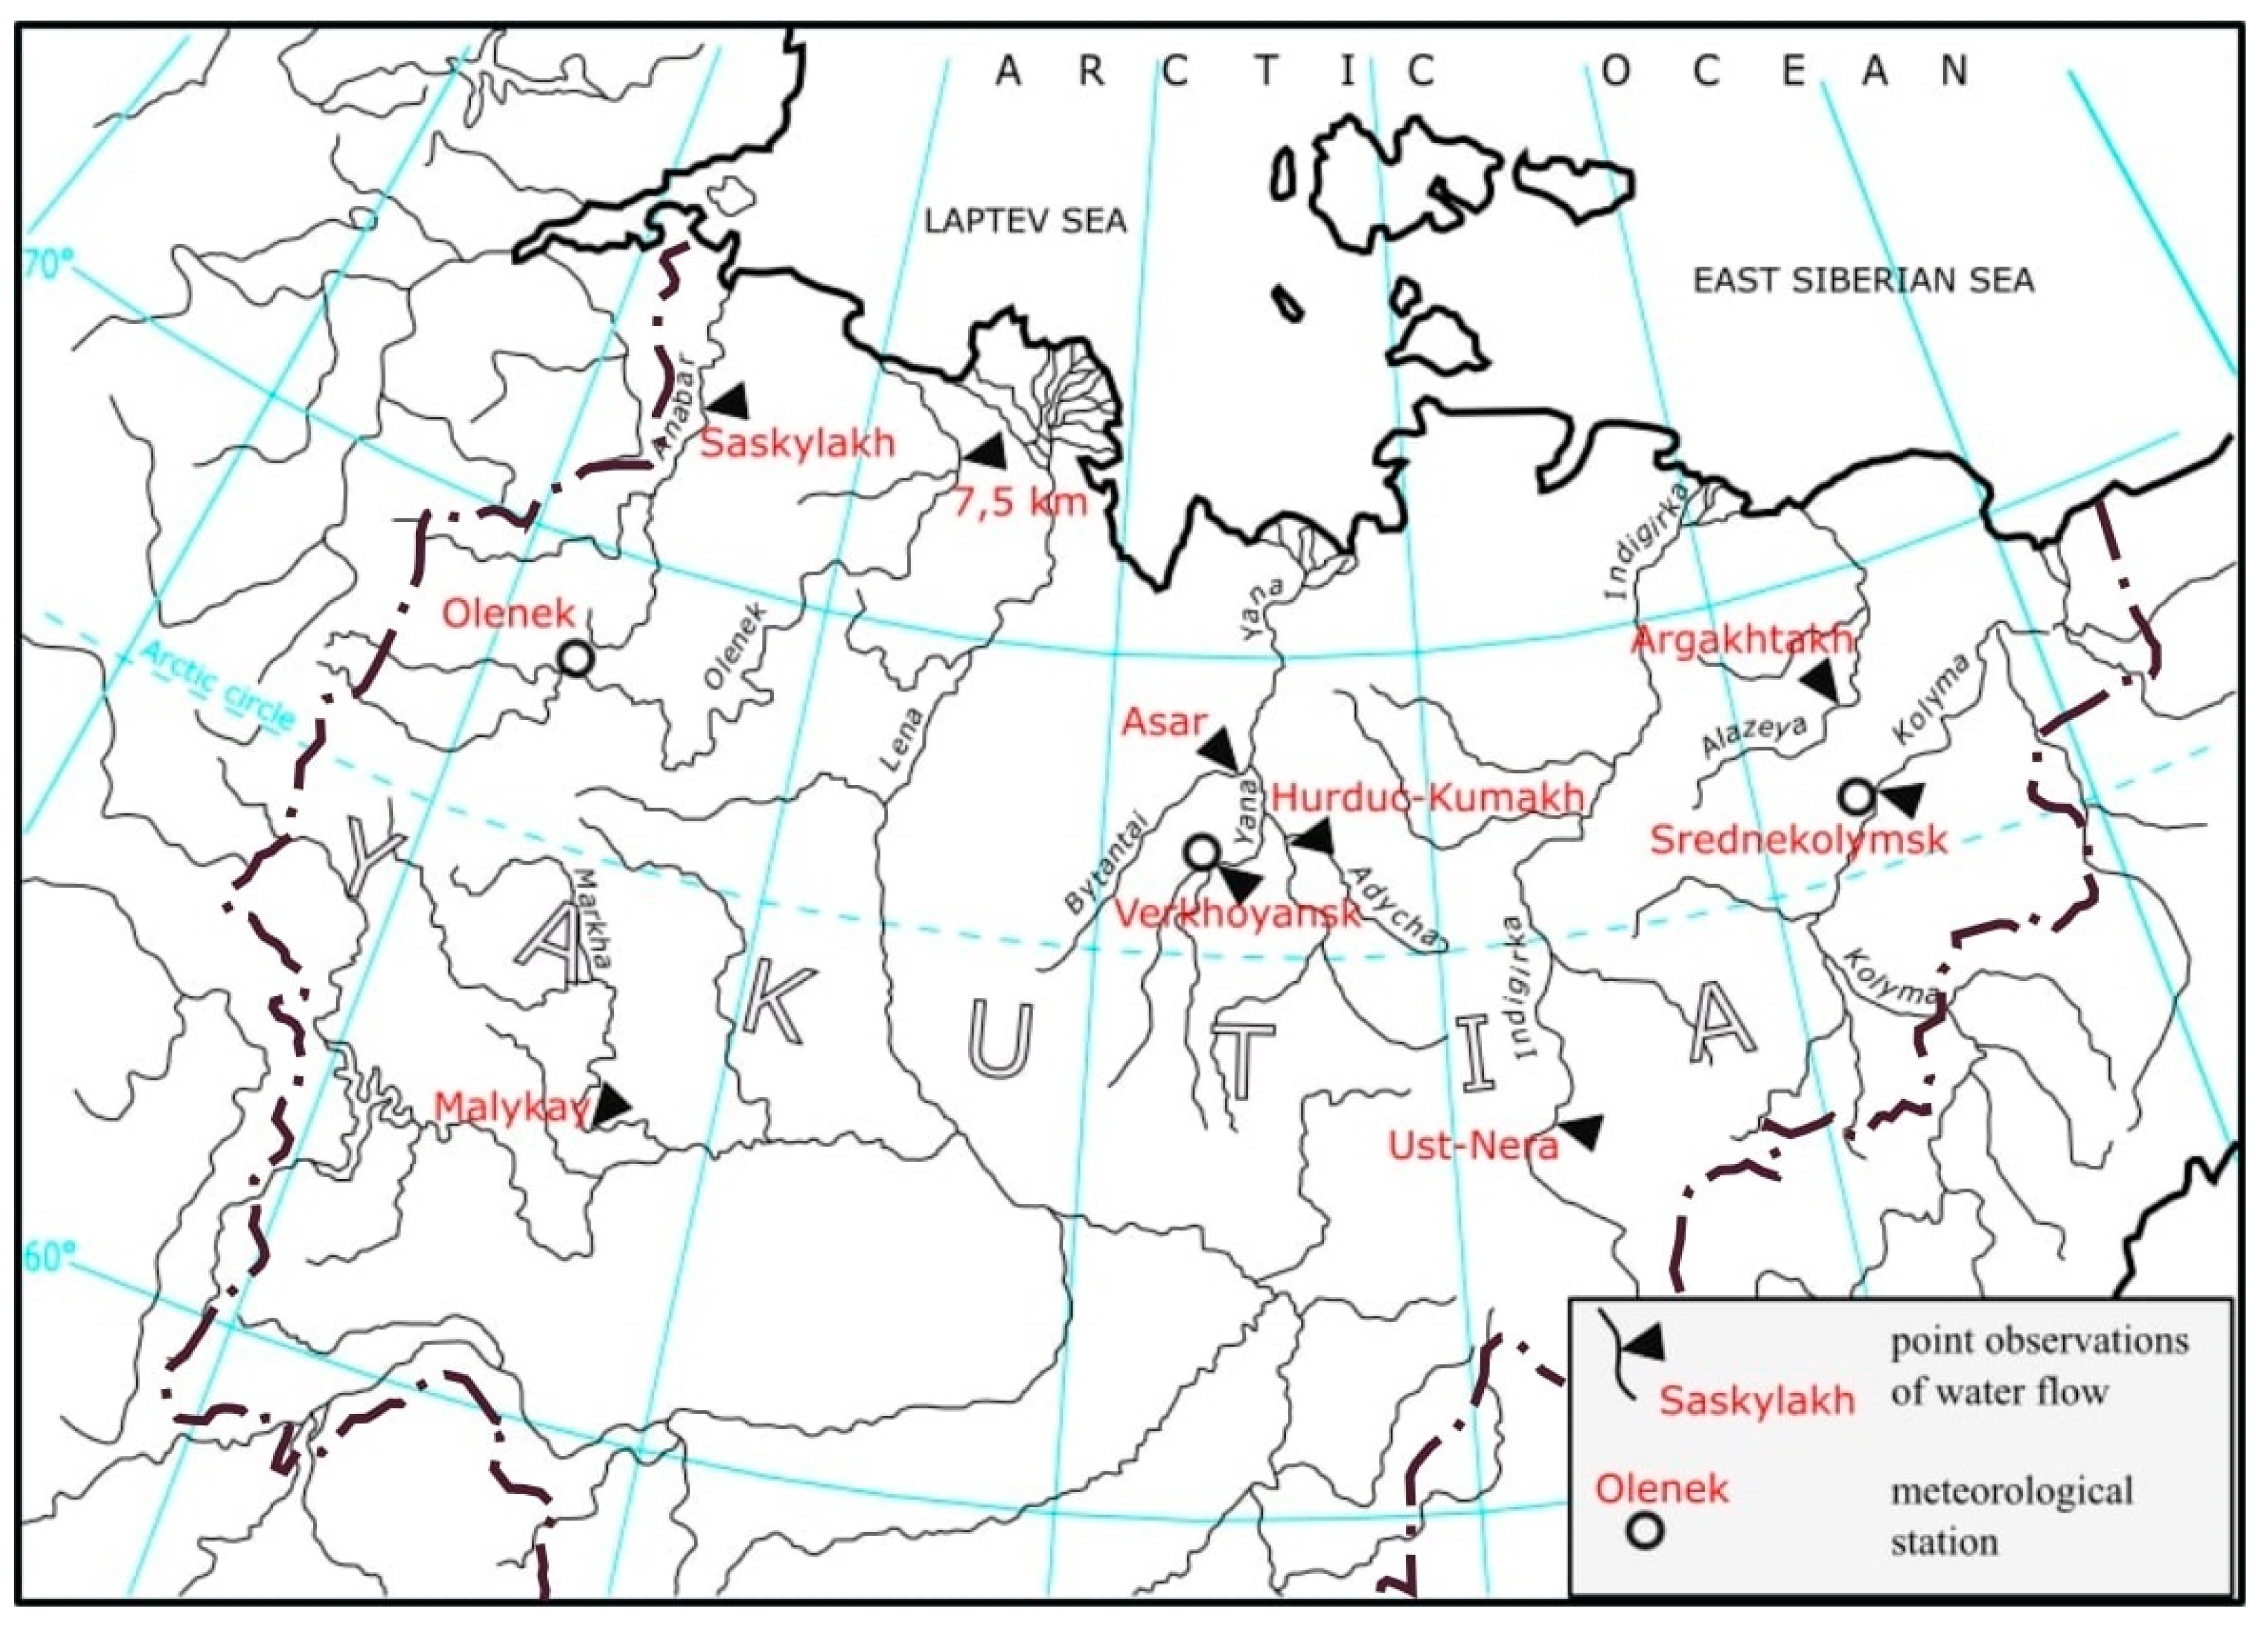
This study analyzed the impact of climate warming on the nature of long-term fluctuations in water flow in the subarctic regions of Yakutia in rivers such as the Olenek, Markha, Anabar, Yana (with tributaries), Indigirka, Kolyma and Alazeya rivers (
Figure 1). The Lena river was not considered in this research since its water flow is formed in the more southern regions, and it only transits through the subarctic zone.
The average annual air temperature data were gathered from the meteorological stations in different areas of the subarctic zone of the Sakha (Yakutia) Republic (67–68° north latitude). The Olenek station is in the northwest, the Verkhoyansk station is in the north, and the Srednekolymsk station is in the northeast of the region. The geographical characteristics of the meteorological stations that are of the greatest importance in the context of the current study are listed in
Table 1 [
19].
The data presented in
Table 1 show that the analyzed meteorological stations are located at approximately the same longitude and are distributed over the whole subarctic zone of Yakutia. The altitudes and general geographical positions of the stations correspond to the orographic and geographic conditions observed on the majority of the drainage zones of the rivers, as described in the present study. Only the most upstream drainage of the Anabar and Kolyma Rivers (500–1000 m above sea level) and the Yana, Adycha, and Bytyntai Rivers (1000–2000 m above sea level) is significantly different. The Yana River basin (together with tributaries) has different drainage because it is constrained on three sides (west, south, and east) by the Verkhoyansk Range, Chersky Range, and Suntar-Khayata Range [
17]. Active meteorological stations are absent from the mountain regions at a longitude of around 68°.
The points used for observing the water flow had to meet the following requirements: (1) located in the subarctic region of Yakutia, and (2) established and started operating prior to 1963. The data on the catchment areas for the hydrological posts used in this study are given in
Table 2.
Hydrometeorological data collected from 1963 to 2015 were used in this research. Data on the annual discharge at the observation points were taken from the official calculated parameters prepared by the Russian Federal Service for Hydrometeorology and Environmental Monitoring [
20]. Data on the water discharge are presented as modular discharge coefficients, determined as the ratio of annual discharge to the long-term average discharge.
In order to analyze the changes in the intensity of temperature growth, we used the double alignment method. Specifically, data on the average annual air temperature were aligned first to the 5 year moving average (centered), and then, 20 year moving linear trends at 1 year intervals were calculated based on the results of that alignment. The slope of the linear trend characterized the intensity of the air temperature change within the 20 year segments of the estimation period, and the time-series of those slopes were used to determine the changes in warming intensity for the whole estimation period. The moving 20 year linear trend window was used according to the recommendations in [
21]. According to the description of the method, the length of the temporal window should be approximately one third of the length of the analyzed temporal sequences, and should ideally be sufficiently long to permit evaluation of the global climate factors; for example, 11 year periods of solar activity. A temporal window of 20 years was used to partially meet both requirements; unfortunately, the length of this period could not be increased due to the relatively short duration of the observation period. The double smoothing method provides a clear pattern of change intensity, because it does not have the disadvantages associated with the subjective division of the temporal sequence into intervals and subsequent identification of the trends within each interval.
We determined the nature of the long-term air temperature and water level fluctuation cycles with the visual-graphic method, basing the results on the extremes of the fluctuation amplitude. We consider this method to be the only approach that identifies primary cyclic fluctuations and major trends.
Determination of the significant trends in the long-term fluctuations of river discharge is the main parametric method for identification of the changes in water regimen parameters.
In the current study, the general sequence of observations was verified as stationary as a first step. Stationary characteristics were confirmed by two assumptions, the constant variance, which was verified by the paired variance F-test (Fisher test) ([
22], pp. 111,112), and the constant mean, which was verified by the paired t-test (Student’s test) ([
22], pp. 109–111) in cases with different and similar variances, depending on the outcome of the F-test. The error margin α was set at 0.05.
As both assumptions were confirmed, the sequence was treated as stationary, it was deemed to have no significant changes due to global warming. If the general sequence was not stationary, the same method would be used to analyze the stationary characteristics of the sequence from the beginning of observation to the time point corresponding to the most stable warming period in a particular region. The borderline was selected as the year 1988, as explained in the subsequent text. If the sequence was stationary during this time frame, the events that led to the loss of the stationary properties of the general sequence must have occurred after 1988—during warming. Additionally, changes in long-term fluctuations after 1988 were qualitatively analyzed based on graphs of long-term discharge fluctuations.
3. Results and Discussion
First of all, it should be mentioned that the warming process was uneven in Yakutia.
On average, there were three major periods of temperature direction changes in the last century: a warming period from 1916 to 1945, a fall in temperature from 1946 to 1975, and another warming period from 1976 to the present day. This latest warming period was significantly more intense than the previous ones. A sharp warming trend can be observed starting from the 1970s. The recent decades, namely the 1980s, 1990s, and 2000s, were the warmest [
23]. This generalization is based on observations from the oldest meteorological stations in Sakha (Yakutia). In contrast, the average annual temperature fluctuation charts from the observation points of the subarctic stations show a somewhat different picture (
Figure 2).
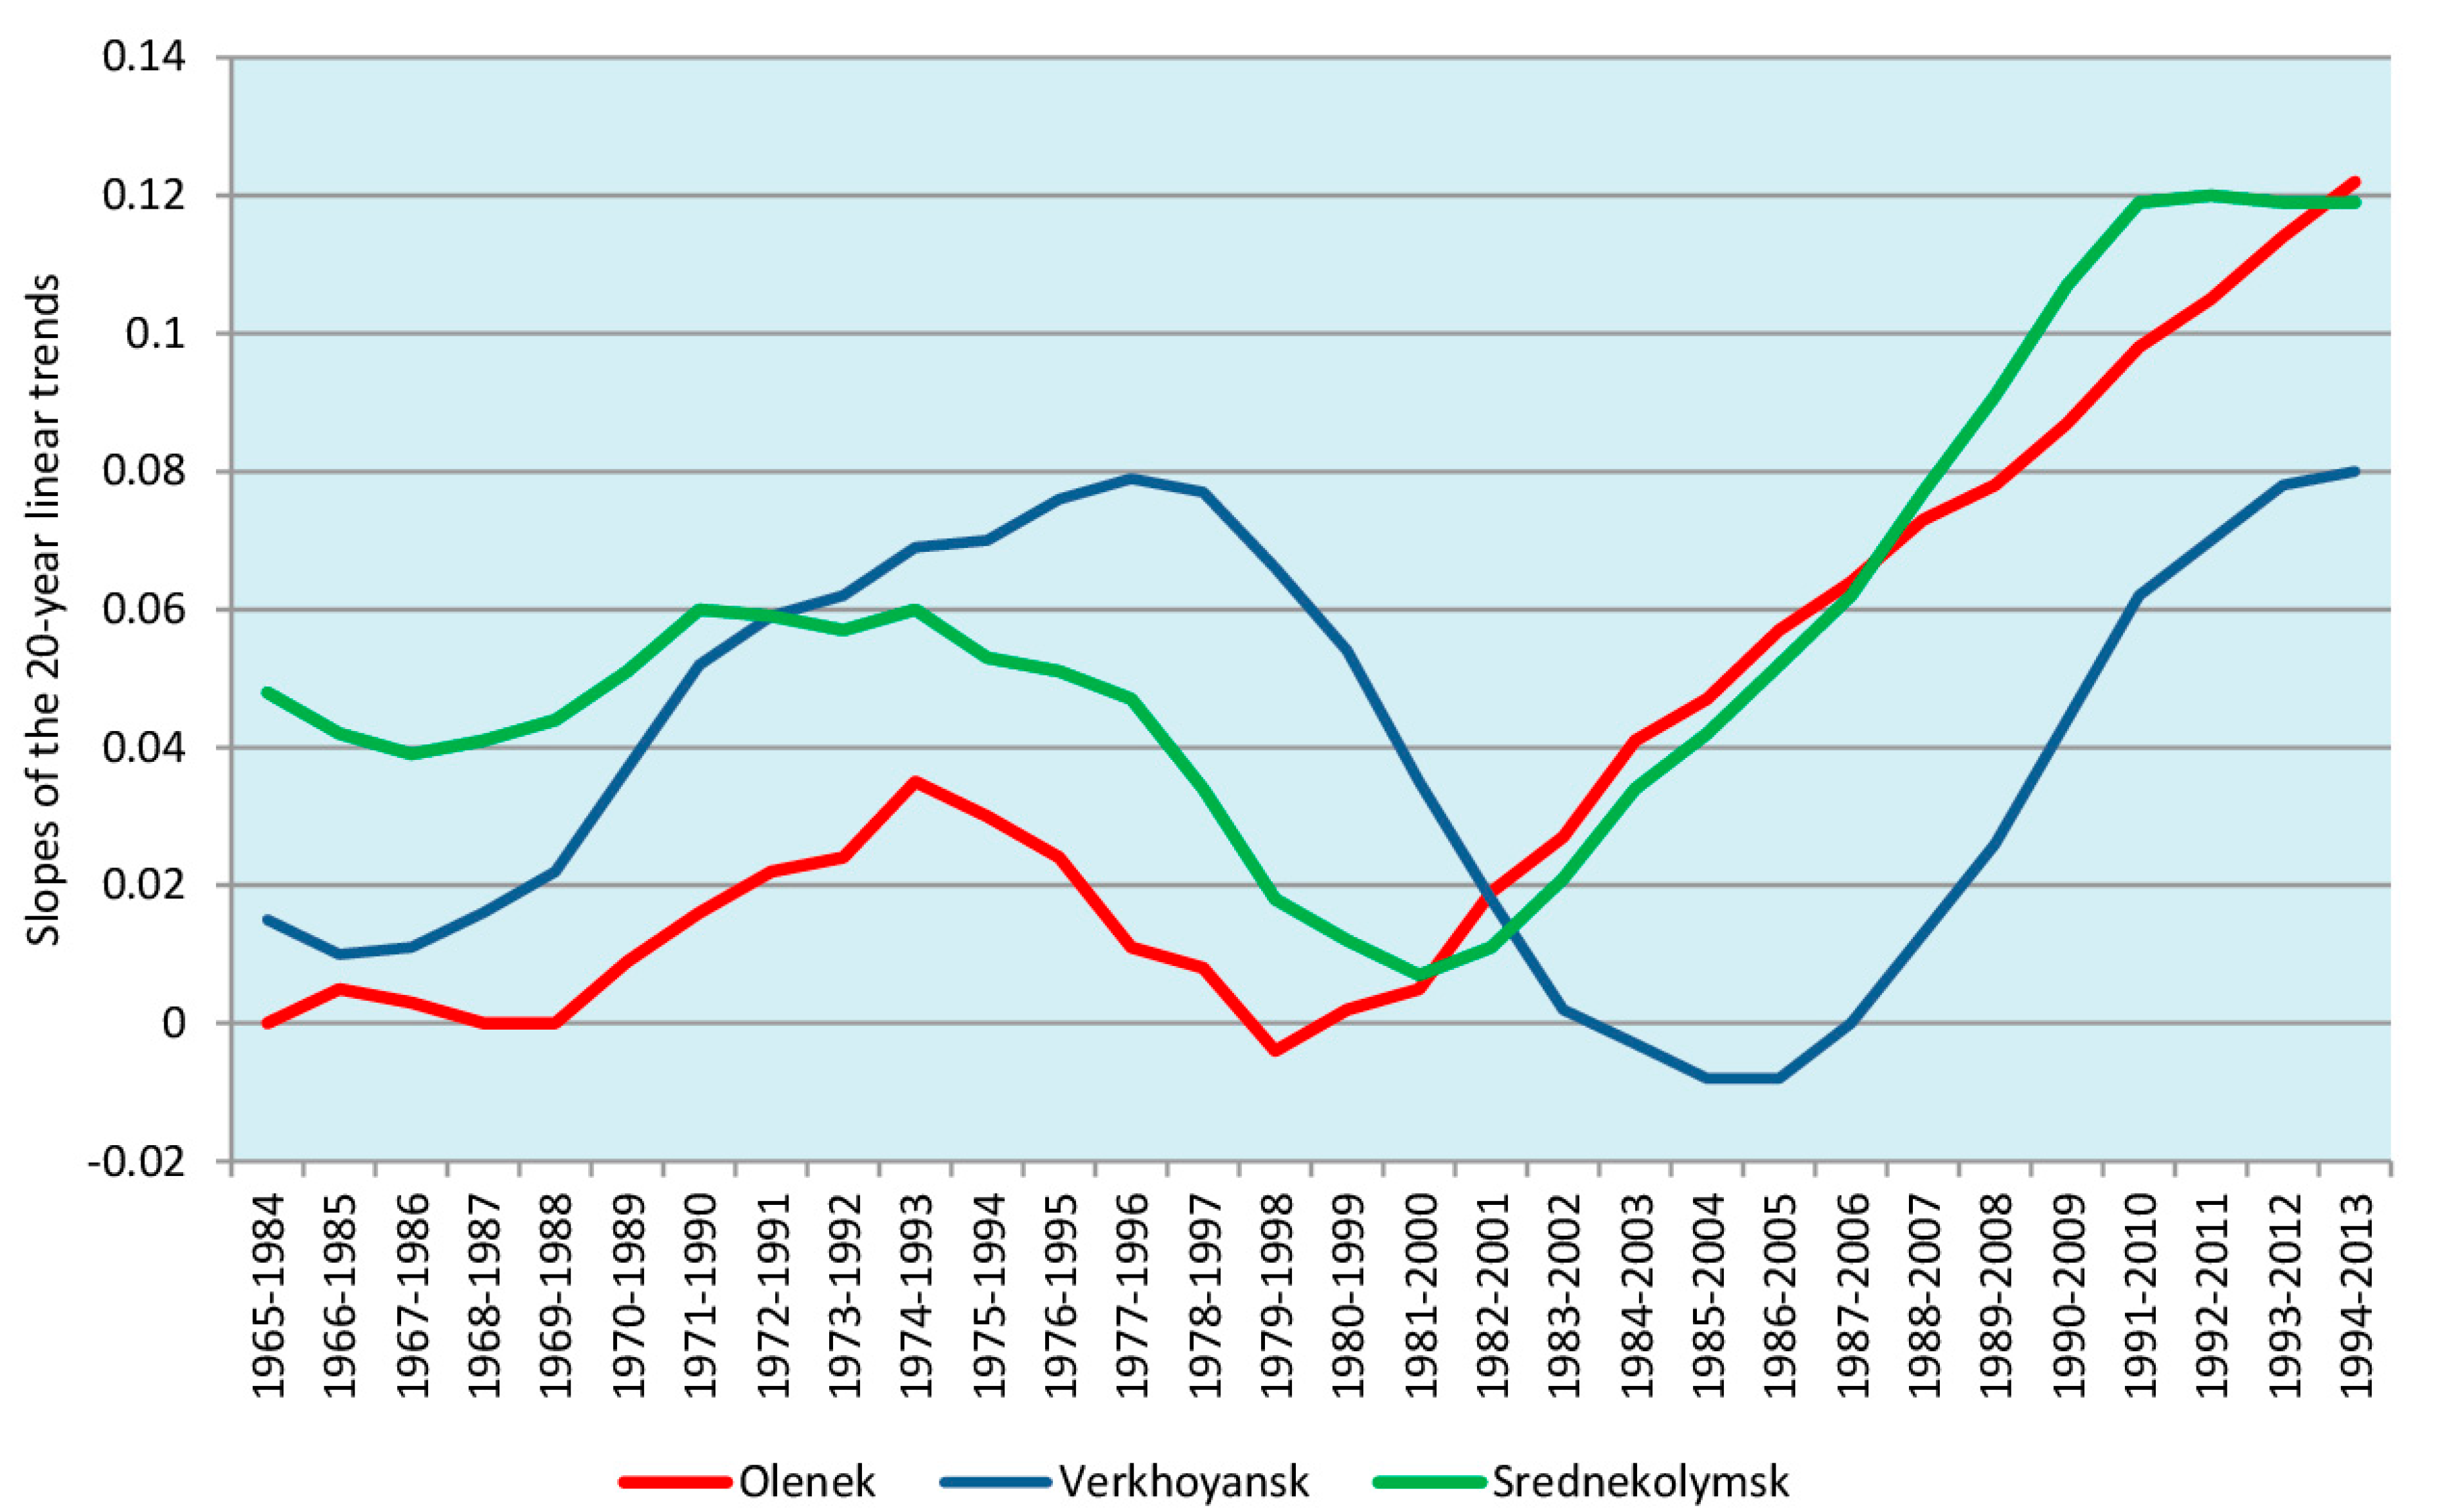
The main trends in the changes of average annual air temperature were identified visually using the graphs presented in
Figure 2 based on identifying the maximal and minimal amplitudes of the fluctuations while keeping the interval between the highest and lowest values constant within the analyzed period. The trends indicate that a transition from a relatively stationary state to a stable increase in the mean annual air temperature occurred at the end of the 1980s at all three observation stations. For the purpose of further comparing some statistical features of the water flow “before” and “after” the intense warming period, we chose 1988 as the point of transition to the most intense warming mode. This time point is marked with a vertical dotted line in
Figure 2. This year divides the whole analyzed period almost in half (an exact division is not possible due to the odd number of years in the sequence), as required for statistically accurate comparison of the parameters of the first and second parts of the analyzed sequence.
A warming trend is clearly indicated by the local minima of the mean annual temperature fluctuations shown in
Figure 2. The local maxima also support this trend (more-so in Srednekolymsk, and to a lesser extent in Verkhoyansk). However, in Olenek, the trend is essentially absent because the local maxima are only slightly lower during the mid-1960s to early 1980s than in the second part of the 2000s.
The F-test and t-test indicated an absence of stationarity in the atmospheric temperature; for all three series, the zero hypothesis on the equality of mean values was not confirmed. However, the testing of the series prior to 1988 revealed that, in this time period, all three temperature series were stationary. Therefore, the violation of stationarity (the emergence of a positive trend) should be attributed to the period after 1988.
The main statistical parameters of the air temperature series are shown in
Table 3.
Overall, the mean annual air temperature was similar in the western and eastern regions, but 3 °C lower in the central region (
Table 3).
Changes in the average annual temperature between the sections of the analyzed period were considered warming indicators. In western subarctic Yakutia, the change was +1.0 °C; in the central region, it was +1.2 °C; and in the eastern section it was +1.4 °C. Thus, the increase in the mean long-term air temperature was enhanced by 40% from west to east.
Charts based on the results of the double alignment method (described above) were used to show the changes in trends more vividly (
Figure 3).
Figure 3 shows that the warming intensity in the subarctic regions of Yakutia changed in two of the measured cycles. The first increase in intensity began almost simultaneously in all three observation areas at the end of the 1980s. From the mid-1990s, the intensity started to decrease, but with the beginning of the new century, it increased again and continued to increase until the mid-2010s, exceeding the previous peak of intensity. The meteorological station in Verkhoyansk was the only exception to these changes. There, the decrease in the warming intensity continued up until the second half of the 2000s, and the peak of the second wave’s intensity did not exceed that of the first wave.
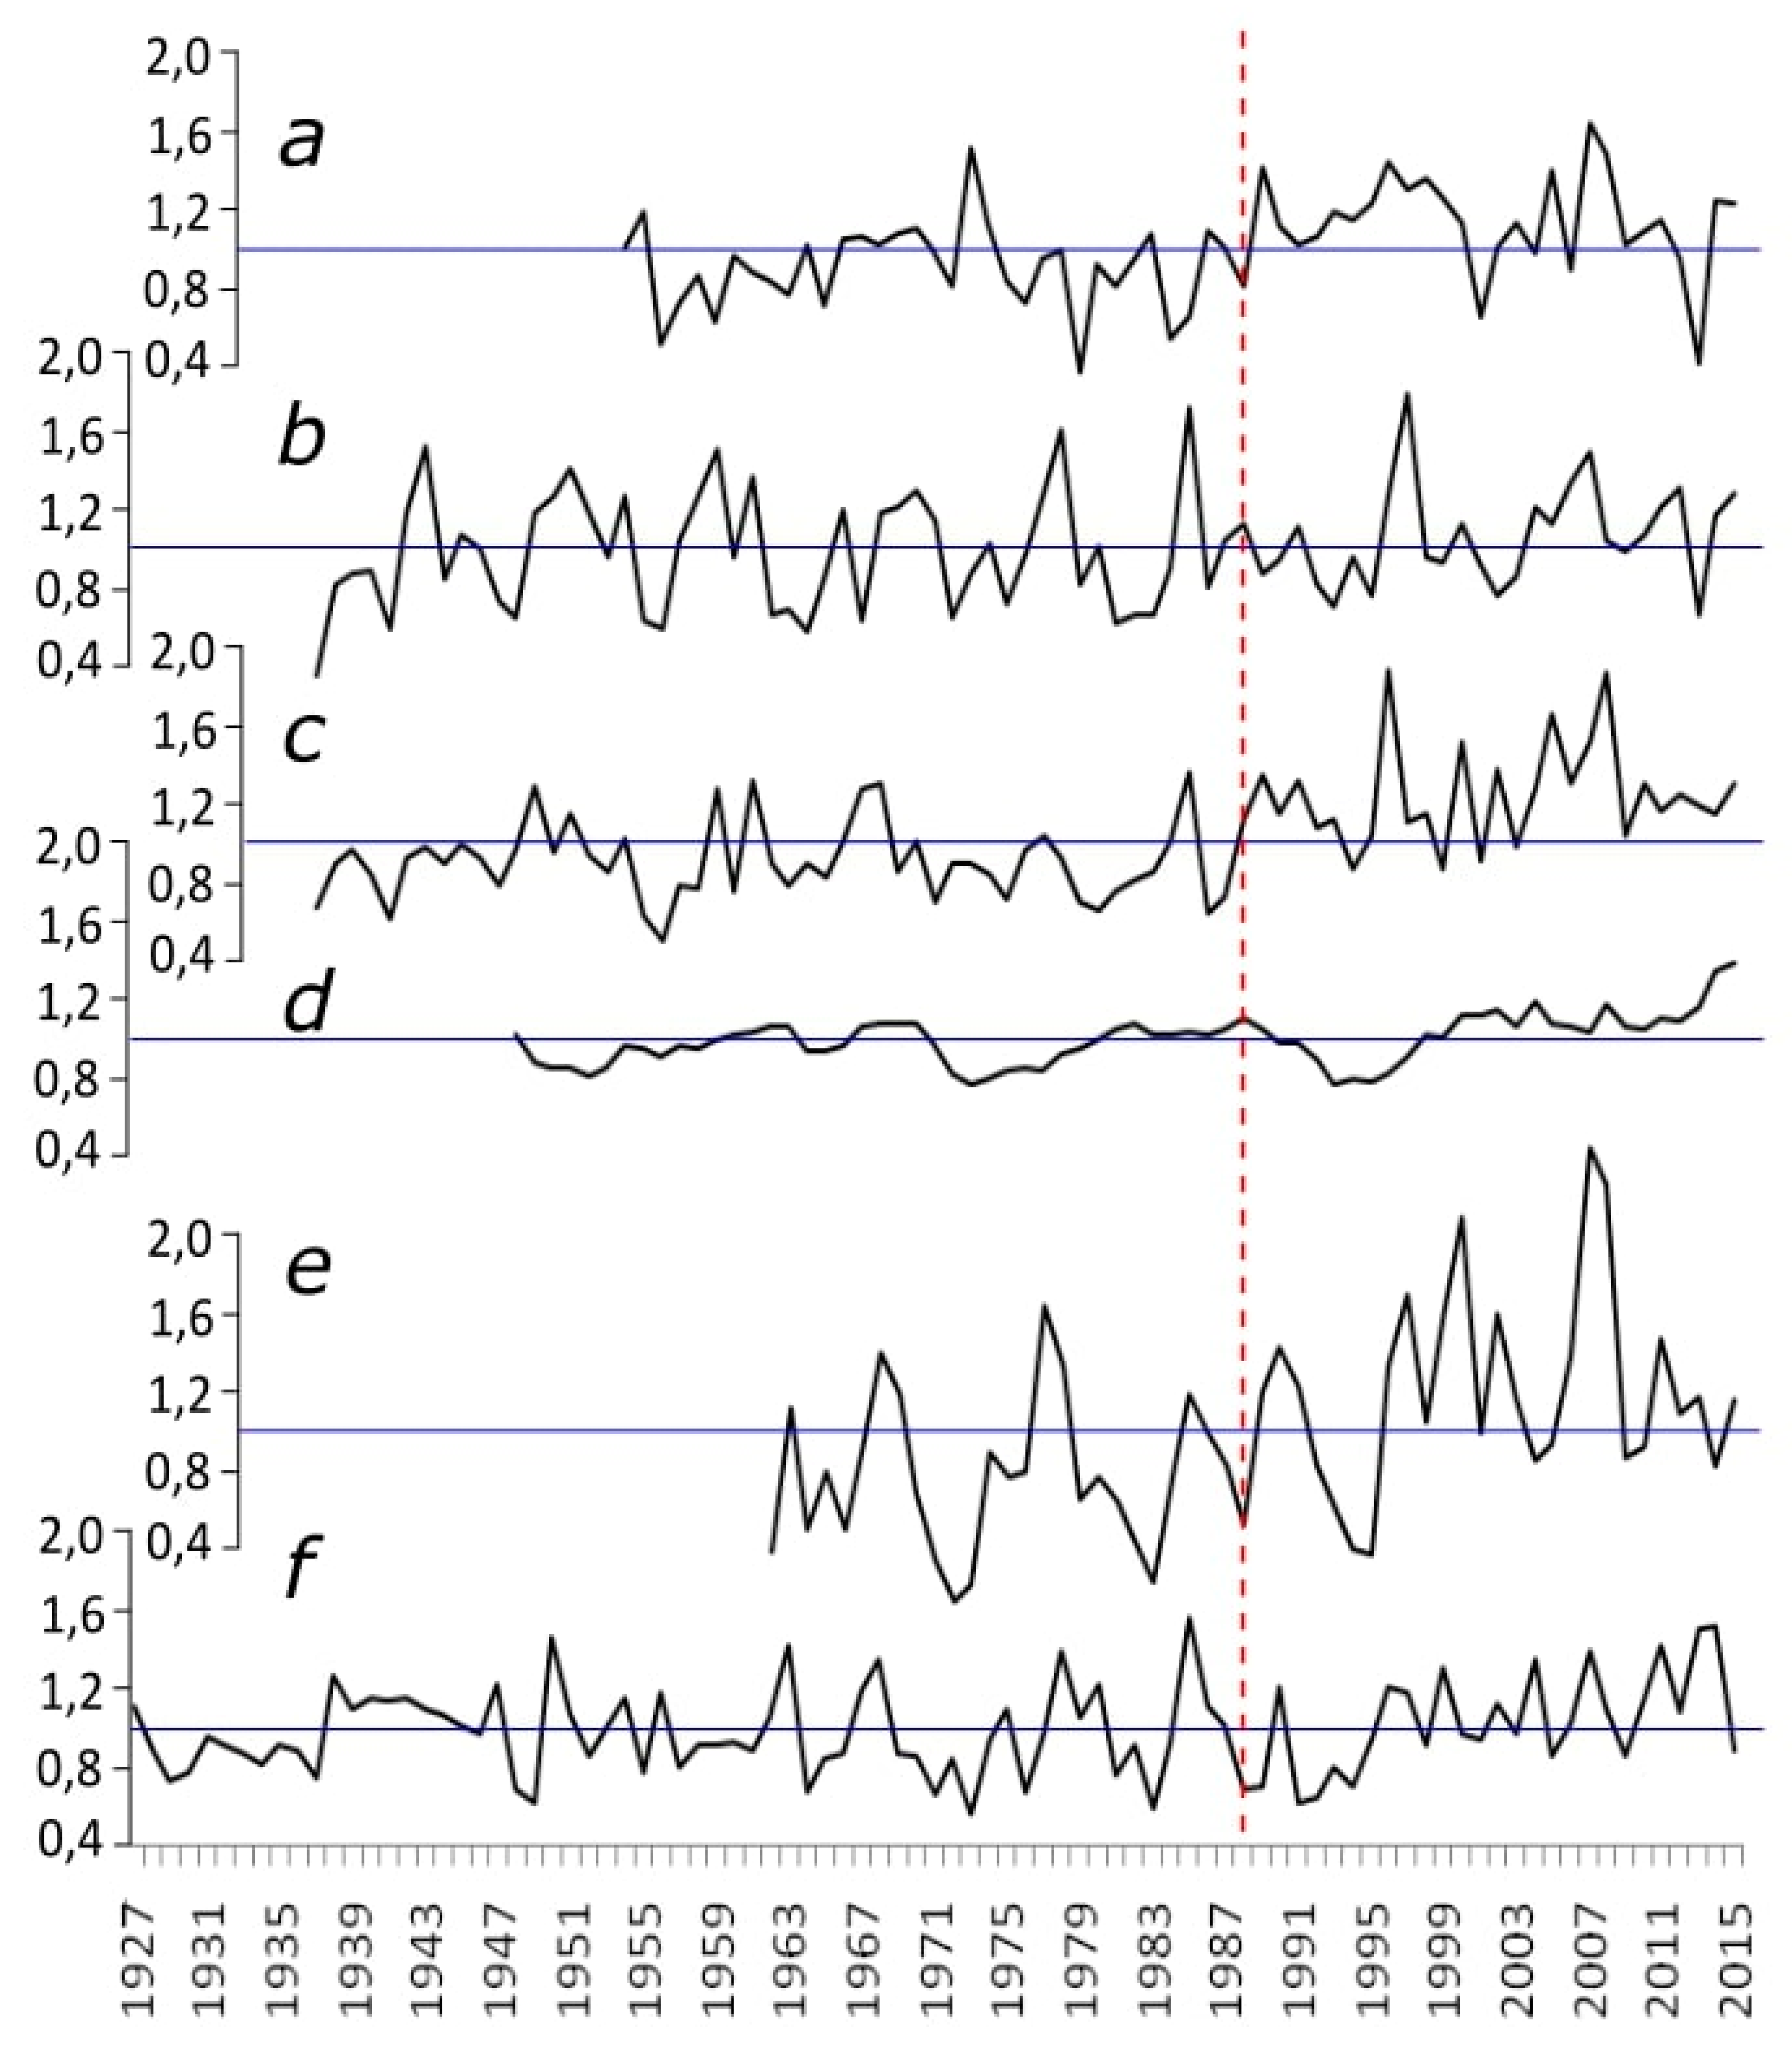
The nature of the water flow fluctuations under those climate conditions varied in different regions of Yakutia, but in different ways (
Figure 4).
Figure 4 shows chronological graphs of changes in the annual runoff of several rivers considered in this paper. Chronological charts for the remaining water bodies are shown in separate figures (
Figure 5 and
Figure 6).
It can be established visually from
Figure 4 that deviations in the characteristics of the water regime (in the direction of increasing annual flow) in the period after 1988 occurred at points such as Adycha, Hurduc-Kumakh (
Figure 4c), Alazeya, Argakhtakh (
Figure 4e), and at the very end of the assessment period, they occurred at Indigirka, Ust-Nera (
Figure 4d). No significant changes were observed at the remaining points.
For an objective assessment of changes in the nature of long-term fluctuations in river flow, the flow series were tested for stationarity, both for the entire observation period and for the period up to 1988, using the F-test and the t-test. The results of the assessment are presented in
Table 4. The runoff series of eight of the nine water bodies were assessed as stationary up until 1988 (Yana, Verkhoyansk; up to 1984). Post-1988, subsequent development in the four rivers led to a violation of stationarity and the formation of a positive trend.
The rivers with basins located in the northwest of Yakutia (Anabar, Markha, and Olenek) were not significantly affected in terms of changes in the nature of their long-term fluctuations. As can be seen from
Figure 5, the water flow deviations from the norm (both upward and downward) within the maximum warming period did not exceed the deviations observed in the previous periods, and the fluctuations themselves quite clearly followed the fluctuation patterns defined earlier (a sine wave).
Cyclic functioning of the long-term fluctuations of the analyzed rivers is described by the following equation:
where
Q is the annual water discharge and
t is the time (years).
The equation is based on the parameters chosen in order to minimize the mean square deviation.
The stationary state of the discharge was evaluated based on recalculated data, excluding the cyclic component. The lack of a stationary state of the sequences is manifested by an increasing trend, although the significance of the trend was only confirmed by the full set of criteria in the case of the Olenek station (7.5 km after the Buur River inflow). In all other stations, the stationary tests only had constant variance.
Considering the type of cyclic fluctuations and lack of clear changes in long-term fluctuations, the trend of an increase in water content is apparently due to the high-water phase of water content fluctuations after 1988; however, the Olenek River had a low water phase, and the Markha River had a complete cycle of fluctuations. In both cases, an increase in the water content after 1988 should have resulted in a growth trend; however, it is possible that the stationary sequence of the discharge could be restored following low water phases in these rivers within the next 10–15 years.
In other rivers of the region, from west to east, certain rivers showed a complete lack of changes in their water regimens with stationary long-term discharge sequences throughout the whole period. These rivers belong to the western part of the Yana River basin (for example, Bytyntai River) and the Kolyma River located at the eastern border of the subarctic region of Yakutia.
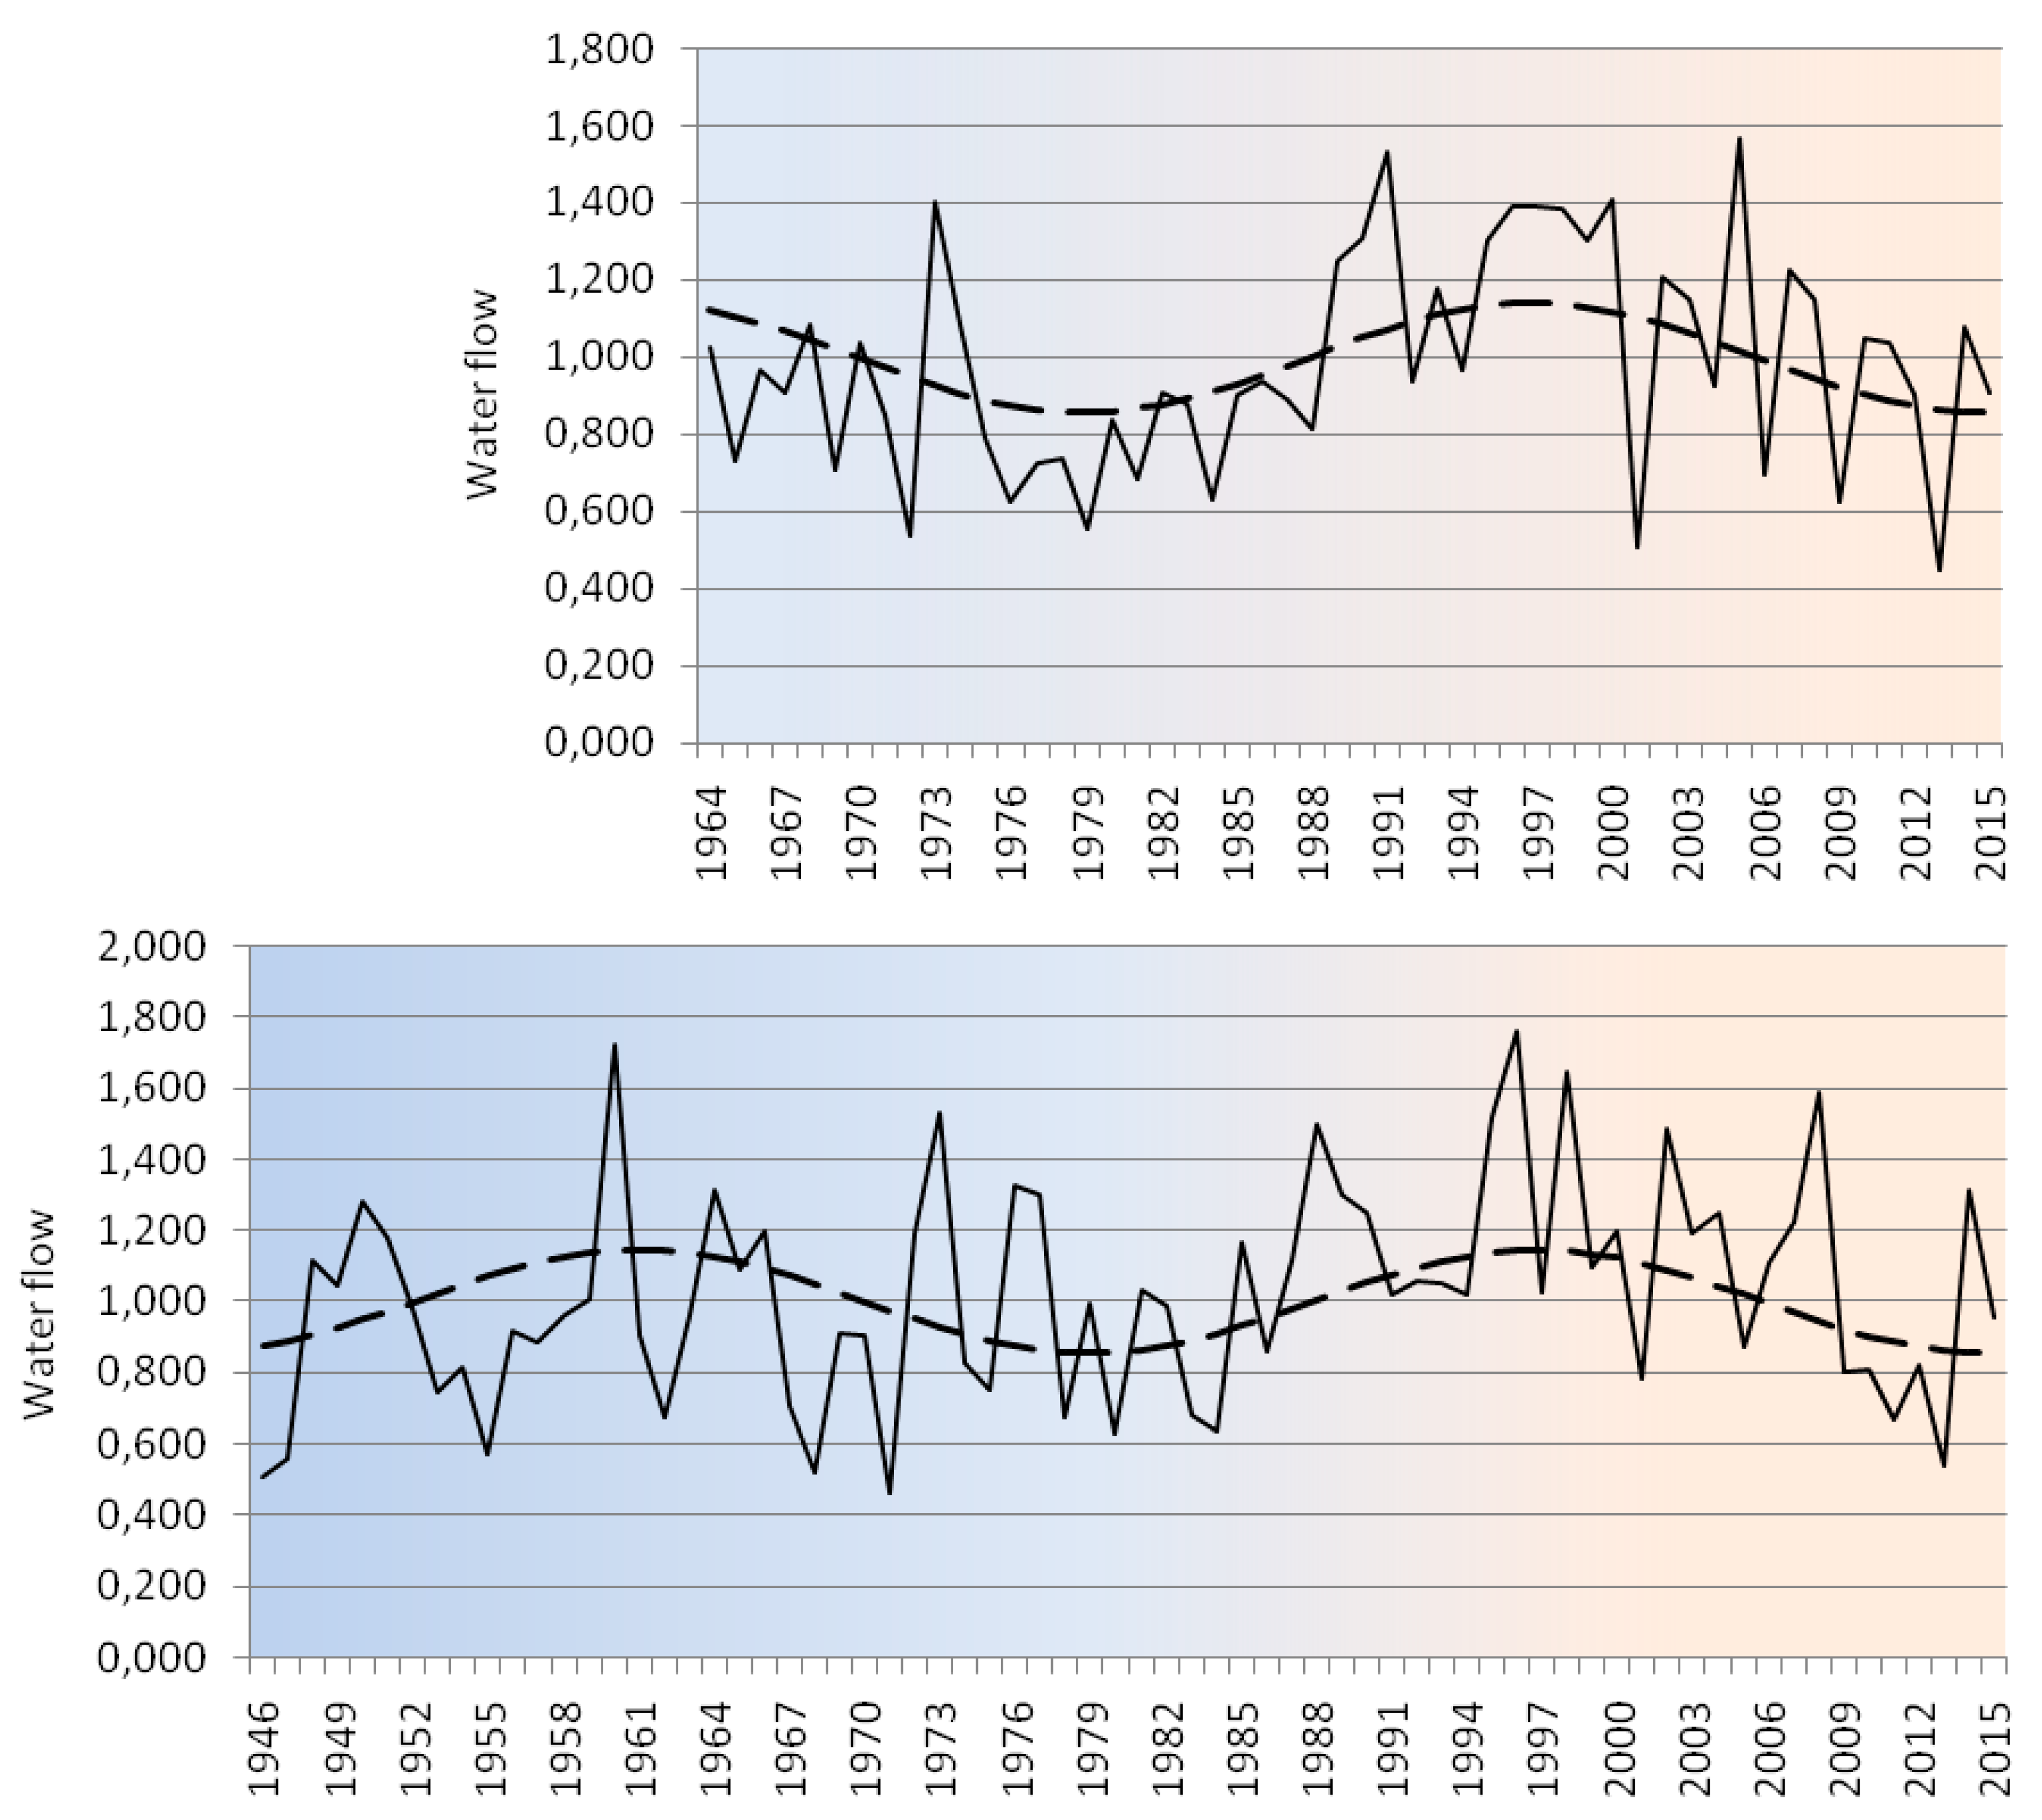
Significant changes in the nature of the long-term water flow fluctuations can be observed in the north and northeast of Sakha (Yakutia) in the basins of the Yana (except the Western part) and Alazeya rivers. Thus, for example, up until the beginning of the 1980s, the average fluctuation amplitude of the annual water flow in the Yana river in the vicinity of Verkhoyansk was within 0.4–1.4 times the norm, but in the following period, much higher values of water flow were detected—up to 1.8–2.0 times the norm (
Figure 6).
Such cases, known as “outbursts” occur from time to time (once every 8–12 years) when extremely high (the maximum water content in these cases is more than 1.3 times the usual maximum) water flows are observed for a year, followed by normal changes in the water flow. The long-term water flow fluctuations chart for the Yana River in the vicinity of Verkhoyansk shows the extent to which the water levels in those extreme periods exceeded the upper limit of the long-term fluctuations.
The first such “outburst” was observed in the Yana River in 1985. Before that, the water flow fluctuations were within approximately normal limits, but in 1985, the fluctuation range increased up to 1.5 times the norm.
Similar changes in the nature of the long-term fluctuations were observed in the Yana’s right tributary, the Adycha River.
The water flow scope in cases of extremely high water levels after 1984 in those rivers was up to 1.8–2.0 times the norm, and in some rivers within the Yana river basin (e.g., the Borulaakh River), it was even up to 3.0 times the norm. In contrast, up until the mid-1970s, the water level was 1.5–1.6 times the norm at most.
It should be noted that evaluation of the stationary state of the sequences in the Yana and Adycha Rivers based on the described criteria indicated that the long-term sequences of discharge fluctuations were initially stationary, followed by the loss of this stationary state due to the described events, which began in 1985 and 1996 in the Yana and Adycha Rivers, respectively.
The Yana River at Verkhoyansk has only had three outbursts: in 1985, 1996, and 2004. Apart from similar outbursts to those observed in the Yana River, the Adycha River has lacked low water years starting from the mid-1990s; only three times out of 20 has the annual discharge been below the normal values, and it never decreased below 0.8 times the normal values. Thus, the overall sequence of the long-term values of the flow in these stations can be considered non-stationary, with an increasing trend that is significant according to the F-test and t-test.
A similar pattern of changes in the characteristics of the long-term water content fluctuations was observed in the Alazeya River; the outbursts in 2000, 2007, and 2008 ranged from 2.0 to 2.5 times the normal values, and a lack of low water years was observed from the second half of the 1990s to the present time. The relatively short observation period used in this study (since 1962) does not allow us to draw conclusions on whether this increase in the water level is normal for the river’s high-water cycle, or if the long-term fluctuation nature has changed in a similar way to the rivers mentioned above.
Finally, the most significant changes in the characteristics of the long-term fluctuations in the Indigirka River happened only by the end of the analyzed period, in 2014 and 2015. These years cannot be defined as outbursts because the annual water flow was only 1.3 and 1.4 times that of the normal values, respectively. However, in most cases, the annual flow did not exceed 1.1 times the normal values during the whole observation period of over 60 years.
The flow sequences of the Alazeya and Indigirka Rivers prior to 1988 were evaluated as stationary, while the sequences of the whole observation period were shown to be non-stationary and characterized by an increasing trend.
Overall, there was an increase in the water level in all water bodies within the period of maximum warming (1989–2015) in the subarctic region (
Table 5).
The water content of the water bodies under review increased, on average, by 23.3%. The highest increase in flow was observed in certain northern and northeastern rivers of the subarctic zone of Yakutia. In general, the suggestion of climate models that the flow of the rivers in the subarctic zone of Yakutia has increased with global warming is confirmed. However, it should be noted that the long-term changes detected in flow dynamics may have various causes. An increase in the flow of the rivers of the western region can be considered transient and may be associated with cyclic long-term fluctuations in the flow.
4. Conclusions
Since the mid-1980s, researchers have witnessed the most intense warming period recorded in the subarctic regions of Yakutia, and that warming is ongoing. We assessed the changes in the nature of long-term water flow fluctuations in those areas under these climatic conditions.
Assuming that the effects on water flow have been caused by global warming, warming in the subarctic region of Yakutia has resulted in extremely localized and variable characteristics with regard to the area and times of manifestation; thus, it is not possible to detect a clear trend in these events.
Moreover, it should be noted that the evaluation of actual changes in the water regimen requires a visual graphic analysis of long-term flow fluctuations in addition to quantitative characteristics, because the latter is insufficient on its own. Multiple erroneous evaluations are guaranteed without this type of analysis.
Overall, the water flow in that specific region of Yakutia has been generally increasing from 1988 to 2015. On average, an increase of 23.3% has occurred in the water bodies in question, with variations from 7.7% to 54.4% for different rivers. The Olenek River has shown the highest spikes and drops between the maximum and the minimum water flows, as shown by the history of observations between 1988 and 2015.
In the majority of the rivers of the region, long-term flow sequences were stationary from the beginning of the observation period up until 1988; consequently, this year was selected as the borderline that separates the period before and after the intense increase in the warming in the region. Certain rivers showed dramatic changes in long-term flow fluctuations, leading to disruption of the stationary states of the flow sequences. These changes were variable: two to three local maxima (“outbursts”) (Yana, Indigirka) with fluctuations that are standard for these rivers, or two to three “outbursts” combined with a long-term (up to 15–20 years) period of high flow years coupled with an almost complete lack of low flow years (Adycha and Alazeya).
The most significant changes in the nature of the long-term fluctuations were registered in the north of Sakha (Yakutia) in the Yana river basin. Most of the rivers associated with that basin began to show stable changes in the water level trend, leading to a rapid increase in the beginning of the 1990s. In terms of the general tendency of the water content periodic growth (once every in 8–12 years), there have been cases of extremely high annual runoff exceeding the norm by 1.8–2.0 times, and in some water bodies, the excess flow reached 3.0 times the norm. Such changes in the nature of the long-term fluctuations can be clearly seen through visual analysis of the water flow changes chart as cyclic fluctuations in the water levels (sine waves). We can establish the pattern for those cycles if we use an observation period of more than 60 years. If the observation period is less than that, it is not possible to come to a reasonable conclusion on the significance of the change in the long-term fluctuations, due to the fact that it is not possible to determine the very nature in question. This limitation is particularly valid for the Alazeya River.
In addition to the differences in the properties of the changes, the time frame of the changes should be noted as well. From west to east, the onset of changes in long-term flow fluctuations in the rivers of the region tended to occur in later periods. For example, the first outburst of the Yana River was observed in 1985; the period of increased flow began in the mid-1990s in the Adycha River; and it occurred in the early 2000s in the Alazeya River. However, this trend was not observed in the Indigirka River because the “outbursts” were only detected in the mid-2010s, despite the fact that the Indigirka River basin is located to the west of the Alazeya River basin.
The water flow fluctuations in the western subarctic region of Yakutia (Anabar, Markha and Olenek rivers) were within the historically established fluctuation limits (a sine wave). No changes in the nature of those fluctuations were found.
Two water bodies, Kolyma and Bytyntai, remained in the stationary state.
The lack of precise understanding of the mechanisms of regional and local influence of global warming on the changes in river flows prohibits the exact assignment of the effect of global warming to the detected significant changes in long-term fluctuations in fourof the water bodies out of nine. However, the patterns of long-term fluctuations that were not observed for the considerable observation period suggest that certain extreme factors can have dangerous consequences.


