1. Introduction
The most important role in the formation of mineral deposits is played by tectonic disruptions, fractures and other heterogeneities of the Earth’s crust, which act as reservoirs or migration routes for ore-forming fluids. The tectonic disturbances are often developed around geological bodies or the areas with contrast physical properties as compared to the surrounding rocks: these are either denser intrusive bodies, or zones with increased amount of pores or cavities of natural or artificial origin. The systems of cracks and pores in rock samples, as a rule, coincide with the spatial position of the elements of elastic symmetry (axis, plane); that is, the type of elastic symmetry and the value of the elastic anisotropy index of rocks is reflected in the actual fracturing or porosity. Spatial variations of rock fracturing determine the anisotropy of its permeability; for example, type of elastic symmetry will directly affect the results of geotechnological experiments on the possibility of extraction of the ore component by the method of underground leaching. The location of a weakly permeable ore body in permeable host rocks means a ban on the use of the in-situ leaching method [
1]. Ultrasonic methods of nondestructive analysis are commonly used to measure the elastic properties of rocks (including anisotropy index) [
2].
Recently, a number of papers, discussing application of the X-ray computer tomography (X-ray CT) method to solving different geological problems has been published (see e.g., reviews [
3,
4]). This non-destructive method was so far used, in particular, in petroleum geology—when studying reservoir properties [
5,
6], in geomechanics—to study rock disintegration [
7] and in microstructural analysis [
8,
9]. Apparently, this method can also be efficiently used in the study of ore deposits, since it allows the transition from a two-dimensional image of textural and structural features of rocks and ores (and distribution of the components of interest) to three-dimensional one [
10], thus leading to gaining important information about the mechanism of ore formation [
11]. Recently it was shown that the results of CT allow locating the spatial position of small cracks (the main cause of elastic anisotropy) in samples of anisotropic sandstones [
12].
The relationship between geodynamics and the processes responsible for the formation of uranium ore provinces and deposits is an intensively studied area of metallogeny, since the question of the geodynamic conditions favourable for uranium mineralization is still a matter of debate [
13]. The complex (petrophysical, structural, mineralogical, and petrographic) study of rocks was successfully used to forecast the uranium mineralization on the Antey—the Russia largest uranium deposit [
14].
The NW part of the Kola region—Pechenga-Litsa area—is distinguished by a special combination of tectonic structures, rock associations and ore deposits [
15], including the radioactive ore occurrences in the Litsa area. The deformation-metamorphic state of rocks of the Pechenga-Litsa area was assessed by researchers of the IGEM RAS (Moscow) using a complex petrophysical method, including determinations of density, porosity, velocity of longitudinal (V
p) and transverse (V
s) waves and the elastic anisotropy of V
p velocities [
15,
16]. The rocks of the Litsa area are characterized by minimum density due to intensive granitization processes, and maximum elastic anisotropy associated with numerous fault and shear zones [
15]. The study of rocks along the 22-km profile of W-E orientation, passing through the Skal’noe uranium ore occurrence, showed that in general, the elastic anisotropy of rocks in the ore occurrence is lower than in adjacent sites [
17], which suggests that the hydrothermal-metasomatic processes widely developed in the area have changed the physical properties of the rocks.
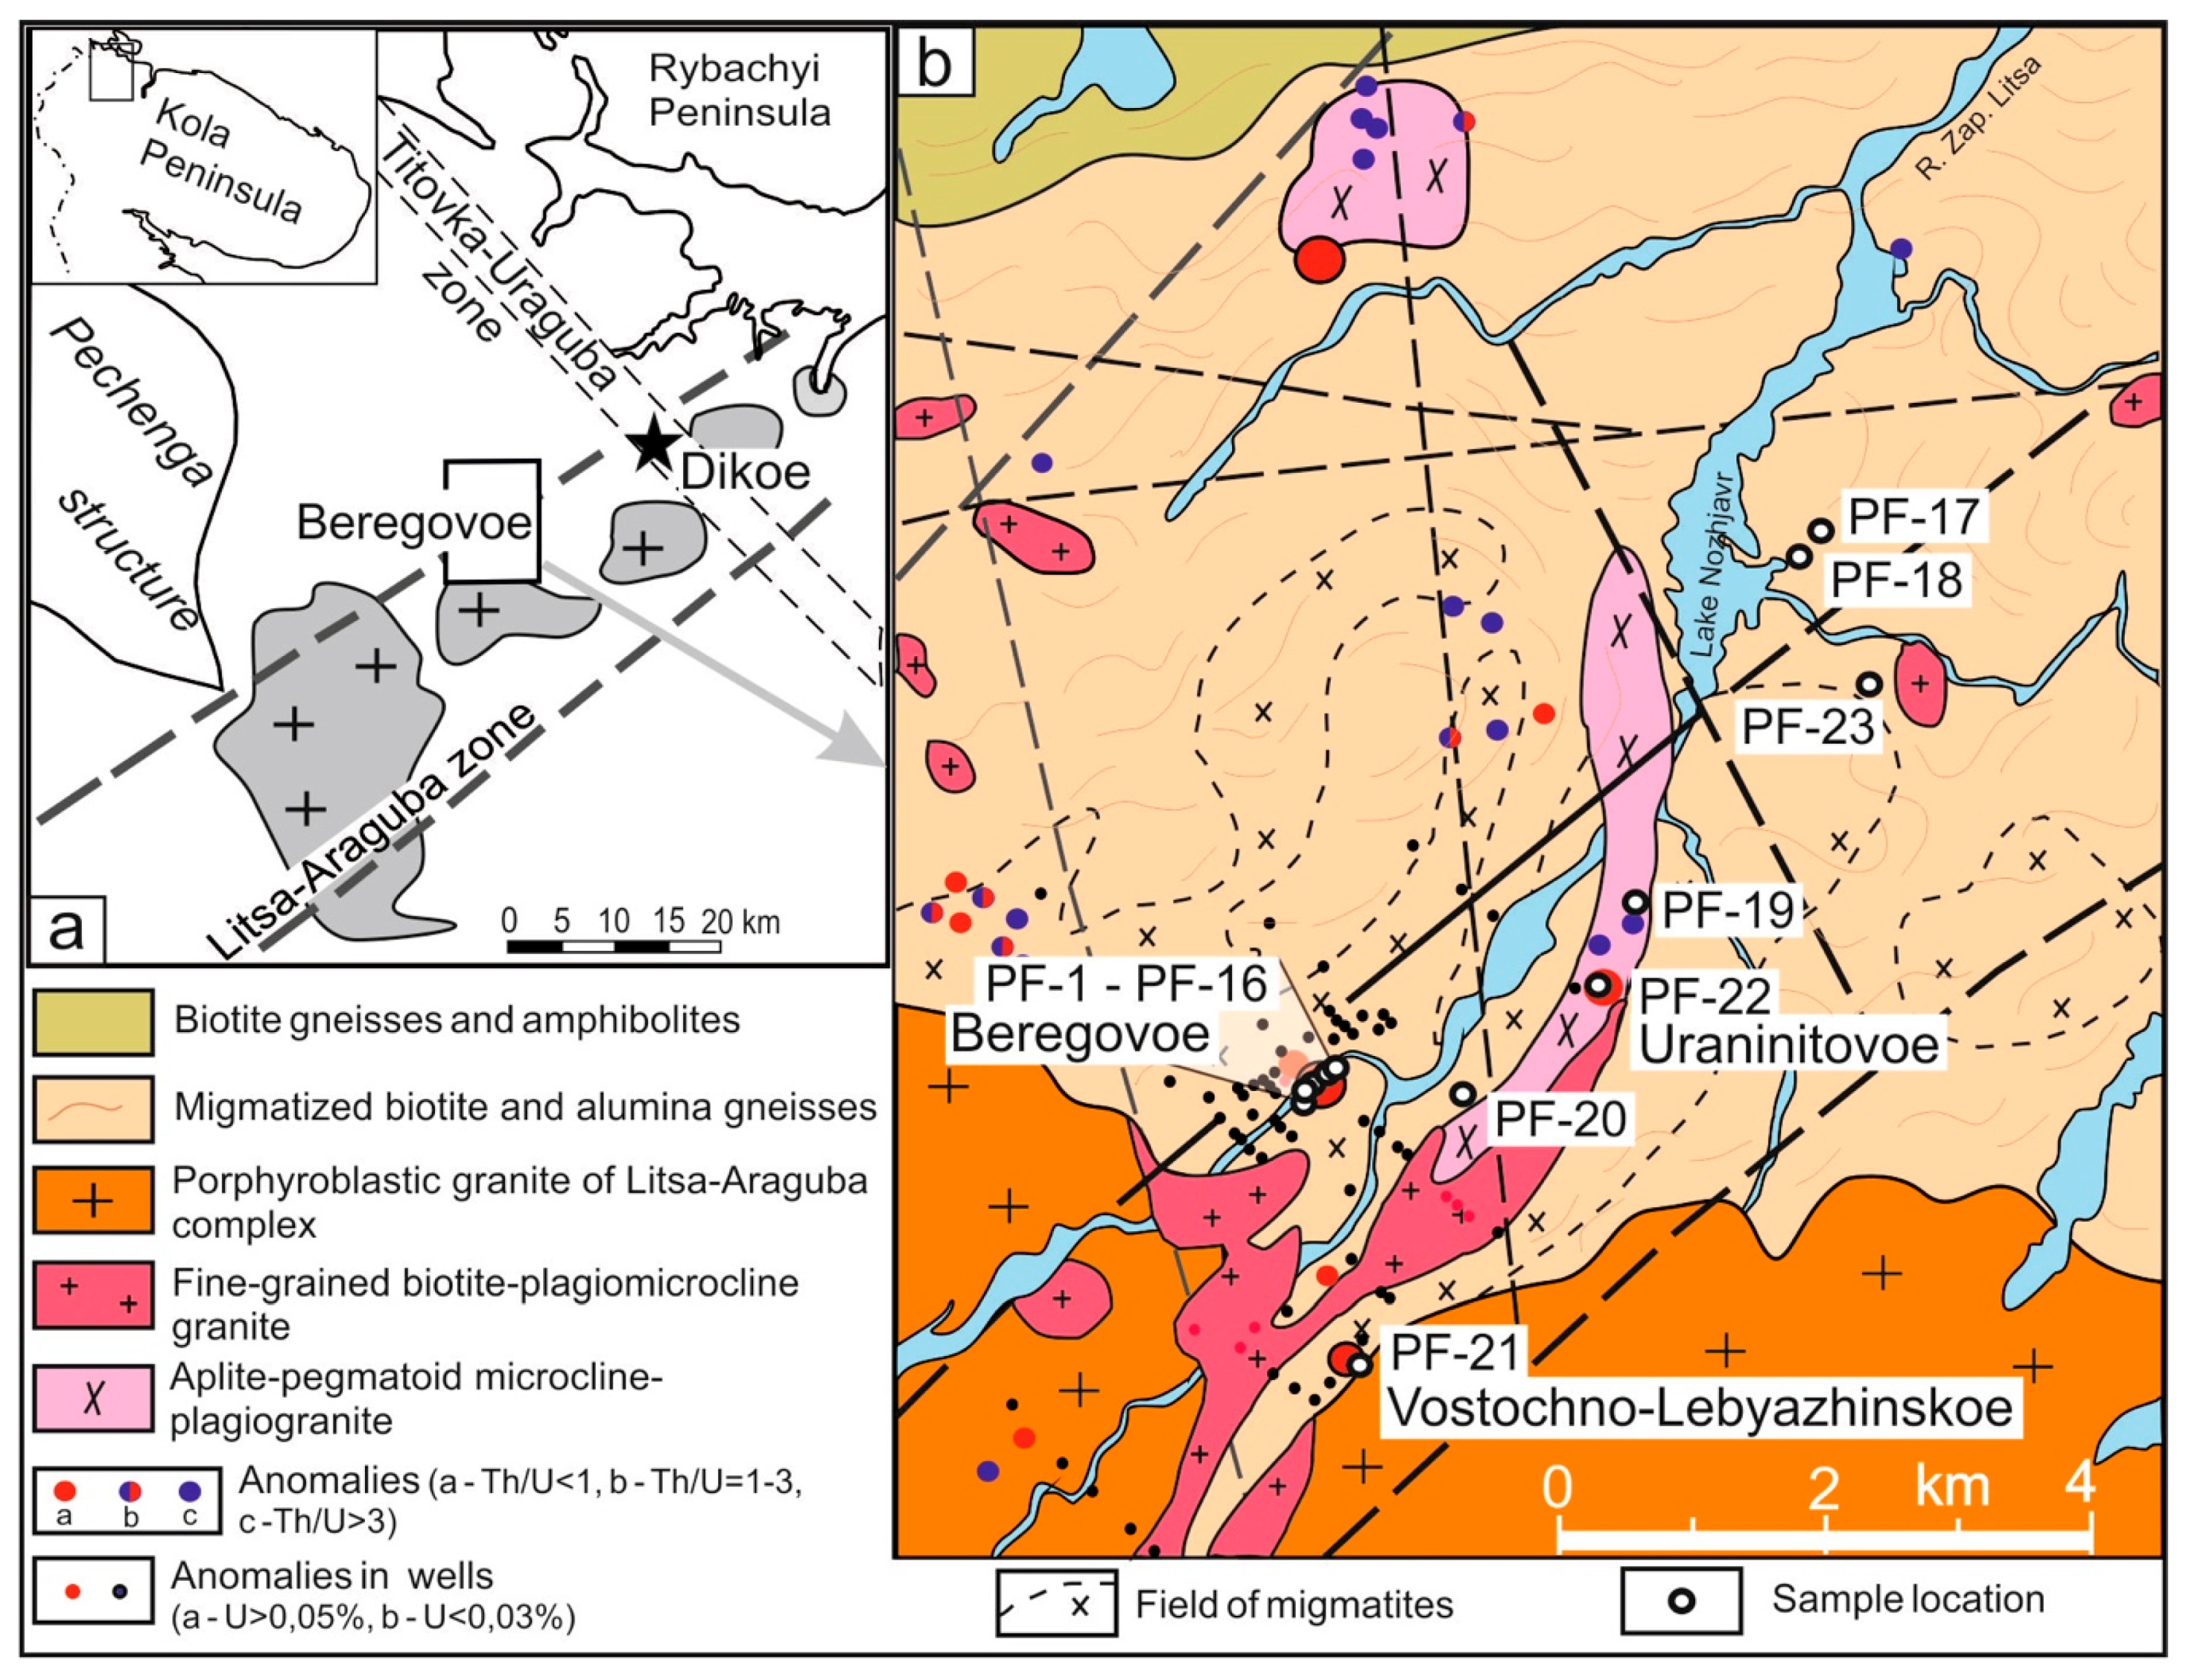
This article was aimed at finding the correlation of uranium ore mineralization with textural and mechanical properties of rocks revealed by petrographic, petrophysical and X-ray CT methods. Rocks and ores from the Beregovoe and Dikoe areas (
Figure 1) of the Litsa uranium ore zone were chosen to be an object of this study. Within the Litsa area, there were more than 30 uranium hydrothermal ore occurrences found, whose localization is controlled by fault and shear zones [
18,
19], which makes it a perfect test ground for the study.
3. Materials and Methods
3.1. Rock Samples
All samples were studied in thin sections (2.5 × 2.5 cm, 0.03 mm thick) under optical polarization microscope LOMO POLAM RP-1 (St-Petersburg, Russia); small inclusions were studied under an electron microscope LEO-1450 (Carl Zeiss AG, Oberkochen, Germany). The rock samples are represented by gneisses and leucogranites with varying degree of foliation, different composition and content of secondary minerals, and different content of uranium and thorium. A petrographic description of those samples, for which X-ray CT studies were subsequently carried out, is presented below.
Sample PF-2—fine-grained biotite gneiss with lepidogranoblastic texture; the main minerals are plagioclase (45%), quartz (30%), microcline (15%) and biotite (10%). Plagioclase, quartz and microcline are represented by small xenomorphic grains and form the matrix of the rock. The schistousity of rock is distinguished by biotite, which forms large, elongated flakes. In biotite, there are small inclusions, surrounded by pleochroic halos, indicating the presence of minerals with radioactive elements (monazite, zircon). Rare grains of sulfides (mainly pyrite) and Fe oxides are observed.
Sample PF-3—coarse-grained plagiogranite-pegmatite with allotriomorphic texture; the main minerals are quartz (60%), plagioclase (34%), epidote-clinozoisite (5%). The bulk of the rock is represented by quartz with inclusions of smaller grains of plagioclase. Plagioclase contains round and prismatic inclusions of minerals of the epidote-clinozoisite group. The processes of secondary alteration are also manifested in plagioclase, forming minerals such as muscovite-sericite, scapolite, carbonate and minerals of the epidote group. Uraninite, titanite, apatite, Fe oxides and sulfides were observed in the zones of alteration and at the boundary of the plagioclase grains.
Sample PF-4—coarse-grained granite with granite and, partly, micropegmatite texture; the main minerals are microcline (32%), quartz (30%), plagioclase (30%) and biotite (8%). The rock matrix is composed of large prismatic and xenomorphic grains of microcline, quartz and plagioclase. Biotite flakes tend to be oriented. Many small inclusions were observed in the biotite grains (monazite, zircon, allanite). Biotite flakes in the cleavage zones are replaced by chlorite, plagioclase is replaced by fine-grained muscovite. Inside the grains of plagioclase, many small inclusions of iron hydroxide (limonite) were also observed.
Sample PF-7—biotite gneiss, fine-grained with lepidogranoblastic texture; main minerals are quartz (~50%), plagioclase (~40%), biotite (up to 10%); accessories are zircon, monazite and sulfides (pyrite, galena). Secondary processes are marked by the uneven development of sericite and sassyurite aggregates after plagioclase. Biotite has the shape of flakes and elongated plates about 0.2–0.5 mm in size, enclosing small grains of zircon and monazite. Ore minerals are associated with biotite. Quartz, sillimanite and muscovite form layers ≤5 mm in thickness. Finely fibrous hair-like crystals of sillimanite (fibrolite) form bent-like curved fibroblasts within muscovite.
Sample PF-10—inequigranular alkaline feldspar granite of hypidiomorphic texture and massive stucture; main minerals are microcline (40%), quartz (25%), plagioclase (35%). Secondary and accessory minerals are biotite (1–2%), muscovite, monazite, zircon, ore minerals. Biotite forms flakes and plates of 0.2–0.7 mm in size in the interstices between the grains of feldspar and quartz. Granulation of major minerals is manifested. Secondary minerals (pelite, sericite + fine-flaked muscovite) replace plagioclase, chlorite is developed after biotite. Biotite contains many inclusions of metamict minerals (zircon, monazite), with the pleochroic halos around them.
Sample TK 19-1B—biotite gneiss of cataclastic, granoblastic and porphyroclastic texture. The main minerals are plagioclase (77%), quartz (15%), biotite (6%), muscovite (2%), accessory minerals are zircon, monazite, rutile, apatite, uraninite, and sulfides (chalcopyrite, sphalerite). Large porphyroclasts of plagioclase are elongated along schistousity. The boundaries of the porphyroclasts are indistinct, their edges are partly turned into aggregates of small polygonal grains and recrystallized. Between the porphyroclasts there are fine grains of quartz, occurring as clusters, and larger rare grains with deformation bands. Small biotite flakes are located in the fine-grained mass between recrystallized grains of quartz and plagioclase. Larger biotite mass encapsulates plagioclase porphyroclasts. Muscovite forms thin, long, colorless leists, which develop after biotite and after the recrystallized mass of quartz and plagioclase. Zircon grains occur in the interstices or inside the biotite grains along with titanite, apatite, and large grains of monazite.
3.2. Petrophysical Methods
For petrophysical measurements, samples of cubic shape (2.5 × 2.5 × 2.5 cm) were cut from spatially oriented samples (with preservation of spatial orientation); then the faces of the cubes along with the directions, normal to the respective faces were numbered: N and E points of compass as 1 and 2, respectively, and vertical as 3. The velocity of propagation of longitudinal waves Vp was measured in three directions of the cube (1, 2, 3) using an ultrasonic device GSP UK-10PMS (Russia) for non-destructive testing of the mechanical properties of building materials and rocks. The instrumental error of the time interval was ±0.5%, the duration of one measurement was 0.5 min, the operating frequency was 45–60 kHz. A concentrated solution of polysaccharides was used to ensure wave transference from the sensor to the sample surface. The number of measurements in each of the 3 directions of the cubic sample was between 5 and 10. The results were then averaged and summarized (
Table 1).
The anisotropy coefficient
Ap (elastic deviator) of the samples was calculated from the propagation speeds of ultrasonic longitudinal waves, measured in three orthogonal directions, using the formula:
where
is the average speed of propagation of longitudinal waves in the sample;
V1,
V2,
V3—are the velocities of propagation of longitudinal waves in the corresponding directions of the cube [
20].
Sample density (ρ) was measured by the Archimedes method, using a special device which was in fact customarily re-built laboratory electronic scales VLKT-500, its accuracy being ±0.005 g. The sample was weighed both in the air-dry state (
PAIR) and immersed in the water (
PWATER.) Density was calculated via the following equation:
To control the weighing accuracy, a metal (Al) standard of known weight and density was used. The standard was subjected to the above procedure of density determination before each weighing of a rock sample. Deviations in the weight of the standard (during the weighing of all samples of the presented collection) were within 0.01–0.02 g.
3.3. X-ray Tomography (CT)
CT is a non-destructive technique of visualizing internal structure of solid media by means of computing X-ray attenuation values. X-ray CT measurements were carried out for the samples of cubic shape with a size of 10 × 10 × 10 mm, cut from the larger samples, whose elastic properties and density which were measured earlier. The spatial orientation of the faces was preserved. The analysis was carried out on a Skyscan 1172 microtomograph (Bruker-microCT, Belgium) in the Resource Center “X-ray diffraction methods of research” of St. Petersburg State University. Resolving power was 4.4–4.9 µm, rotation angle 0.3 degrees with averaging of 4 shots. The voltage on the tube is 100 kV at a current of 100 µA. The reconstruction was carried out using the software “NRecon”, further processing and visualization of the data was carried out using the applications (micro-CT Bruker) “CTAn” (separation by density), “CTVox” (3D visualization) and “DataViewer” (slices along three projections).
Computer processing of CT results allows actual heterogeneity and density of the rocks studied (both in the whole volume and in individual sections) to be considered. Heterogeneity and density variations are dependent on the structure of the pore space and a system of cracks (or microcracks), which determine the spatial position of the elements (axis, plane) of elastic symmetry ([
20] and references there]) in rock samples.
3.4. ICP-MS Analysis of U Content
Aliquots of the substance for chemical analysis (including the determination of the uranium content), were taken from the large samples (1.0–1.5 kg), which were preliminary finely crushed and homogenized. The analysis of U content in rocks was performed on an ELAN 9000 DRC—e mass spectrometer (Perkin Elmer, Waltham, MA, USA) with inductively coupled plasma (ICP–MS) at Institute of Chemistry and Technology of Rare Elements and Mineral Raw Materials, Kola Science Center, Russian Academy of Sciences (Apatity). For MS analysis, 50 mg aliquot of the sample was dissolved via sequential addition of distilled HF and HNO3 in glassy carbon crucibles. The resulting sample solutions were diluted so that the intensities of the signals should fall within the selected calibration range. The maximum error of determination of 1 ppm element concentration was 8%.
4. Results and Discussion
Physical properties obtained for the rock samples are presented in the
Table 1. All samples studied were collected from felsic rocks (biotite gneisses, leucocratic granite gneisses, gneiss granites); their average density (2.6–2.7 g/cm
3) corresponds to the reference data [
21]. The density of the rock is a very conservative parameter, little affected by any changes over time, in contrast to the index of elastic anisotropy (A
p).
The index A
p varies within the range from 0.8–11.2% in most samples from the Beregovoe ore occurrence reaching significantly higher values of 55.1% and 98.2% in the samples PF-7 and PF-10, respectively (
Table 1). High values of the index A
p were also detected in the samples from Vostochno-Lebyazhinskoe and Uraninitovoe ore occurrences (PF-19, PF-21 and PF-22). The data presented in
Table 1 indicate that the anisotropy index does not always depend on the rock texture (gneiss, granite or pegmatite), as gneisses and granites have both elevated and lower A
p values. At the same time, two maximum A
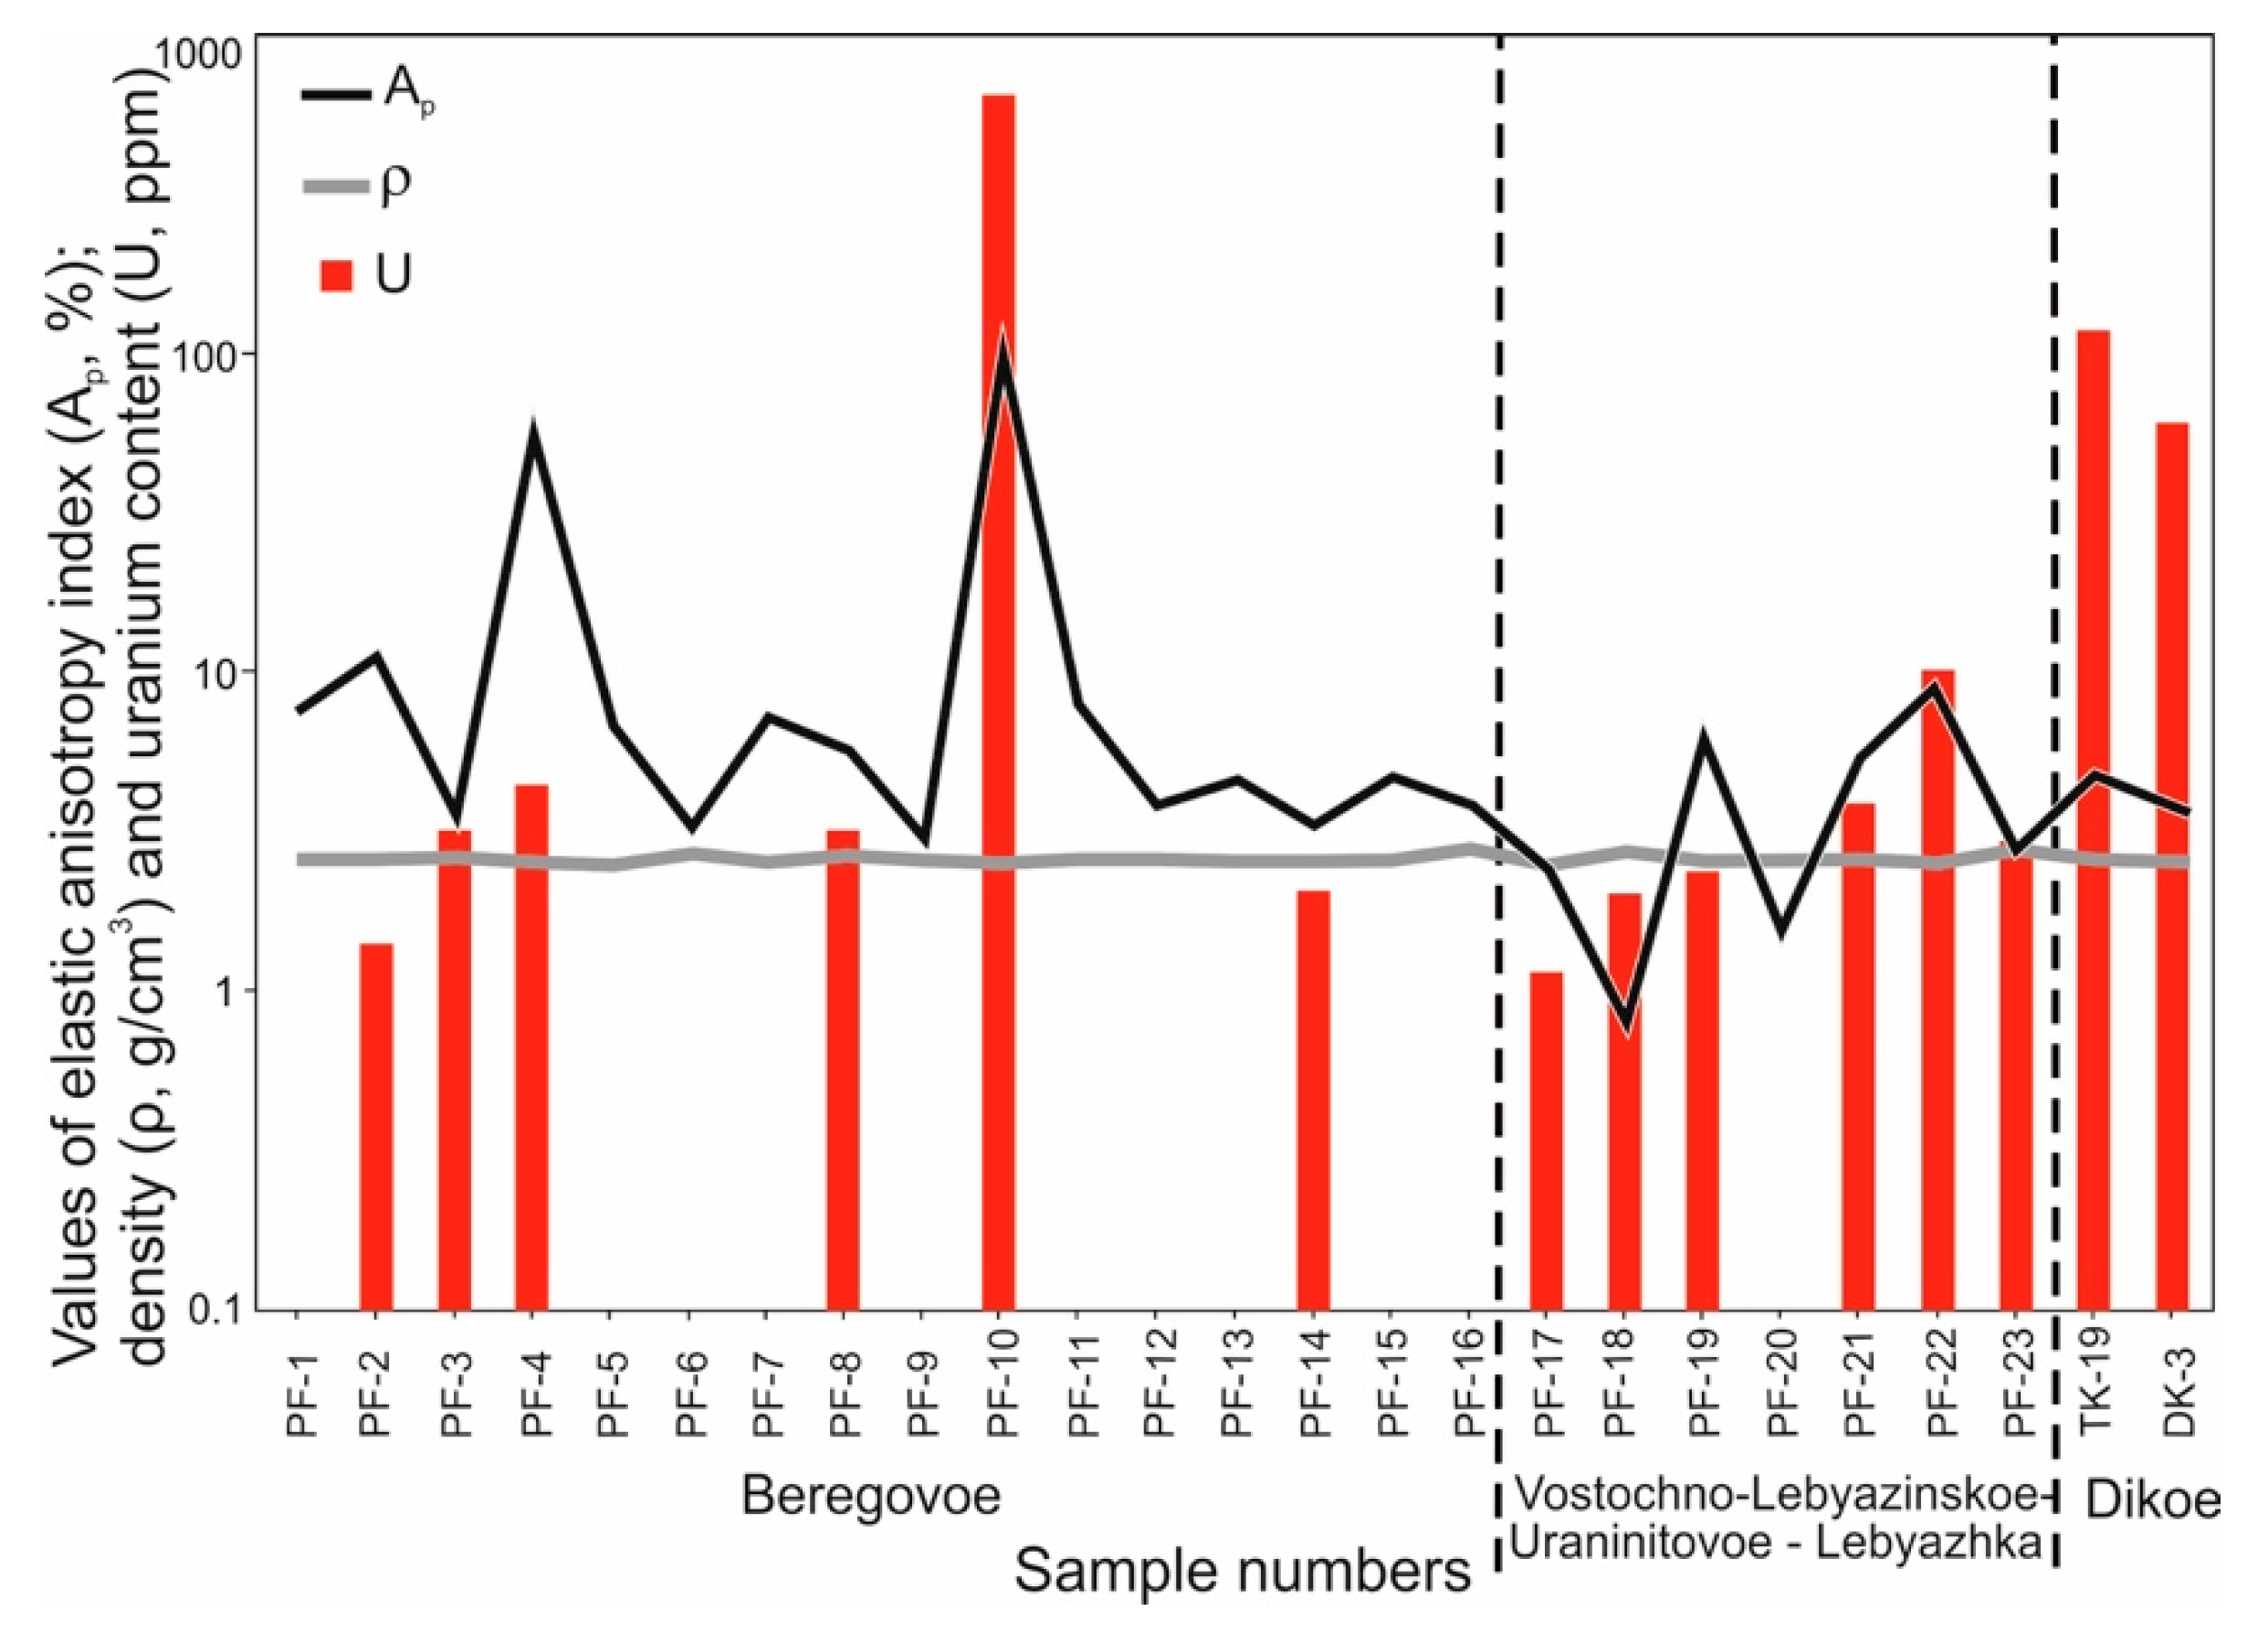
p values (
Figure 2) were obtained for gneissic granites (samples PF-4 and PF-10), which, according to thin sections, retain a more dense, magmatic or granite structure than samples of gneisses. In samples of granite pegmatites (PF-1, PF-3, PF-13, PF-15, PF-19), the index A
p values are rather similar and low (3.7–7.6%). Elastic anisotropy of the rock is determined by the anisotropic system of microcracks, which reflects the dynamic conditions during its formation. Therefore, an increase in the A
p index can be regarded as an indication on the tectonic processes, i.e., deformation state of a rock.
All kinds of effects on the rock are reflected in the degree of its metamorphic alteration; the physical properties, on the other hand, largely depend on the stress-strain state of a rock, which may be deduced from the anisotropy of elastic properties. Physical properties of rocks and ores reflect their formation conditions, type, and intensity of the imposed alterations ([
14] and references therein). Diversity of geological formations and the complex tectonic structure of the area under study suggest a long geological history characterized by repeated changes of the deformation pattern. This is largely due to the Archean and Early Proterozoic regional metamorphism and granitization, at the final stage of which the uranium-bearing metasomatites were formed [
18].
Since the uranium mineralization within the Litsa area is believed to be controlled by tectonic disturbances, to find out the relationship between uranium mineralization and the physical properties of rocks, the index A
p, density (ρ) and uranium content were plotted on the same diagram (
Figure 2). The uranium content in most samples was 1–9 ppm; in some samples, it rises sharply to 110 ppm and 593 ppm (
Figure 2). The maximum uranium concentration (593 ppm) was found in the sample PF-10 (leucocratic gneissic granite) from the Beregovoe site. The same sample has the maximum elastic anisotropy index (98.2%).
The samples from the Beregovoe, Vostochno-Lebyazhinskoe and Uraninitovoe ore occurrences generally (with few exceptions) display positive correlation between magnitude of A
p and uranium concentration (
Figure 2). The samples from the Dikoe ore occurrence, however, do not follow this trend: the low A
p values measured there (4.78 and 3.82%) are combined here with rather high uranium content (110 and 55 ppm), respectively.
Samples from the Dikoe ore occurrence (TK-19-1B and DK-3) were collected in the zone of cataclase and brecciated rocks at the contact with the uranium-bearing pegmatoid vein. Judging by the descriptions of thin sections (see above), although the rocks are blastocataclasites, in terms of the elastic anisotropy index, they are similar to the slightly deformed granite pegmatites (see
Table 1). Apparently, the decline in A
p in the samples TK-19-1B and DK-3 is due to the sealing of their cracks with the mineral substance that was deposited from the ore-bearing fluids.
The samples from the Beregovoe occurrence, on the other hand, have high radiometric background (increased content of radioactive elements) and high values of the anisotropy index A
p, although totally devoid of uranium mineralization, which, within the Beregovoe ore occurrence was only discovered in wells [
18]. Thus, free circulation of ore-bearing fluid in highly permeable rocks does not appear to trigger the deposition of ore minerals in the pores and cracks (which, therefore are not sealed), and uranium is absorbed, e.g., with biotite plates (which leads to an increase in the radioactive background), preserving fracturing that causes high anisotropy of the rocks.
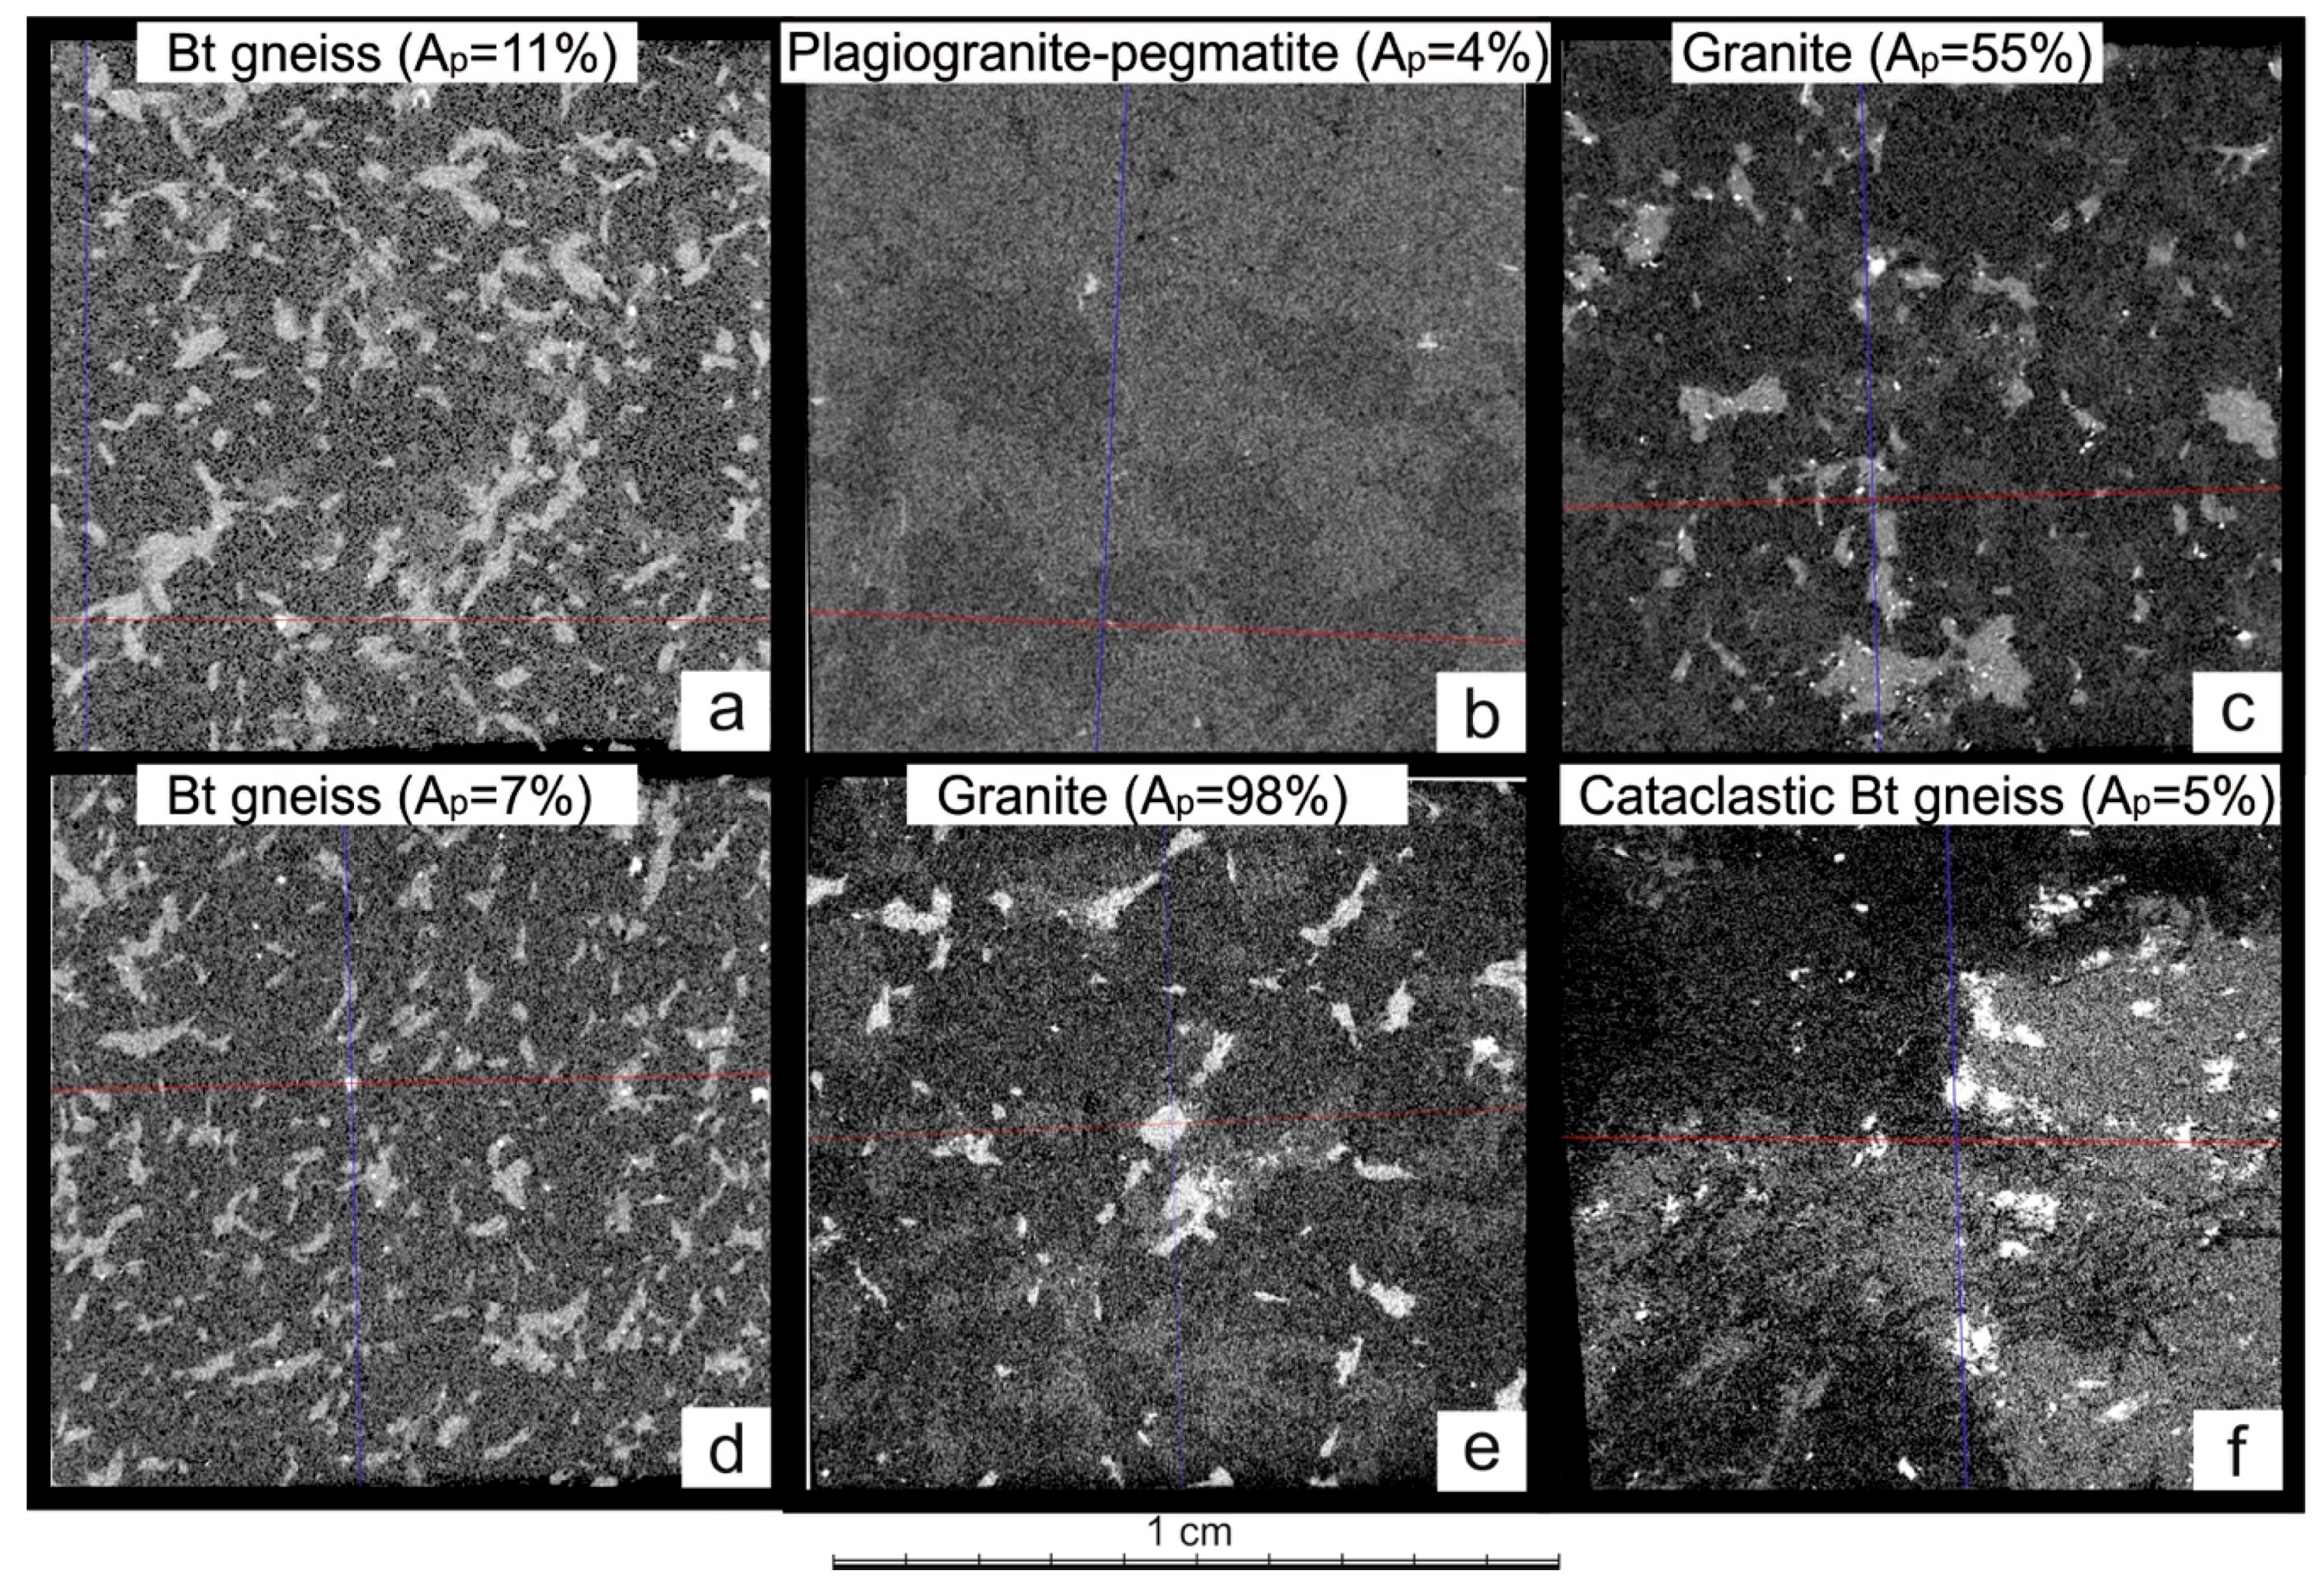
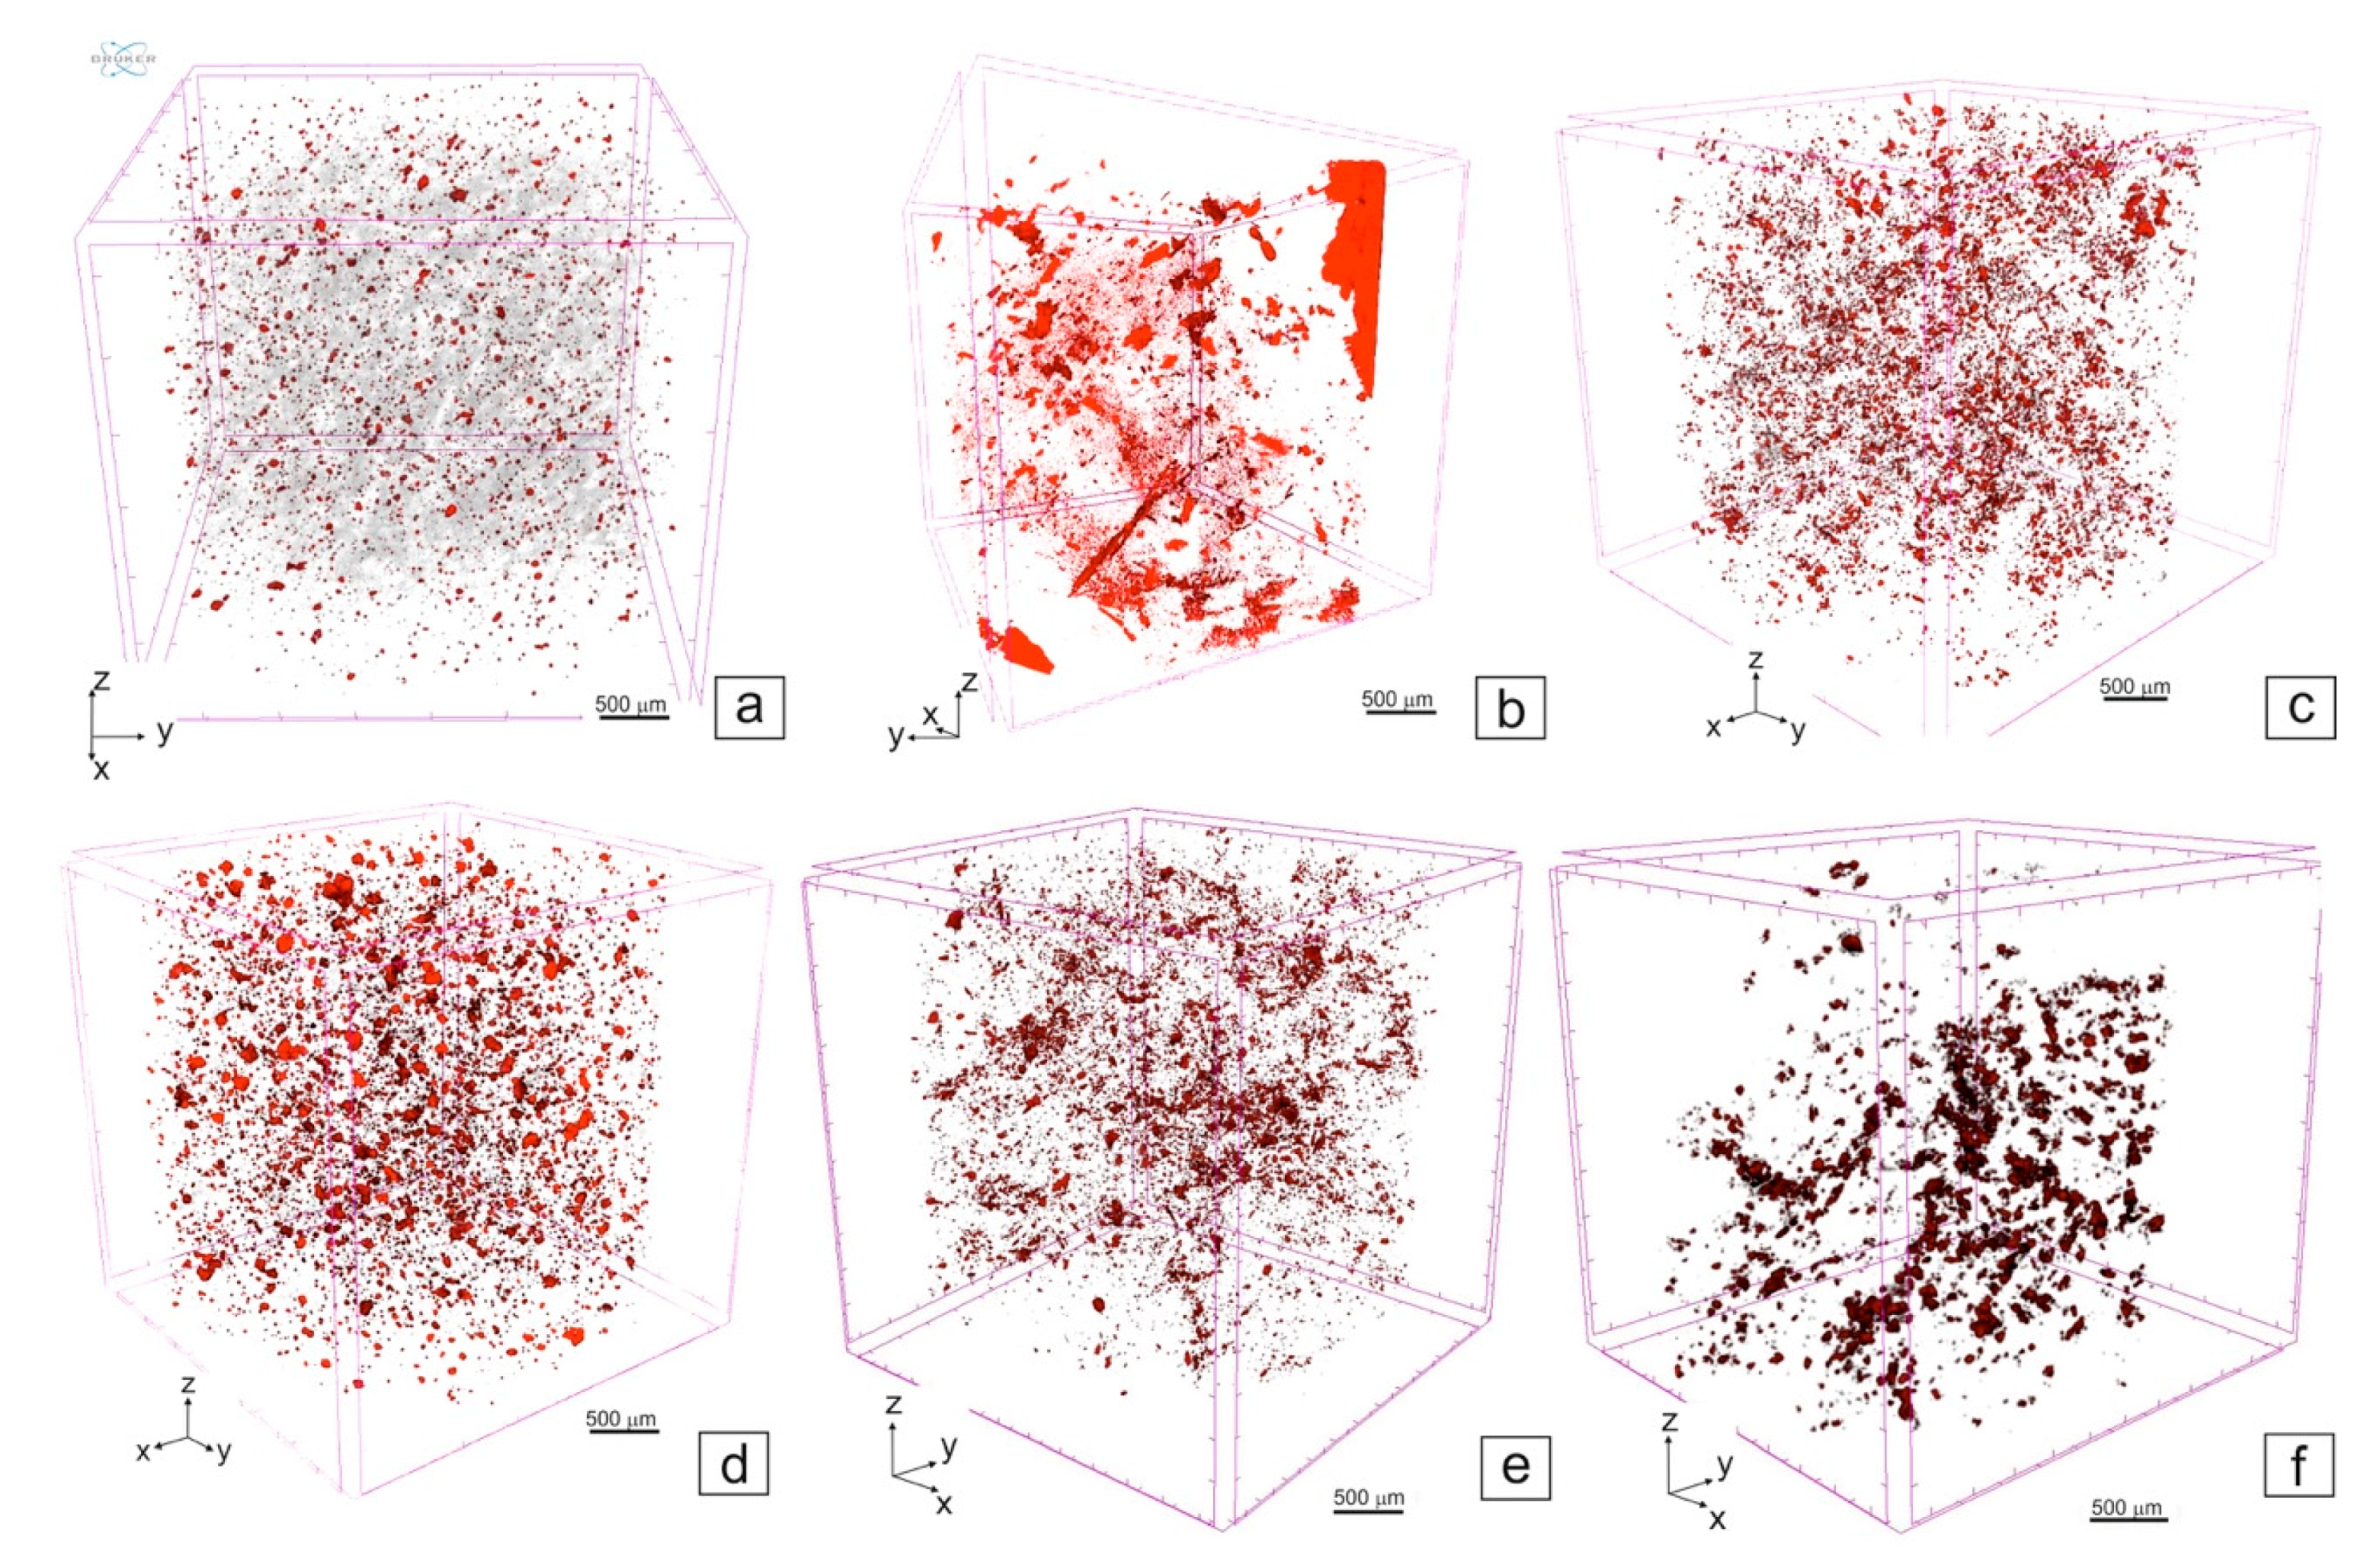
To assess the usefulness of the CT method, six samples with different values of both A
p and uranium content (PF-2, PF-3, PF-4, PF-7, PF-10, TK-19-1B) were studied by this method. Some results of CT studies are presented in
Figure 3.
Separate tomographic sections of the rocks carry similar or even less information on rock texture and mineral distribution as the petrographic thin sections, although their number allows for a much more detailed and comprehensive coverage of the bulk structure of the rocks.
In the samples PF-2 and PF-7 (
Figure 3a,d), schistosity was spotted, pointed up by curved biotite flakes, which are denser (lighter on the tomogram) than plagioclase and quartz grains. The elastic anisotropy indexes of these samples were 11.2% and 7.22%, respectively (
Table 1). Sample PF-3 is the most homogeneous, represented by large grains of minerals of similar density: quartz and plagioclase with rare grains of a more dense (white on the tomogram) ore minerals (
Figure 3b). All these features make this sample more isotropic, its anisotropy index being rather low (3.68%). In samples PF-4 and PF-10 (
Figure 3c,e), mica flakes are not bent, the texture of rocks is hypidiomorphic, schistosity is not observed and, nevertheless, in these two samples, the maximum values of the elastic anisotropy index 55.1% and 98.2%, respectively, were found (
Table 1). Although sample PF-10 was taken from a highly fractured zone, it has a massive texture. It is possible that strong anisotropy here is associated with an uneven distribution of ore minerals (white dots,
Figure 3e).
The structure of the sample TK-19-1B is the most deformed, cataclastic with curved schistosity, large grains of ore minerals (white spots—
Figure 3f) are unevenly distributed. In spite of all this, the indicator A
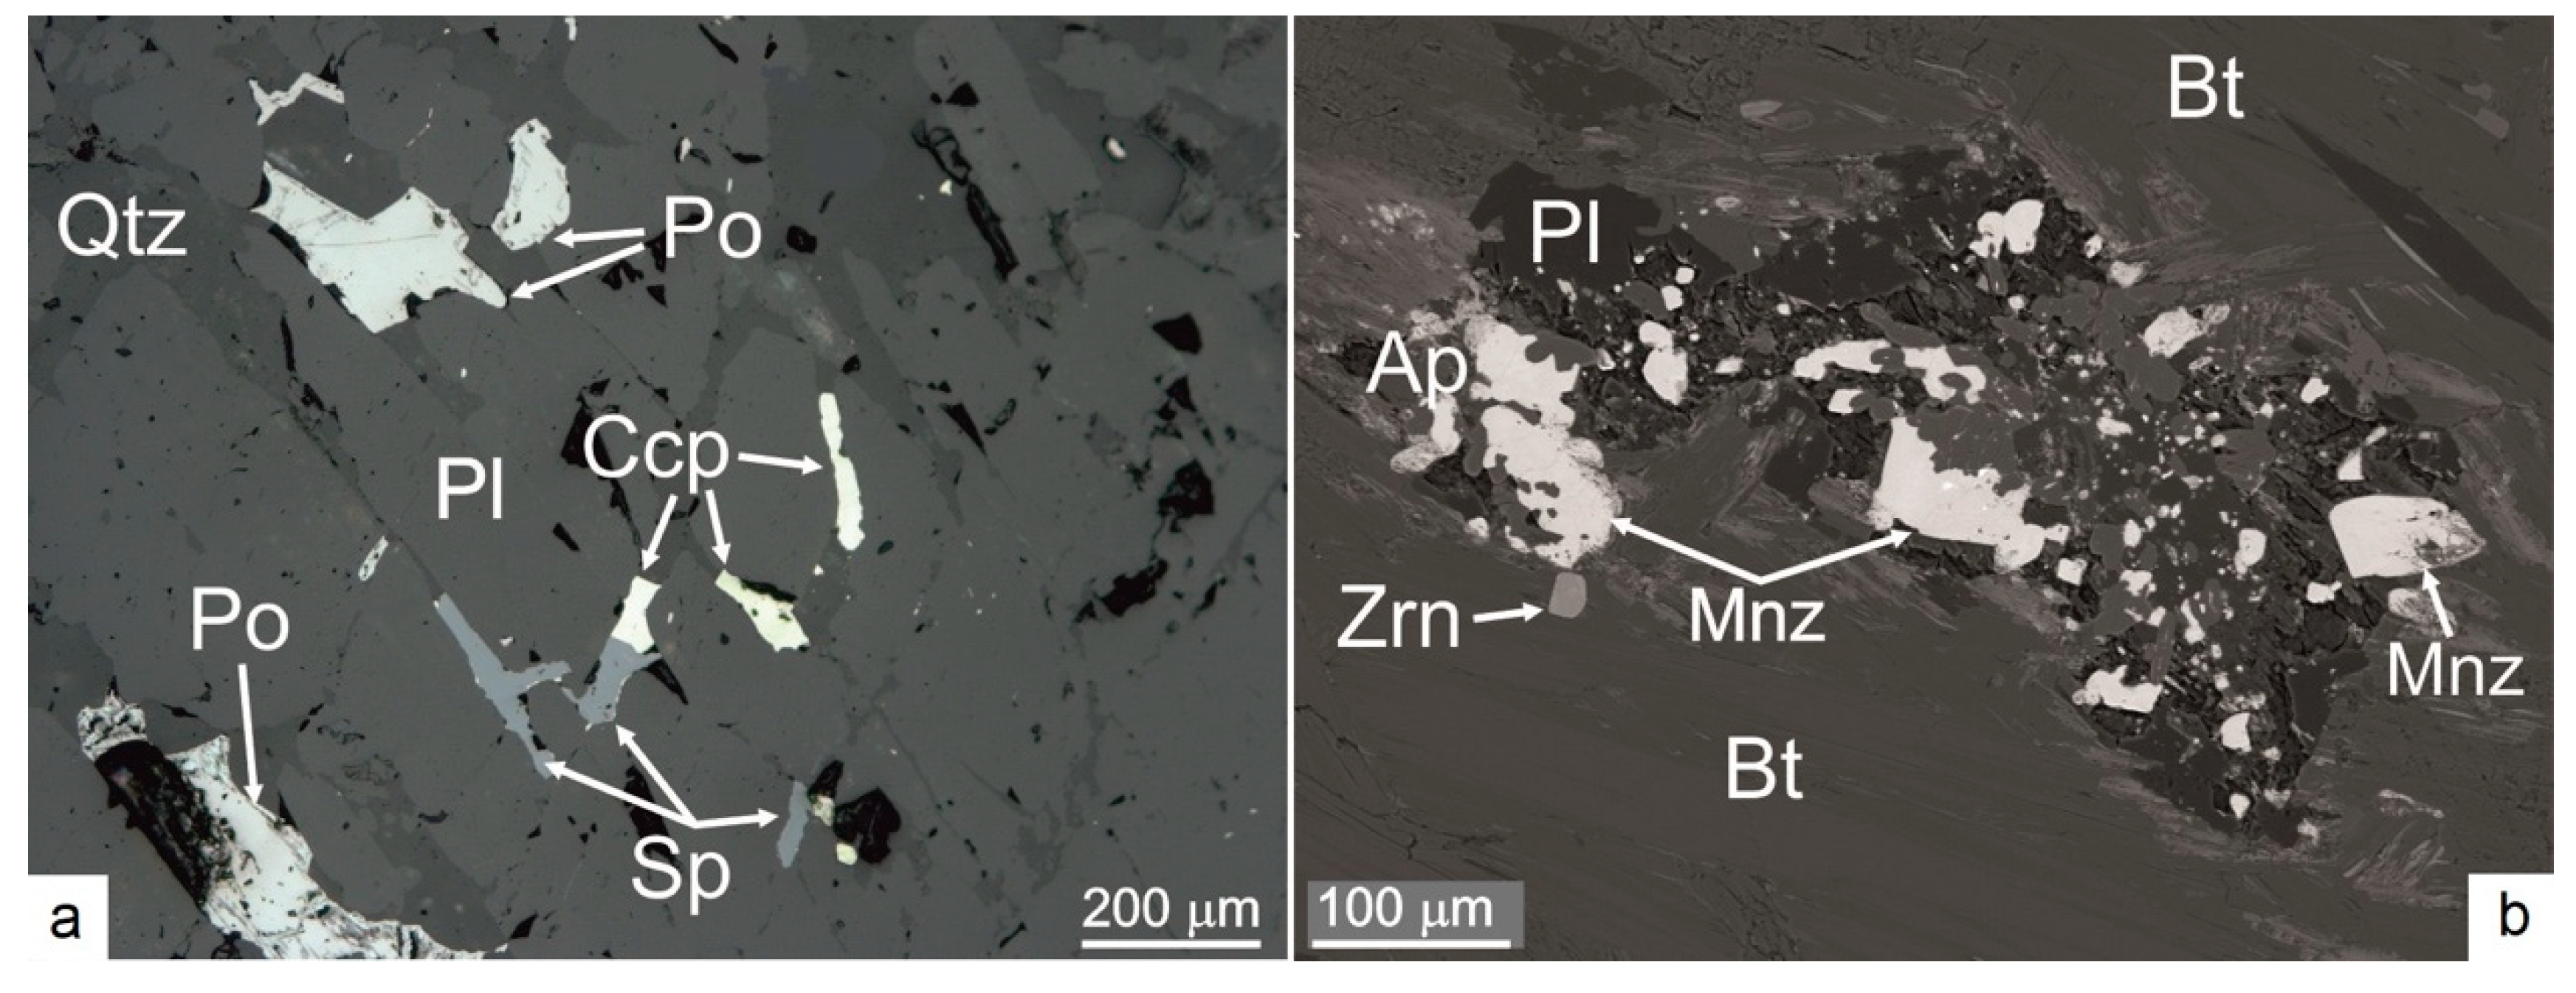
p (4.78%) is not much higher here than in the uniform and massive granite pegmatite PF-3, which confirms the assumption of a decrease in the anisotropy of the rock through healing of cracks. On the tomogram, it is clearly seen that small cracks in the plagioclase are filled with newly formed quartz (black web-like structure—
Figure 3f). This process is well illustrated by the plain section: rock microcracks are filled with chalcopyrite and sphalerite (
Figure 4a), while radioactive minerals grow along microvoids in biotite (
Figure 4b).
However, the consideration of individual CT sections does not explain the high anisotropy index in even-grained massive rocks PF-4 and PF-10. To approach this issue we used a three-dimensional image of the distribution of the most dense (ore) mineral phases, obtained via CT method (
Figure 5). On the tomogram of the PF-2 sample, the most dense phase is evenly distributed, in accordance with the gneissoid rock structure emphasized by biotite flakes, which was established by studying the thin sections. The spatial ordering of the grains of ore minerals, apparently, resulted from their genetic attachment to the biotite flakes (
Figure 5a). A similar picture is observed in the PF-7 sample (
Figure 5d): here, the dense phase is distributed very evenly and even gneisoid structure is not evident. This is consistent with the data on the A
p index, which is lower than in sample PF-2 (
Table 1).
In the PF-3 sample, the minerals of the epidote-clinozoisite group are the most dense phase, which are clearly visible in
Figure 5b. The distribution of these minerals is extremely uneven, apparently, their development led to the sealing of voids and cracks, which increased the homogeneity of the sample and lowered its anisotropy index. Samples PF-4 and PF-10 show clusters of high-density minerals unevenly distributed in the structure of the samples (
Figure 5c,e), which characterizes their loose, partially disturbed structure and, accordingly, high inhomogeneity and anisotropy (
Table 1). This is especially clearly manifested in the PF-10 sample, which has extremely uneven distribution of density.
Although the CT samples are smaller than petrophysical and petrographic samples, even with this size, we can see a correlation between the elastic anisotropy and the rock structure. The rocks studied are mostly fine-to medium-grained, so that sample contains a large number of mineral grains. The texture of rocks on the CT slices is consistent with their texture observed in the thin sections. Besides, as mentioned above, elastic anisotropy is mainly due to the fractures and pores, and spatial variations of fracture have a hierarchy of scale from “point” objects to planetary level faults [
22]. At all levels of this hierarchy, the fracture systems of the Earth’s crust exhibit fractal properties; therefore, the fracture in small fragments of the object under study can be extrapolated (with appropriate corrections) to the entire object of regional size [
23]. Both the correlation between uranium content and elastic anisotropy of rocks and the decrease of elastic anisotropy index occurred due to the crack healing are consistent with previously assumed tectonic and structural preconditions for uranium hydrothermal mineralization in the area. The data obtained suggest the course of further research involving the construction of geological structural models of the crust with subsequent selection of areas with the most favorable conditions for the formation of uranium ore objects.
