Concept Paper

Risk-Based Early Warning System for Pluvial Flash Floods: Approaches and Foundations

by
Julian Hofmann
* and
Holger Schüttrumpf
Institute for Hydraulic Engineering and Water Resources Management, RWTH Aachen University, 57074 Aachen, Germany
*
Author to whom correspondence should be addressed.
Geosciences 2019, 9(3), 127; https://doi.org/10.3390/geosciences9030127
Submission received: 11 February 2019 / Revised: 7 March 2019 / Accepted: 8 March 2019 / Published: 14 March 2019
(This article belongs to the Special Issue River, Urban, and Coastal Flood Risk)

Abstract

:
In times of increasing weather extremes and expanding vulnerable cities, a significant risk to civilian security is posed by heavy rainfall induced flash floods. In contrast to river floods, pluvial flash floods can occur anytime, anywhere and vary enormously due to both terrain and climate factors. Current early warning systems (EWS) are based largely on measuring rainfall intensity or monitoring water levels, whereby the real danger due to urban torrential floods is just as insufficiently considered as the vulnerability of the physical infrastructure. For this reason, this article presents a concept for a risk-based EWS as one integral component of a multi-functional pluvial flood information system (MPFIS). Taking both the pluvial flood hazard as well as the damage potential into account, the EWS identifies the urban areas particularly affected by a forecasted heavy rainfall event and issues object-precise warnings in real-time. Further, the MPFIS performs a georeferenced documentation of occurred events as well as a systematic risk analysis, which at the same time forms the foundation of the proposed EWS. Based on a case study in the German city of Aachen and the event of 29 May 2018, the operation principle of the integrated information system is illustrated.

1. Introduction

Flash floods are natural hazards that are defined as fast surface flows with high peak discharge values, often limited in their spatial extent [1]. The most frequent cause of this type of flood is heavy rainfall events [2], hence the expression pluvial flash flood is used [3,4]. Pluvial flooding occurs when rainfall with a high intensity (high amount of precipitation during a very short period) exceeds the infiltration capacity of soil, or the discharge capacity of sewage and drainage systems, and water flows uncontrolled through urban areas [5]. The rainfall-induced runoff and flow processes are highly complex and vary in space and time with respect to terrain and climate conditions [6]. According to the World Meteorological Organization (WMO), flash floods are among the natural hazards with the highest mortality rate (deaths/people affected) and cause devastating property damage every year [7]. Due to the physical characteristics of convective heavy rainfall cells, the forecasting time of pluvial flash floods is, unlike river (fluvial) floods, very short [8].
Urbanization, altering processes in the hydrological response, and continuously changing climatic conditions are the main factors for an increasing intensity of urban pluvial floods. Compared to other flood types, they show the highest occurrence since 2000 and are an increasing risk worldwide [9]. In 2018 alone, a series of pluvial flash floods caused globally significant property damage and high fatalities. From May 19 to May 22 2018, a tropical cyclone caused extreme rainfall in east African countries, triggered lethal flash floods, affected over 669,000 people and killed over 25 people [10]. In India and Bangladesh “flash floods triggered by heavy monsoon rains have killed dozens of people and displaced more than a million” in the middle of June 2018 [11]. Just within a couple of days in October, 31 people were killed in Europe; one person in Italy, three in UK, 12 people in Spain’s Mallorca and 15 in France [12]. In the Middle East, more than 50 people were killed by several convective rainfall-induced flash floods during the middle of October and November 2018 [13]. According to the Humanitarian Aid Commission “over 200,000 people in Sudan have been affected by heavy rains and flash floods between June and early November 2018” [14]. From September 7 to September 9, tropical storm Gordon caused severe flash floods in Kentucky and Missouri and killed at least 2 people [15]. These events repeatedly bring to mind the fact that pluvial flash flood events can occur anytime, anywhere, on a very small scale, and can appear even away from rivers.
German insurance statistics show that urban pluvial floods are already causing 50% of the total flood damage in Germany [16]. According to the Intergovernmental Panel on Climate Change (IPCC), both the frequency and intensity of extreme rainfall events are expected to increase worldwide [17]. However, the precise relationship between climate change and hydrological extreme events remain insufficiently researched [18]. Simultaneously, urban populations are increasing at an unprecedented rate, generating higher risks due to flood hazards [19]. According to The World Bank, it is expected that by 2050 more than 70% of the world’s population will live in urban areas [20].
Although there is a huge demand for understanding flash floods, and there are upcoming discussions about strategies to adapt to climate change and new concepts for water sensitive cities [21], there is a lack of effective information systems for risk assessment [3]. Even though there are already established methods for analyzing the hazards and conceptual approaches to determine the risks of pluvial events, there are no standards, neither in connection to systematic procedures nor to a uniform database. To contain the damage caused by flash floods, it is of fundamental importance to first analyze the main causative factors and then to develop risk mitigation measures [22].
Early warning systems (EWS) are fundamental tools for urban flood management, the preparation of disaster response strategies, and therefore, to the protection of human lives and the minimization of flood damage [2]. The most implemented EWS worldwide for pluvial flash floods can essentially be divided into four basic procedures [4]:
  • Precipitation-based warnings by using measurement tools (rain gauge and/or weather radar) and short-time forecasting methods (nowcasting).
  • Wireless sensor networks measuring atmospheric variables.
  • Water-level monitoring of small streams and drainage channels.
  • Conceptual hydrological models for estimating the current flood hazard.
The extreme rainfall warnings of the German national meteorological service, the Deutscher Wetterdienst (DWD), are based on three warning levels for defined intensity values [23]. A composite consisting of rain gauge systems and weather radars provides largely accurate hydro-meteorological information. This real-time data provides the basis for nowcasting procedures as well as “KONRAD”, a special system for tracking storm cells [24]. Based on those procedures, convective small-scale rainfall events can be predicted up to two hours ahead of time and an alarm message can be transmitted using the weather information system "FeWIS" [25]. However, EWS that are only based on the rainfall amount, or rather precipitation intensity, do not capture the actual hydrodynamic flow processes nor the consequences of heavy rainfall events. They are giving no information about possible surface flow processes and, therefore, no prediction of the flood hazard. Whether an extreme precipitation event leads to a flash flood depends, in addition to the rainfall intensity, mainly on the characteristics of the urban-area like topography, degree of urban constructions, land use etc. [26].
In Colombia, a wireless sensor network (WSN) was developed consisting of six nodes measuring temperature, humidity and atmospheric pressure [27]. By analyzing the variation of these atmospheric variables, a computer system determines the potential formation of heavy rainfall cells. This computer is coupled to a web and mobile application, which provide the warning information to end-users [27]. By just calculating the potential of upcoming storms, this approach for an EWS is taking neither the exact location nor the flooding processes into account.
Another EWS, used in Florida (USA), is based on monitoring water levels with the help of ultrasonic sensors. In combination with cameras providing traffic monitoring information, the gathered information is sent to a data processing module which determines the warning [28]. Also, the city of Bonn (Germany) is using water level measurements for warning its inhabitants against flash floods. A measuring unit working with radar technology continuously monitors the water level of the stream and sends data in real time to the fire brigade, which issues a warning if specified threshold values are exceeded [29]. The great dangers of heavy rainfall-induced flash floods are their short prediction and resulting reaction times. Depending on the topography and size of the catchment area, the period between a precipitation event and flooding generally amounts to only a few hours, sometimes less than one hour [2]. The lead-time of a warning based on water level measurements of watercourses that suddenly develop into torrential flows during heavy rainfall events is, therefore, too short to guarantee an effective warning. In addition, this EWS requires the presence of watercourses and therefore cannot be used in urban areas without river systems.
The so-called VigieFlash system, which is based on a hydrological event-based model, has been operating in France since 2017. By using the AIGA method, introduced by Javelle et al. [30], the system provides, on the basis of radar rainfall data, simulations for river branches and, therefore, predictions of flash floods in watersheds of a few hundred km2. This EWS also focuses only on the flood hazard due to small rivers. As historical events demonstrate, pluvial flash flood events can occur anywhere by the sudden intense accumulation of rainwater. Therefore, river-based EWSs are not only limited in their effective region, but also become even dangerous, because warnings promise security in river-outlying areas.
In conclusion, the information methods presented do not fulfill the actual requirements of an effective EWS with regard to recording and assessing the pluvial flash flooding, providing a sufficient lead-time, as well as any assurance of a comprehensive area of application. In addition, none of the current EWSs are taking the vulnerability of critical infrastructure into account. Thus, there is a lack of an effective EWS that provides a forecast of the exact location, time and extent of the pluvial flash flood and its potential damage prior to a forecasted event. On the other hand, there is a great need for detailed spatial and temporal information before, during and after the flood event, for emergency response, risk management and damage assessment. Only through the analysis of all flood-relevant information can an operational pluvial flood management take effect [31].
In recent years, the principle of open data has become increasingly more important worldwide. The availability and quality of freely-usable data is rapidly increasing, and with it the computing capacities of computer systems, especially in relation to high performance and cloud computing [32,33]. This area-wide high-quality information provides an idea, if not the basis, on which to develop a regional or even nationwide information system for analyzing and warning communities against pluvial floods.
The objective of this study was to develop a concept for a risk-based EWS by linking rainfall-forecasting information together with a coupled model-system, consisting of a hydro-numeric model and a GIS-system to predict pluvial flooding processes and their actual impacts by using open German geodata. Risk is defined here as the product of hazard and vulnerability. Either by live simulation or by matching forecasted rainfall-patterns to pre-simulated heavy rainfall events, the system determines the extent of flooding with high spatio-temporal resolution, and subsequently superimposes the hazard with the vulnerability of objects in real-time. The EWS automatically issues a warning if the defined threshold values of hydraulic parameters or risk values are exceeded. Thus, it provides effective and object-precise warnings for particularly-affected urban areas in the case of forecasted heavy rainfall events.
The EWS is one integral component of a multi-functional pluvial flood information system (MPFIS), which performs in its entirety the holistic analysis of historic, potential and forecasted heavy rainfall events and resulting flash floods. Besides the EWS, it offers the systematic documentation of historic events and the generation of uniform, high spatial hazard and risk maps that, at the same time, form the fundamental basis of the risk-based EWS. By the use of official and freely-available geo-data and precipitation data, this EWS can be deployed area-wide in any radar-observed basin in Germany. Furthermore, the system operates using target-orientated metrics for processing regularly and area-wide available data.
First, this work presents the architecture and key elements of the EWS as well as the databases and structure of the MPFIS. Based on case study, the German city of Aachen, the use and the procedure of the MPFIS as wells as the foundation of the risk-based EWS are presented in connection with the heavy rainfall event of the 29 May 2018. By performing a comprehensive validation procedure with the help of georeferenced recordings, it could be shown that the developed information tool provides good results and applicability, and thus forms an auspicious basis for the proposed EWS. The innovative approach of merging historic, potential and forecasted flood-analysis in one integrated system allows the analysis of the complete pluvial flash flood event chain—rainfall pattern, run off and flooding process as well as damage development. Furthermore, it bundles all necessary information for the analysis of specific risk-mitigation measures. Therefore, it provides the end user communities with a unique instrument to understand the complex and under-researched phenomena of heavy rainfall-induced flash floods and their impact in the present and in the future.

2. Model Concept and Data Basis

2.1. Risk-Based Early Warning System

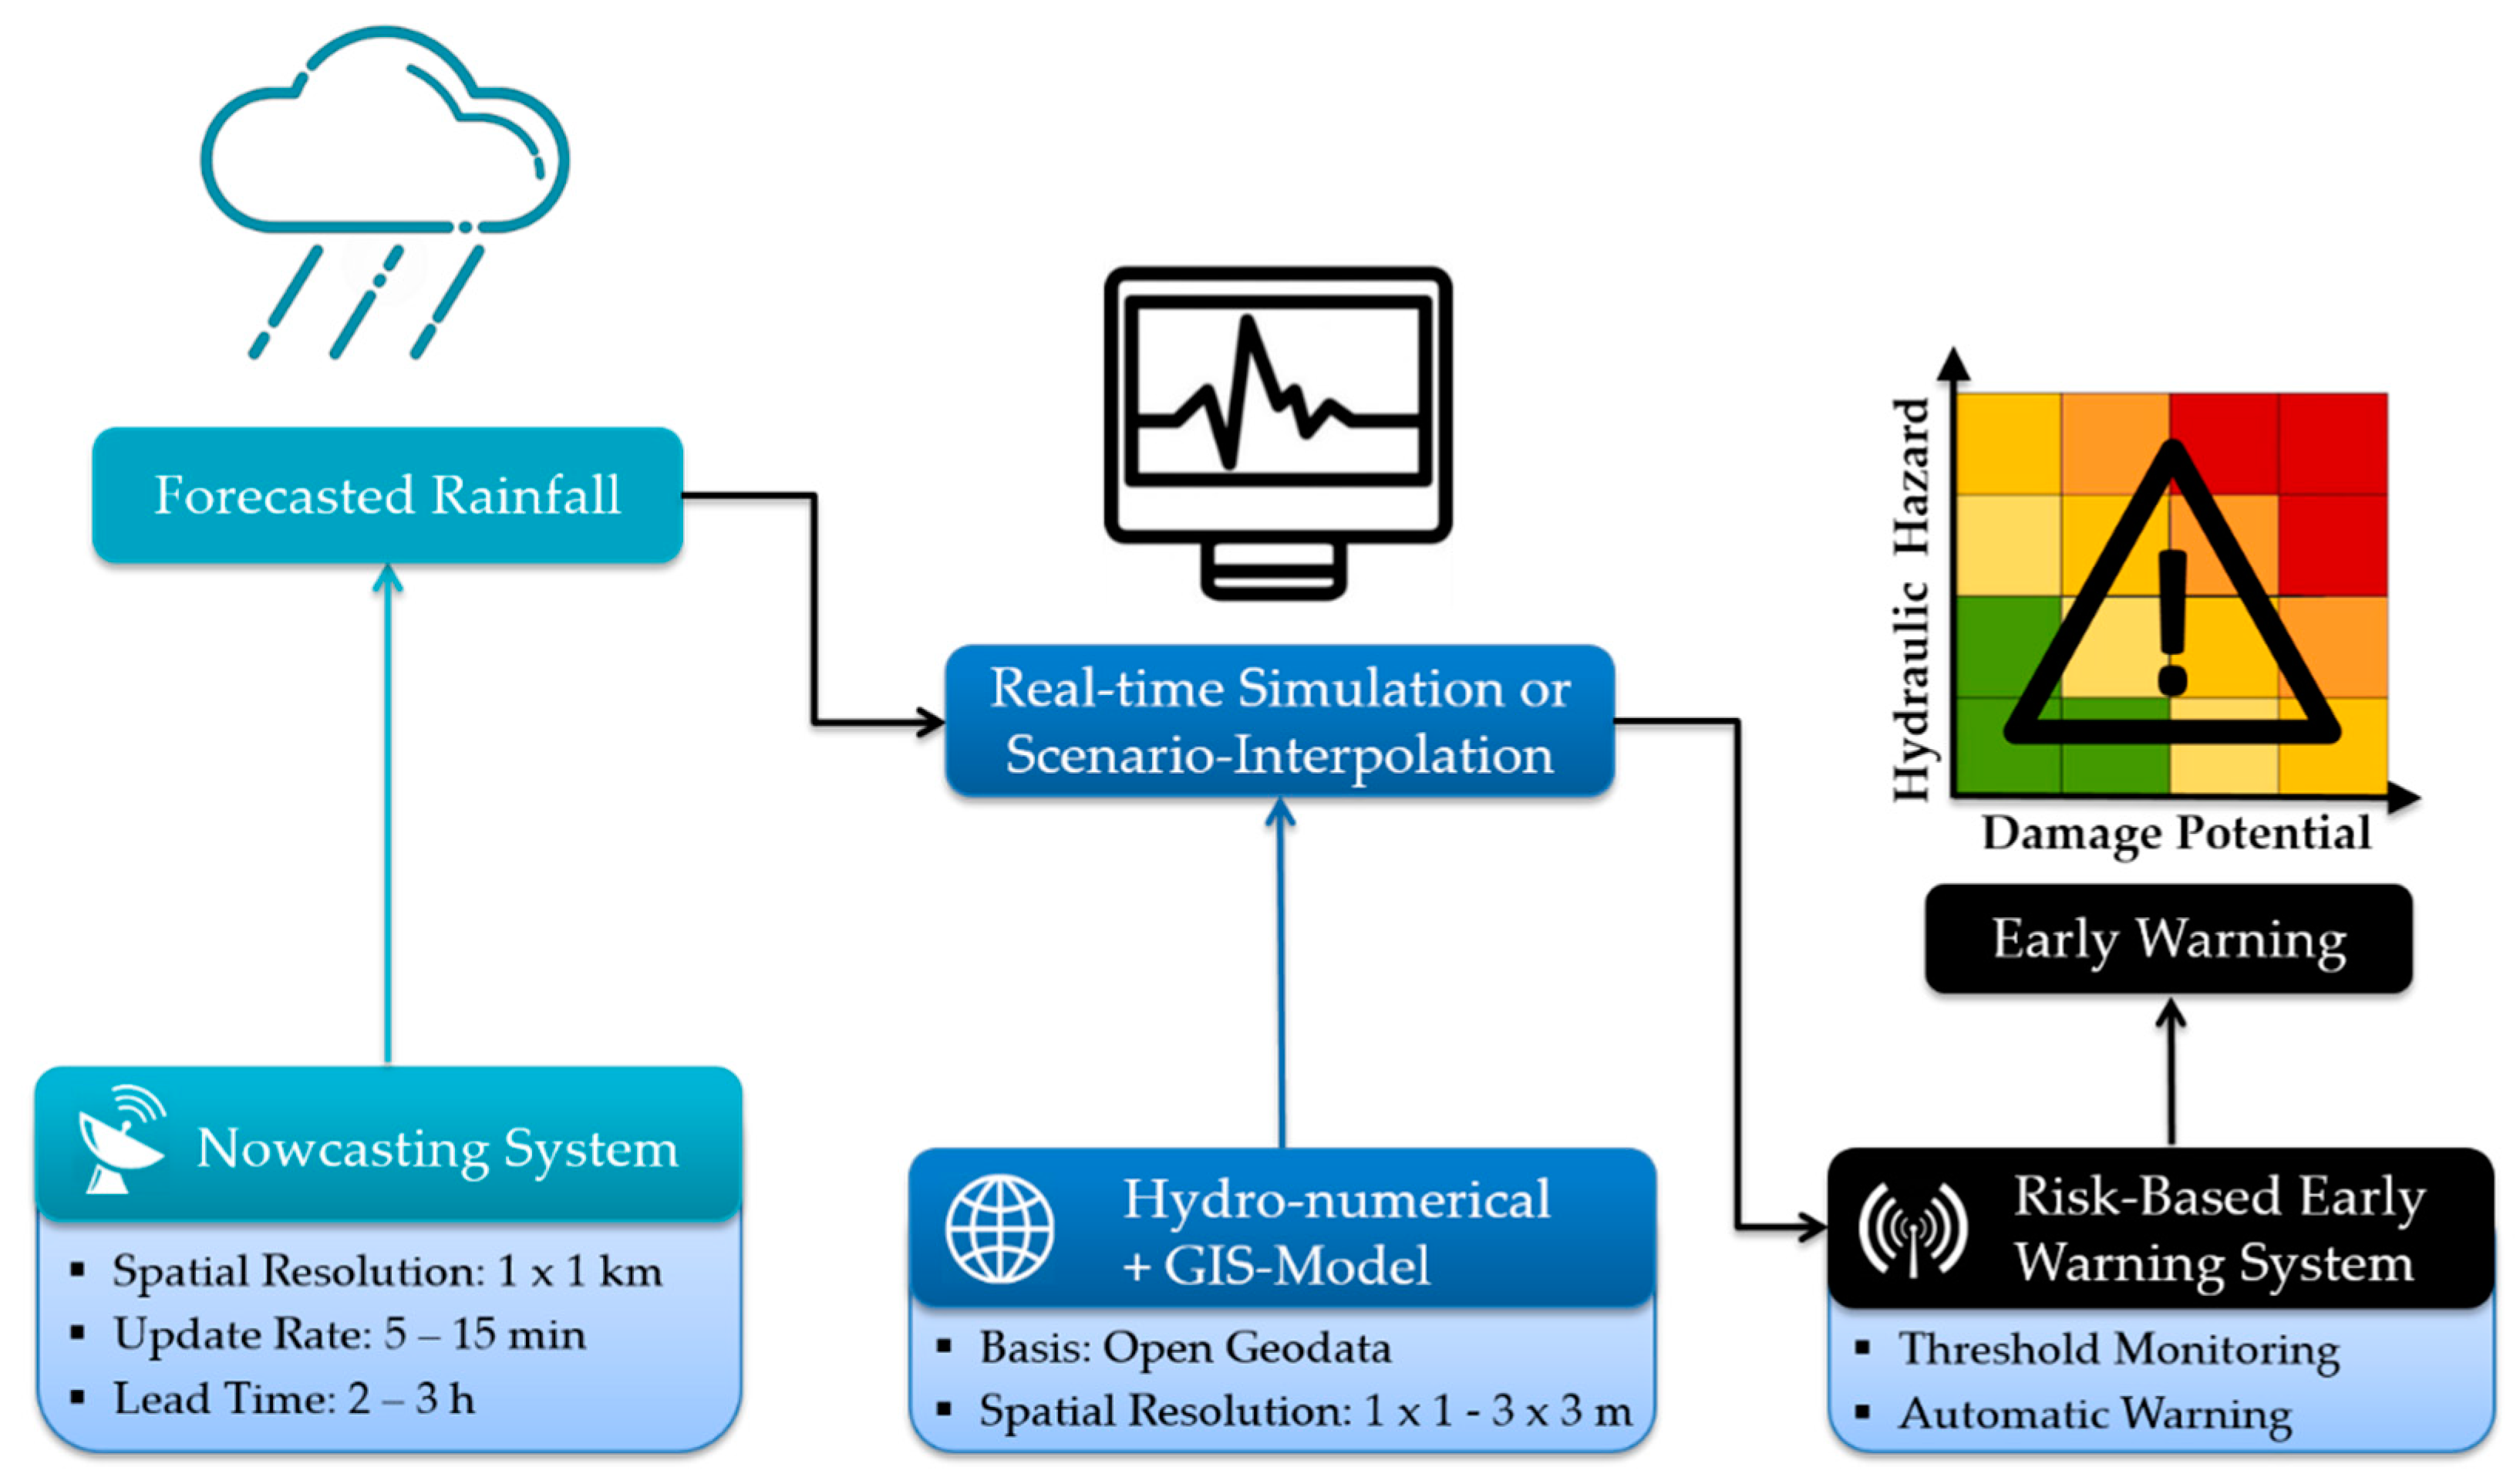
2.1.1. Objective and Components

In the event of heavy rainfall, the safety of a population has top priority [34]. Therefore, an alarm system must warn the community with the highest possible effectiveness about the threats due to urban flash floods. The runoff processes of heavy rainfall events are highly complex and vary in space and time because of the variability of terrain, topography and urban structures. In this context, not only the hydrodynamic simulation of the flooding processes, but also the identification and analysis of critical infrastructure and high-traffic areas, are of great relevance. Power failures, failure of hospital facilities or cut off rescue routes are creating additional risks, and therefore need to be considered to ensure effective risk and disaster management.
The aim of the developed EWS concept is implementing a warning system that is taking both the pluvial flood hazard as well as the vulnerability of urban infrastructure into account. The risk-based EWS includes the following three models (Figure 1):
  • A nowcasting system for provisioning short-termed and radar-based rainfall forecasts.
  • A hydro-numerical model for the simulation of flow processes resulting from a heavy rainfall event.
  • A GIS-Model for the identification and classification of particularly vulnerable areas, and the estimation of damage values.
Based on a coupled-process of these models, this EWS simulates upcoming flooding processes and simultaneously superimposes the results with the pre-calculated urban damage potential. Thus, in the event of a forecasted heavy rainfall event, it issues a rapid warning about the exact location and extent of the flooding in combination with an estimate of the damage situation.
The risk-based EWS is one integral component of a MPFIS. The MPFIS performs the holistic analysis of historical, potential and forecasted heavy rainfall events. Besides the early warning module, the MPFIS integrates two independently-working modules, the documentation and the risk-assessment module. While the georeferenced documentation of past pluvial floods is used for understanding and model validation purposes, the risk analysis serves as a basis for the generation of pluvial flood-hazard maps and risk mitigation measures. Both modules represent the basis for the development of the EWS by providing the necessary model verification and procedure for risk assessment to build up an integrated system.
Based on the risk assessment module, two methodical approaches for a risk-based EWS emerge, which differ in terms of their operating principle. One method, the Scenario Interpolation Method, works with pre-simulated scenarios and issues a warning based on a comparison process between scenario rainfall patterns and forecasted rainfall patterns. The real-time simulation method however works by the hydrodynamic live simulation of flooding processes as a result of forecasted rainfall patterns. An external rainfall-forecast module, a so-called nowcasting system—delivered for example by DWD-RADVOR-OP (radar-based, real-time precipitation forecast for operational application) from the DWD or the live web-service HydroMaster from the companies KISTERS AG and MeteoGroup Ltd—provides the weather forecast data. Depending on the selected nowcasting system the update rate of the forecast information is between 5 min and 15 min, while the lead time reaches up to three hours.
The spatial resolution of the hydrodynamic flow simulations depend on the urban area, but will be between 1 m × 1 m and 3 m × 3 m. Accordingly, critical areas and neuralgic points are analyzed with a higher resolution than non-critical areas with the aim to reduce computing effort. Subsequently, the resulting hazard values are superimposed with damage potential values within an automated risk assessment. Therefore, the warning message contains the combined information of forecasted flood depths D [m], flow velocities V [m/s] or the product of these two impact parameters V × D [m2/s] defined as flood impulse (also known as flood intensity), and the damage potential of individual urban objects. By working exclusively with georeferenced data, the warnings are assembled with high-precision GPS position information of the affected buildings or urban sections. The information is provided as a digital and dynamic visualization on corresponding terminals as well as in the form of operational maps. With the aid of such an EWS, the end user (e.g., rescue services, firefighters) receives a high-quality forecast report including the flood propagation, affected critical infrastructure (hospitals, power utilities), cut-off escape routes, etc. and thus provides the ideal basis for systematic disaster prevention and management.

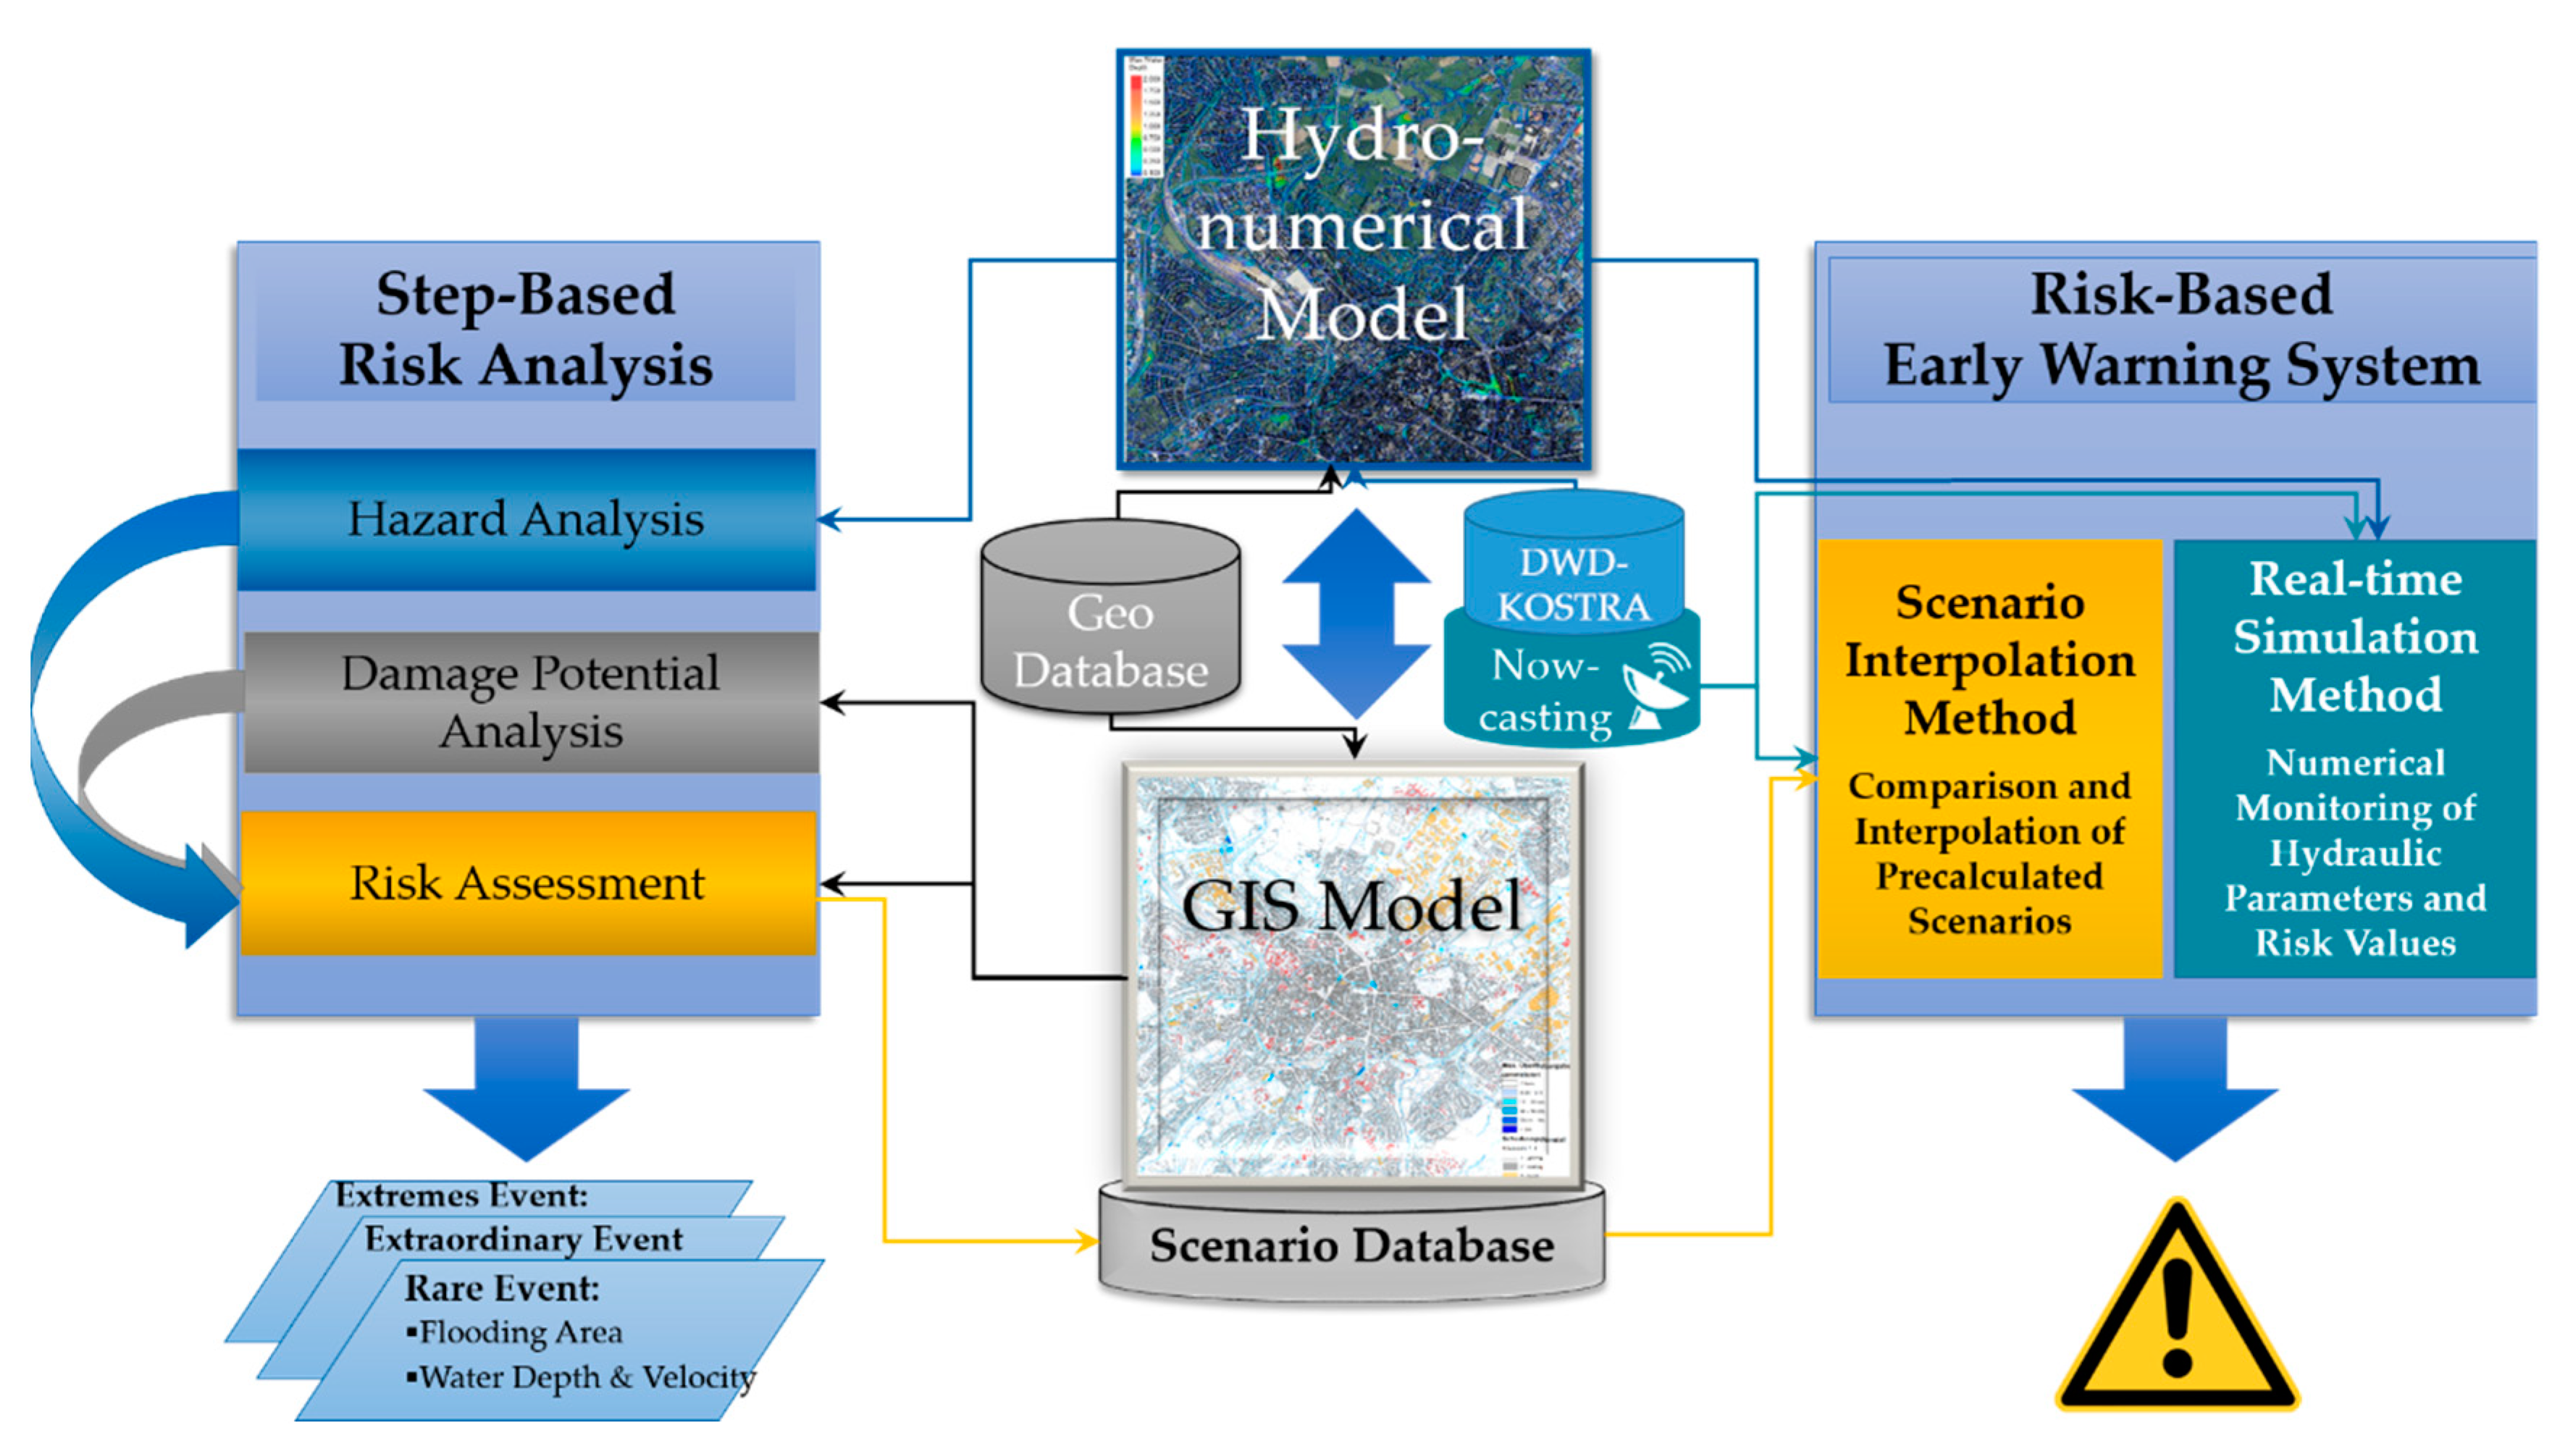
2.1.2. Real-time Simulation Method

The real-time simulation method uses forecast data to simulate flooding processes and determine the consequences of heavy rainfall patterns in real-time. Therefore, the hydro-numeric model is fed with forecast rain data to calculate the transient flow processes live and with the maximum possible computing speed. Subsequently the calculated flood hazard variables (water depth and velocity) are processed by the GIS-Model to determine the flood risks in a second step. Therefore, a damage potential analysis is carried out based on existing geodata and with the help of systematic semi-automated GIS process techniques.
The great advantage here is the coupled work of both models on the same georeferenced data basis. This ensures the fastest possible, uniform data transfer and eliminates processing difficulties. After the process of automated risk-analytical modeling of rainfall induced runoff processes, the actual warning message is generated. This is done based on both the risks and numerically implemented discharge and water level measurements. If the defined threshold values are exceeded, the system issues an automatic alarm message to responsible end user authorities.
The calculation time of the early warning system may not exceed 15 min in order to guarantee a continuous forecast depending on the update rate of the precipitation forecasts. To guarantee the lowest possible prediction time, the hydrodynamic simulation is running with multiple GPU processing units for high-end parallel computing, also called general-purpose computing on graphics processing units (GPGPU)—if necessary, with the aid of special computer servers (cloud computing). Still, to fulfill this computing time, big areas have to be subdivided into smaller, computable areas.
By monitoring the numeric hydraulic-flood parameters via simulation of forecasted rainfall events and the automatic combination with the damage potential of urban objects, the EWS provides risk-based warnings. Thus, it is possible to identify affected urban areas and critical infrastructure with a very high spatial and temporal resolution before a storm happens.
A major point dealing with an operational real-time forecast model is the system stability. Therefore, a long-term testing phase is essential to devise solutions for computing speed, and process complexity. Especially, the use of a coupled 1D-/2D- hydro-numerical model to respect the sewer system would cause many additional weak points regarding the stability. For that reason, a 2D-limited surface-flow model has to be tested more intensively beforehand.
Concerning the fact that the input for the EWS is nowcasting data, derived by numerical weather models, the failure safety is higher compared to forecast models using additional inputs like water depth observations. Except for the rainfall-forecast, all high-resolution data are already prepared and stored in a database (geodata). However, the failure of radar-systems would lead to a total failure of the EWS.

2.1.3. Scenario-Interpolation Method

A real-time simulation of hydrodynamic flow processes requires fast, high capacity computer systems. Furthermore, the processing of large datasets requires particularly stable model conditions. If these conditions are not met, the scenario interpolation method is preferred over the real-time simulation. The scenario interpolation method uses pre-simulated scenarios and a machine-learning based matching process to determine the floods and consequences caused by the forecasted rainfall pattern. By simulating several predefined rainfall events with the parameter’s intensity, duration and extension, the resulting floods and risks can be determined in advance. Afterwards, the scenarios are saved in a database. Therefore, the database contains scenario datasets which are composed of rainfall scenarios and derived flood-risk estimations.
In the case of a forecasted heavy rainfall event, the predicted parameter’s intensity and the extent are compared to the values on the basis of particular matching methods. The conceptual process scheme is constructed as follows:
  • Hydrodynamic simulation of several heavy rainfall scenarios.
  • Automated superimposition of flash-flood hazard with pre-calculated damage potential.
  • Automated determination of risks and definition of threshold values for risks and hydraulic parameters and structured storage of data
  • Systematic comparison process between specific rainfall patterns and consequences (water flows, flooded areas) with the aim to determine specific threshold values for spatio-temporal rainfall heights. In this process step, methods of machine learning techniques are checked for their applicability. Synthetic scenarios (varying rainfall parameters) and corresponding flood inundation maps are used as training input.
  • Monitoring of nowcasted rainfall data and comparison with scenario parameters
  • Matching or interpolation process for the determination of flooded urban areas and critical objects.
  • Output of warning message when reaching a defined threshold value with object-precise information about hydraulic flood parameters and affected physical objects.

2.2. Multifunctional Pluvial Flood Information System

The MPFIS forms the foundation for the risk-based EWS. The guiding principle of the MPFIS is the holistic analysis and assessment of the pluvial flood risks. Composed of a coupled model-system, the information instrument performs, with its three modules, the following functions:
  • Georeferenced documentation of past pluvial floods for statistics and model validation purposes.
  • Systematic risk-analysis based on an effective step-by-step concept for the generation of standardized and high-resolution hazard and risk maps.
  • Hydrodynamic and risk-based EWS for real-time flood-simulation and identification of affected urban infrastructure as a consequence of forecasted heavy rainfall events.
By the use of freely available, area-wide geodata and precipitation data, the information system can be used in almost any urban area in Germany. The main objective is to ensure a uniform and scalable tool for the detailed determination of risks, development and validation of mitigation measures, as well as an effective EWS based on it.
The coupled model system consists of the following components (Figure 2):
  • Hydro-numerical model for the simulation of runoff and flow processes due to pluvial events [hazard analysis].
  • GIS-model for the analysis and classification of the urban infrastructure [damage potential analysis] and the superimposition of hazard and damage values [risk assessment].
  • Geodata for model basis (DTM, land use, etc.).
  • KOSTRA-DWD (coordinated regionalized heavy rainfall statistics of the DWD) [36] for extreme value statistical precipitation data in Germany.
  • Nowcasting system for providing short-termed and radar-based rainfall forecasts (e.g., DWD-RADVOR or HydroMaster).
In the coupled-model system, the hydro-numerical model performs the hydrodynamic modeling of rainfall runoff processes. The model used the fully dynamic hydraulic and hydrologic software XPSWMM (Version 2018.1, Innovyze, Wallingford, UK) from the company Innovyze. It provides the hydraulic-coupled simulation of both 2D overland flow and 1D sewage and river flow. By solving the complete 2D-depth-averaged shallow water equations as well as the 1D-Saint-Venant equations, it is possible to calculate rainfall-induced flow processes transiently and with high spatio-temporal resolution [37].
While the 1D calculations are based on the EPA SWMM engine, the 2D solutions are working on the Two-dimensional Unsteady FLOW engine (TUFLOW) [38]. TUFLOW was developed as part of a research project between WBM Oceanics Australia (now BMT WBM) and the University of Queensland in 1990 (BMT, 2016) [39]. It was designed with a special focus on the simulation of flood processes in rivers, coastal areas and urban areas and uses a finite-difference method on a regular, quadratic grid [40].
The 2D computational grid is supplied with precipitation data, which can be spatially and temporally variable. With the help of the so-called direct rainfall method, the 2D elements are directly wetted with the precipitation value, whereby each network element is assigned a time-differentiated rainfall. The effective precipitation is then transferred directly to the hydrodynamic computation. Thus, no external hydrological model for precipitation runoff modeling is required [41]. Subsequently, the flow processes in natural and urban catchment areas are calculated, and the flooded areas, water levels and flow velocities can be visualized in high detail.
The main function of the GIS-Model (in this project ArcGIS 10.5) is the documentation of historic pluvial flood events, including information of georeferenced recordings, as well as the performance of a risk analysis. In the risk analysis, it performs on one hand the damage potential analysis and on the other hand the risk evaluation. Subsequently hazard and risk maps can be generated for defined heavy rainfall scenarios. Furthermore, the GIS-system serves the management of all necessary flood information and performing the pre- and post-processing of all datasets.

2.3. Data Basis

The basis of the MPFIS, and therefore for the risk-based EWS, is on the one hand official geodata and the other hand precipitation data. The fully georeferenced data allow the interactive work of the hydro-numeric and GIS model, and thus guarantee a very fast and uniform transfer of data and the usage of systematic and automated metrics for area-wide application in Germany. For the risk analysis carried out in this report, the open geodata of the federal state North Rhine-Westphalia (Geodata NRW) [42] as well as the statistical rainfall data of the DWD [36] were used (Table 1).

2.3.1. Geodata NRW

The digital terrain model (DTM) maps the terrain surface using georeferenced elevation points, but without objects such as buildings or vegetation. The DTM provided by the Geodata NRW has a spatial resolution of 1 m × 1 m and an elevation accuracy of +/−20 cm [42]. Since heavy rain-induced runoff is concentrated at distinctive points and surface structures of the urban area, the horizontal and especially vertical resolution have a decisive influence on the significance of the hydrodynamic simulations. For this reason, the DGM was investigated in a comprehensive sensitivity analysis. Due to the generation process of the DTM, tunnels, underpasses and passages are not mapped, which creates a need for the pre-processing and adaptation of the elevation model.
The digital landscape model (DLM) describes the surface in the form of topographic objects. Those objects are clearly ID-defined and associated to one type of land use (ATKIS-Basis-DLM) and can be imported into the hydro-numeric model with a defined roughness. The estimation of the degree of sealing as well as the interception height is also based on the DLM objects, whereas, the soil map is used to estimate the infiltration. The vector data set of building polygons (house perimeters) are implemented in the hydro-numerical model as no-flow-areas.
Digital orthophotos (DOP) and the German basic map (DGK5) with a scale of 1:5000 serve the visualization of the simulations within the pre-processing of the urban surface textures as wells as for the process of risk analysis. Furthermore, they are used for the identification of underpasses, passages, etc. and thus serve the local adaptation of the DTM.

2.3.2. Hydrologic and Hydraulic Parameters

According to the soil map (GK50), the largest part of the case study site is mainly former floodplains of today’s canalized brooks. The soil consists mostly of pseudogley (clayey, silty) with a filtration coefficient (kf)-value of 16 cm/d. The western parts are however rendzina soil, a shallow bedrock consisting of sandy silt (clayey, silty) with a kf-value of 8 cm/d to 16 cm/d.
For the area-related landscape-classification estimations of the roughness coefficients, parameters were determined according to the United States Environmental Protection Agency (EPA) [43], as wells as the studies from Stoker & Schwaller [44]. Parameters for the interception storage and the degree of sealing were taken from the research project “Untersuchung starkregengefährdeter Gebiete” of the German Institute LWI from the Technical University of Braunschweig [45] as well as from the EPA. Table 2 shows the hydrologic and hydraulic modeling parameters used for the model.

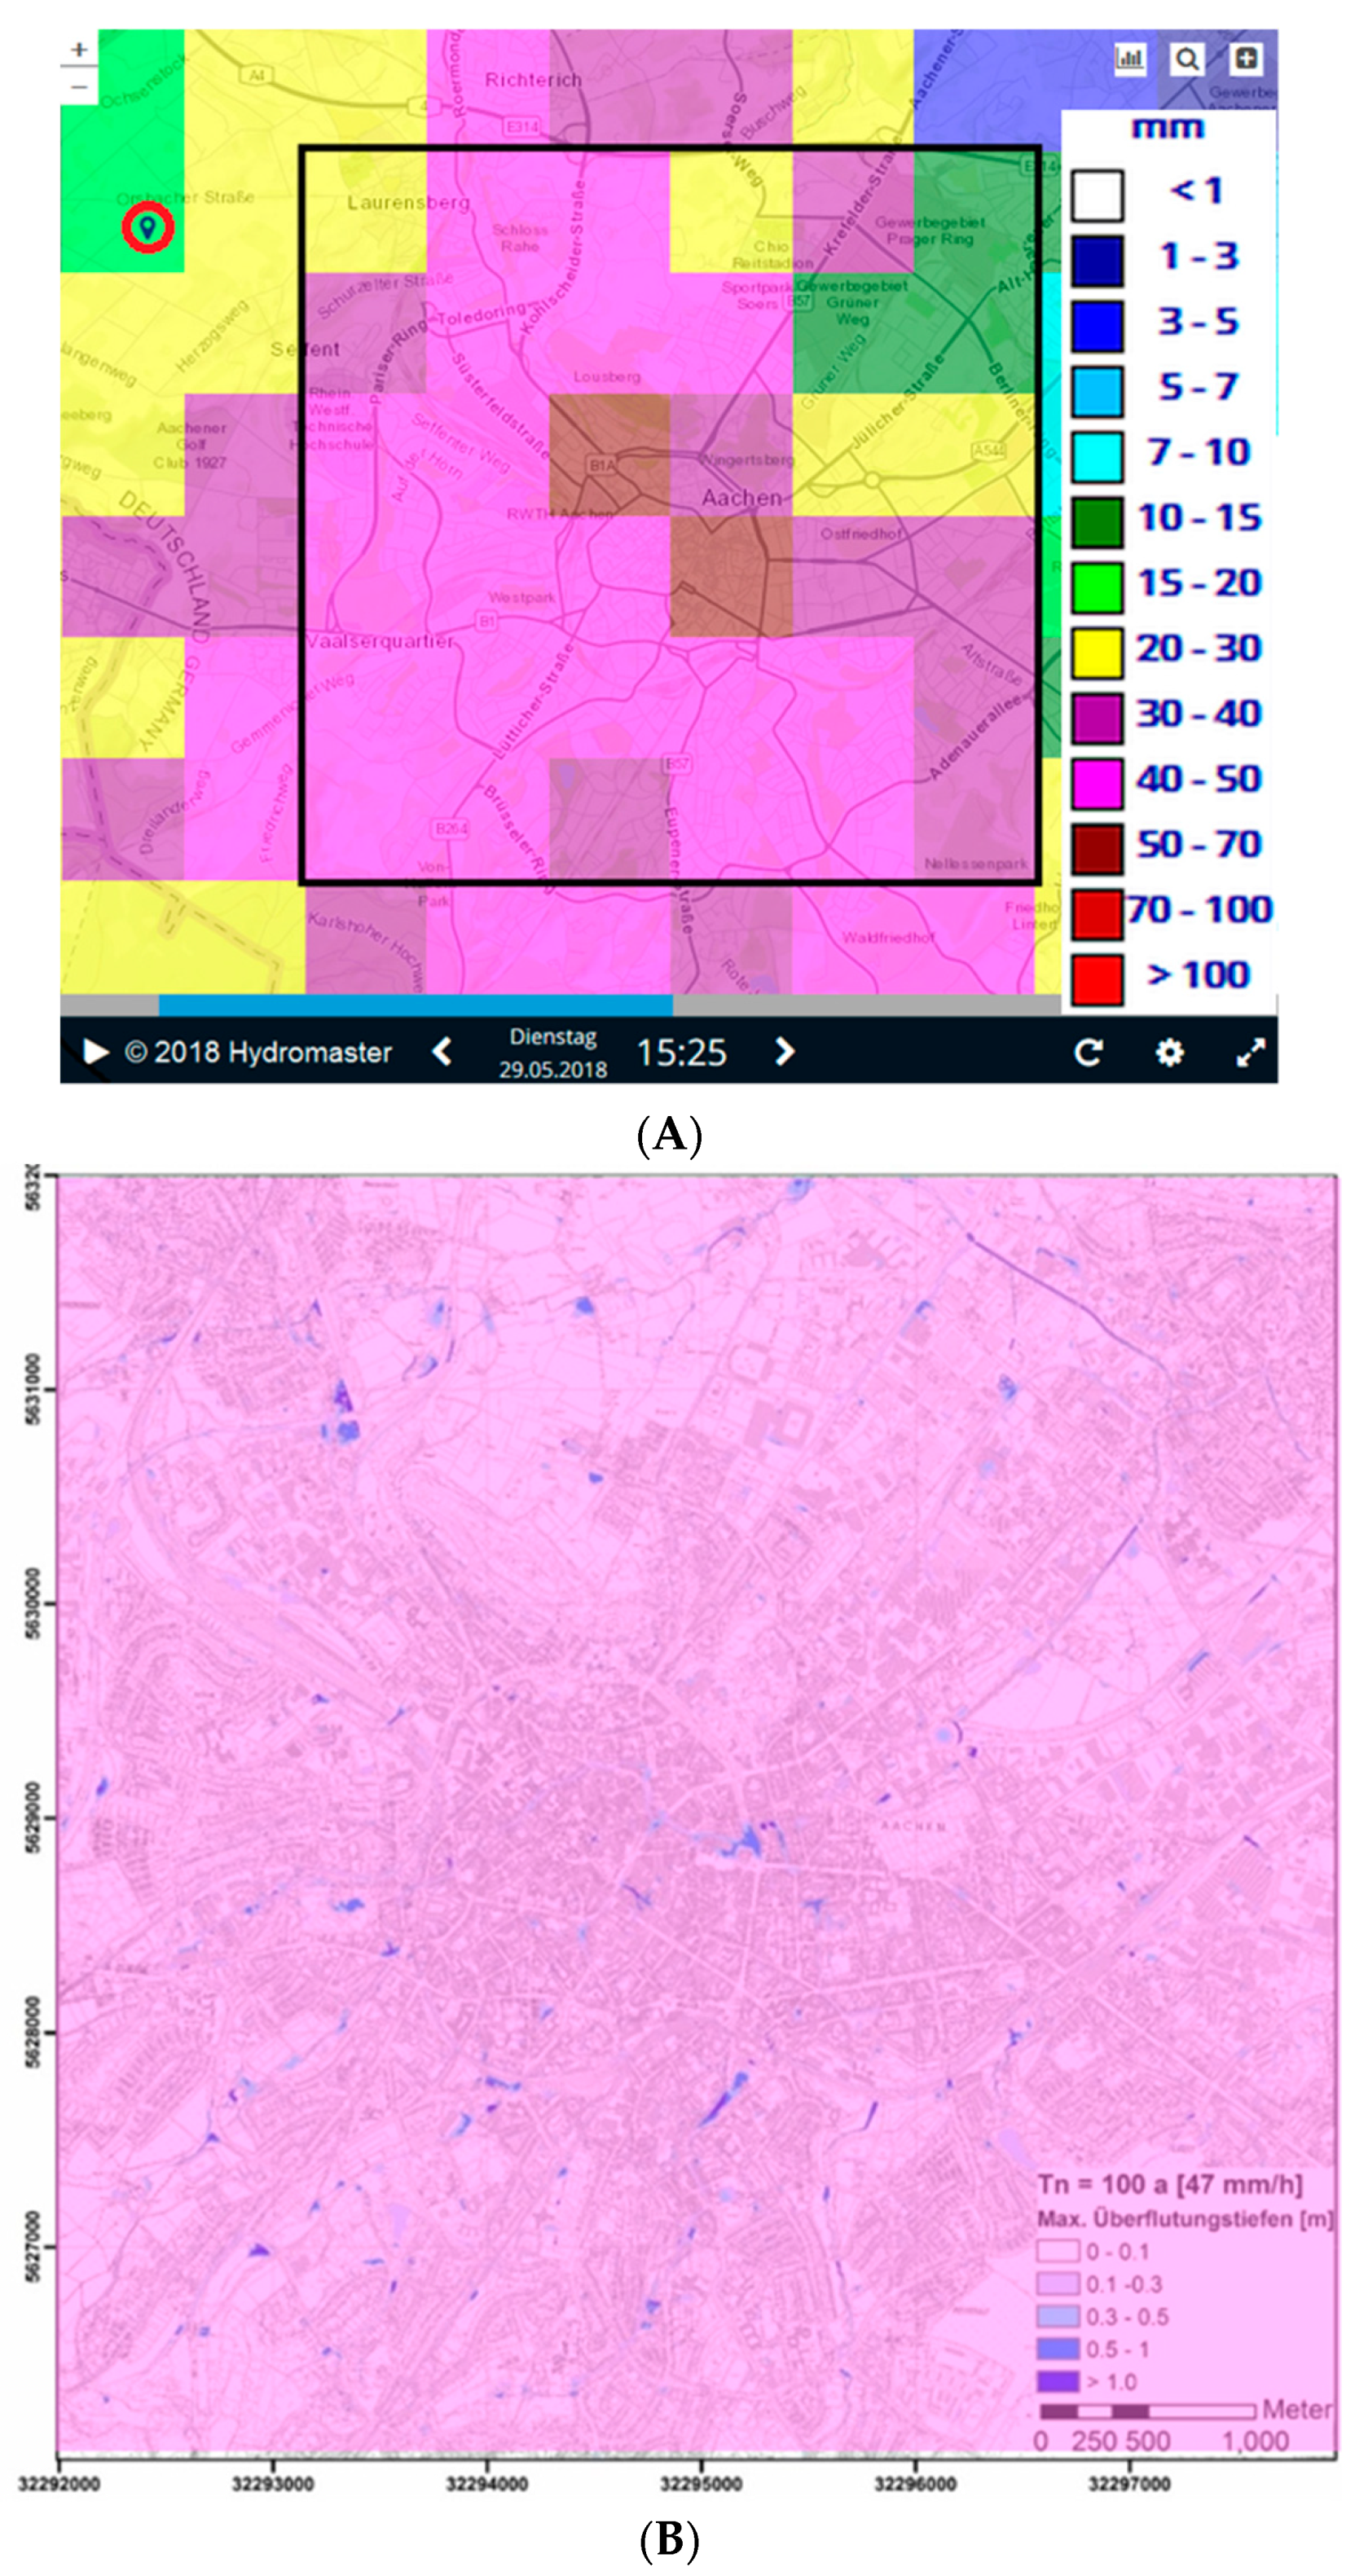
2.3.3. Precipitation (Statistical Data & Forecasts)

The German weather forecast (DWD) provides heavy rainfall statistics in the form of the KOSTRA-DWD-2010-R dataset. This dataset contains data about rainfall amount, duration and the probability of occurrence in GIS-compatible raster format. According to the German guideline DWA-M119 [46], as well as the heavy rainfall index (HRI) [47], the following four rainfall-scenarios were selected from the KOSTRA-DWD-2010R dataset, where TN represents the return period (years) and I the intensity (mm/h) of a heavy rainfall event:
  • Scenario 1 (rare event): TN = 30 a, I = 38.6 mm/h (HRI = 5);
  • Scenario 2 (rare event): TN = 50 a, I = 42.0 mm/h (HRI = 6);
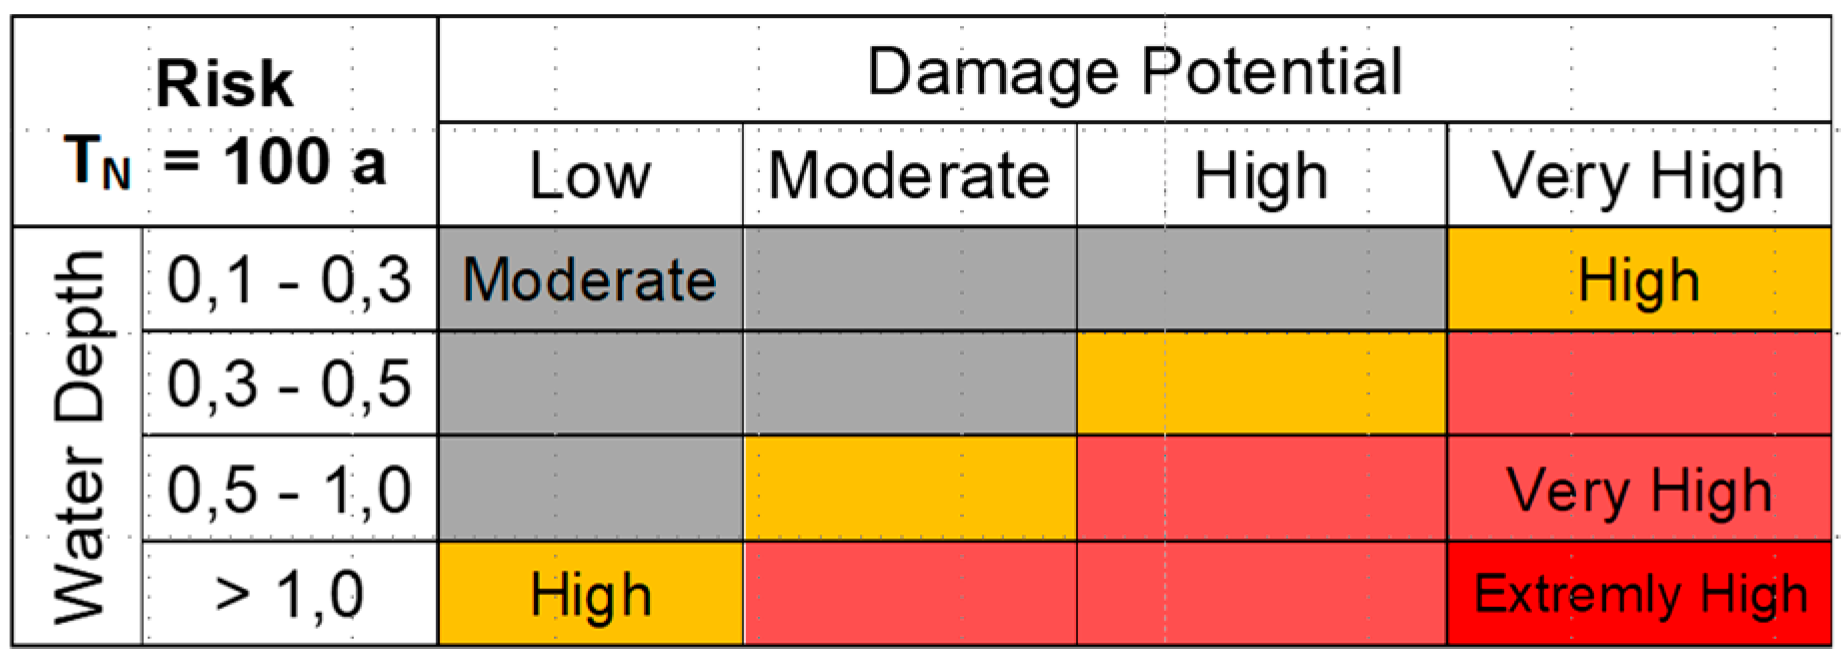
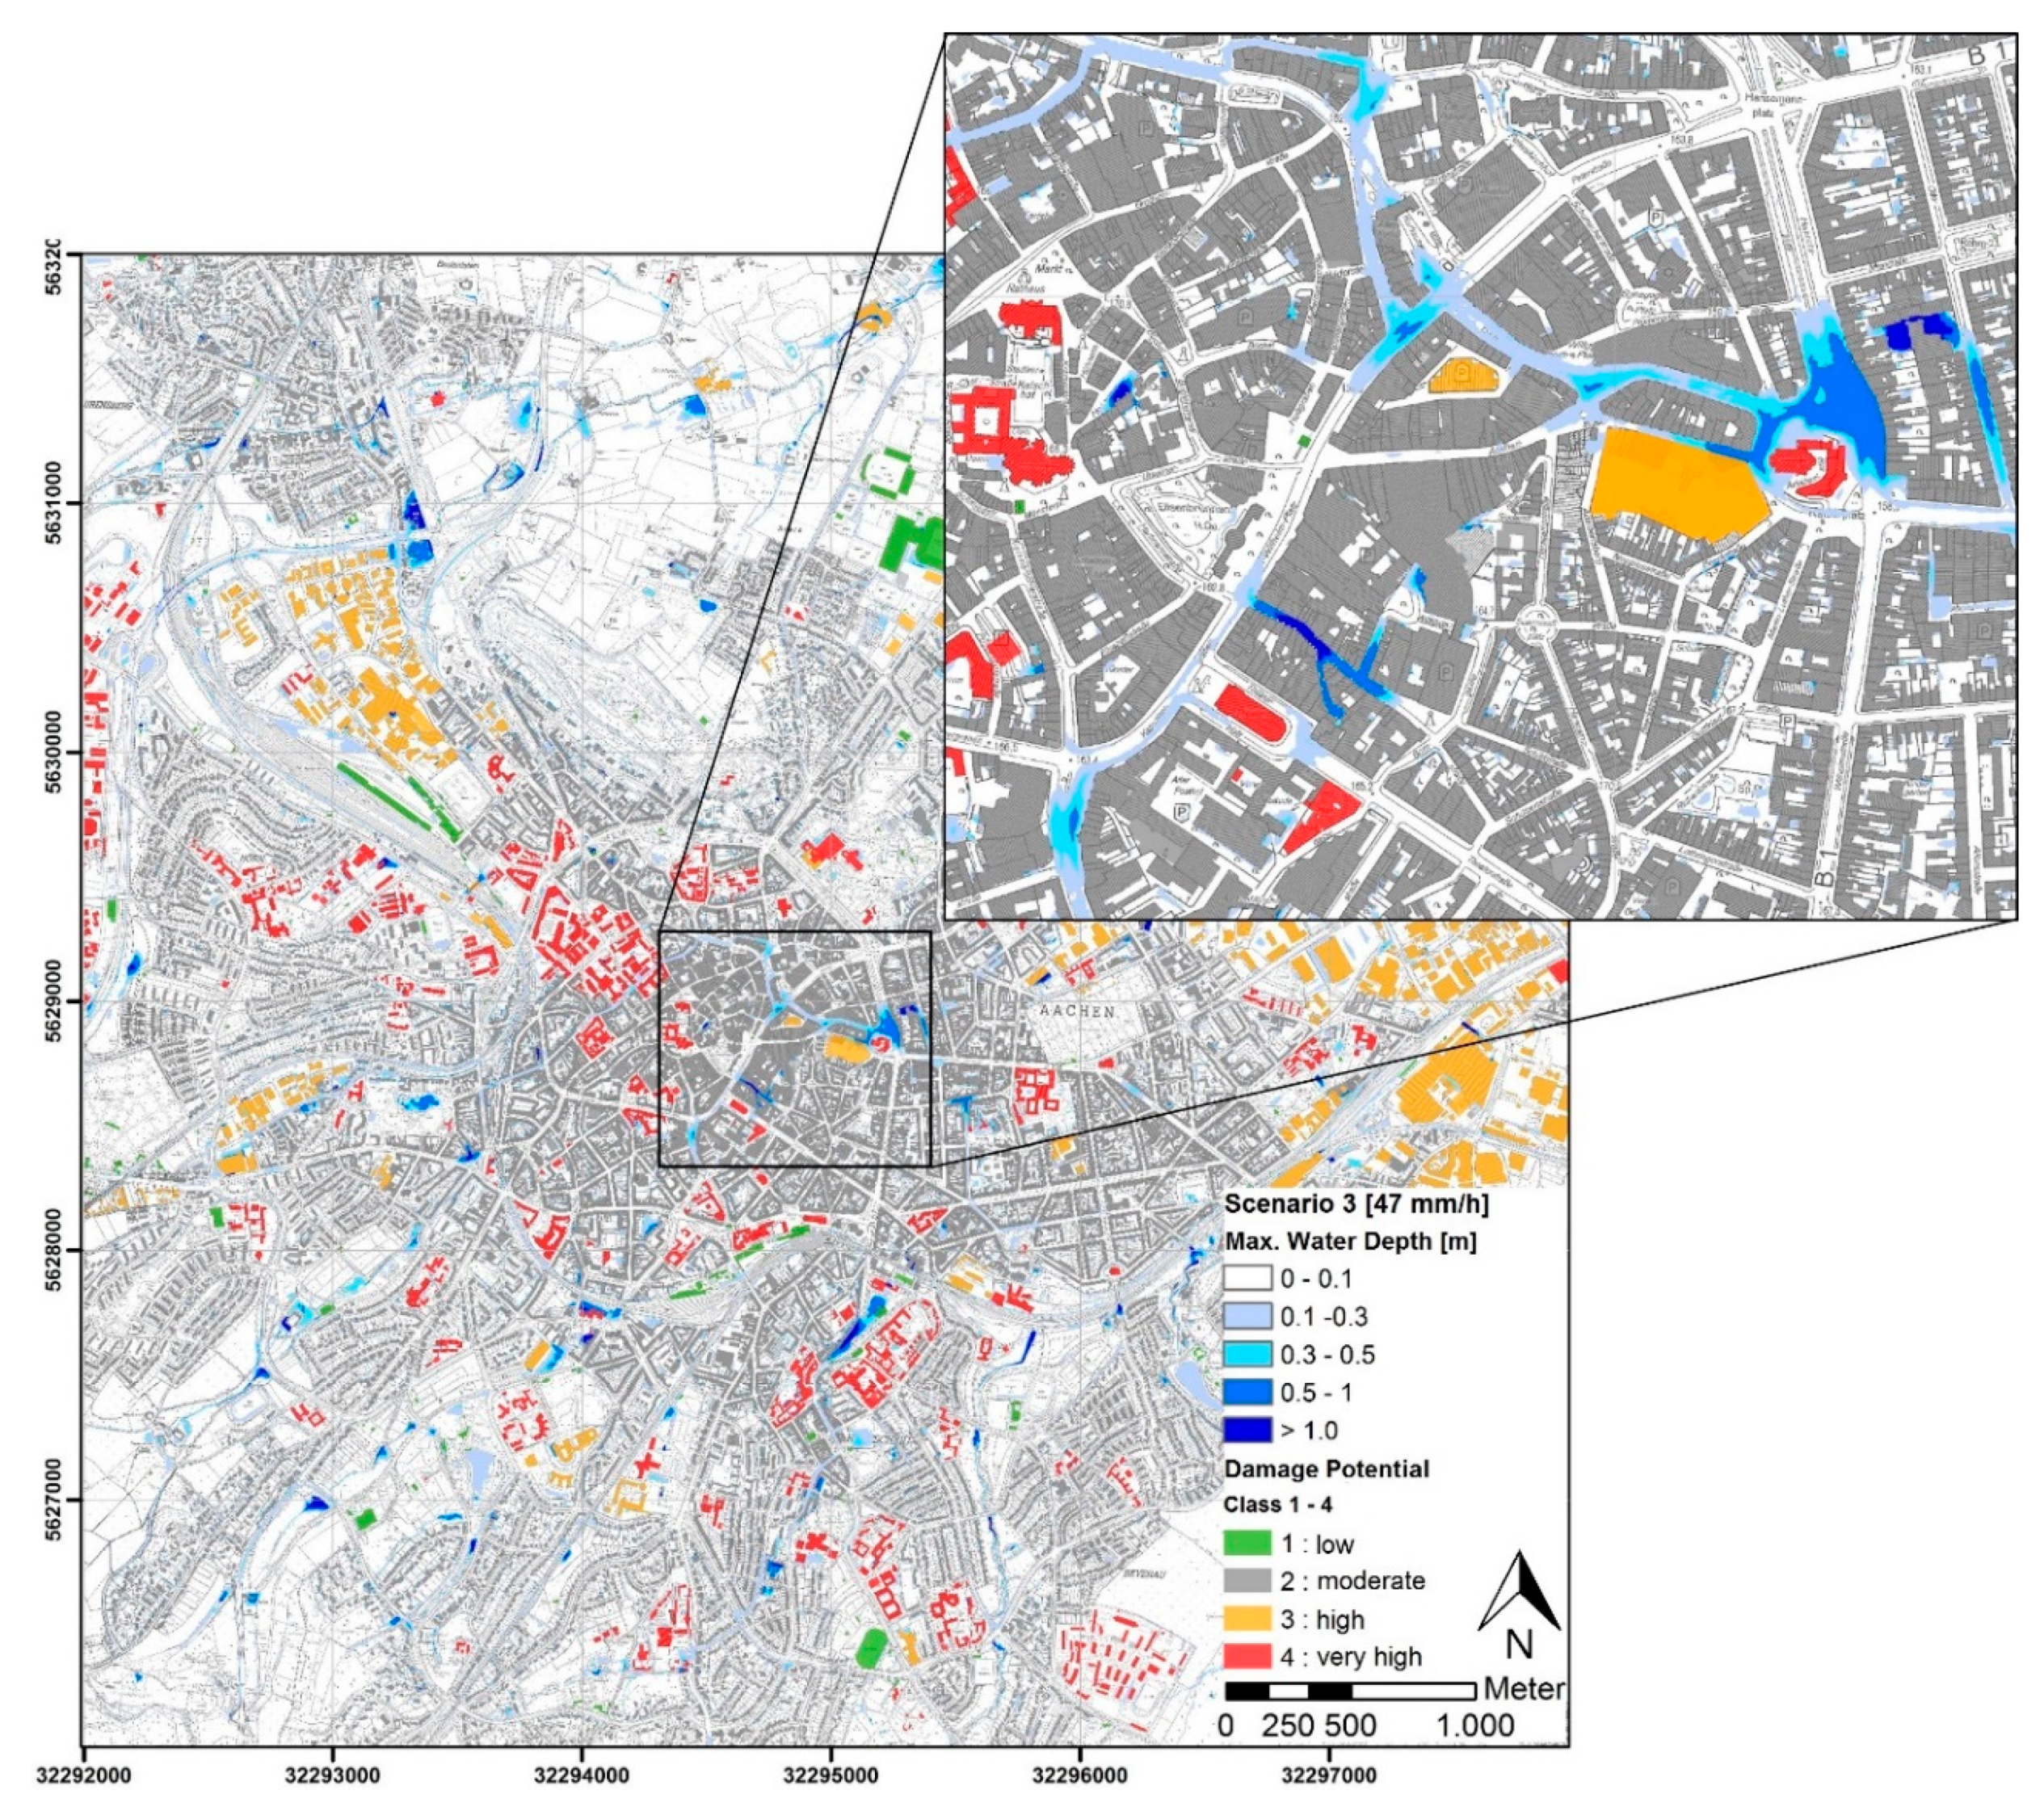
  • Scenario 3 (very rare event): TN = 100 a, I = 47.0 mm/h (HRI = 7);
  • Scenario 4 (extreme event): TN extreme, I = 131.6 mm/h (HRI = 12).
On the other hand, the DWD also provides quantitative precipitation forecasts with high spatial and temporal resolution for the German territory. The DWD-RADVOR product offers a precipitation forecast of up to 2 h in two variants. The quantifying analysis and forecast is carried out using the current comparative values between indirect radar and direct ground-based precipitation measurements [48].
The DWD currently provides the following two products [48]:
  • Uncalibrated precipitation forecasts in 5-min increments [mm/5min] with an update rate of five minutes.
  • Calibrated precipitation analysis and forecasts in 60 min increments [mm/h] with an update rate of 15 min.
Another provider of radar-based observation and forecast data is the live web service HydroMaster, a collaboration between MeteoGroup Ltd. and KISTERS AG. The HydroMaster allows the analysis of historical as well as forecasted rainfall events, based on refined deterministic and probabilistic forecast data for defined hotspots or areas of interest. By using this service system, the end user retrieves radar and rain-gauge-calibrated cumulative precipitation amounts for any defined period with a forecast up to three hours, five-minute update rate, and a spatial resolution of 1 km2 [49].

2.4. Boundary Conditions

Due to the fact that no sewer network data were available for the development of a 1D-model, the effect of the sewer system was accounted in a simplified form in accordance with DWA-M119 [46] and the practical guideline for municipal heavy rainfall risk management from the German federal state of Baden-Wuerttemberg (LUBW) [50]. Accordingly, the scenario rainfall was decreased in the amount of the design rainfall for the sewage system of the city of Aachen. Thus, this simplified approach does not take the exchange process between surface and sewer network into account. As a result, in areas where the sewer network has effects on the flooding processes (intake and discharge of water) the flood risk may be over or under-estimated.
Furthermore, the water ingress into the buildings is not simulated. Especially for buildings with basements, the flood depth in the surrounding areas tends to be over-estimated.

3. Case Study and Results

First basics for the development of the risk-based EWS have been carried out on a case study of the German city of Aachen. The study area encompassed 36 km2 of the central area of the city of Aachen. Due to the fact that the EWS is based on a risk approach, systematic risk analyses were performed by the coupled-model system. Before those, a comprehensive sensitivity analysis was performed to determine relevant simulation parameters. The aim of these investigations was to determine the relevant overland flow parameters for the concept development.
Based on the results of the sensitivity analysis and according to the terms of practical guidelines of the LUBW and DWA-M 119, a step-based risk analysis and concept was developed to guarantee the systematic and targeted identification of pluvial flood risks. The guiding principle was to develop a highly effective and automatable process flow, getting all flood-relevant information from free data. The process and calculation effort should be as low as possible to guarantee to a high level of system implementation.
Of vital importance for an EWS are correct forecasts and plausible, clear and understandable alerts. Therefore, this study assesses the validity and accuracy of the information system by using documented data of pluvial flood events in Aachen. Alongside older, historically recorded events, pluvial flood recordings were taken during the event of the 29 May 2018.
Furthermore, in order to guarantee a sufficient lead time, the computation speed is of crucial relevance to an efficient real-time simulation EWS. Therefore, the computation times of the simulations were tracked in order to compare the CPU to GPU processing characteristics based on the two-parameters number of 2D-cells and runtime. The objective of this comparison was to get an initial indication of possible calculation times, and thus allow statements about the efficiency of the model. The simulations were carried out using an Intel i7-6700K (4.00 GHz) processor, NVIDIA GeForce GTX 750 Ti (2 GB RAM) graphic card, and a 32 GB system memory.

3.1. Step-Based Risk Analysis—City of Aachen Case Study

In the first step, the hazard analysis was performed based on the hydro-numerical model with a spatial computation grid of 3 m × 3 m for the entire study area with a total number of four million cells. The results of the sensitivity analysis showed sufficient accuracies for the urban flooding processes with a simultaneous reduction of the computing time. In addition, detailed analyses of neuralgic points and areas with large flood depths were carried out at a resolution of 1 m × 1 m. A simulation time of three hours was selected, consisting of one-hour rainfall and two hours follow-up time. The precipitation was evenly distributed over the complete area in 5 min time steps. The simulation of the large model (four million cells) was carried out once using the CPU, then the GPU. Whereas, the CPU-runtime was 4610 min, the GPU runtime was 439 min. Thus, the computation via the GPU was 10.5 times faster (speedup factor) compared to the CPU.
The computation results in the form of maximum flooding extensions, water depths and flow velocities were analyzed in different time steps, and subsequently transferred and categorized in the GIS model. The results were heavy-rain-hazard maps for the four scenarios, which served both as a basis for risk assessment and for locating particularly critical areas. In addition, the simulated flood process was dynamically mapped with time steps of five minutes.
In the second step, the damage potential analysis was carried out with the GIS-Model and its systematic operations as well as SQL queries. Therefore, the building data were intersected with the ATKIS land use areas and categorized into four different damage potential classes (Table 3) according to the manual DWA-M119 [46]. Thus, for example the ATKIS land use attribute “Special Functional Area” including hospitals, kindergartens, administration buildings etc., was classified with a very high damage potential. Accordingly, industrial buildings and high-traffic shopping malls belong to class 3, whereas, residential and commercial buildings were classified with class 2. In this way, a simplified damage potential map was generated classifying all building objects within the respective land use. A detailed determination of damage via vulnerability curves was not carried out.
In the final risk assessment, first a combined visualization of the results was drawn in a risk map. Using this information, a graphical and qualitative evaluation of risks was carried out. Based on systematic SQL queries and a defined evaluation matrix (Figure 3), the next step was to classify automatically the specific risk for each individual object as a function of water level and damage potential. This evaluation method therefore results in a high risk for those objects with a high damage potential and a high-water level as a function of the probability of occurrence of scenario three. Consequently, a particularly high flood risk arose from scenario three for some areas in the city center like the shopping center Aquis Plaza on Kaiserplatz and the surrounding buildings. Figure 4 shows the combined visualization of the results of hazard and damage potential analysis.

3.2. Documentation and Validation Process

For both understanding the complex processes of pluvial floods as well as for model validation purposes, a systematic documentation of heavy rainfall events and impacts is of great importance. Considering this, an automatic procedure was developed to save and map actual events with flooding and rainfall data in one integrated GIS-model. For that purpose, pluvial flash flood events were marked as georeferenced shape files comprising the following data:
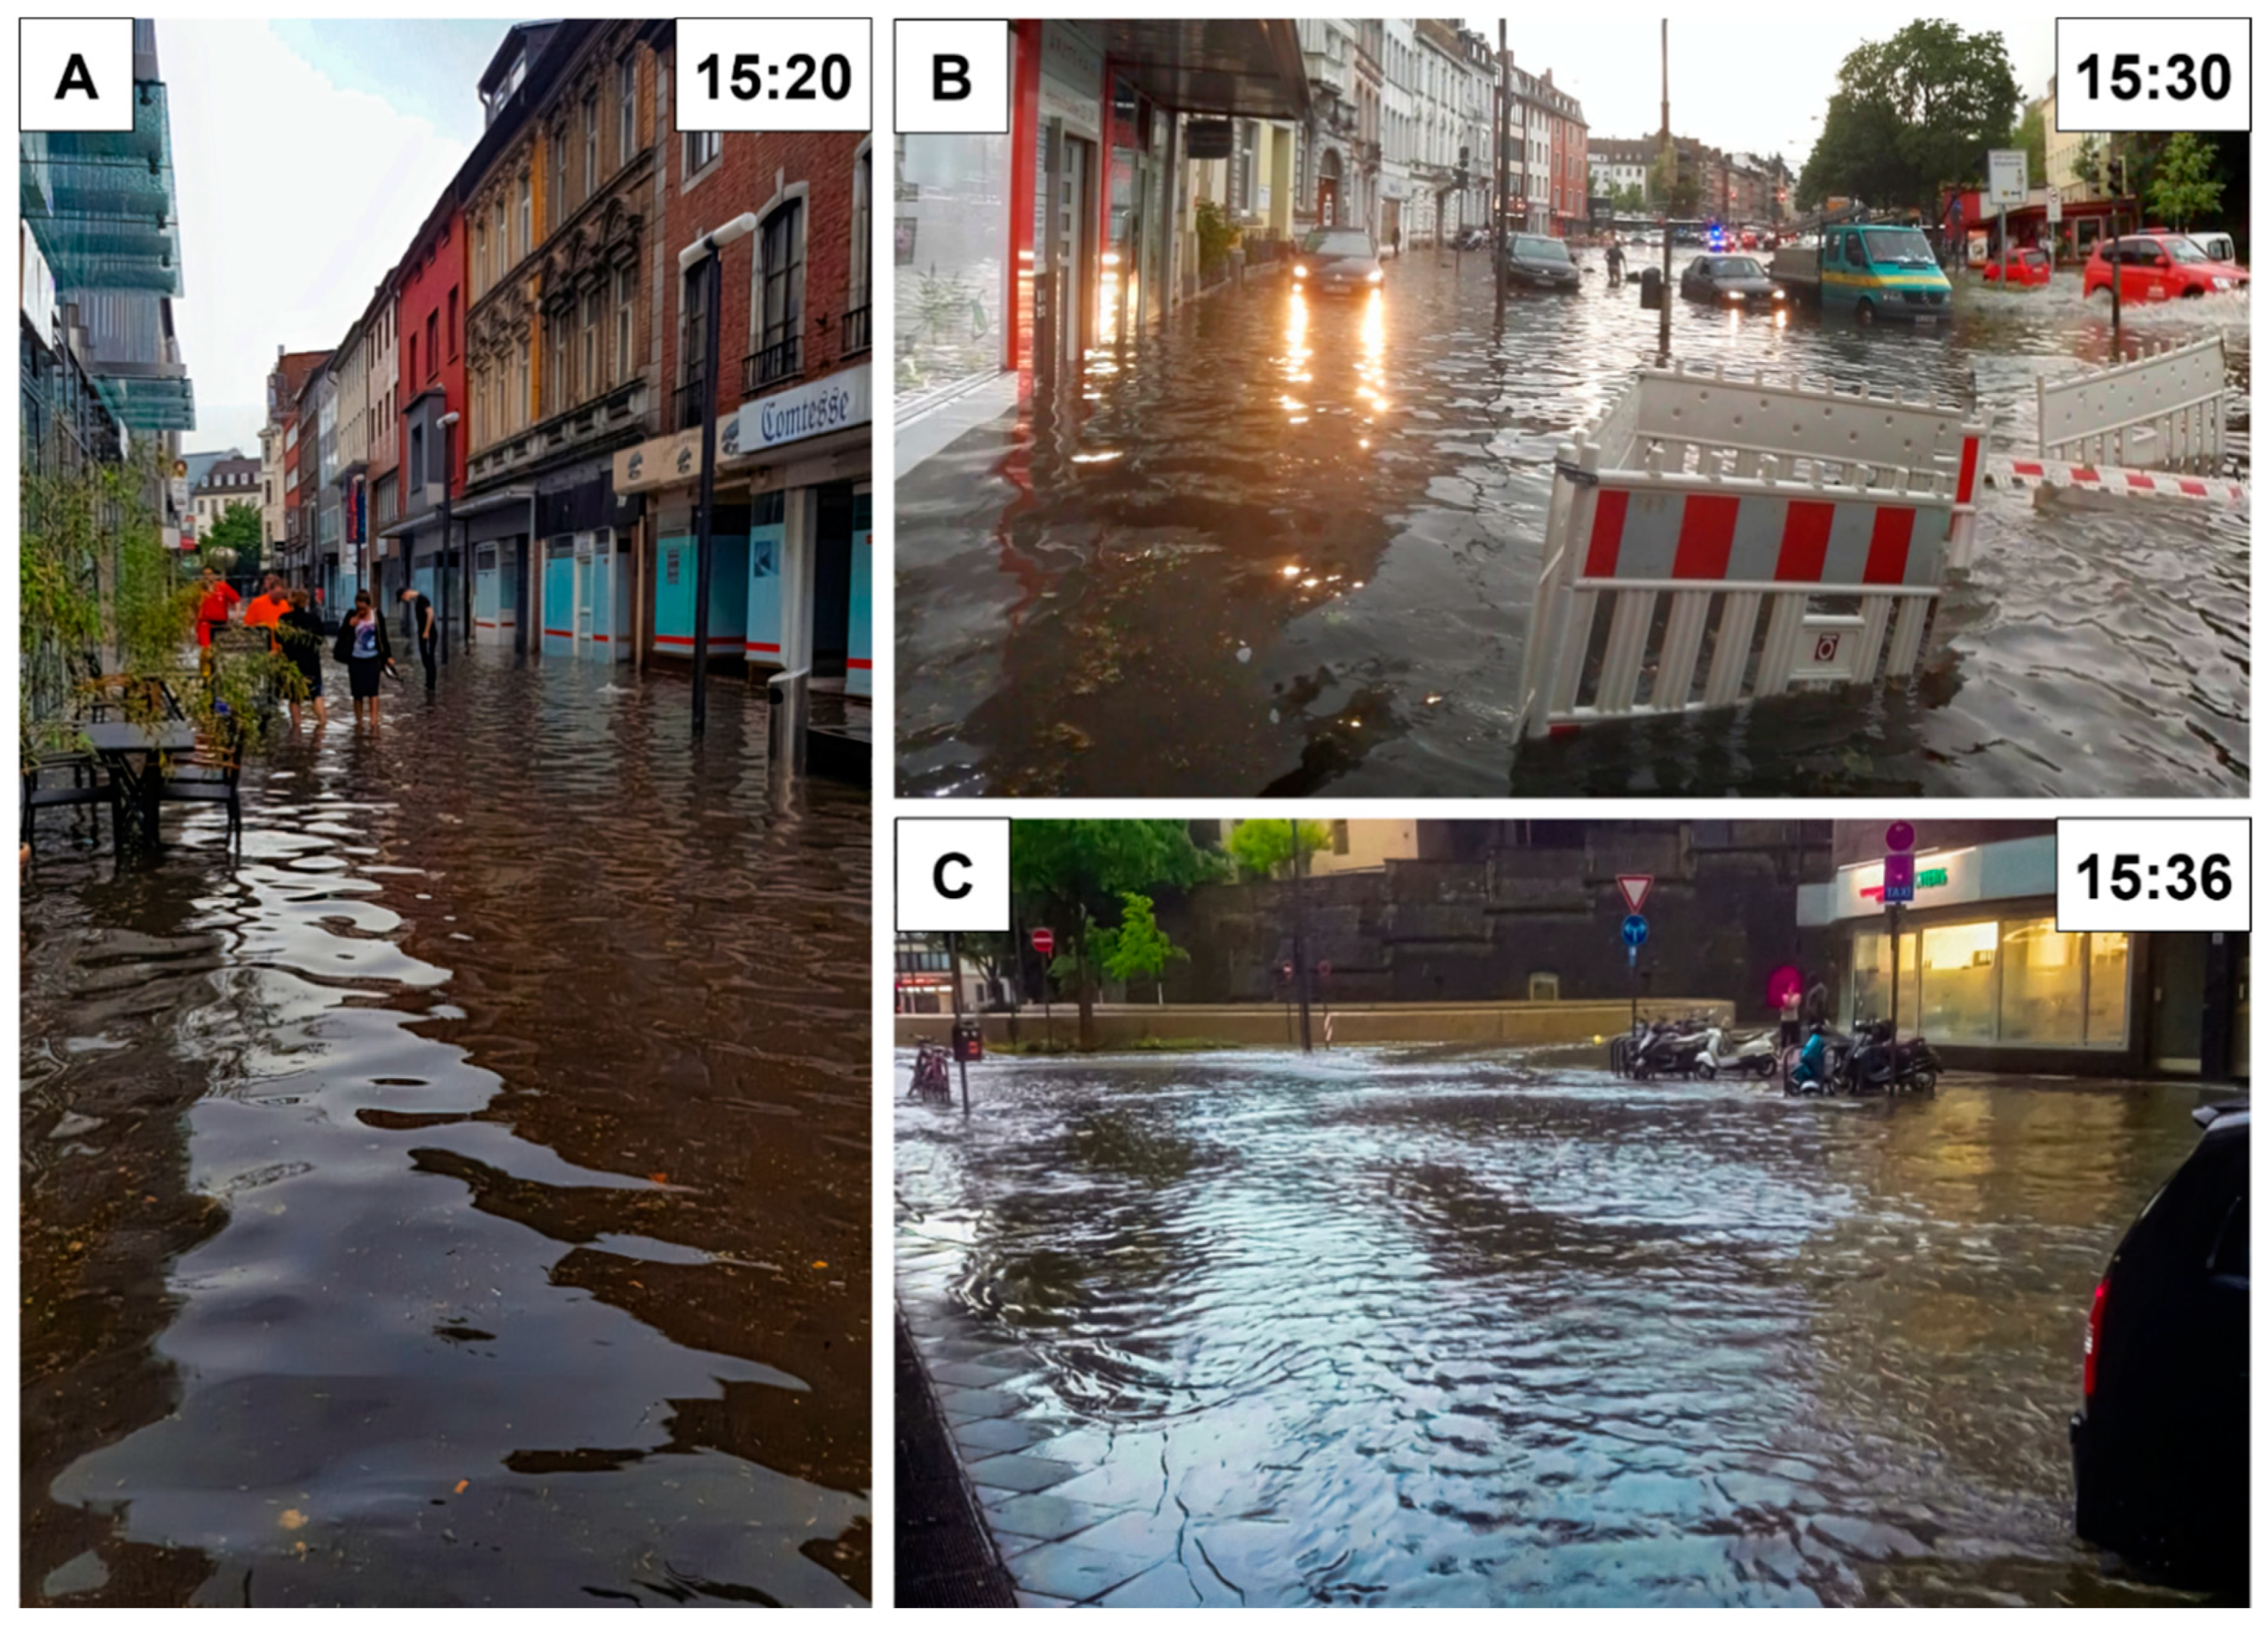
  • Rainfall parameters: duration, amount, intensity and affected area.
  • Flooding information: image and video recordings with space and time information, estimated water depth, affected area and objects.
A GIS-implemented geotag tool allows for the automatic and rapid transfer of georeferenced records. In the next step, the hydro-numerical model was fed with historical heavy rainfall event data, and the results were compared with three historical events (2002, 2006, 2011) documented by the project URBAS [51]. First results indicated a high correspondence between model and reality.

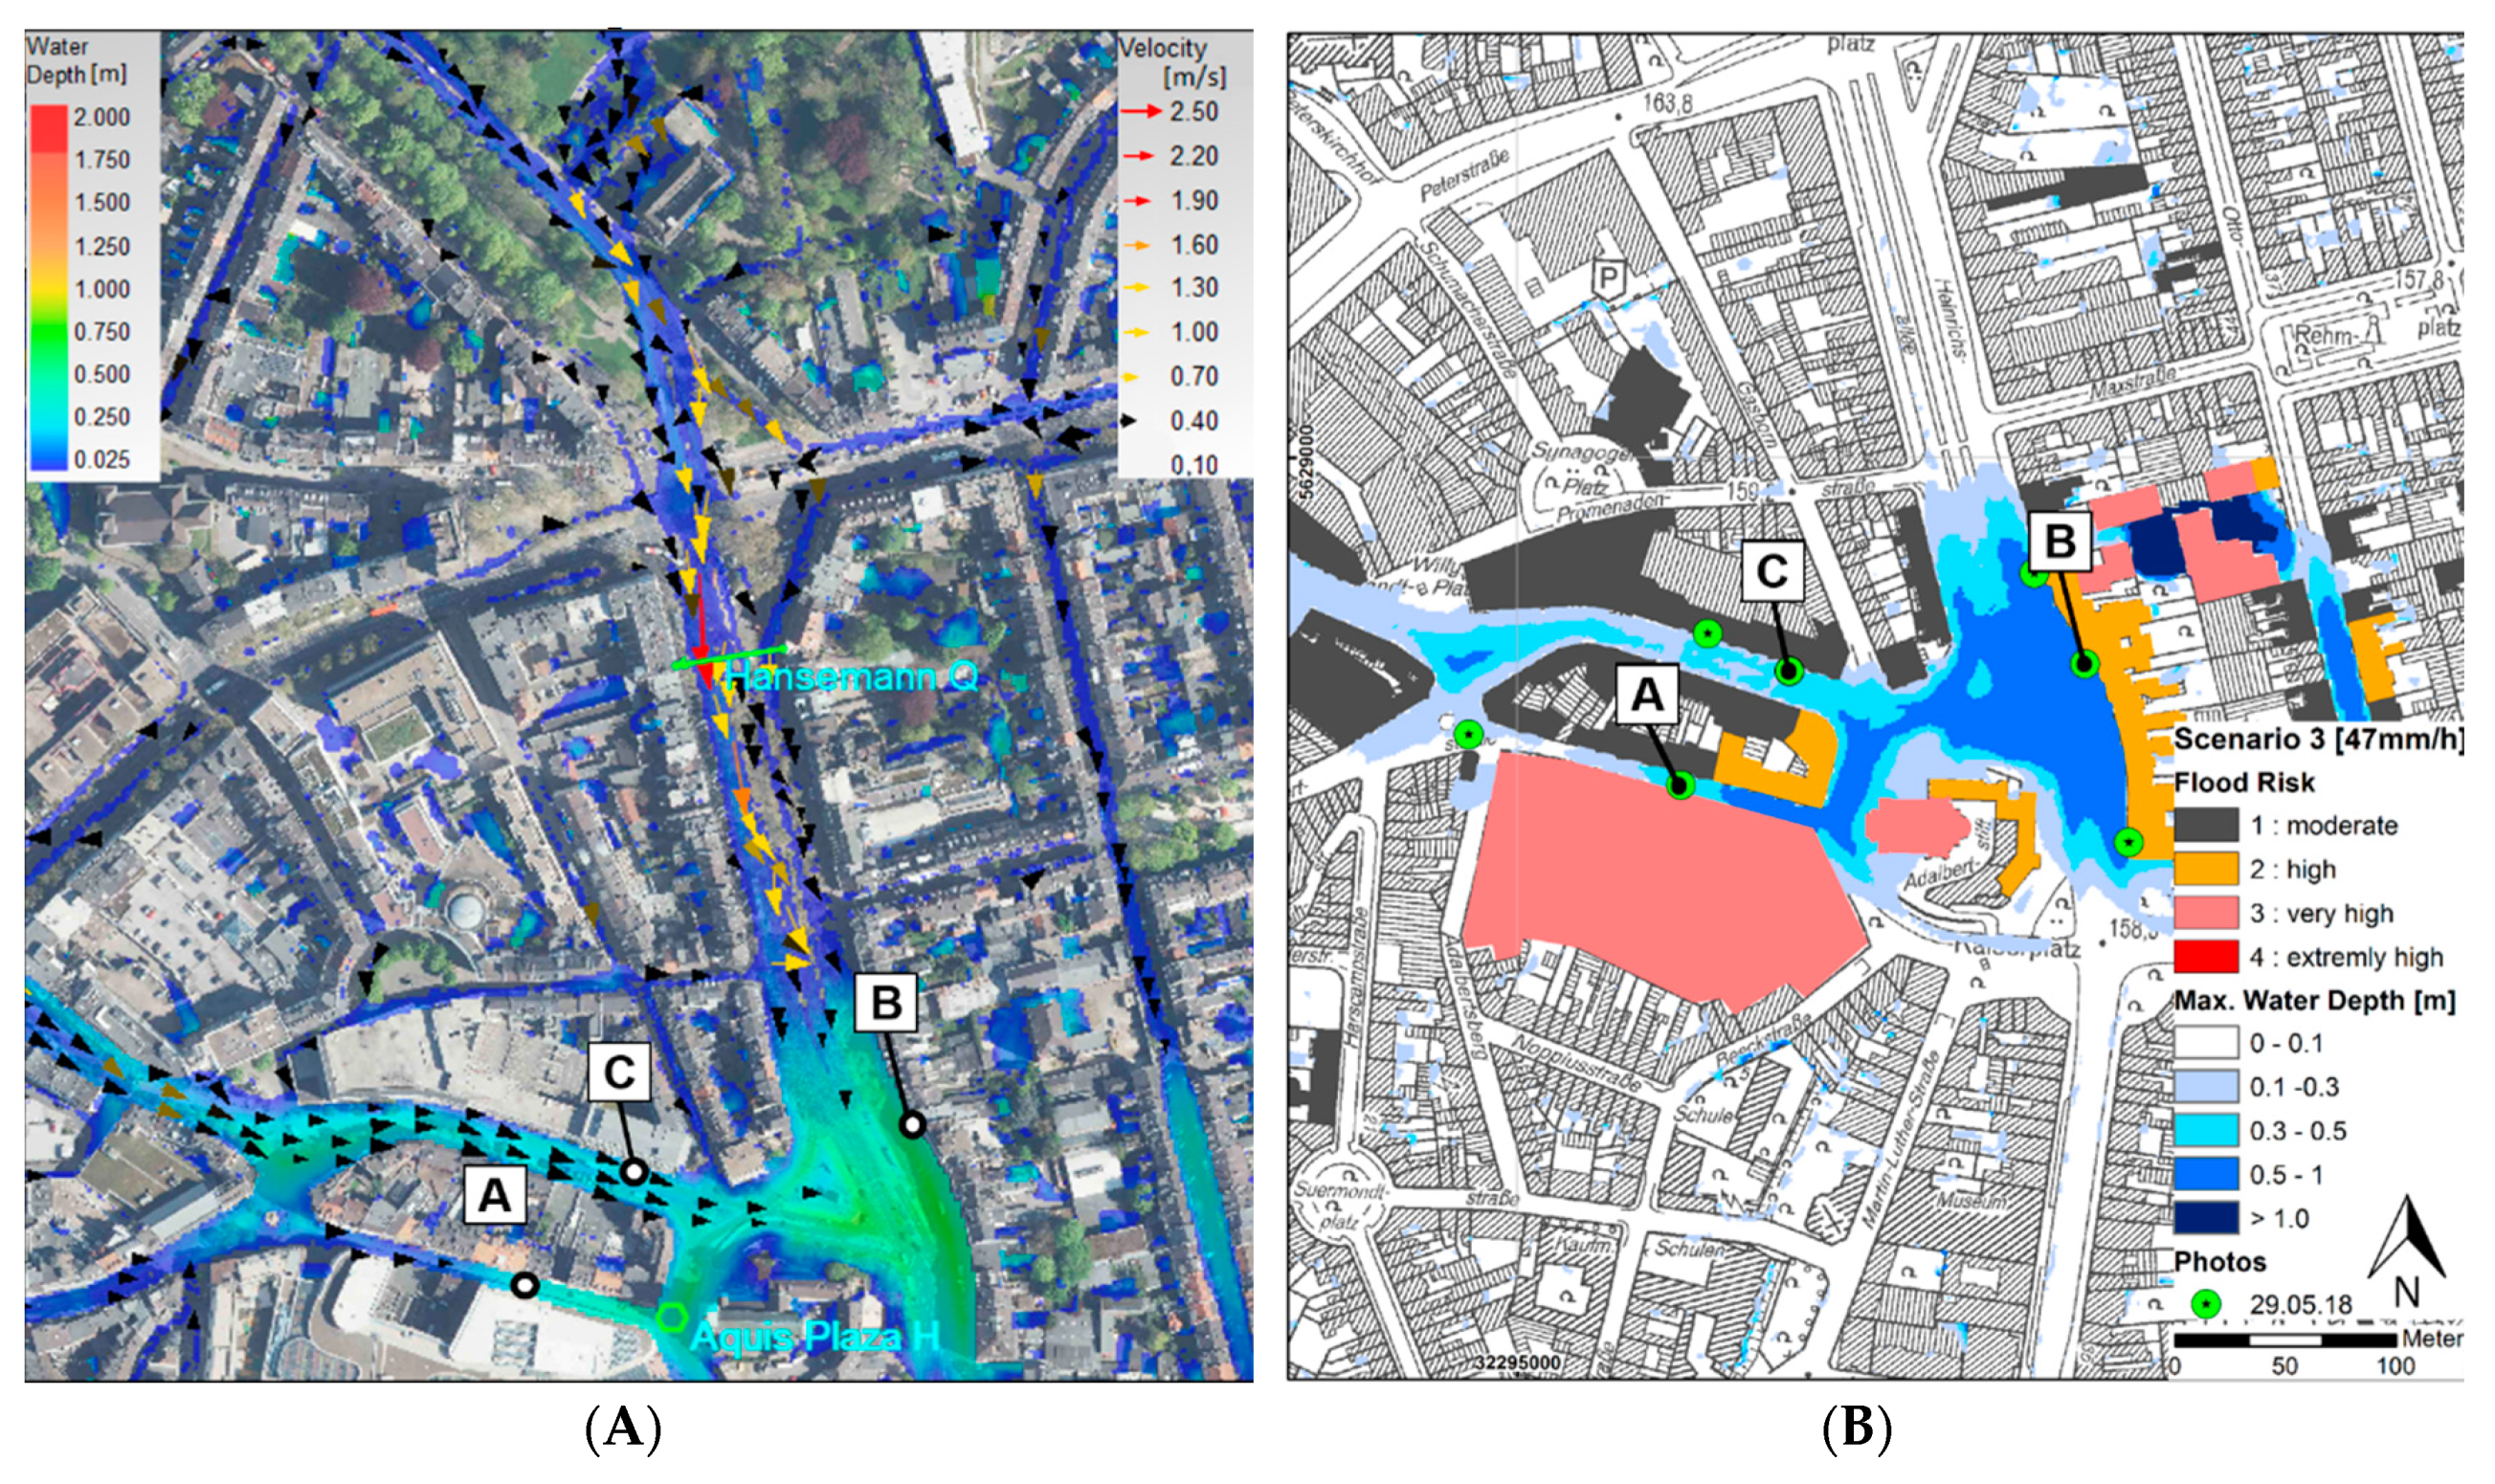
3.3. Validation based on the Event of 29 May 2018

In the afternoon of 29 May 2018, a storm event caused severe urban floods in many cities in the German state of NRW including the city of Aachen. The convective heavy rainfall cell with high intensity and short duration resulted in rapid flooding (within 30 min) of the central areas. According to the local media, the emergency services received over 400 calls for assistance during the pluvial flood event [52]. The results were partially extensive flooding in the Aachen city area with water depths around 40 cm up to 70 cm, as for example at the Kaiserplatz Adalbertstraße and Stiftsstraße. Pedestrians stood knee-deep in the water, and the lower car park level of the shopping center was up to 1.5 m under water [52].
According to the radar-observations, the storm reached Aachen at about 2:25 p.m. and lasted less than one hour. From 2:50 p.m. to 3:00 p.m., the heavy rain cell was over the city center. HydroMaster reported a one-hour precipitation amount between 40 mm and 50 mm in the city center of Aachen (Figure 5A) [53]. Just a few kilometers northwest, the gauge station Aachen Orsbach (marked with a red circle in Figure 5A) measured 16.9 mm in that hour. This demonstrates the small-scale effect of heavy rainfall events.
With the help of weather radar observations and forecasts from nowcasting systems, the development and progress of the heavy rain cell was monitored. This enabled a sufficient reaction time to record the rainfall-induced flooding in the previously determined and predicted hotspots. Subsequently, the georeferenced photos and videos were imported into the GIS-model for validation purposes. The targeted labelling of the images in space and time provided a systematic documentation basis of the event.
Due to the good consistency between measured and pre-simulated rainfall patterns (Figure 5B), including intensity and duration, the results of scenario three (47 mm/h) could be used for a validation process. The comparison of the results of the hydrodynamic simulations (Figure 6) and the in situ documented floods (Figure 7) enabled the spatio-temporal validation of the model. The evaluation showed a high overall correlation between the simulated and in situ documented flooding in terms of the extent of water depth. Whereas the numerical flow paths displayed a good agreement, an accurate verification of velocity values was not possible due to the lack of in situ flow measurements. Here, three locations (marked A, B, C in Figure 6 and Figure 7) are evaluated in detail:
  • The model simulated the flooding process of the Adalbertstraße and the north area of the shopping Center Aquis Plaza correctly. The calculated water depth is about 30 cm to 50 cm and thus matches with the in situ recording (the persons are standing about knee-deep in the water). Several shops in the shopping center were flooded. Neither the model, nor the photograph allow the assumption of high flow velocities.
  • The extensive flooding at the Kaiserplatz was also calculated correctly with respect to extent and water depth. The simulated depth showed a value of 50 cm to 70 cm; the records showed cars with their hub caps were under water. Affected buildings were identified concurrently (Figure 6B).
  • In addition, the recorded flow and flooding processes at the Stiftsstraße demonstrated good consistency with the hydrodynamic simulations regarding the spatial extent of the flooding as well as the water depth.

3.4. Numerical Monitoring and Warning Criteria

The essential basis for the implementation of an EWS for flash floods is effective warning criteria to estimate the hazard of heavy rainfall-induced flows. In this regard, the hydraulic parameters of water depth, flow velocity and flood impulse are values to estimate the loss of stability of persons who are trying to cross the hazardous streams [54]. Furthermore, since torrential streams can wash away cars, endanger drivers and cut off rescue ways, it is of great importance to combine information about high-traffic streets with the dynamic flooding simulation results in space and time [3]. On the other hand, critical infrastructure, public places and buildings represent neuralgic points that need the fast help of rescue forces in case of flooding. Not just firefighters need to be informed before a flash flood appears, but also official transportation authorities. Regarding this background, the proposed risk-based EWS system uses two different warning criteria.
On one hand, the EWS uses the systematic and automated model evaluation of the flood risks of individual urban objects (Section 3.1). Consequently, areas and objects with a high risk can be informed as soon as possible and require the support of rescue forces. On the other hand, warnings are based on numerical monitoring units that issue a warning if a certain hydraulic limit value is exceeded. This value can be the water depth [m], velocity [m] or the impulse of the water flows. Since surface runoff can turn into torrential streams with high velocities and can wash away pedestrians and damage constructions, the simulation and monitoring of impulse forces is of great relevance [55,56]. Investigations have shown that the damage characteristics are oriented towards certain almost constant values of this parameter [56]. Therefore, Table 4 shows impulse values as warning criteria for the hazard level of flash floods.
Using scenario three as an example, the surface flow-related flood impulse values were calculated for the hotspot area around the Kaiserplatz. Based on a color scale, Figure 8 highlights those areas and streets where higher flood impulse values arise in relation to high velocities and high-water levels. Based on warning information, emergency services could receive a comprehensive early warning as well as a high-resolution status report with a uniform classification. This contains the severity of the flash flood, the extent of the flooding as well as affected critical infrastructure, non-passable rescue routes etc. The provision of this information could be provided digitally and visualized in temporal sequence on corresponding devices and on standardized maps.
With regard to the conceptual process scheme of the Scenario-Interpolation method, the steps and results described up to this point correspond to the steps 1 to 4 until now without the application of machine-learning techniques. The precise use and final results of the steps 4 to 7 are still under examination.

4. Discussion

Regarding the physical characteristics of heavy rainfall events, pluvial flash floods can occur almost anywhere, anytime and require short reaction times. For this reason, an EWS has to be effective, applicable over a large area, and the alerts must be issued in a timely manner, clearly and understandably. The designed framework for a risk-based EWS provides, in this context, reasonable results by demonstrating the effectiveness of the fundamental risk analysis module within the case study.
Based on the open geodata NRW, the implementation of the coupled-model system proved to be very fast and consistent. The uniformly georeferenced and homogenous datasets allow a user-friendly performance, and thus a good interactive handling of the hydro-numeric and GIS-models. However, since the LIDAR-derived DTM does not represent underpasses, tunnels etc., those areas need a critical examination and adjustment according to available structure information. Therefore, an investigation and pre-processing of the DTM is of major importance, as those areas represent particular flood-prone hotspots. Another consideration is the import of building data into the hydro-numeric model. On one hand, skywalks, or rather footbridges, are causing numerical flow barriers which don’t represent the true flow paths and therefore need to be subjected to a correction in the hydro-numeric model. On the other hand, the analysis of the hydrodynamic results shows that the non-ingress of water into buildings leads to a slight overestimation of the flood depth in a few streets.
The results of model validation indicated a good correlation between modeled and actual documented flooding concerning extent and water depth. However, with respect to the topographic and urban characteristics of the study site, the numerical flow velocities also appear realistic, but could not be validated due to the absence of flow measurements. Whereas photographs can be used with information about creation time and space for the validation of the flood depths, the adequate evaluation of the flow velocities requires precise velocity measurements. Classical flow measurement techniques like current meter or particle image velocimetry (PIV) are necessary at this point.
In this project, the hydro-numeric model calculated only 2D surface flow, and consequently took the sewage-capacity into account in a simplified way by percentage reduction of the rainfall. This simulation neglects the effect of the sewage system, which can consequently lead to an underestimation or overestimation of the flood risk. Especially, with regard to urban areas with steep terrain, this limitation results often in a shift of the flood risk in low lying areas due to the overflow of the sewage system [58]. According to the observations and analysis of the case study results, only two narrow and low-lying streets were flooded primarily by the overflow of the sewer system. In total, the comparison between simulated and in situ recorded floods demonstrated a good applicability of the 2D-model. Those results are mainly attributed to the topographic characteristics of the study site. However, talking in a global view, 2D-limitations for urban flood risk assessments must be critically examined according to the local urban knowledge and past flood events. By extending the 2D model with a 1D-flow module, the interaction between surface runoff, sewer network and watercourses can be considered. A coupled 1D/2D model thus enables more reliable results but also requires a significantly higher workload and calculation effort. The question of application depends on the location and the local urban structure. Subsequent investigations, based on the Aachen case study, should examine the possibilities, limits and computing requirements of a coupled 1D/2D model.
The flood risk estimation was carried out following the approaches of the two German guidelines, from the DWA [46] and LUBW [50]. Due to the hydrological formation and hazard occurrence, the risk estimation process for pluvial flash floods requires a different approach than a standard process for river floods. In contrast to the standard process (e.g., Expected annual flood damage computation (EAD) from the US Army Corps of Engineers [59]) an over-flow frequency matrix for single rivers, or rather streams, may not be applied for pluvial flash floods. A heavy rainfall-induced flood cannot be associated with a certain discharge-return period (annuality) of one stream—a standard flow-frequency relationship is, therefore, not applicable. Rather, it consists of a complex interaction of different flooding-characteristics, e.g., surface flow, structural failure of the drainage system, overtopping of flow in watercourse, etc. In comparison to a standard derived damage-frequency matrix, this approach uses different graded risk evaluation matrices (flooding depth-damage relationship) for combined heavy rainfall-induced flash floods according to a certain probability of rainfall occurrence. In practice it means that, for example, a heavy rainfall event with a return period of 30 years has de facto a different graduation (risk classification) than an event with a return period of 100 years.
The automatized SQL-based risk analysis rests upon on a risk matrix which itself follows the approach of the DWA [46] with the aim to guarantee a uniform risk classification and communication in Germany. It is based on the parameters, water depths and damage potential of infrastructure, as well as on the independence of the probability of occurrence of a heavy rainfall event. However, this method does not take the flow velocity or rather the flood impulse into account. Due to the fact that the hydrodynamic effect of flowing water is of crucial importance for risk evaluation, the modification of the method is proposed. The proposal provides the implementation of a risk matrix including the flood impulse as an additional parameter to assess the combined risk due to water level and velocity. Based on the classification presented in Table 4 or similar studies to the hazard level of pluvial flash floods for pedestrians, e.g., Martinez-Gomariz et al. [54]. However, the validation of simulated flow velocities represents the necessary criterion, and needs to be carried out first to ensure a consequent risk evaluation. Apart from that, the flood impulse values calculated in this case study were below the critical thresholds.
The fusion of the three essential modules for documentation, risk analysis and early warning in one integrated system allows for the differentiated analysis of past, potential and forecasted pluvial events—a unique tool for operational flash flood management. It not only provides the user all necessary operations in just one instrument, but it also allows for the holistic assessment of the complex event chain—rainfall pattern, resulting surface flow, development of risk. By providing detailed, dynamic, spatial and temporal information about past and potential events, this instrument allows the targeted planning and verification of measures to reduce pluvial flash flood risks.
The architecture and model basis allow for an area-wide deployment of the instrument in Germany. Furthermore, it does one up for the nation-wide comparison of pluvial flood events and the interdisciplinary cooperation for risk management. A similar conceptual framework for a near real-time, high-spatial resolution flood forecasting model is described by Maidment in the national flood interoperability experiment (NFIE) [60]. Consisting of five components (Geo, Hydro, Response, River and Services), the NFIE-model uses weather prediction data to forecast the discharge and water elevation of 2.7 million stream reaches at a continental scale (United States). In contrast to the MPFIS, the NFIE focuses, however, on a much larger scale, using hourly-updated weather forecast data and an elevation model of 10 m for flood inundation mapping over the flood plain. Therefore, the NFIE-model is of limited use for small-scale urban flash floods where the main storm event may last less than one hour and away from rivers. Another main difference is that the proposed MPFIS uses high resolution now-cast rainfall data (spatial resolution of 1 km and temporal update rate of 5–15 min) to compute the directly the resulting 2D free surface flows and flooding in the urban areas.
Basic requirements for the application of the proposed MPFIS are geodata with a high and homogenous quality. With focus on the digital elevation model, a high resolution is mandatory, which is not always available. Since the highest horizontal resolution of free global digital elevation model is 90 m, for example, that provided by the German aerospace center (DLR) [61], an object-level flood risk estimation would not be possible for any urban area worldwide. For that reason, the presented system is only applicable in LIDAR-surveyed urban areas at this time, providing a horizontal resolution of one to five meters. However, for scientific purpose, the DLR already offers full resolution data with a horizontal sampling distance of 12 m [61]. Further research should therefore investigate the possibilities of applications of those global datasets for pluvial flood risk analysis.
Using automatic procedures to store image and video recordings with time and place stamps in one combined GIS-model has many advantages for documentation and model validation, but also requires correct georeferenced data. Providing an open information platform, the use of crowd sourcing methods (collect data from citizens) would allow the comprehensive citywide recording of flooding for validation purposes, and opens, simultaneously, new ways of strengthening risk awareness. The use of citizen science takes on an increasingly important role for flood modelling and risk assessment [62,63].
The two presented approaches presented for a risk-based early warning system are fundamentally different. While the scenario interpolation approach is possible without a great deal of fast computing, the real-time simulation method is, IT-technically, much more complex and requires special processing methods and high computing capacities to ensure short computing times. However, to guarantee short computing times and stable simulation conditions, large urban areas need to be subdivided into computable parts. Another important aspect is the financial cost of the development and installation of such a model system. Therefore, the set-up of such a system is a challenging question for developing countries. In comparison however, the real-time simulation method provides much more detailed information with regards to space and time resolution.
The effectiveness of the real-time simulation-based EWS is primarily linked to computing speed in order to guarantee a sufficient lead-time. On one hand, the case study results show that the model is applicable to process the large amount of high-quality data, as well as the evaluation of high-resolution flood simulations. On the other hand, the results of the runtime comparison indicate that a standard computer, as was used in this study, is obviously not applicable for such fast processing tasks. Although the GPU-based computation could already show a speedup factor of more than 10 times compared to the CPU, the runtime (236 min) is still far too high for live-simulation applications. However, results of a TUFLOW benchmark test [40] show the very high potential of multiple GPUs for large model processing with more than 1 million cells. The results of the GPU testing indicated a speedup factor of more than 100 times compared to CPU processing. Furthermore, multiple GPU (4× NVIDIA GeForce GTX 680 GPU) could calculate a model of 727,865 cells within 3.6 min. The runtime for a model with 4 million cells would be, therefore, roughly estimated, in the range of 25 to 35 min. Considering the subsequent warning process, the subdivision of large models into smaller computable parts with about two millions cells seem to be a promising approach.
Since the spatial and temporal scales of heavy rainfall induced-flash floods are far more detailed compared to other flood types, the forecasting process of pluvial floods is facing several difficulties [64]. The localization of rainfall cells, the precipitation intensity and their timeframe must be very precise [65]. Therefore, the accuracy level of weather forecasting systems has to be very high and represents one of the greatest challenges in the forecasting chain [31]. In addition, pluvial flood events occur mostly in small catchments and urban structures without discharge measurements. For this reason, further research is required on the accuracy of short-term forecasts of heavy rainfall events, as well as hydrodynamic numeric models for determining the pluvial flash flood processes. In addition, new approaches for validation methods for urban flood models have to be found and discussed.

Author Contributions

Conceptualization, J.H.; Methodology, J.H.; Modelling, J.H.; Formal Analysis, J.H.; Resources, J.H. and H.S.; Data Curation, J.H.; Writing—Original Draft, J.H.; Writing—Review and Editing, J.H. and H.S.; Visualization, J.H.; Supervision, H.S.

Funding

This research received no external funding

Acknowledgments

We would like to thank the company KISTERS AG for providing the live webservice HydroMaster and the company Innovyze for providing software XPSWMM.

Conflicts of Interest

The authors declare no conflict of interest.

References

  1. Gaume, E.; Bain, V.; Bernardara, P.; Newinger, O.; Barbuc, M.; Bateman, A.; Blaškovičová, L.; Blöschl, G.; Borga, M.; Dumitrescu, A.; et al. A compilation of data on European flash floods. J. Hydrol. 2009, 367, 70–78. [Google Scholar] [CrossRef] [Green Version]
  2. Hill, C.; Verjee, F.; Barrett, C. Flash Flood Early Warning System Reference Guide; University Corporation for Atmospheric: Boulder, CO, USA, 2010. [Google Scholar]
  3. Yin, J.; Yu, D.; Yin, Z.; Liu, M.; He, Q. Evaluating the impact and risk of pluvial flash flood on intra-urban road network: A case study in the city center of Shanghai, China. J. Hydrol. 2016, 537, 138–145. [Google Scholar] [CrossRef] [Green Version]
  4. Acosta-Coll, M.; Ballester-Merelo, F.; Martinez-Peiró, M.; de La Hoz-Franco, E. Real-Time Early Warning System Design for Pluvial Flash Floods-A Review. Sensors 2018, 18, 2255. [Google Scholar] [CrossRef] [PubMed]
  5. Borga, M.; Stoffel, M.; Marchi, L.; Marra, F.; Jakob, M. Hydrogeomorphic response to extreme rainfall in headwater systems: Flash floods and debris flows. J. Hydrol. 2014, 518, 194–205. [Google Scholar] [CrossRef]
  6. Creutin, J.D.; Borga, M.; Gruntfest, E.; Lutoff, C.; Zoccatelli, D.; Ruin, I. A space and time framework for analyzing human anticipation of flash floods. J. Hydrol. 2013, 482, 14–24. [Google Scholar] [CrossRef]
  7. World Meteorological Organization (WMO). Manual on Flood Forecasting and Warning; WMO-No. 1072; World Meteorological Organization: Geneva, Switzerland, 2011. [Google Scholar]
  8. Carpenter, T.M.; Sperfslage, J.A.; Sweeney, T.; Fread, D.L. National threshold runoff estimation utilizing GIS in support of operational flash flood warning systems. J. Hydrol. 1999, 224, 21–44. [Google Scholar] [CrossRef]
  9. European Commission and Water Group Floods (WGF). Pluvial Flooding: An EU Overview; Water Group Floods, European Commission: Brussels, Belgium, 2016.
  10. Davies, R. Updated: Horn of Africa—Major Flooding after Cyclone Sagar Leaves 16 Dead. Available online: http://floodlist.com/africa/cyclone-sagar-somalia-yemen-djibouti-may-2018 (accessed on 11 November 2018).
  11. Quadir, S.; Hussain, Z. Floods Kill Dozens, Displace More Than a Million in India, Bangladesh. Available online: https://www.reuters.com/article/us-south-asia-floods/floods-kill-dozens-displace-more-than-a-million-in-india-bangladesh-idUSKBN1JF1F5 (accessed on 13 November 2018).
  12. The Watchers. 4 Months’ Worth of Rain in 6 Hours Floods Southern France, Death Toll in Europe Rises to 31. Available online: https://watchers.news/2018/10/14/flood-europe-october-2018/ (accessed on 12 November 2018).
  13. The Watchers. Extreme Rainfall Events Wreak Havoc across the Middle East. Available online: https://watchers.news/2018/11/13/middle-east-floods-october-november-2018/ (accessed on 12 November 2018).
  14. Humanitarian Aid Commission—OCHA. Over 200,000 People across the Country Affected by Heavy Rains and Flash Floods. 8 October–4 November 2018. Available online: https://reliefweb.int/sites/reliefweb.int/files/resources/OCHA_Sudan_Humanitarian_Bulletin_Issue_18_%288_October_-_4_November_2018%29.pdf (accessed on 14 November 2018).
  15. Floodlist. USA—Deadly Flash Floods in Kentucky and Missouri. Available online: http://floodlist.com/america/usa/floods-storm-gordon-kentucky-missouri-september-2018 (accessed on 14 November 2018).
  16. GDV (Gesamtverband der Deutschen Versicherungswirtschaft e.V.). Naturgefahrenreport 2017—Die Schaden-Chronik der Deutschen Versicherer in Zahlen, Stimmen und Ereignissen; GDV: Berlin, Germany, 2017. [Google Scholar]
  17. IPCC. Working Group I, Contribution to the IPCC Fifth Assessment Report (AR5), Climate Change 2013. The Physical Science Basis; Cambridge University Press: Cambridge, UK, 2013. [Google Scholar]
  18. Bloeschl, G.; Montanari, A. Climate change impacts—Throwing the dice? Hydrol. Process. 2009, 111, 374–376. [Google Scholar] [CrossRef]
  19. Singh, P.; Sinha, V.S.P.; Vijhani, A.; Pahuja, N. Vulnerability assessment of urban road network from urban flood. Int. J. Disaster Risk Reduct. 2018, 28, 237–250. [Google Scholar] [CrossRef]
  20. Jha, A.K.; Bloch, R.; Lamond, J. Cities and Flooding; The World Bank: Wahington, DC, USA, 2012; ISBN 978-0-8213-8866-2. [Google Scholar]
  21. Fischer, B. Die wassersensible Stadt als eine Antwort auf die Folgen des Klimawandels. Korresp. Wasserwirtsch. 2018, 11, 473–479. [Google Scholar] [CrossRef]
  22. Špitalar, M.; Gourley, J.J.; Lutoff, C.; Kirstetter, P.-E.; Brilly, M.; Carr, N. Analysis of flash flood parameters and human impacts in the US from 2006 to 2012. J. Hydrol. 2014, 519, 863–870. [Google Scholar] [CrossRef]
  23. Witt, M. Vorhersage und Warnungen vor Starkregen durch den Deutschen Wetterdienst—Beitrag zum wasserwirtschaftlichen Informationstag; Deutscher Wetterdienst: Offenbach am Main, Germany, 2015.
  24. DWD. Der Deutsche Wetterdienst—Warnkriterien. Available online: https://www.dwd.de/DE/wetter/warnungen_aktuell/kriterien/warnkriterien.html (accessed on 30 January 2018).
  25. DWD (Der Deutsche Wetterdienst). FeWIS—das Katastrophenschutzportal; Deutscher Wetterdienst: Offenbach am Main, Germany, 2017.
  26. Castro, D.; Frerichs, S.; Hatzfeld, F.; Mittelstädt, R.; Seltmann, J.; Einfalt, T.; Friedeheim, K.; Kubik, A.; Müller, M.; Wagner, A. Vorhersage und Management von Sturzfluten in urbanen Gebieten (URBAS). Förderprogramm des BMBF. Risikomanagement Extremer Hochwasser (RIMAX); Bundesministerium für Bildung und Forschung: Aachen, Germany, 2008.
  27. Cama-Pinto, A.; Piñeres-Espitia, G.; Zamora-Musa, R.; Acosta-Coll, M.; Caicedo-Ortiz, J.; Sepúlveda-Ojeda, J. Design of a wireless sensor network for monitoring of flash floods in the city of Barranquilla, Colombia. Rev. Chil. Ingeniare 2016, 24, 581–599. [Google Scholar] [CrossRef]
  28. Chang, N.; Guo, D.-H. (Eds.) Urban Flash Flood Monitoring, Mapping and Forecasting via a Tailored Sensor Network System. In Proceedings of the 2006 IEEE International Conference on Networking, Sensing and Control, Ft. Lauderdale, FL, USA, 23–25 April 2006; pp. 757–761, ISBN 1-4244-0065-1. [Google Scholar]
  29. Stadt Bonn. Stadt Bonn—Hochwasserschutz. Available online: http://www.bonn.de/umwelt_gesundheit_planen_bauen_wohnen/hochwasser/hochwasserschutz/index.html?lang=de (accessed on 25 February 2018).
  30. Javelle, P.; Organde, D.; Demargne, J.; Saint-Martin, C.; de Saint-Aubin, C.; Garandeau, L.; Janet, B.; Lang, M.; Klijn, F.; Samuels, P. Setting up a French national flash flood warning system for ungauged catchments based on the AIGA method. E3s Web Conf. 2016, 7, 18010. [Google Scholar] [CrossRef] [Green Version]
  31. Braud, I.; Vincendon, B.; Anquetin, S.; Ducrocq, V.; Creutin, J.-D. The Challenges of Flash Flood Forecasting. In Mobilities Facing Hydrometeorological Extreme Events 1; Elsevier: Amsterdam, The Netherlands, 2018; pp. 63–88. ISBN 9781785482892. [Google Scholar]
  32. Elgendy, N.; Elragal, A. Big Data Analytics: A Literature Review Paper. In Advances in Data Mining. Applications and Theoretical Aspects; Hutchison, D., Kanade, T., Kittler, J., Kleinberg, J.M., Kobsa, A., Mattern, F., Mitchell, J.C., Naor, M., Nierstrasz, O., Pandu Rangan, C., et al., Eds.; Springer International Publishing: Cham, Switzerland, 2014; pp. 214–227. ISBN 978-3-319-08975-1. [Google Scholar]
  33. Yang, C.; Xu, Y.; Nebert, D. Redefining the possibility of digital Earth and geosciences with spatial cloud computing. Int. J. Digit. Earth 2012, 6, 297–312. [Google Scholar] [CrossRef]
  34. Urban Drainage and Flood Control District (UDFCD). Urban Storm Drainage Criteria Manual. Volume 1 Management, Hydrology, and Hydraulics; Urban Drainage and Flood Control District (UDFCD): Denver, CO, USA, 1969. [Google Scholar]
  35. Hofmann, J. Hochwasserrisiken durch Starkniederschlagsereignisse in Aachen: April 2018. Master’s Thesis, RWTH Aachen University, Aachen, Germany, 2018. [Google Scholar]
  36. KOSTRA-DWD; DWD—Der deutsche Wetterdiesnt, Abteilung Hyrometeorologie. Bericht zur Revision von KOSTRA-DWD-2010; Deutscher Wetterdienst: Offenbach am Main, Germany, 2017.
  37. Innovyze. xpswmm—Complete Stormwater, Sewer and Floodplain Model. Available online: http://www.innovyze.com/products/xpswmm/ (accessed on 22 September 2018).
  38. XP Solutions. xp2D Reference Manual; XP Solutions: Wallingford, UK, 2016. [Google Scholar]
  39. Syme, B. TUFLOW—An Introduction; BMT WBM: Brisbane, Australia, 2010. [Google Scholar]
  40. BMT. TUFLOW Wiki. Available online: https://wiki.tuflow.com/index.php?title=Hardware_Benchmarking (accessed on 24 February 2019).
  41. Boyte, C. The Application of Direct Rainfall Models as Hydrologic Models Incorporating Hydraulic Resistance at Shallow Depths; BMT WBM: Brisbane, Australia, 2014. [Google Scholar]
  42. Bez.-Reg Köln; Geobasis Bezirksregierung Köln. Open Data—Digitale Geobasisdaten NRW. 2018. Available online: https://www.opengeodata.nrw.de/produkte/ (accessed on 15 January 2018).
  43. EPA. Storm Water Management Model; EPA Agency—United States Environmental Protection: Washington, DC, USA, 2016.
  44. Stocker, M.; Schwaller, G. Tutorial zur HYDRO_AS-2D/SMS—Grundschulung; Bayerisches Landesamt für Wasserwirtschaft: München, Germany, 2003.
  45. LWI. Untersuchung Starkregengefährdeter Gebiete; LWI—Leichtweiß-Institut, Technische Universität Braunschweig: Braunschweig, Germany, 2009. [Google Scholar]
  46. DWA. Risikomangement in der Kommunalen Überflutungsvorsorge für Entwässerungssysteme bei Starkregen; Deutsche Vereinigung für Wasserwirtschaft, Abwasser und Abfall e.V.: Hennef, Germany, 2016. [Google Scholar]
  47. Schmitt, T.G.; Krüger, M.; Pfister, A.; Becker, B.; Mudersbach, C.; Fuchs, L.; Hoppe, H.; Lakes, I. Einheitliches Konzept zur Bewertung von Starkregenereignissen Mittels Starkregenindex; GFA: Gullane, UK, 2018. [Google Scholar]
  48. Winterrath, T. RADVOR—Radarbasierte Niederschlagsvorhersage in Kürzestfristzeitraum; Deutscher Wetterdienst: Offenbach am Main, Germany, 2014.
  49. KISTERS AG. Water under Your Control. Available online: https://www.hydromaster.com/wp-content/uploads/180525_HydroMaster_A4_en_DHI_mail.pdf (accessed on 26 June 2018).
  50. LUBW. Leitfaden Kommunales Starkregenrisikomanagement in Baden-Württemberg; Landesanstalt für Umwelt, Messungen und Naturschutz Baden-Württemberg: Karlsruhe, Germany, 2016. [Google Scholar]
  51. URBAS. Vorhersage und Management von Sturzfluten in Urbanen Gebieten—Fallstudien und Untersuchungsschwerpunkte; Förderprogramm des BMBF; Risikomanagement extremer Hochwasserereignisse (RIMAX): Aachen, Germany, 2008. [Google Scholar]
  52. Schmetz, O.; Esser, R. Die Innenstadt versinkt in Wassermassen: Schweres Unwetter trifft Aachen mit voller Wucht: Ungezählte Keller vollgelaufen, Straßen überflutet. Feuerwehr fährt 400 Einsätze. Aachener Zeitung, 30 May 2018. [Google Scholar]
  53. KISTERS AG. Available online: https://www.hydromaster.com/de/ (accessed on 30 May 2018).
  54. Martínez-Gomariz, E.; Gómez, M.; Russo, B. Experimental study of the stability of pedestrians exposed to urban pluvial flooding. Nat. Hazards 2016, 82, 1259–1278. [Google Scholar] [CrossRef] [Green Version]
  55. Acosta-Coll, M.; Ballester-Merelo, F.; Martínez-Peiró, M. Early warning system for detection of urban pluvial flooding hazard levels in an ungauged basin. Nat. Hazards 2018, 92, 1237–1265. [Google Scholar] [CrossRef]
  56. Maijala, T.; Huokuna, M.; Honkakunnas, T. Development of Rescue Actions Based on Dam-Break Flood Analysis; Final Report; Grant Agreement No Subv 99/52623; Finnish Environment Institute: Helsinki, Finland, 2001.
  57. BWK (Bund der Ingenieure für Wasserwirtschaft, Abfallwirtschaft und Kulturbau). Mobile Hochwasserschutzwände—Grundlagen für Planung und Einsatz; BWK: Aachen, Germany, 2005. [Google Scholar]
  58. Fuchs, L.; Schmidt, N. Vergleich von 2-dimensionalen Berechnungsansätzen für die Gefährdungsanalyse in urbanen Gebieten. Österr. Wasser Abfallwirtsch. 2015, 67. [Google Scholar] [CrossRef]
  59. CEIWR-HEC. EAD—Expected Annual Flood Damage Computation. Available online: http://www.hec.usace.army.mil/publications/ComputerProgramDocumentation/CPD-30.pdf (accessed on 14 February 2018).
  60. Maidment, D.R. Conceptual Framework for the National Flood Interoperability Experiment. J. Am. Water Resour. Assoc. 2017, 53, 245–257. [Google Scholar] [CrossRef]
  61. DLR. Global 3D Elevation Model from the TanDEM-X Mission Now Freely Available. Available online: https://www.dlr.de/dlr/en/desktopdefault.aspx/tabid-10263/374_read-30139/#/gallery/32238 (accessed on 8 October 2018).
  62. Herman Assumpção, T.; Popescu, I.; Jonoski, A.; Solomatine, D.P. Citizen observations contributing to flood modelling: Opportunities and challenges. Hydrol. Earth Syst. Sci. Discuss. 2017, 1–26. [Google Scholar] [CrossRef]
  63. Buytaert, W.; Zulkafli, Z.; Grainger, S.; Acosta, L.; Alemie, T.C.; Bastiaensen, J.; de Bièvre, B.; Bhusal, J.; Clark, J.; Dewulf, A.; et al. Citizen science in hydrology and water resources: Opportunities for knowledge generation, ecosystem service management, and sustainable development. Front. Earth Sci. 2014, 2, 629. [Google Scholar] [CrossRef]
  64. Sene, K. Flash Floods—Forecasting and Warning; Springer: Dordrecht, The Netherlands, 2013. [Google Scholar]
  65. World Meteorological Organization (WMO). Flash Flood Forecasting: WMO—No. 577. Available online: https://library.wmo.int/pmb_ged/wmo_577.pdf (accessed on 14 September 2018).
Figure 1. Design and process flow of the Risk-based EWS for pluvial flash floods [35].
Geosciences 09 00127 g001
Figure 2. Architecture and key elements of the Multifunctional Pluvial Flood Information System [35].
Geosciences 09 00127 g002
Figure 3. Risk matrix used for scenario 3 (TN = 100 a) modified after DWA-M 119 [46].
Geosciences 09 00127 g003
Figure 4. Combined mapping of flood hazard and damage potential for scenario three (TN = 100a) with enlarged view of central areas in Aachen (Kaiserplatz) [35].
Geosciences 09 00127 g004
Figure 5. (A) Measured rainfall pattern (14:25–15:25) of the 29 May flood event in the city of Aachen including the case study area (black rectangle) [53]; (B) Rainfall pattern (47 mm/h) used as input for the pre-simulated scenario 3 (spatio-temporal uniformly distributed).
Geosciences 09 00127 g005
Figure 6. (A) Simulated flood depths and flow velocities (timestep: 70 min after simulation start); (B) Systematic risk map of scenario 3 inclusive photos in the city center of Aachen.
Geosciences 09 00127 g006
Figure 7. Flooding of the streets Adalbertstraße (A), Kaiserplatz (B), and Stiftsstraße (C) on 29 May 2018.
Geosciences 09 00127 g007
Figure 8. Hydrodynamic simulation of maximum flood impulse [m2/s] (product of velocity V and flow depth D) with view on the central area Kaiserplatz in the study site of Aachen.
Geosciences 09 00127 g008
Table 1. Used Datasets for the Risk Analysis.
DatasetFormatResolutionUsage
DTMXYZ1 × 1 mTopography
DOPJPG20000.1 mVisualization
DGK5GeoTIFF Visualization
DLM-ATKISVector-Roughness, Interception
BuildingsVector-Flow barrier
Soil Map (GK50)Vector-Infiltration
DWD-2010RASCII8.2 × 8.2 kmPrecipitation
Table 2. Hydrologic-Hydraulic Modeling Parameters Used [43,44,45].
Land useSealed Surface [%]Interception Storage [mm]Roughness (Manning)
Agriculture402.40.07
Forest33.70.10
Parks/Grassland52.80.05
Cemetery102.80.06
Streets/Pavements950.20.02
Residential Area681.40.08
Special Functional Area701.60.06
Industrial and Commercial Area751.00.06
Sports and Leisure Facilities601.20.04
Mixed Use502.80.07
Table 3. Exemplary damage potential classification of different land uses.
Object/Land useDamage Potential/Class
Parks, Garden plots, Green areas, etc.Low/1
Residentials without basements, Small businesses, etc.Moderate/2
Residentials with basements, Industries, etc.High/3
Hospitals, Power supply, Subway access, etc.Very High/4
Table 4. Warn criteria for potential danger from flowing water [50,57].
Hazard PotentialImpulse V × D [m2/s]
Low: Danger for children and senior citizens>0.1–0.25
Moderate: Danger to life while crossing the stream>0.25–2.0
High: Danger to life due to collapsing of structural elements and lager pieces of flotsam>2.0

