Article

Effects of Extreme Dust Storm in Agricultural Areas (Poland, the Greater Lowland)

Institute of Geography, Department of Landscape History Research, Kazimierz Wielki University, Kościeleckich Square 8, 85-033 Bydgoszcz, Poland
*
Author to whom correspondence should be addressed.
Geosciences 2019, 9(3), 106; https://doi.org/10.3390/geosciences9030106
Submission received: 14 February 2019 / Revised: 21 February 2019 / Accepted: 24 February 2019 / Published: 27 February 2019

Abstract

:
The article aims to present extreme aeolian processes observed in April 2011 in the fields of the Szamocin municipality in Pojezierze Wielkopolskie (the Great Poland Lakeland). Aeolian erosion of cropland was fostered by strong wind with gusts exceeding 15 m·s−1. The erosion was related to the movement of a deep barometric low from the Norwegian Sea over western Russia (Joachim barometric low). Geomorphological mapping of accumulated sandy aeolian covers was conducted. Morphometric measurements of aeolian covers were made considering their spatial distribution and the thickness of sediments that build them. Samples were collected from sediments to analyze grain size and the volume of deposited sediments was calculated. According to grain size analysis the accumulated fine-grained mineral material was well, moderately well and moderately sorted. The thickness of aeolian covers exceeded the thickness of covers presented in Polish literature so far. Calculations of the total volume of mineral sediment derived from small areas covered with aeolian erosion (a few hectares each) indicate significantly greater volumes than those provided in publications from other research areas in Poland. The described dust storms did not cause much damage in Poland. At the same time (8 April) in northern Germany, a dust storm led to a severe collision on the A19 highway. Eight people died in car accidents and dozens suffered serious injuries.

1. Introduction

Aeolian processes are of global significance and their effects can be observed in many places throughout the world. The term ‘sandstorm’ usually stands for desert areas such as the Sahara or places where sand is the main mineral component of soils. The term ‘dust storm’ is used when finer fractions (dusts) are transferred over long distances; they also have a negative impact on urban areas [1]. In connection with the variety of areas susceptible to aeolian erosion, analyses of climatic factors are conducted both on the northern and southern hemisphere [2]. Dusts blown away from Iceland are transported over Continental Europe. The number of dust transport incidents depends on climatic circulation, and Iceland’s geological structure and volcanic activity foster these phenomena [3,4]. The effects of dust storms have been observed in North America for many years; their indirect causes include anthropogenic activity as well as natural factors such as droughts [5]. It was also manifested in the relationships between dust storms and climate change [6]. Middle East countries (Tunisia, Iraq, Turkey, Syria) often experience dust storms [7,8]. Not only are wind and mineral particles transported away and carried by the wind during dust storms, but also microorganisms posing risk to health [7,8,9,10]. Detailed studies of dust storms are also carried out in Iran [11], and in China, where dust storms are powered by mineral material from dry areas of Central Asia [12]. The transport of dust from the Sahara to Western Europe and Scandinavia has also been described based on available meteorological data [13]. Areas with frequent occurrences of dust storms also include Ukraine, Russia, and Kazakhstan [14]. The strongest deflation in these countries is mainly visible in steppe areas. These processes are known as ‘black storms’ [15]. In Germany, dust storms associated with the Joachim barometric low caused a catastrophe in land-bound traffic. There was a collision on the A19 highway and several dozen people were injured [16,17]. So far, relatively few papers have discussed extreme aeolian processes in Central and Eastern Europe, including Poland [15,18,19].
Across the world, dust storms are proven to have a negative impact mainly in areas used for agriculture. Sand and dust storms reduce crop yields, bury cuttings and cause the loss of plant tissue [20]. Extreme aeolian processes also reduce photosynthesis, delay plant development, and bury drainage ditches, which in turn causes a reduced supply of water and deteriorate the quality of water in rivers and streams. Erosion of soils by wind leads to changes in texture. It reduces their fertility and induces difficulties associated with proper fertilization. Blown over mineral and organic matter can accumulate in the neighboring fields overgrown with winter crops, which hinders the growth of plants or buries them completely. The result of this process is locally decreased fertility of eroded soils and losses of crops [18].
The impact of wind on a surface devoid of vegetation causes extraction of mineral material and its transport at different distances. Aeolian processes and research methods have been described in the world literature in terms of erosion of light sandy soils and blowing through mineral material [21,22,23] as well as in areas used for agriculture [24]. Due to the availability of meteorological data, analyses of the course of aeolian processes in the past have also been conducted [25,26]. What is more, researchers use various types of traps in areas exposed to severe wind erosion [27]. Part of the work was carried out in experimental conditions [28,29,30] or using portable laboratories in areas exploited by humans [31]. Research is also being conducted on the transport and accumulation of dust from agricultural areas, which indicates the importance of tree belts between cities and fields. These tree belts capture dust extracted from arable fields and plantations. An additional component of dust is pesticides [32]. Humidity of the top soil and its firmness [18] plays an important part in deflation.
Aeolian processes are often observed in fields in the spring and autumn period of soil cultivation; they are connected directly with the work of field machines during pre-sowing cultivation [33]. After ploughing and before the rise of vegetation, soil is also subject to stripping. Most commonly, aeolian erosion of soil occurs locally and on a small scale; however, once every few years or so aeolian processes take place on an above-average scale [18,19].
According to the classification of agricultural land susceptible to wind erosion in Poland, the Great Poland Lakeland (research area) is subject to a strong wind erosion hazard [34]. The largest number of studies from Poland concern inland dunes or areas of blown sand and describe the structure and texture as well as genesis of dunes in relation to their morphological location [35,36,37,38,39,40,41,42,43]. There are no works describing extreme aeolian processes in central Poland.
Intense aeolian processes were observed in April 2011 in Szamocin, in the Great Poland Lakeland. They were associated with a four-day period of strong and gusty winds. This research aimed to:
determine spatial distribution, thickness, and volume of accumulated aeolian sediments in agricultural fields;
determine the extent of transport of blown mineral deposit;
present geomorphological characteristics of aeolian accumulative forms.
The indicated objectives aim to present the results of extreme aeolian processes in Poland that have not been described by other researchers. Field research was carried out after the processes ceased.

2. Materials and Methods

2.1. Laboratory Methods

The weight of each collected sample was 0.2 kg. The collected samples were dried at a temperature of 105 °C for 6 h. This was followed by grain size analysis using a Retsch AS200 shaker with sieves of the 0.25 phi interval. After sieving, the sediment located on the sieves was weighed. The indices of [44] were calculated using Gradistat Beta 5.11.
In order to determine the volumetric density of sediment, the material accumulated in the aeolian covers was taken. It was poured into scaled flasks with volumes of 50, 100 and 500 cm3 and weighed. Measurement was taken three times and results were averaged. This allowed to determine that 1 cm3 of accumulated mineral material weighed 0.00149 kg. A 1 cm thick aeolian cover with a surface of 1 m2 weighed 14.90 kg.
The study used meteorological data for the Piła station (53.13 N, 16.75 E, 72 m above sea level). This station is located approximately 30 km from the research site and belongs to the station network of the Institute of Meteorology and Water Management—National Research Institute (IMWM) (https://danepubliczne.imgw.pl) [45]. An analysis of the synoptic situation was also carried out in the period of increased activity of aeolian processes in the research site.

2.2. Field Work

Four areas in the vicinity of Szamocin were chosen for detailed research: Szamocin, Szamoty 1, Szamoty 2, and Swoboda, (Figure 1). These areas contained agricultural fields, which had been ploughed at the end of March 2011. Strong and gusty wind caused erosion of the fields’ surface. Sandy aeolian covers formed on the surface of the fields, in the winter crops and in the forest (adjacent to the Szamocin field). Measurements were made after the end of the dust storm.
The reach of respective aeolian covers was marked using GPS RTK (Real Time Kinematics). Aeolian shadows formed at the surface of aeolian covers behind the obstacles. Aeolian shadows were measured with measuring tape to define the length, width and height of the shadows. The sand drift measured at the Swoboda field was measured in the same manner. Measurement tape was also used to measure the distance and height of the ripple marks that formed on the surface of the aeolian covers.
A hand drill was used to identify the volume of accumulated aeolian sediments. In each aeolian cover in the research area, 10 wells were made in a grid of squares with a side of 2 × 2 m. The distance between the drilling points was 1 m; a total of 9 wells were drilled. The tenth borehole was made at a distance of 5 m from the grid of squares. The obtained results concerning the volume of sandy aeolian covers were averaged.
During the measurements, sand samples were collected to analyze grain size. The samples were taken from sandy aeolian covers, aeolian shadows, drifts at the Svoboda field and the eroded surface of the field. A sample of the aeolian cover from the forest by the Szamocin field was not collected due to the small volume of the cover. A small spatula with a width of 0.1 m was used for sampling. Samples were taken from the surface layer of about 0.02–0.03 m. In total, 45 samples of sediments were collected from mineral storage sites (Szamocin 24 samples; Szamoty 1, 9 samples; Szamoty 2, 2 samples; Swoboda 10 samples).

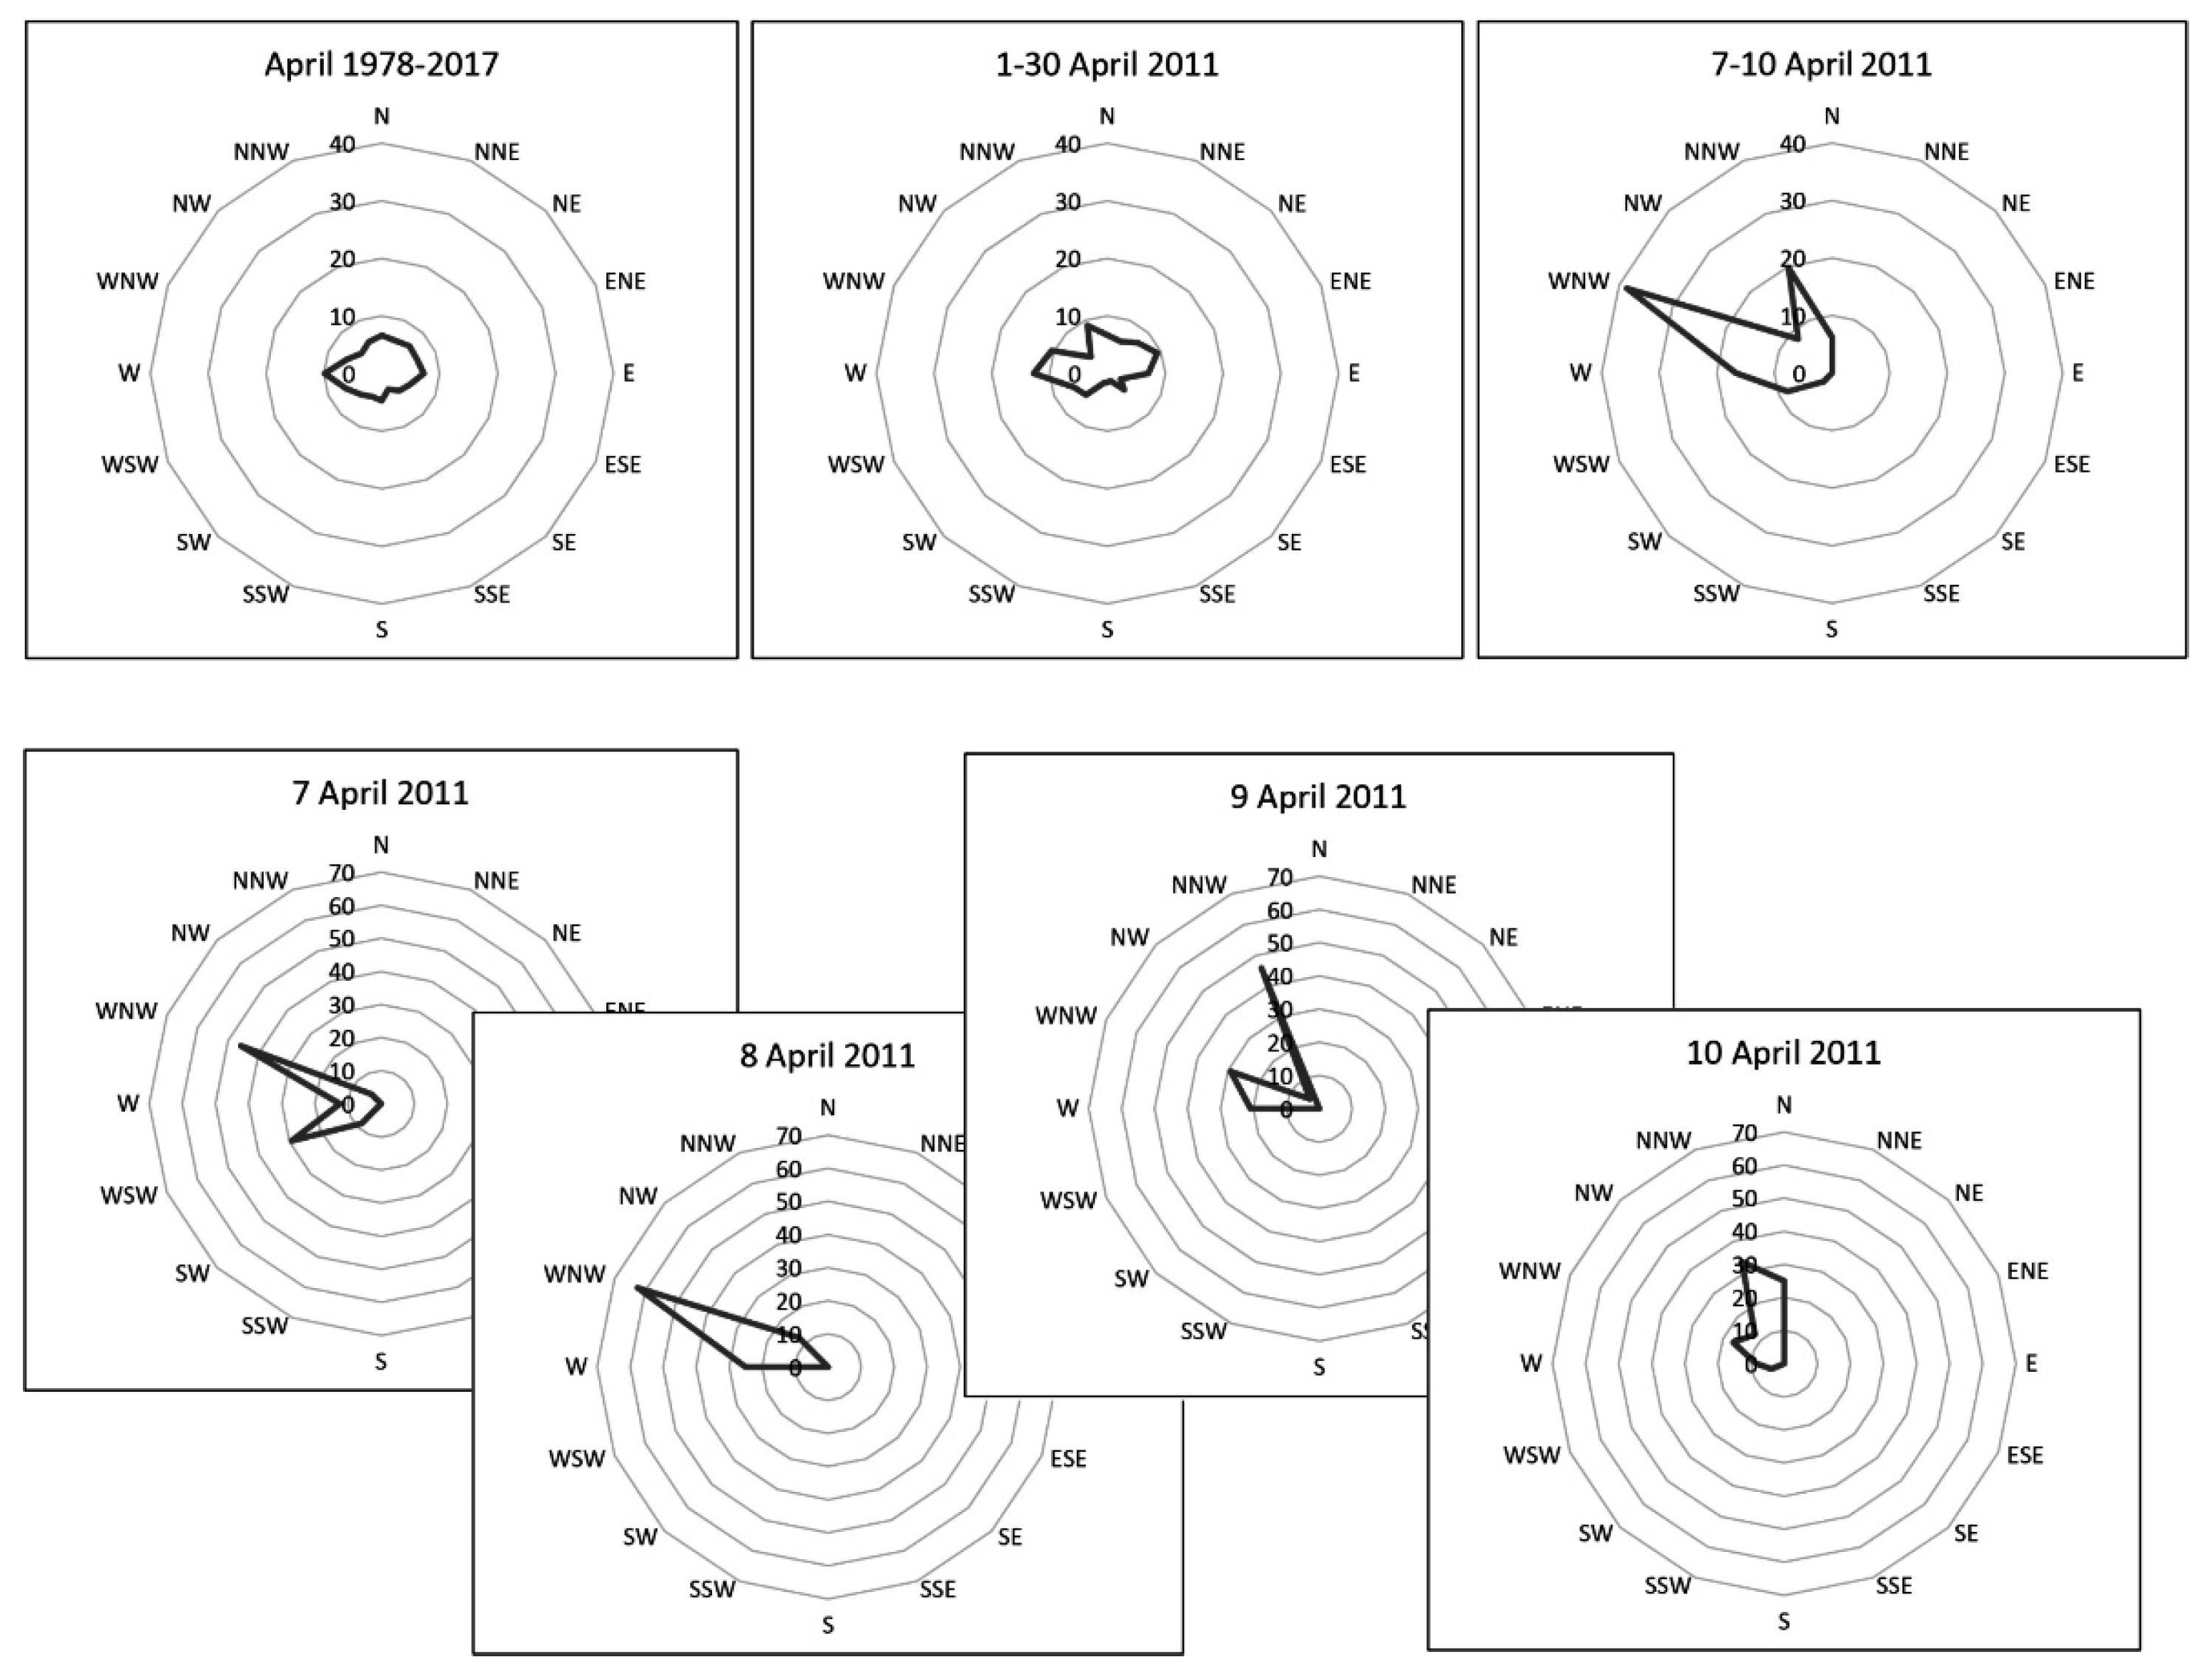
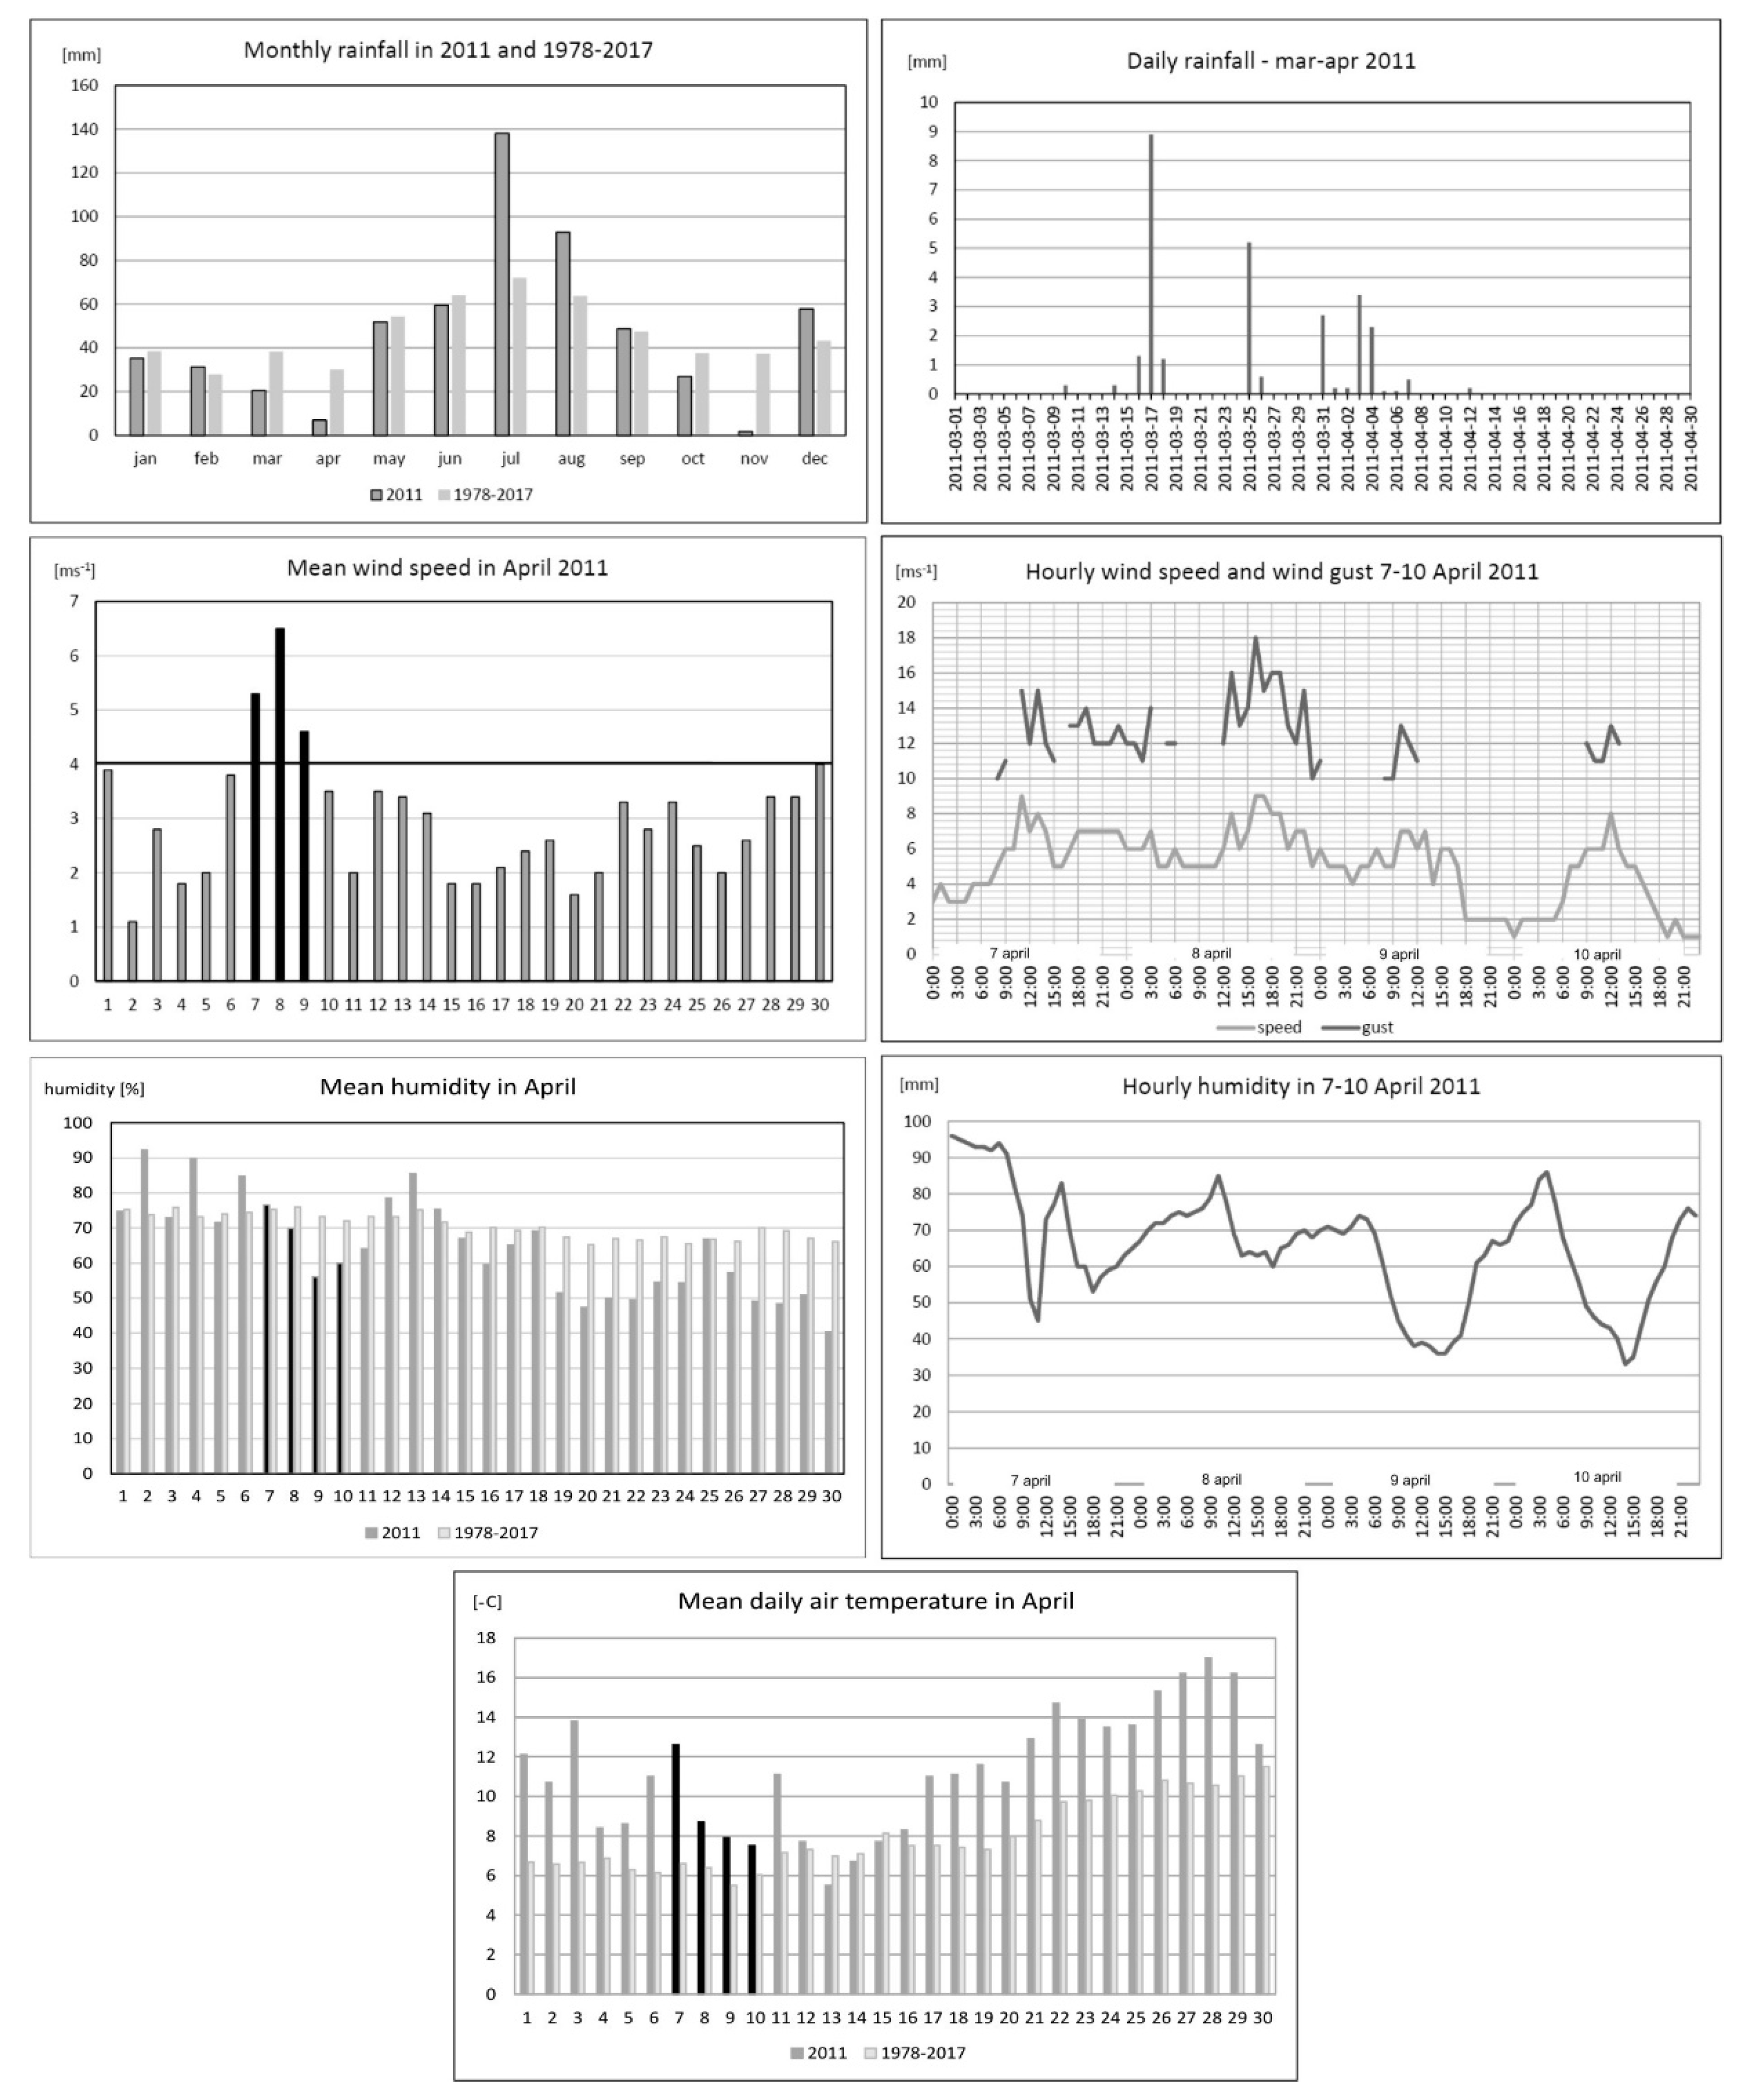
2.3. Meteorological Background

From 7 to 10 April 2011, there was an increase in wind speed in the research area. The average wind speed at the meteorological station in Piła reached 9 m∙s−1, and gusts reached up to 18 m∙s−1. For 7–10 April in the years 1978–2017, the average wind speed was 2.8–2.9 m∙s−1. Due to the location of the station in Piła as well as the direction of wind, it can be assumed that wind speeds in the open area around Szamocin were higher. High wind speeds in the discussed days were conditioned by movement of a barometric low from the Norwegian Sea to the south-east and an increase in the horizontal pressure gradient over Poland.
At the beginning of this four-day period, a large share of west-south-west and western wind was noted. On 8 April, there was a clear dominance of west-north-west wind with a significant share of north-west wind. The next day was marked by a high frequency of north-north-west wind. On 10 April, north-north-west wind dominated, with a large share of wind blowing from the north. In the discussed period, the wind direction changed from west-south-west to north (Figure 2, Table 1).
The course of aeolian processes is affected not only by the speed and by direction of wind, but also by the substrate moisture content conditioned by precipitation levels and air temperature. The first ten days of April 2011 were relatively dry and warm. Daily sums of atmospheric precipitation were small; the largest falls of 2–3 mm occurred on 3 and 4 April (Figure 3), a few days before the period of strong winds. Total precipitation for the first 10 days of April was 6.8 mm and was lower than the long-period standard (10.8 mm). Also, in March the total natural precipitation of 20.5 mm was lower than the long-period average sum of precipitation from 38.2 mm. The average daily air temperature in the first 10 days of April 2011 exceeded 10 °C and was higher than the long-period average (6.4 °C) from 1978–2017. It was particularly warm from 1 to 3 April (10.7–13.8 °C), and on 6 and 7 April (11 and 12.6 °C). During this period, the weather in Poland was shaped by advances of warm polar sea air. It significantly cooled after 8 April, when the baric situation conditioned the flow of cold Arctic air from the north to Poland. There was a simultaneous drop in air humidity. From the above review it follows that meteorological conditions favored the occurrence of intense aeolian processes.

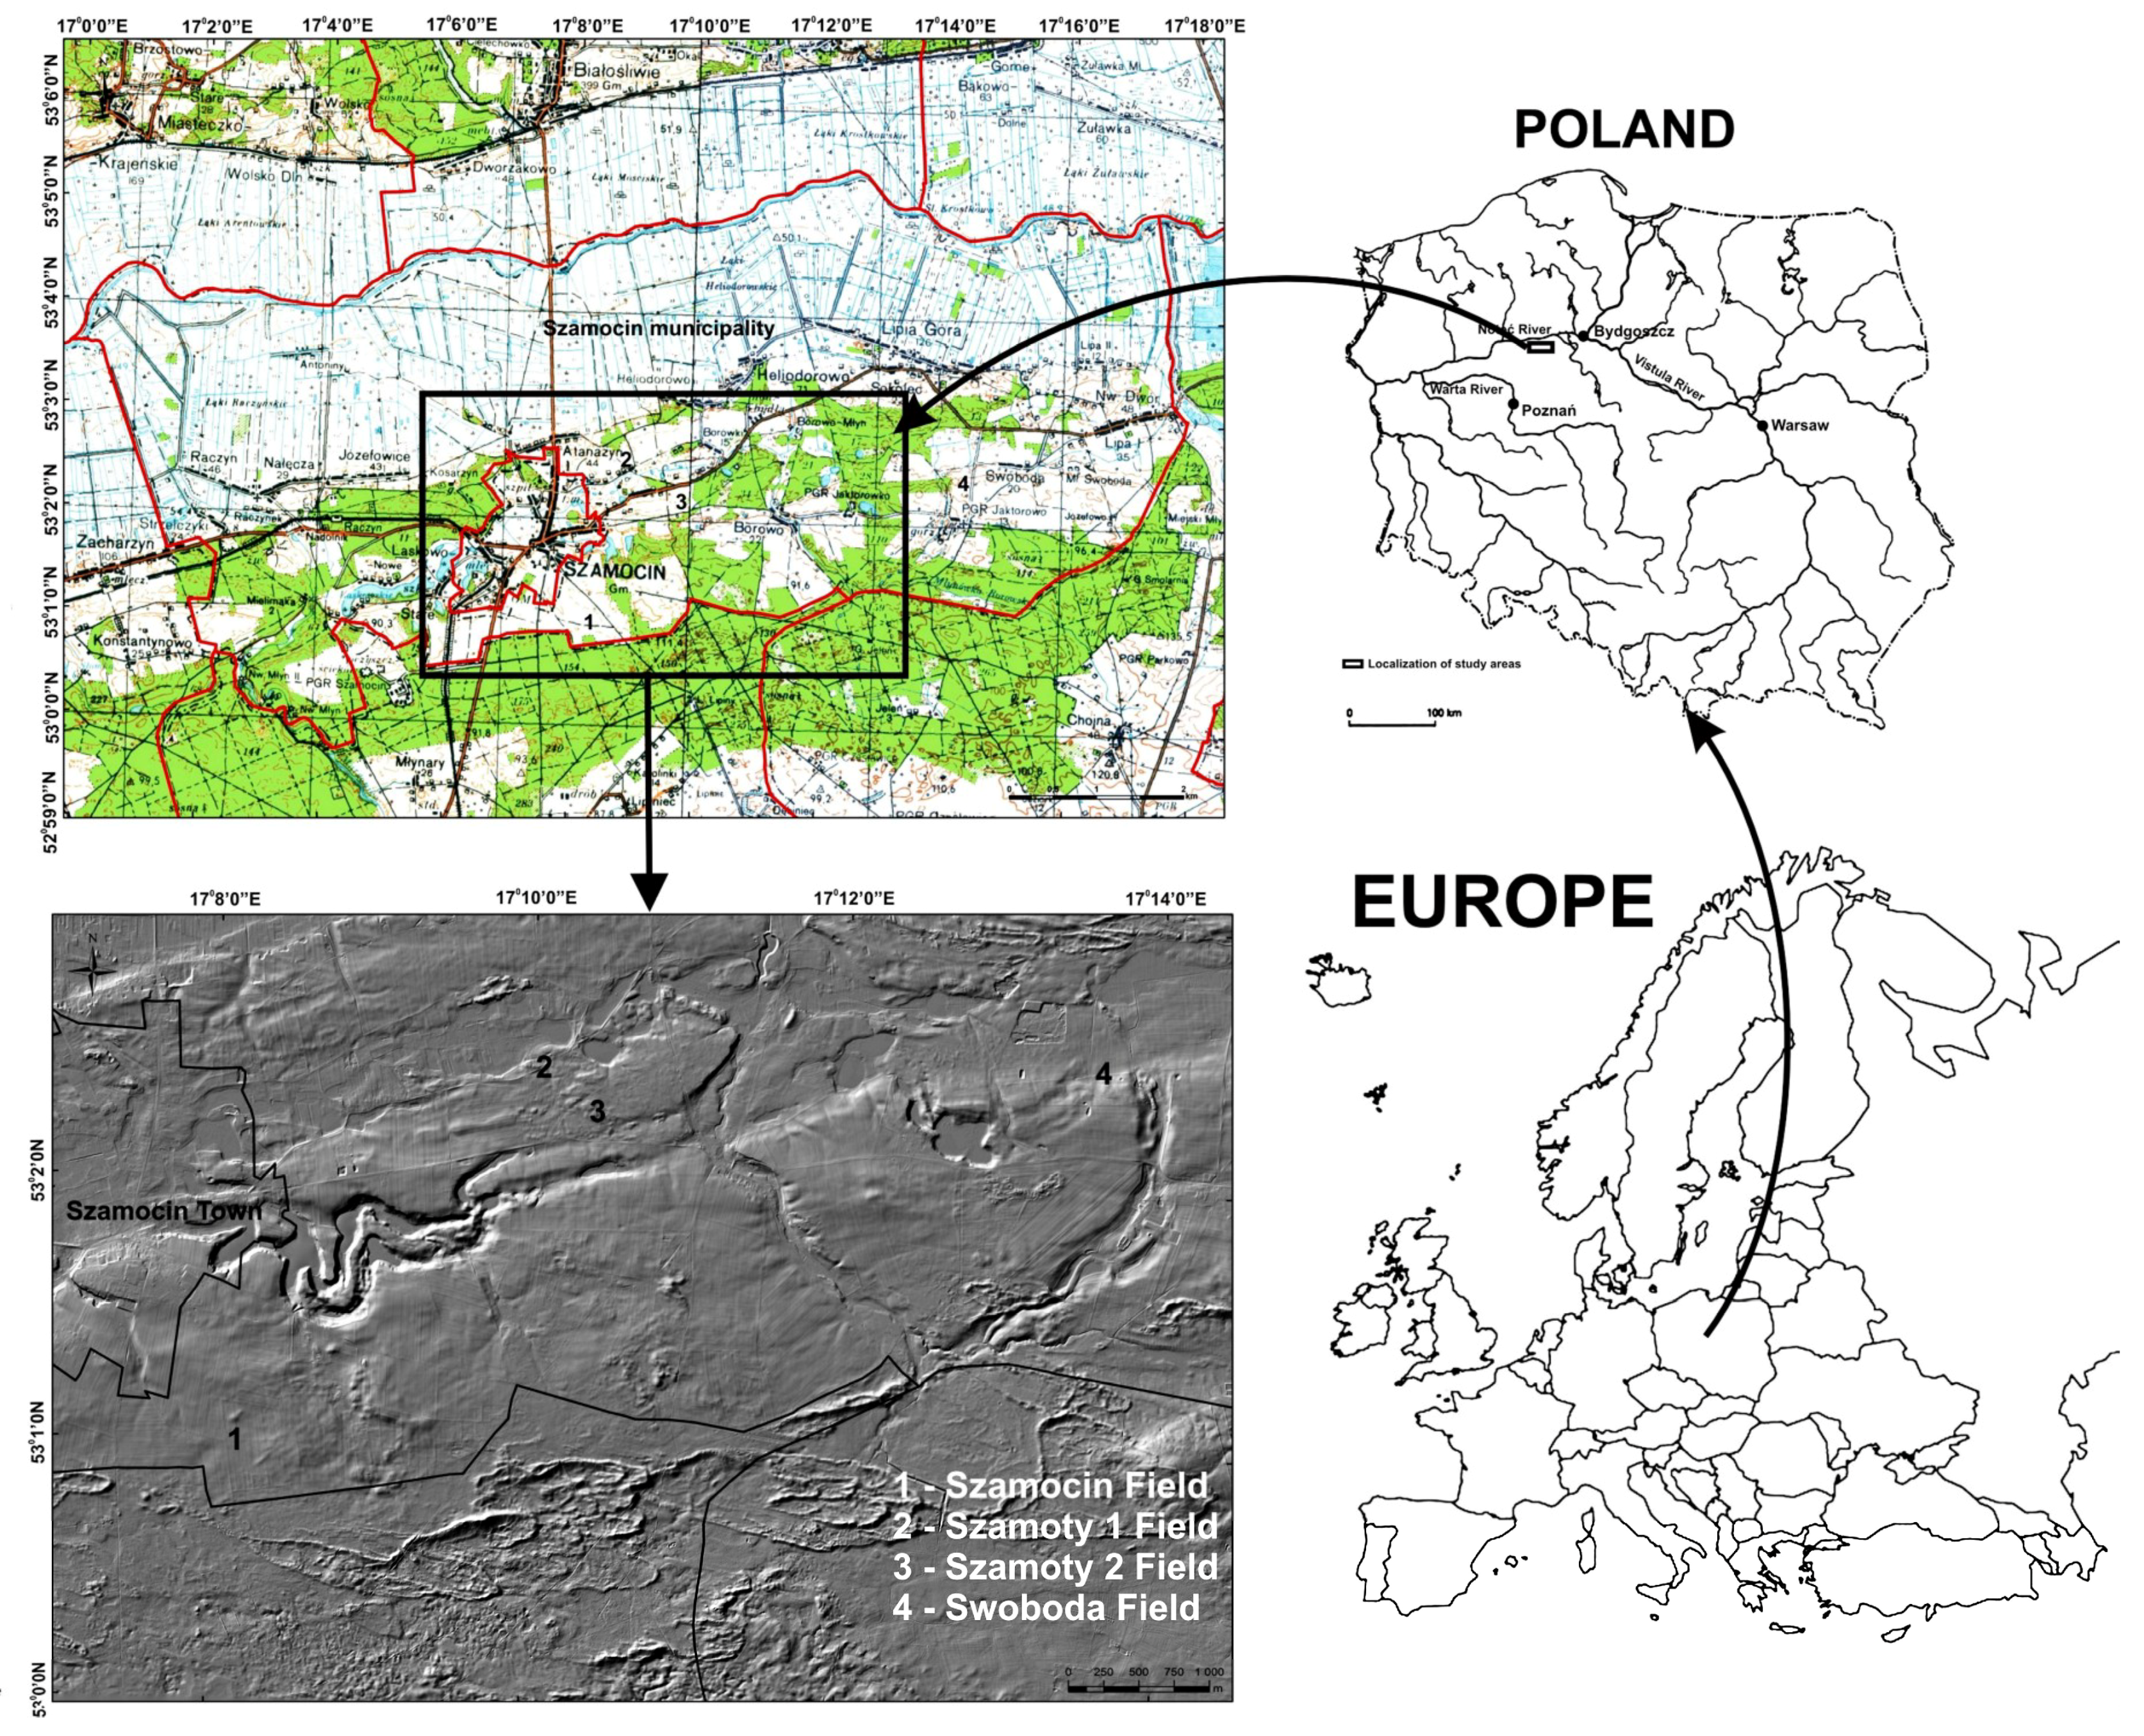
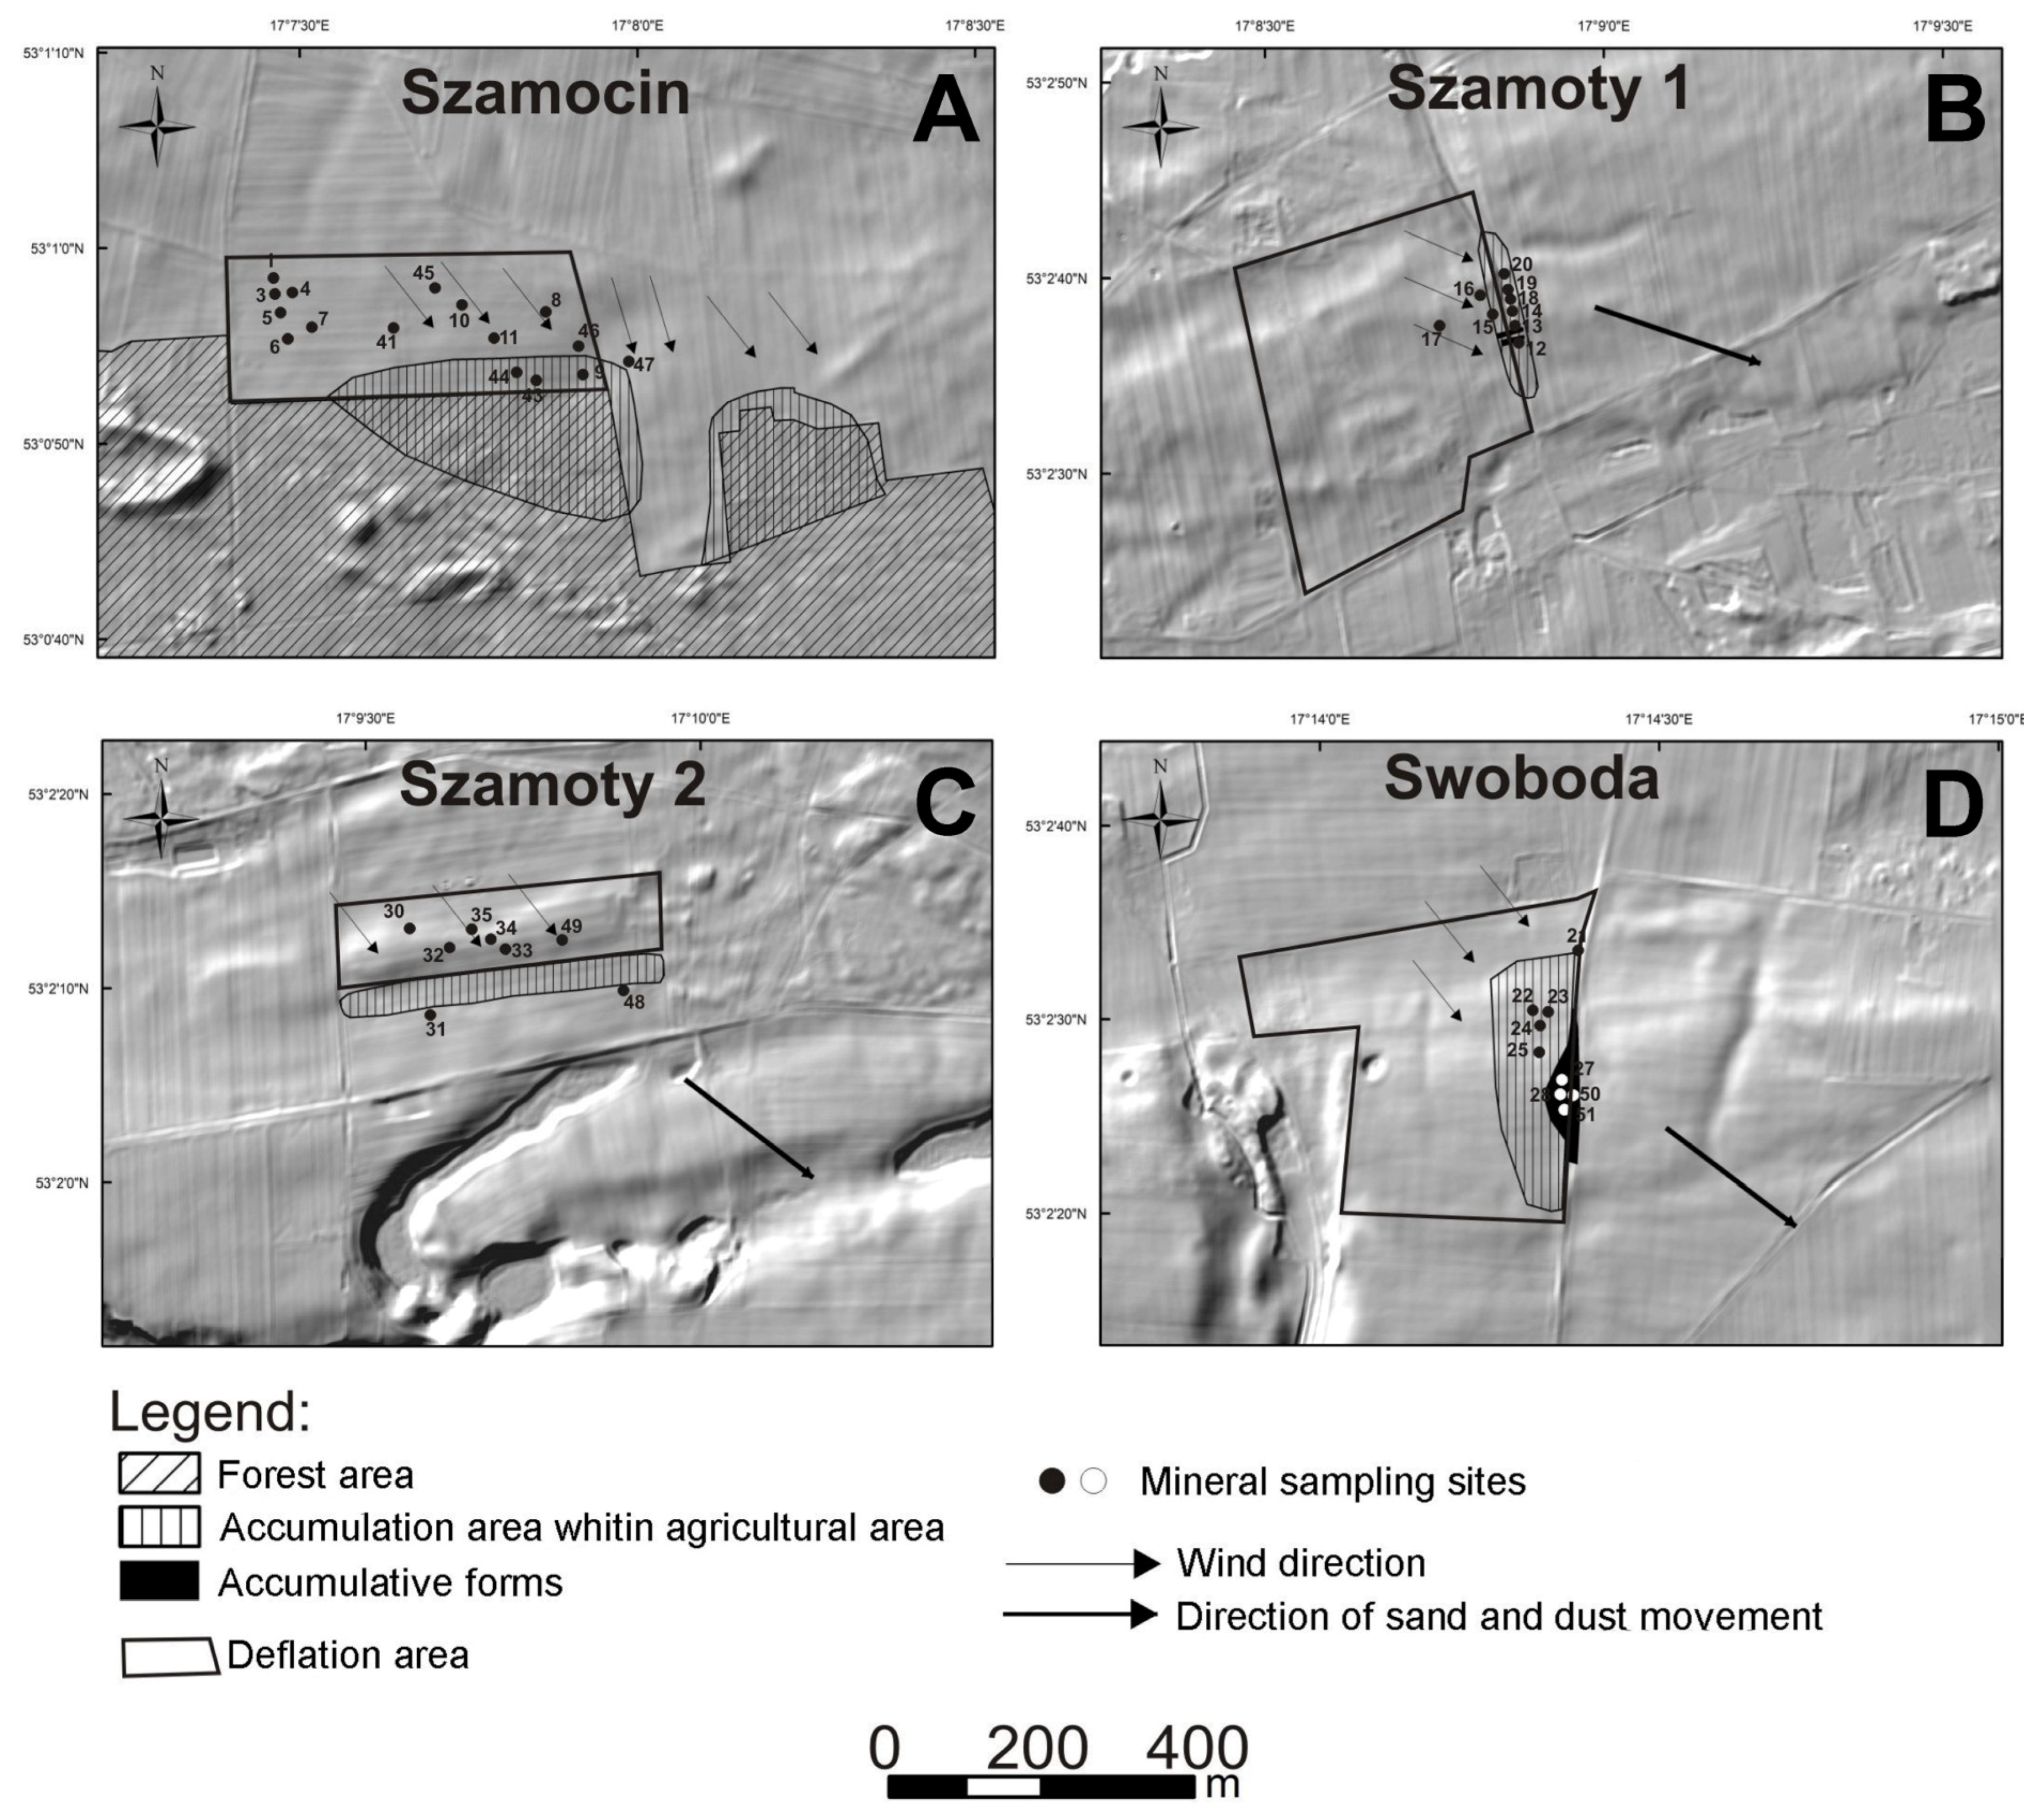
2.4. Geographical Settings

The research area comprised the northern part of the Wielkopolskie voivodeship, in the municipality of Szamocin (Figure 1). As far as the contemporary terrain and geological structure is concerned, the most important changes of land took place in the Pleistocene under the influence of the subsequent glacial. The ice sheet left behind a series of moraine clays masking the older, pre-quaternary structure. The fluvial activity of the Noteć River in the Pleistocene and Holocene led to the emergence of a flood terrace system. These levels were identified in detail and described by [46]. Alluvial terraces were divided into: upper IV (72–77 m above sea level), middle III (60–70 m above sea level), lower II (55–60 m above sea level) and flooding I (50–55 m lower) [46]. Numerous field observations indicate that they belong to erosion terraces, which are mainly composed of sand-gravel sediments of varying thickness [46].
Inland dunes were formed in this area in the past. These are parabolic dunes, dunes of irregular shapes, as well as dune banks which are part of the landscape. Dunes occur in clusters (of a dozen or so) and as individual forms. They are made of sands with a thickness equal to or below 10 m.

3. Results

The effects of the dust storm that took place in April 2011 on the researched areas caused the formation of various accumulative and erosive forms. Accumulative and erosive forms were analyzed in such a way so as to present them morphological characteristic and characteristics structural of mineral sediments. The results obtained during field tests (e.g., measurements of form surfaces) and laboratory tests (e.g., calculations of sediment volume, grain size analysis) indicate that a dust storm caused the blowing of a large quantity of sand on small deflative areas. The results obtained concerning the volume of material in accumulative forms after one event are higher than those described so far in the Polish literature.

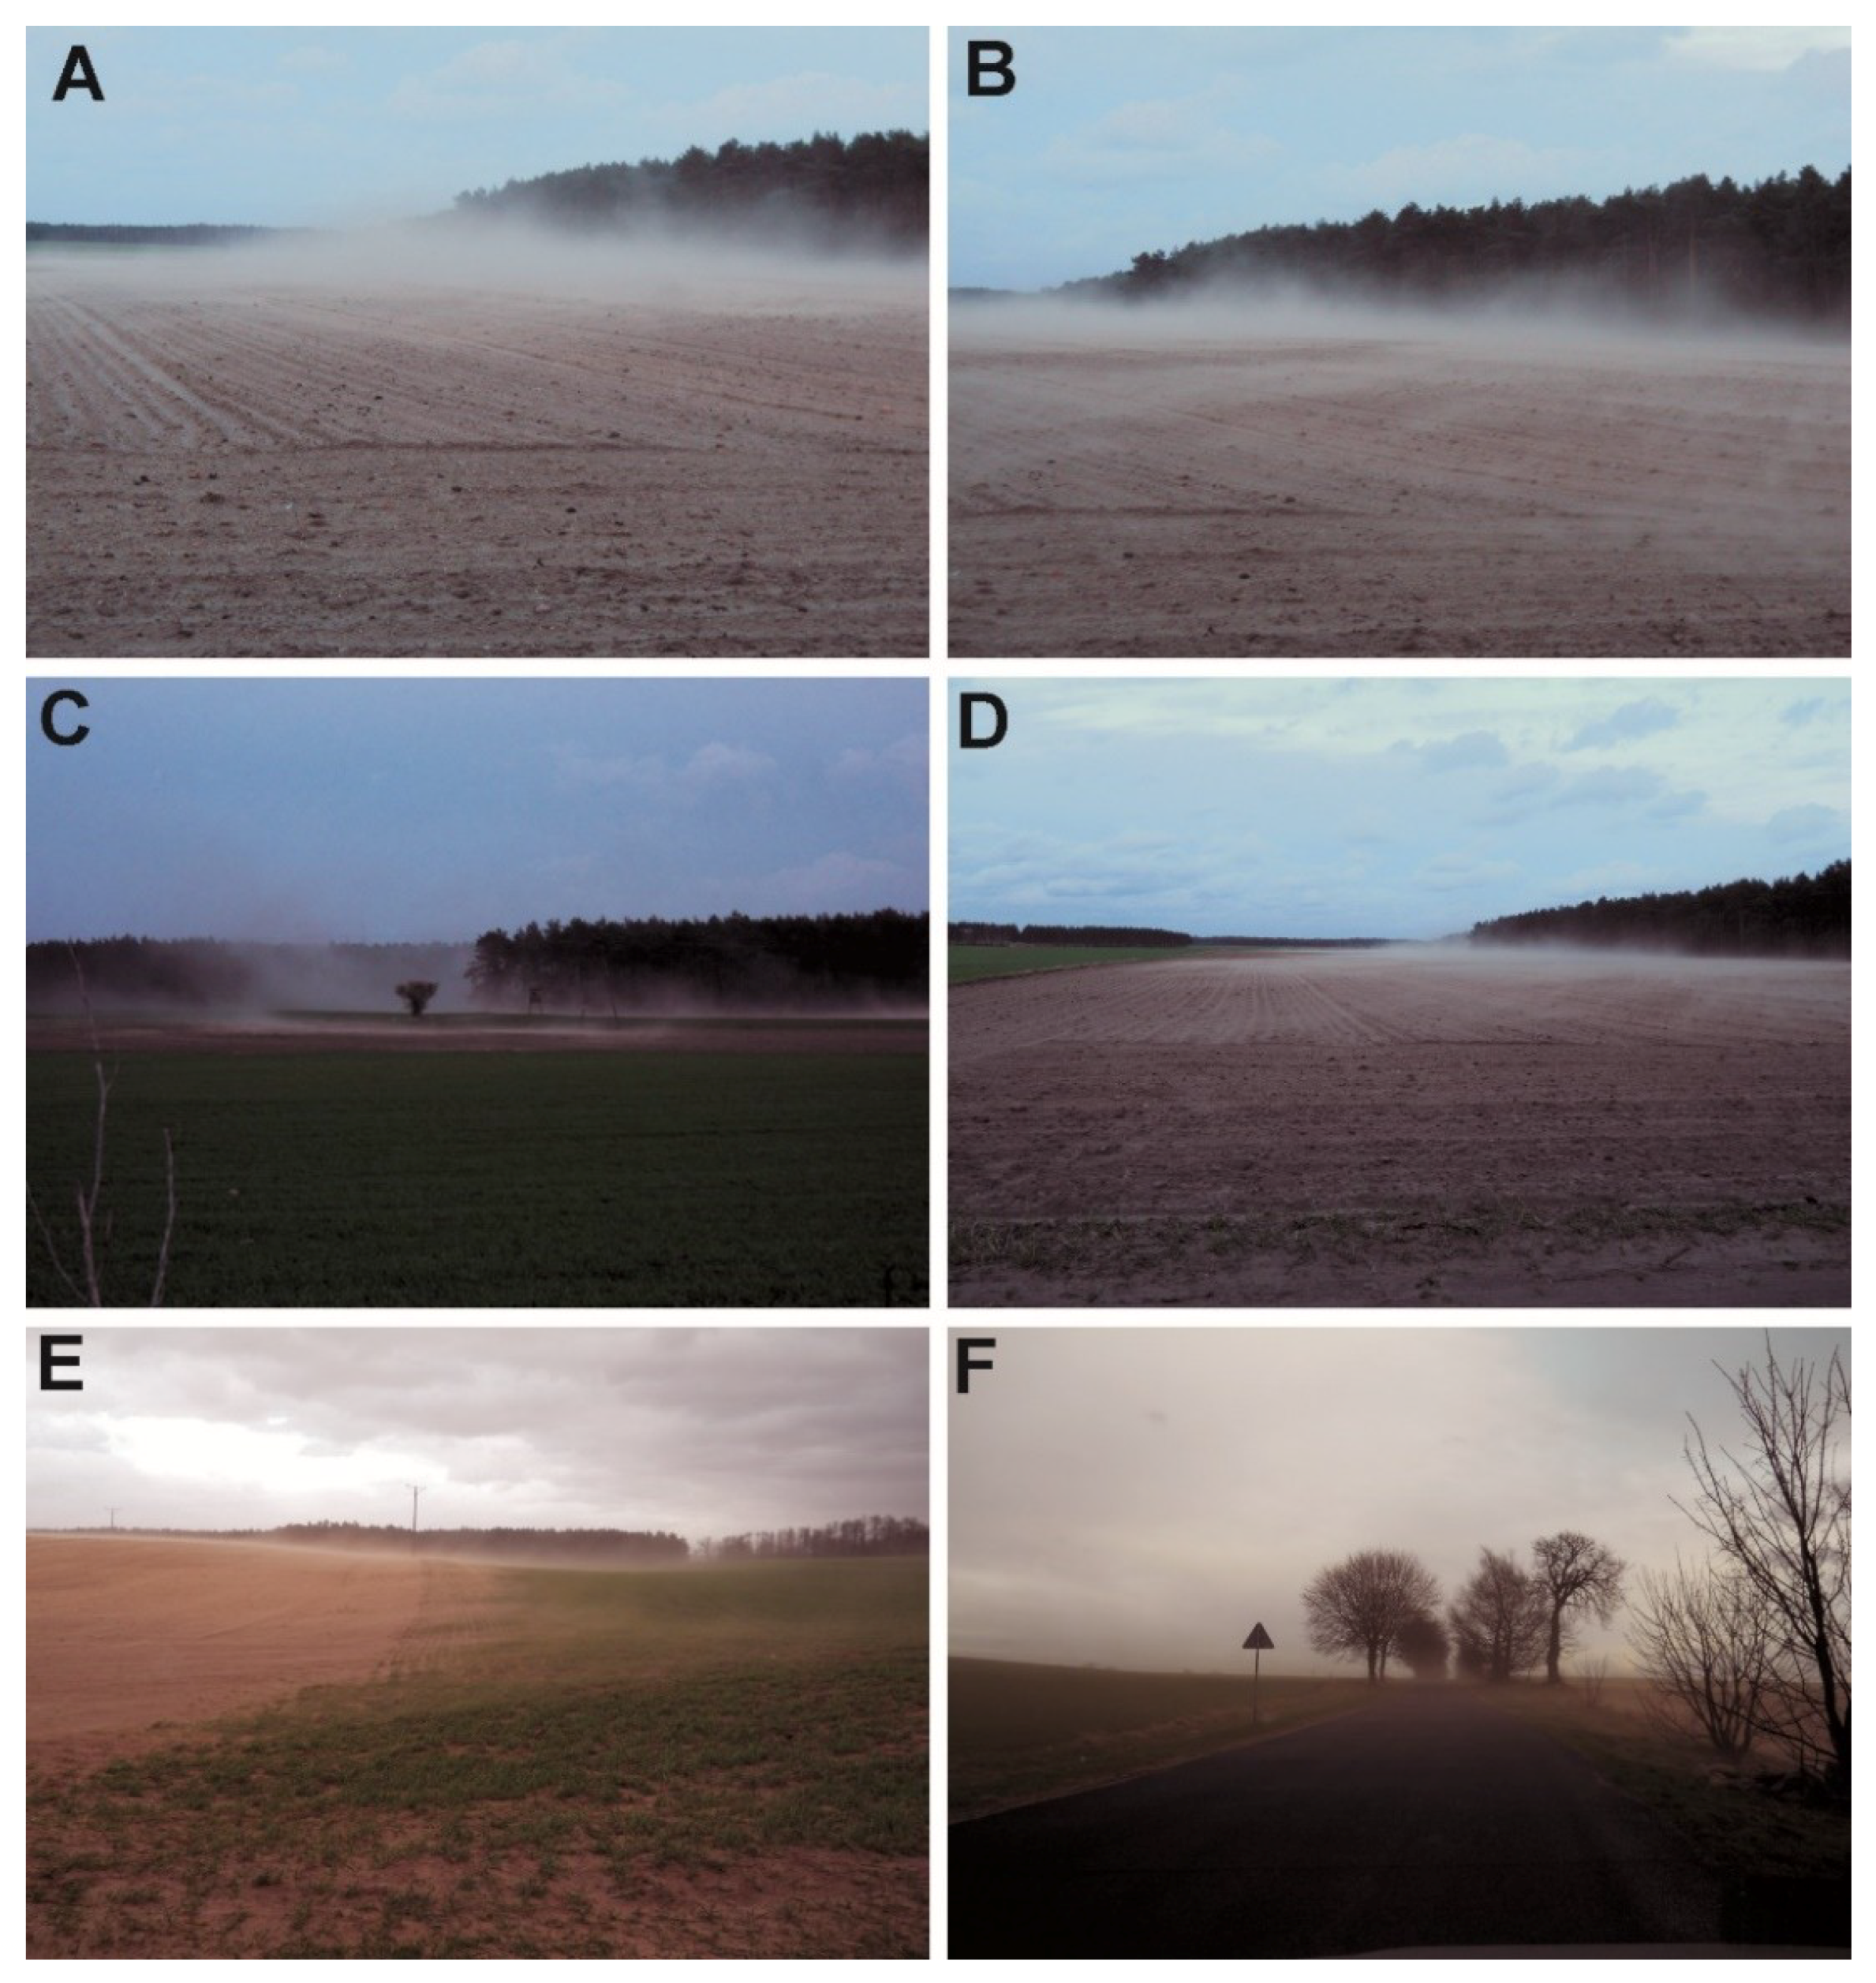
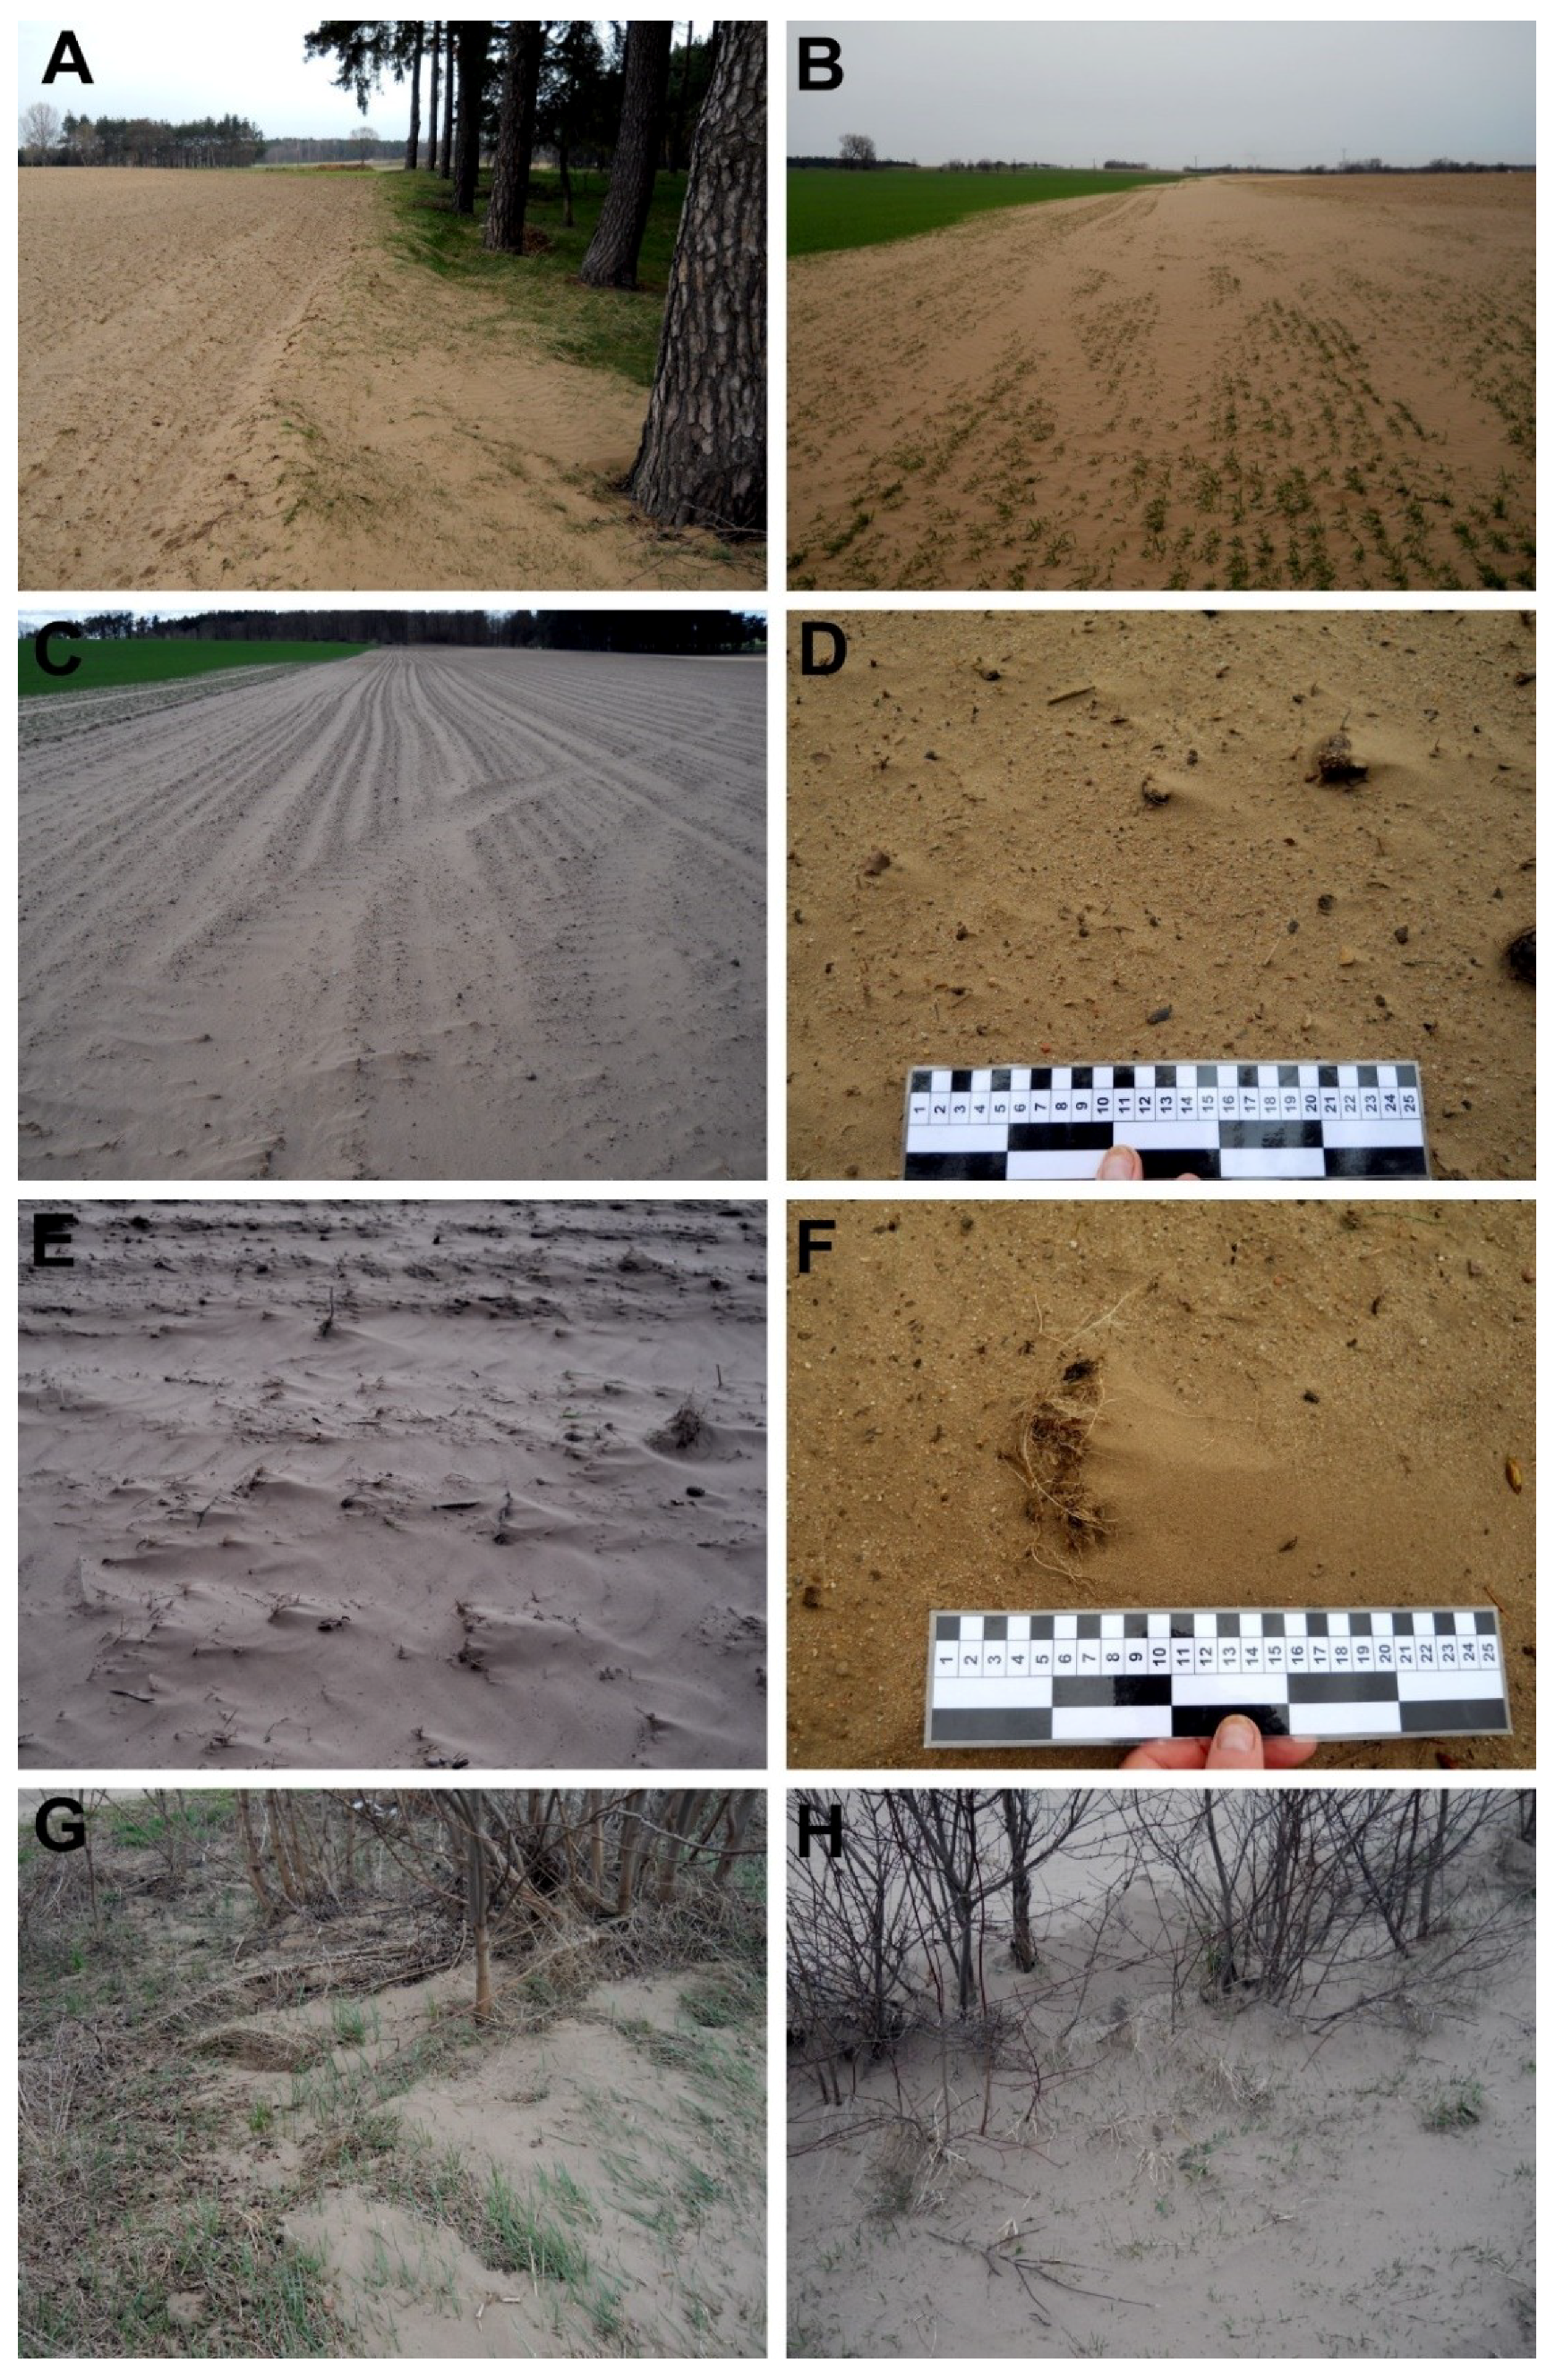
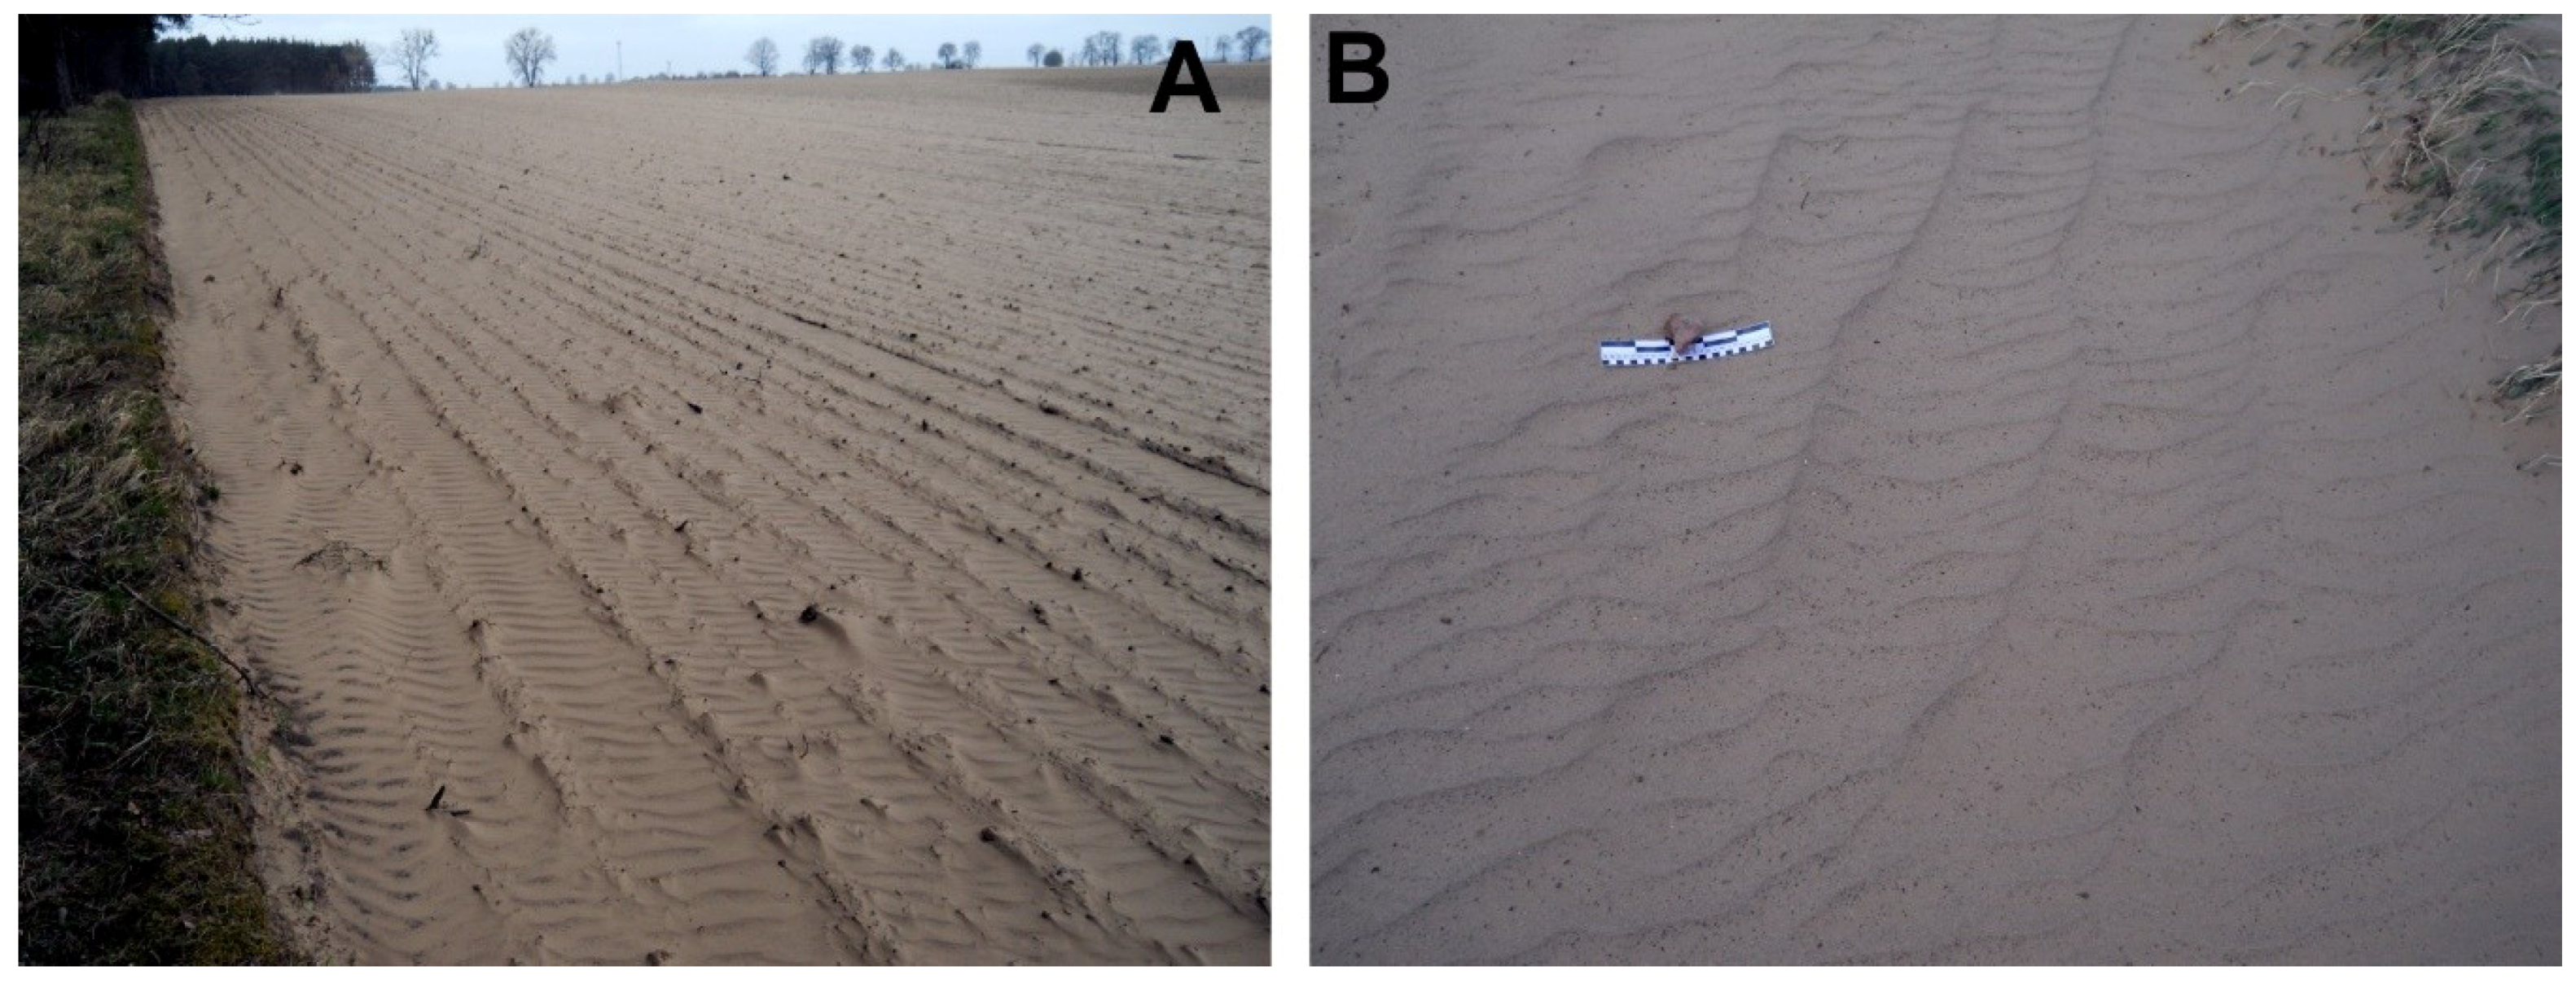
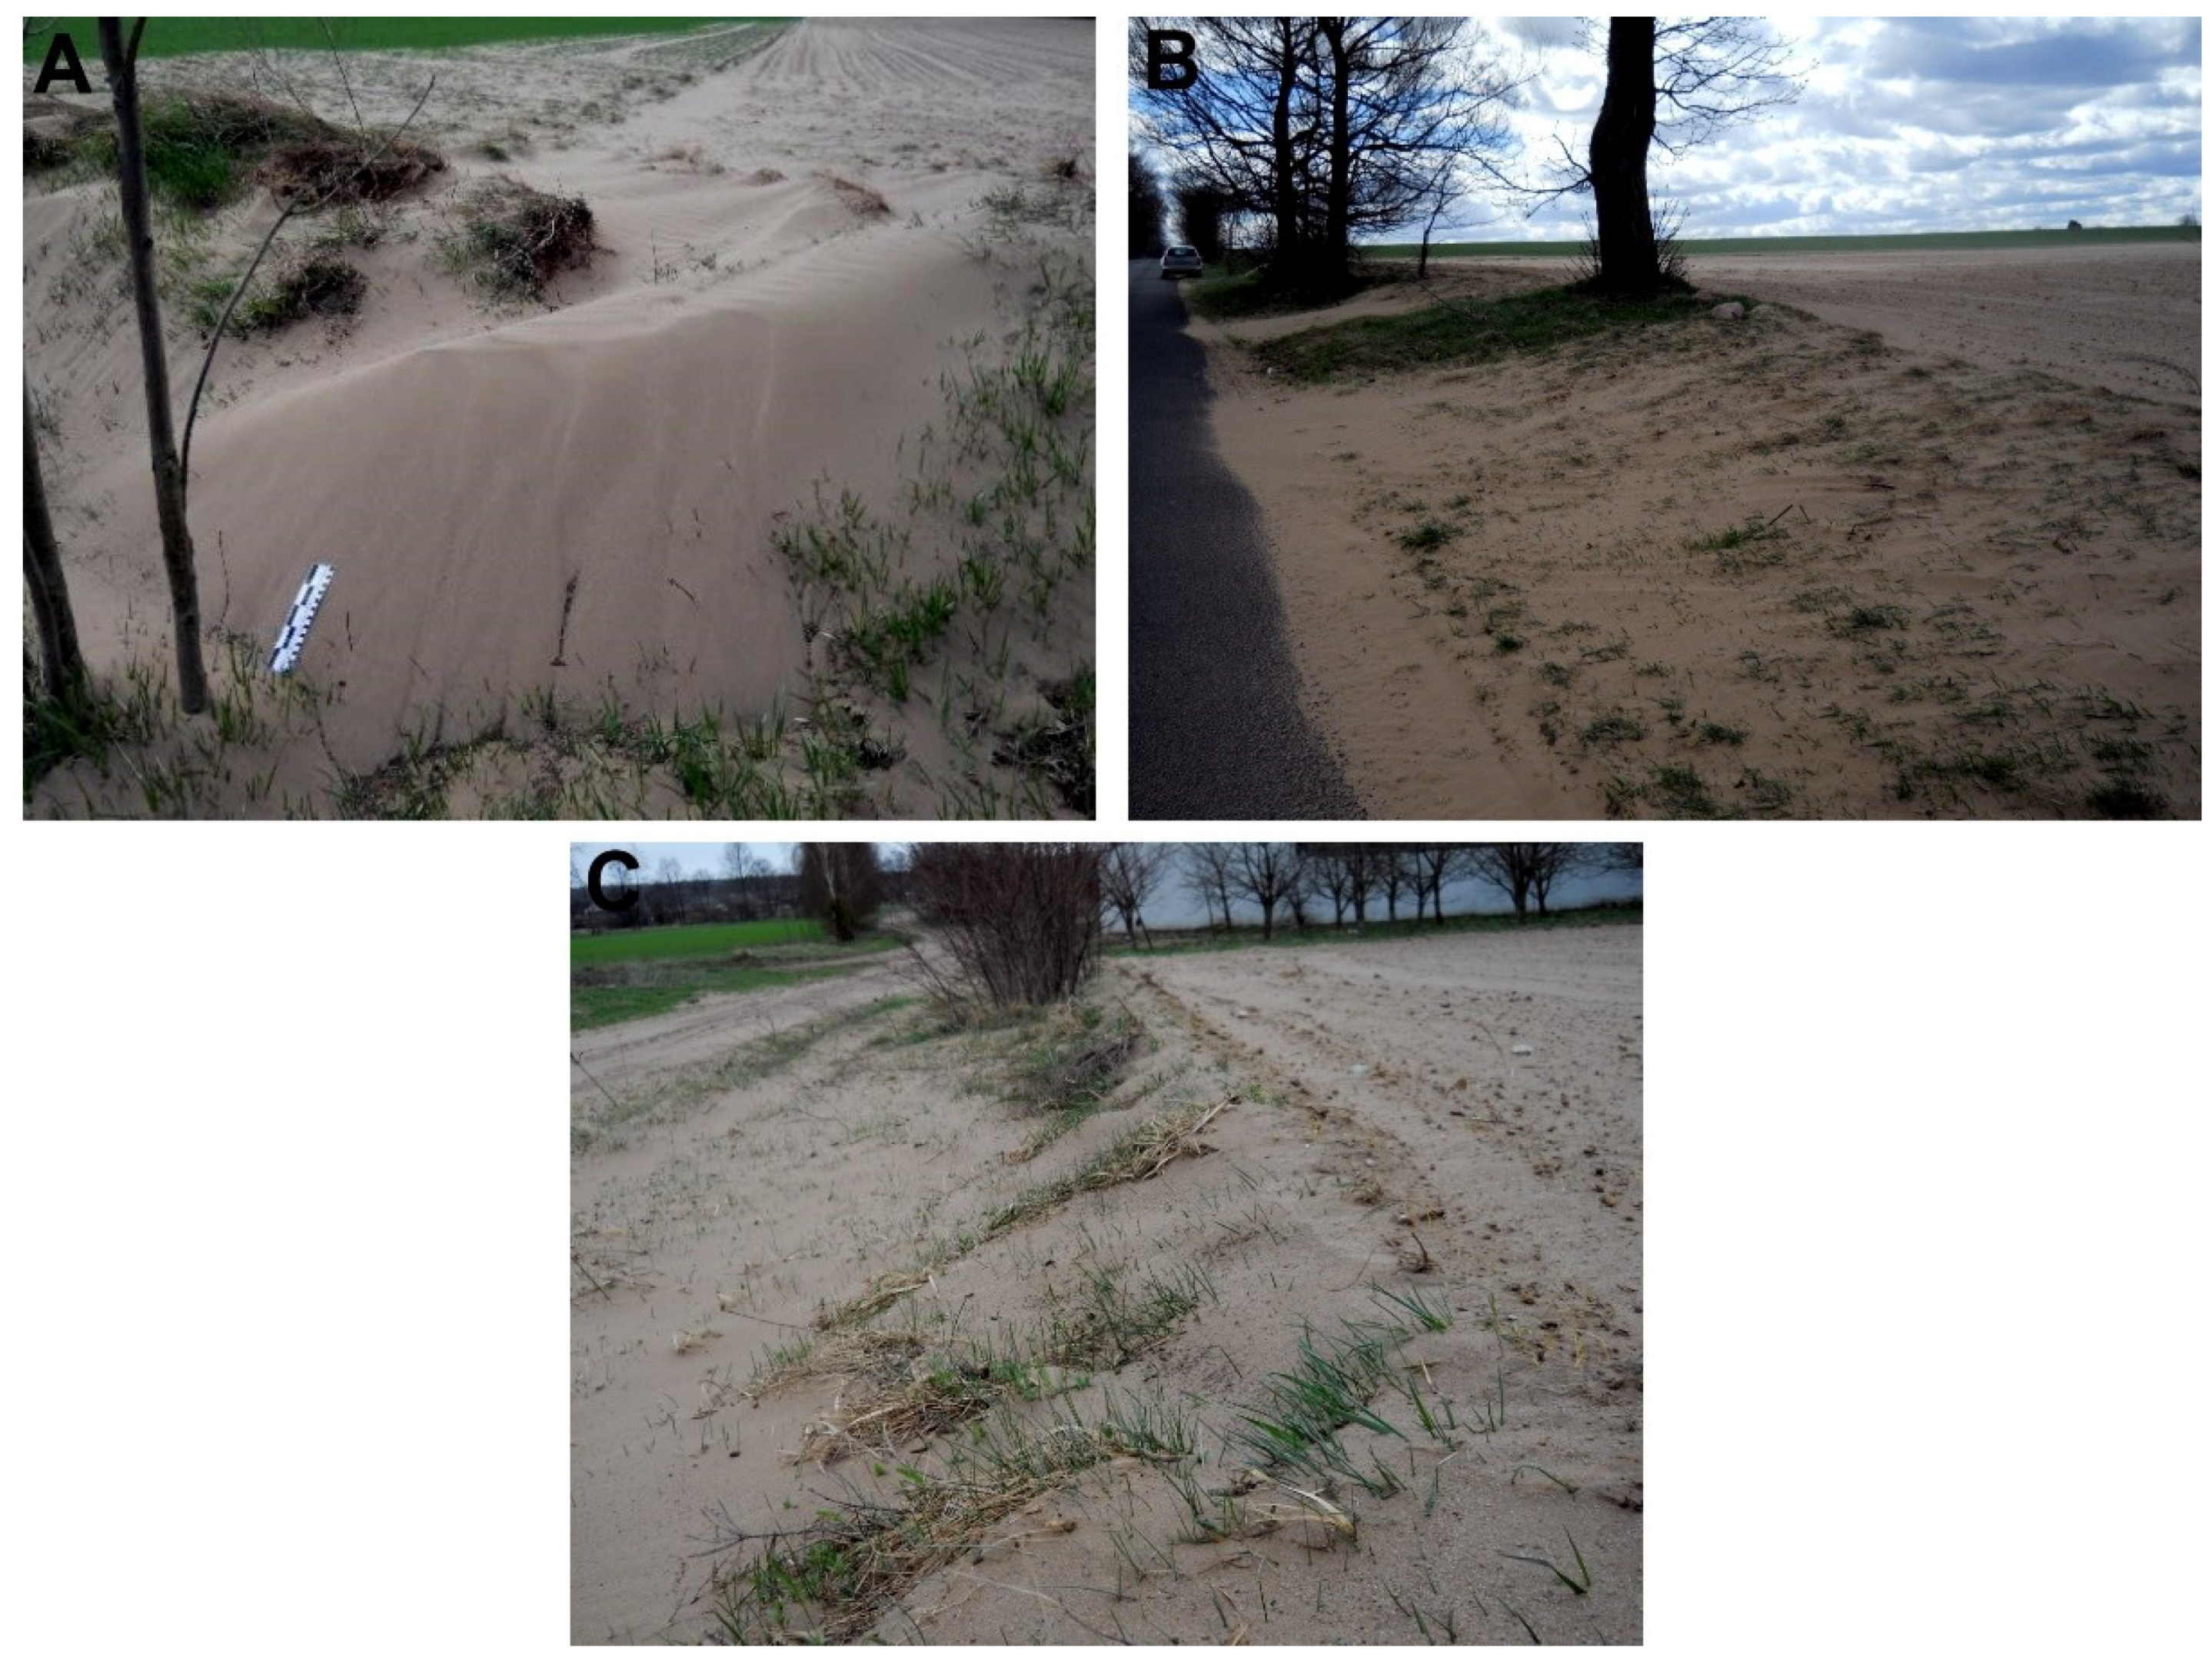
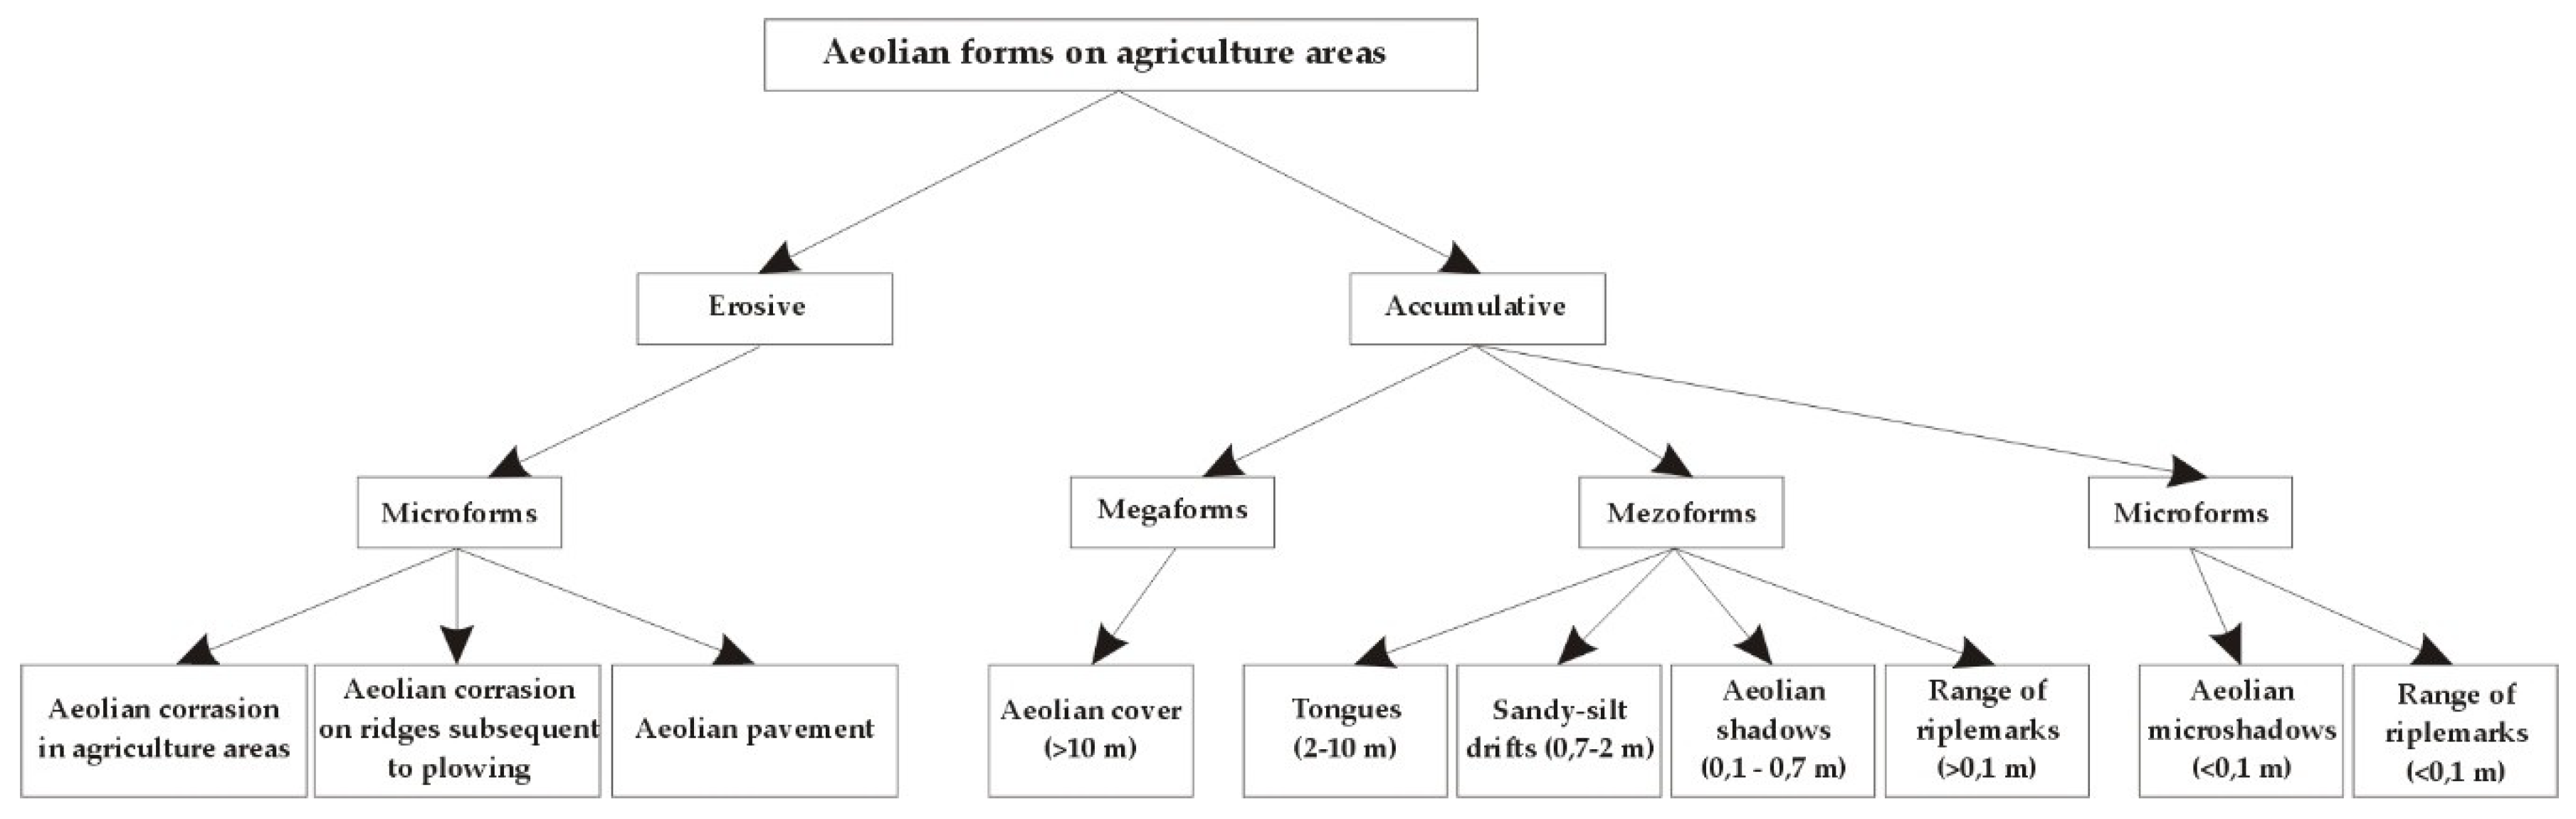
3.1. Morphological Effects

Extreme aeolian processes occurred in fields of various sizes (Table 2). All fields where aeolian processes took place were under preparation for spring sowing. They were ploughed to a depth of 0.1–0.15 m, which facilitated soil stripping. Accumulation of mineral material occurred in areas without vegetation, on arable fields with winter crops and in the forest.
Aeolian transport observed on the research fields was dependent on wind speed. Wind speeds of up to 8 m·s−1 caused surface creep of material and saltation. Field observations indicate that this wind speed caused transport of sediment to a height of 0.5 m (in the Szamoty 1 and Szamoty 2 fields). At higher wind speeds, the finest particles were transported in suspension. In Szamoty 1 and Swoboda fields, the height of a dust cloud reached 5–8 m with dust carried a distance of 50–500 m. The largest dust clouds were created in the Szamocin field during gusts exceeding 15 m·s−1. Dust was transported even above the crowns of trees growing in the forest adjoining the field (Figure 4). Transport height was 15–20 m, with the range of transport estimated at 2–5 km. Therefore, the volume of dust produced was not determined.
Traces of aeolian corrasion were observed on the surface of Szamocin and Swoboda fields (Figure 5A). Small grooves on the surface of the field indicated the erosive direction of the wind. Traces of aeolian erosion were found on ridges subsequent to ploughing, on their windward side. On the other hand, there was a sand accumulation zone on the downwind side (Figure 5B). In many places, all fields demonstrated deflation surfaces with aeolian paving (Figure 5C,D).
Mineral material extracted from fields accumulated mainly in the form of aeolian covers. The largest cover was deposited in a winter crop near the Szamoty 2 field with a surface of nearly 4000 m2 and thickness of up to 0.08 m (Figure 6C, Szamoty 2). The cover was created on a mid-field road by the Szamocin field. It had a smaller surface (90 m2), and its thickness ranged from 0.025 m (Szamocin) to 0.19 m (drift 1, Swoboda). The cover with the smallest surface was created in the Szamocin field, whereas the thickest cover was located by the Swoboda field −0.1 m (cover in ditch) (Table 2). This is due to a ground lowering behind the edge of the field, which promoted the accumulation of material.
Aeolian covers were created among accumulative forms (Figure 7A–C) and smaller ones such as shadows (Figure 7D,E), microshadows (Figure 7F), and aeolian tongues (Figure 7G,H). They were observed in all fields. These forms were erected behind clumps of plants remaining subsequent to ploughed fields. Shadows were 0.2–0.5 m long and 0.05–0.2 m wide. Shadow height was up to 0.1 m. Aeolian microshadows were formed behind the aeolian paving, and their length did not exceed 0.02 m.
There were ripple marks on the surface of all aeolian covers (Figure 8A,B) with a stretch of up to 0.25 m. The Swoboda field had smaller ripple marks with a stretch of about 0.03–0.05 m. Their ridges were situated at a 90° angle in relation to the ridge of larger ripple marks (Figure 8B). On the one hand, this indicates a drop in wind speed (Figure 2 and Figure 3), and on the other hand, a change in wind direction from the western to the northern sector (Figure 2).
On the eastern side of the Swoboda field there was a roadside trench covered with grass. In a ditch, at the south-eastern corner of the field, there was a sandy-silt drift formed with a thickness of 0.19 m. It had a clear, 0.5-long ridge and a scree slope with a length of 0.75 m (Figure 9A). In addition to accumulative forms created in the open space, an aeolian cover deposited in a pine forest adjacent to the Szamocin field was also observed. The thickness of this cover was the largest at the edge of the forest and ranged between 0.03–0.04 m (Figure 7A). Along with the increasing distance from the edge of the forest, the thickness of the aeolian cover gradually decreased. The range of transport of mineral material in the forest reached 200–230 m (Figure 6A, Szamocin).
The accumulation of thicker sediments (drifts, aeolian tongues) was influenced by terrain and vegetation. Fields were gently sloping and flat. Aeolian covers had a small thickness on larger areas, but areas of land depression had forms of greater thickness. The transported material was blown through depressions to ditches and field roads (Figure 6D, Swoboda). At the edges of fields there was also vegetation in the form of individual trees and clusters of bushes (Figure 9B,C). Trees caused a change in the direction of wind and reduced accumulation (Figure 9C), whereas shrubs decreased wind speed, resulting in the accumulation of thicker deposits (Figure 7G,H).
Geomorphological mapping of forms located on the analyzed fields made it possible to distinguish two groups of aeolian forms on areas used for agricultural purposes. These are erosive and accumulative forms (Figure 10). Field studies allowed recognizing a greater number of accumulative forms than erosive. Accumulative forms occurred in various areas, such as in open spaces, on the road, in a ditch and behind obstacles. Based on their size, accumulative forms were divided into: megaforms, mesoforms and microforms. On the other hand, erosive forms were connected with the remains after blowing, causing the formation of sharp ridges on furrows after ploughing. Due to their dimensions, erosive forms were included in microforms. They are ephemeral forms; after subsequent agrotechnical treatments, they are destroyed and most commonly do not stand a chance of being inscribed into the sediment’s profile. Another factor destructive to microforms is the developing vegetation.

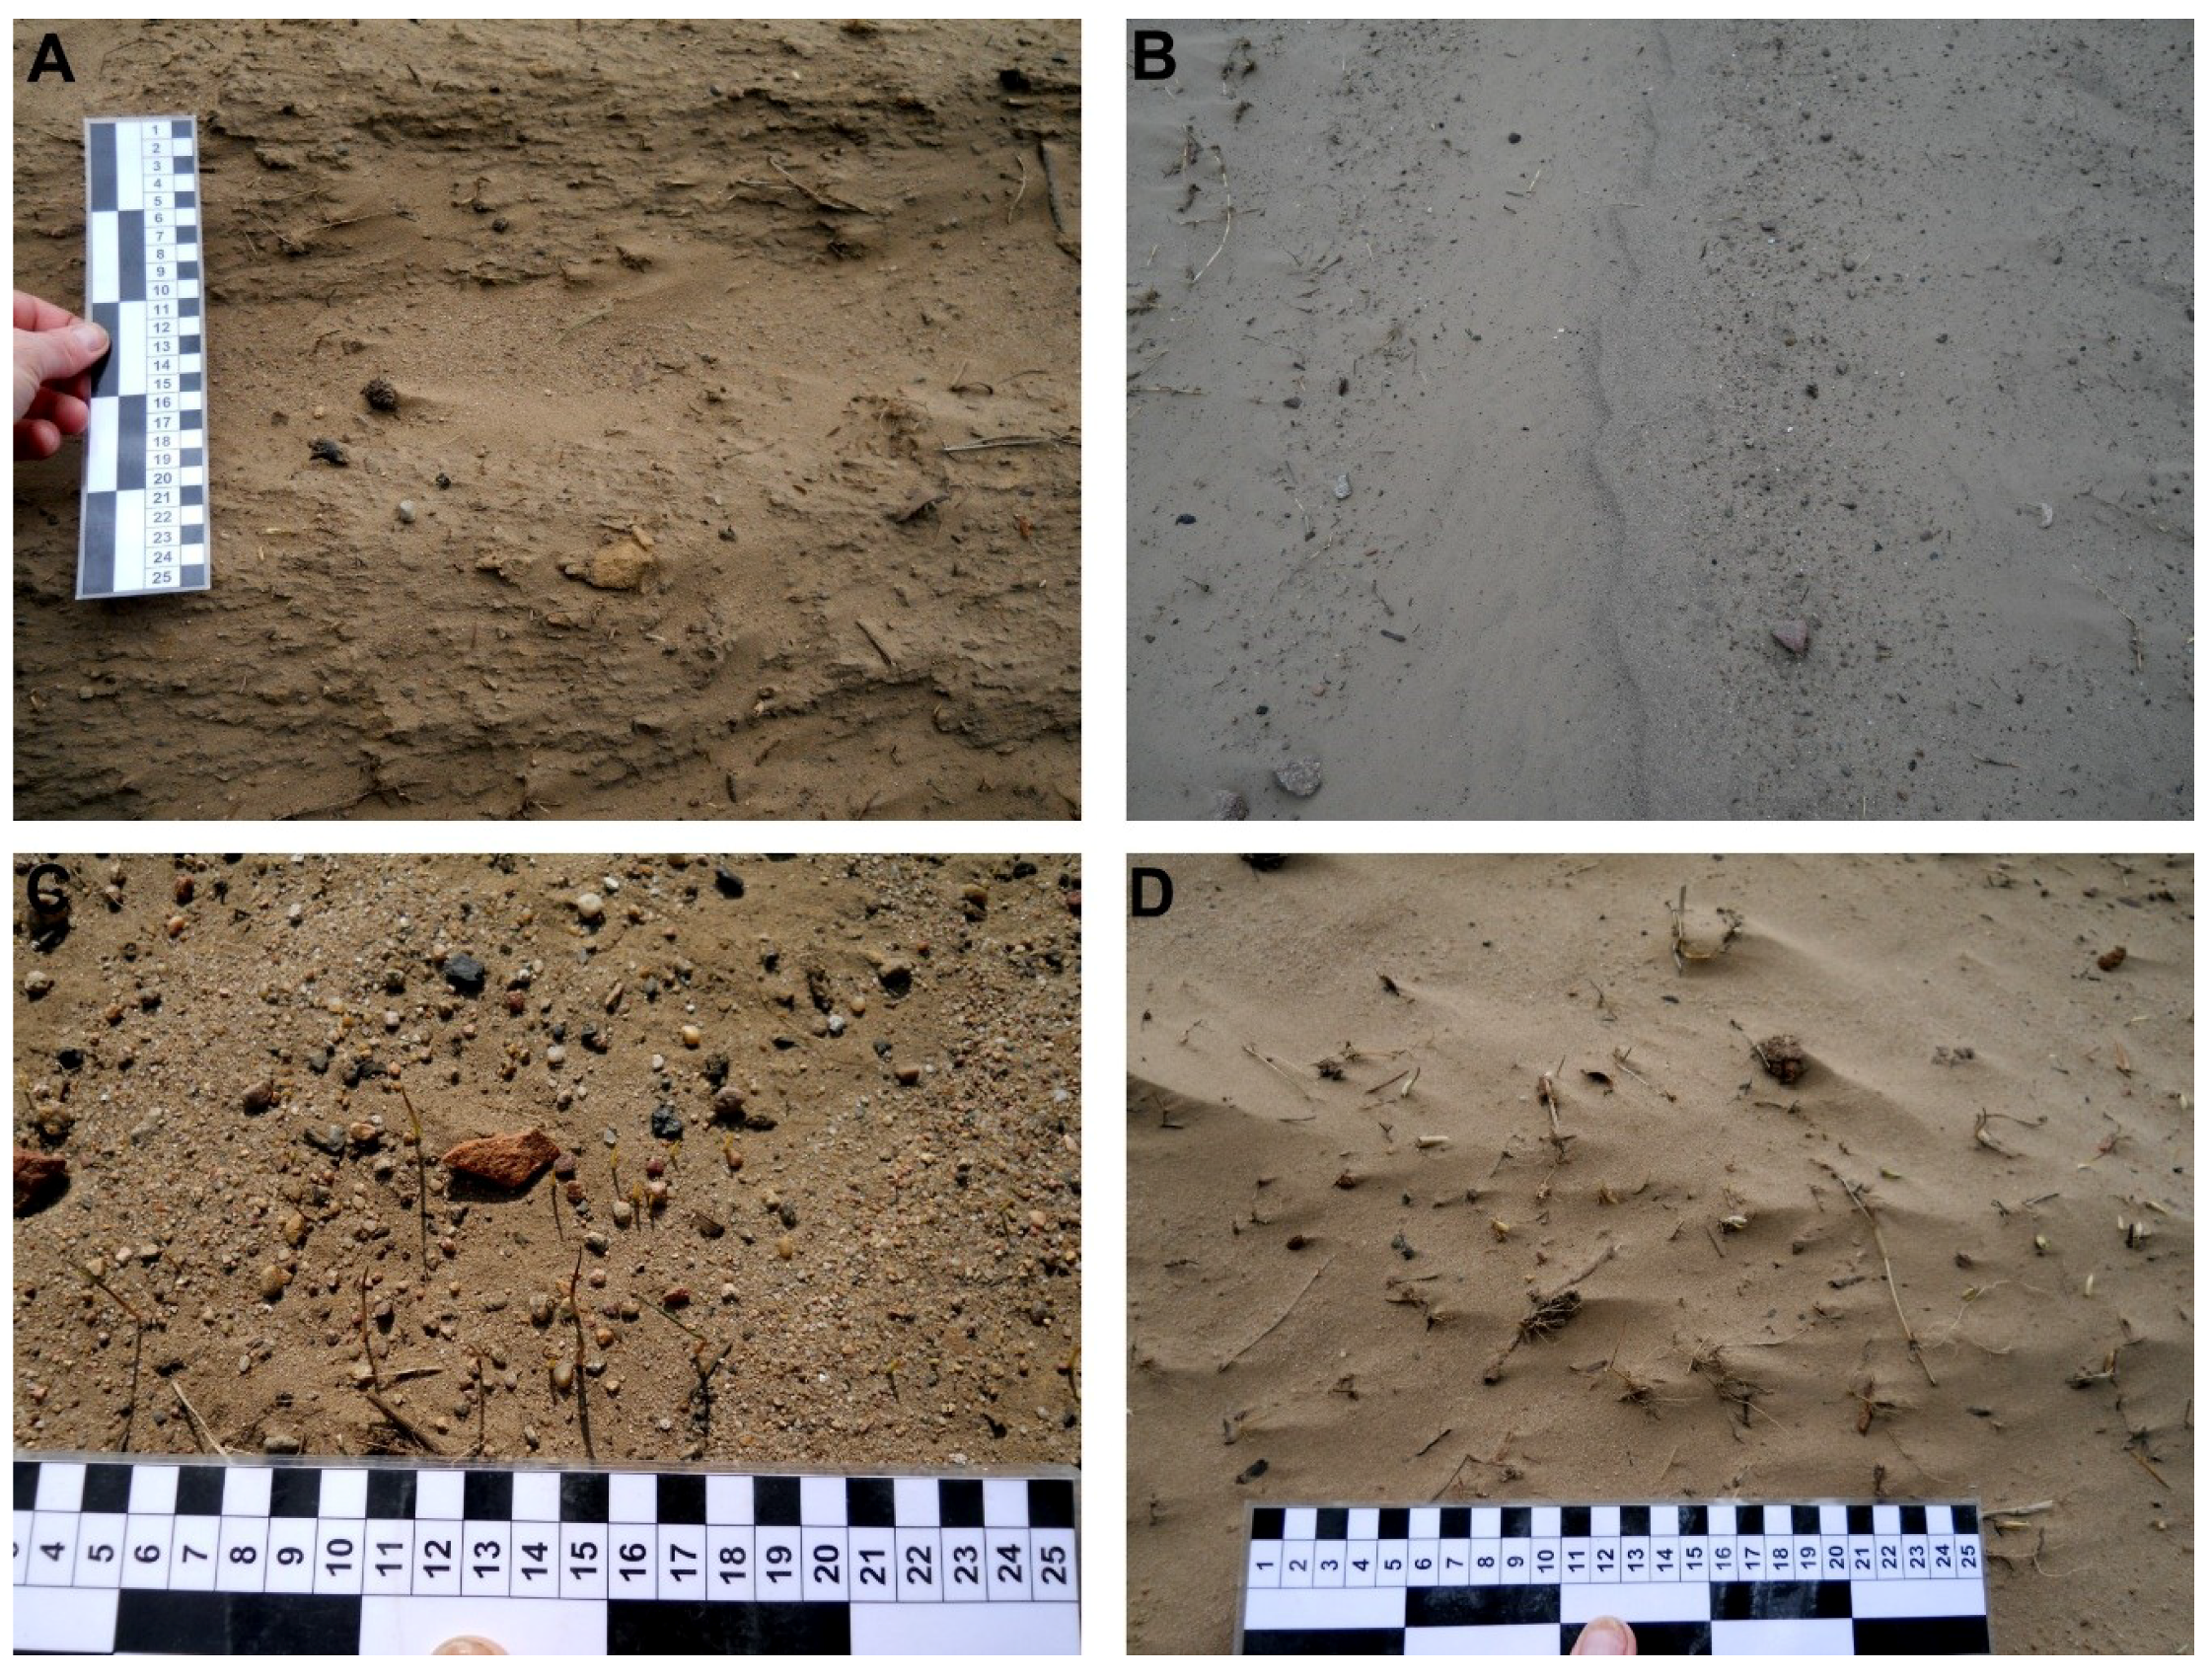
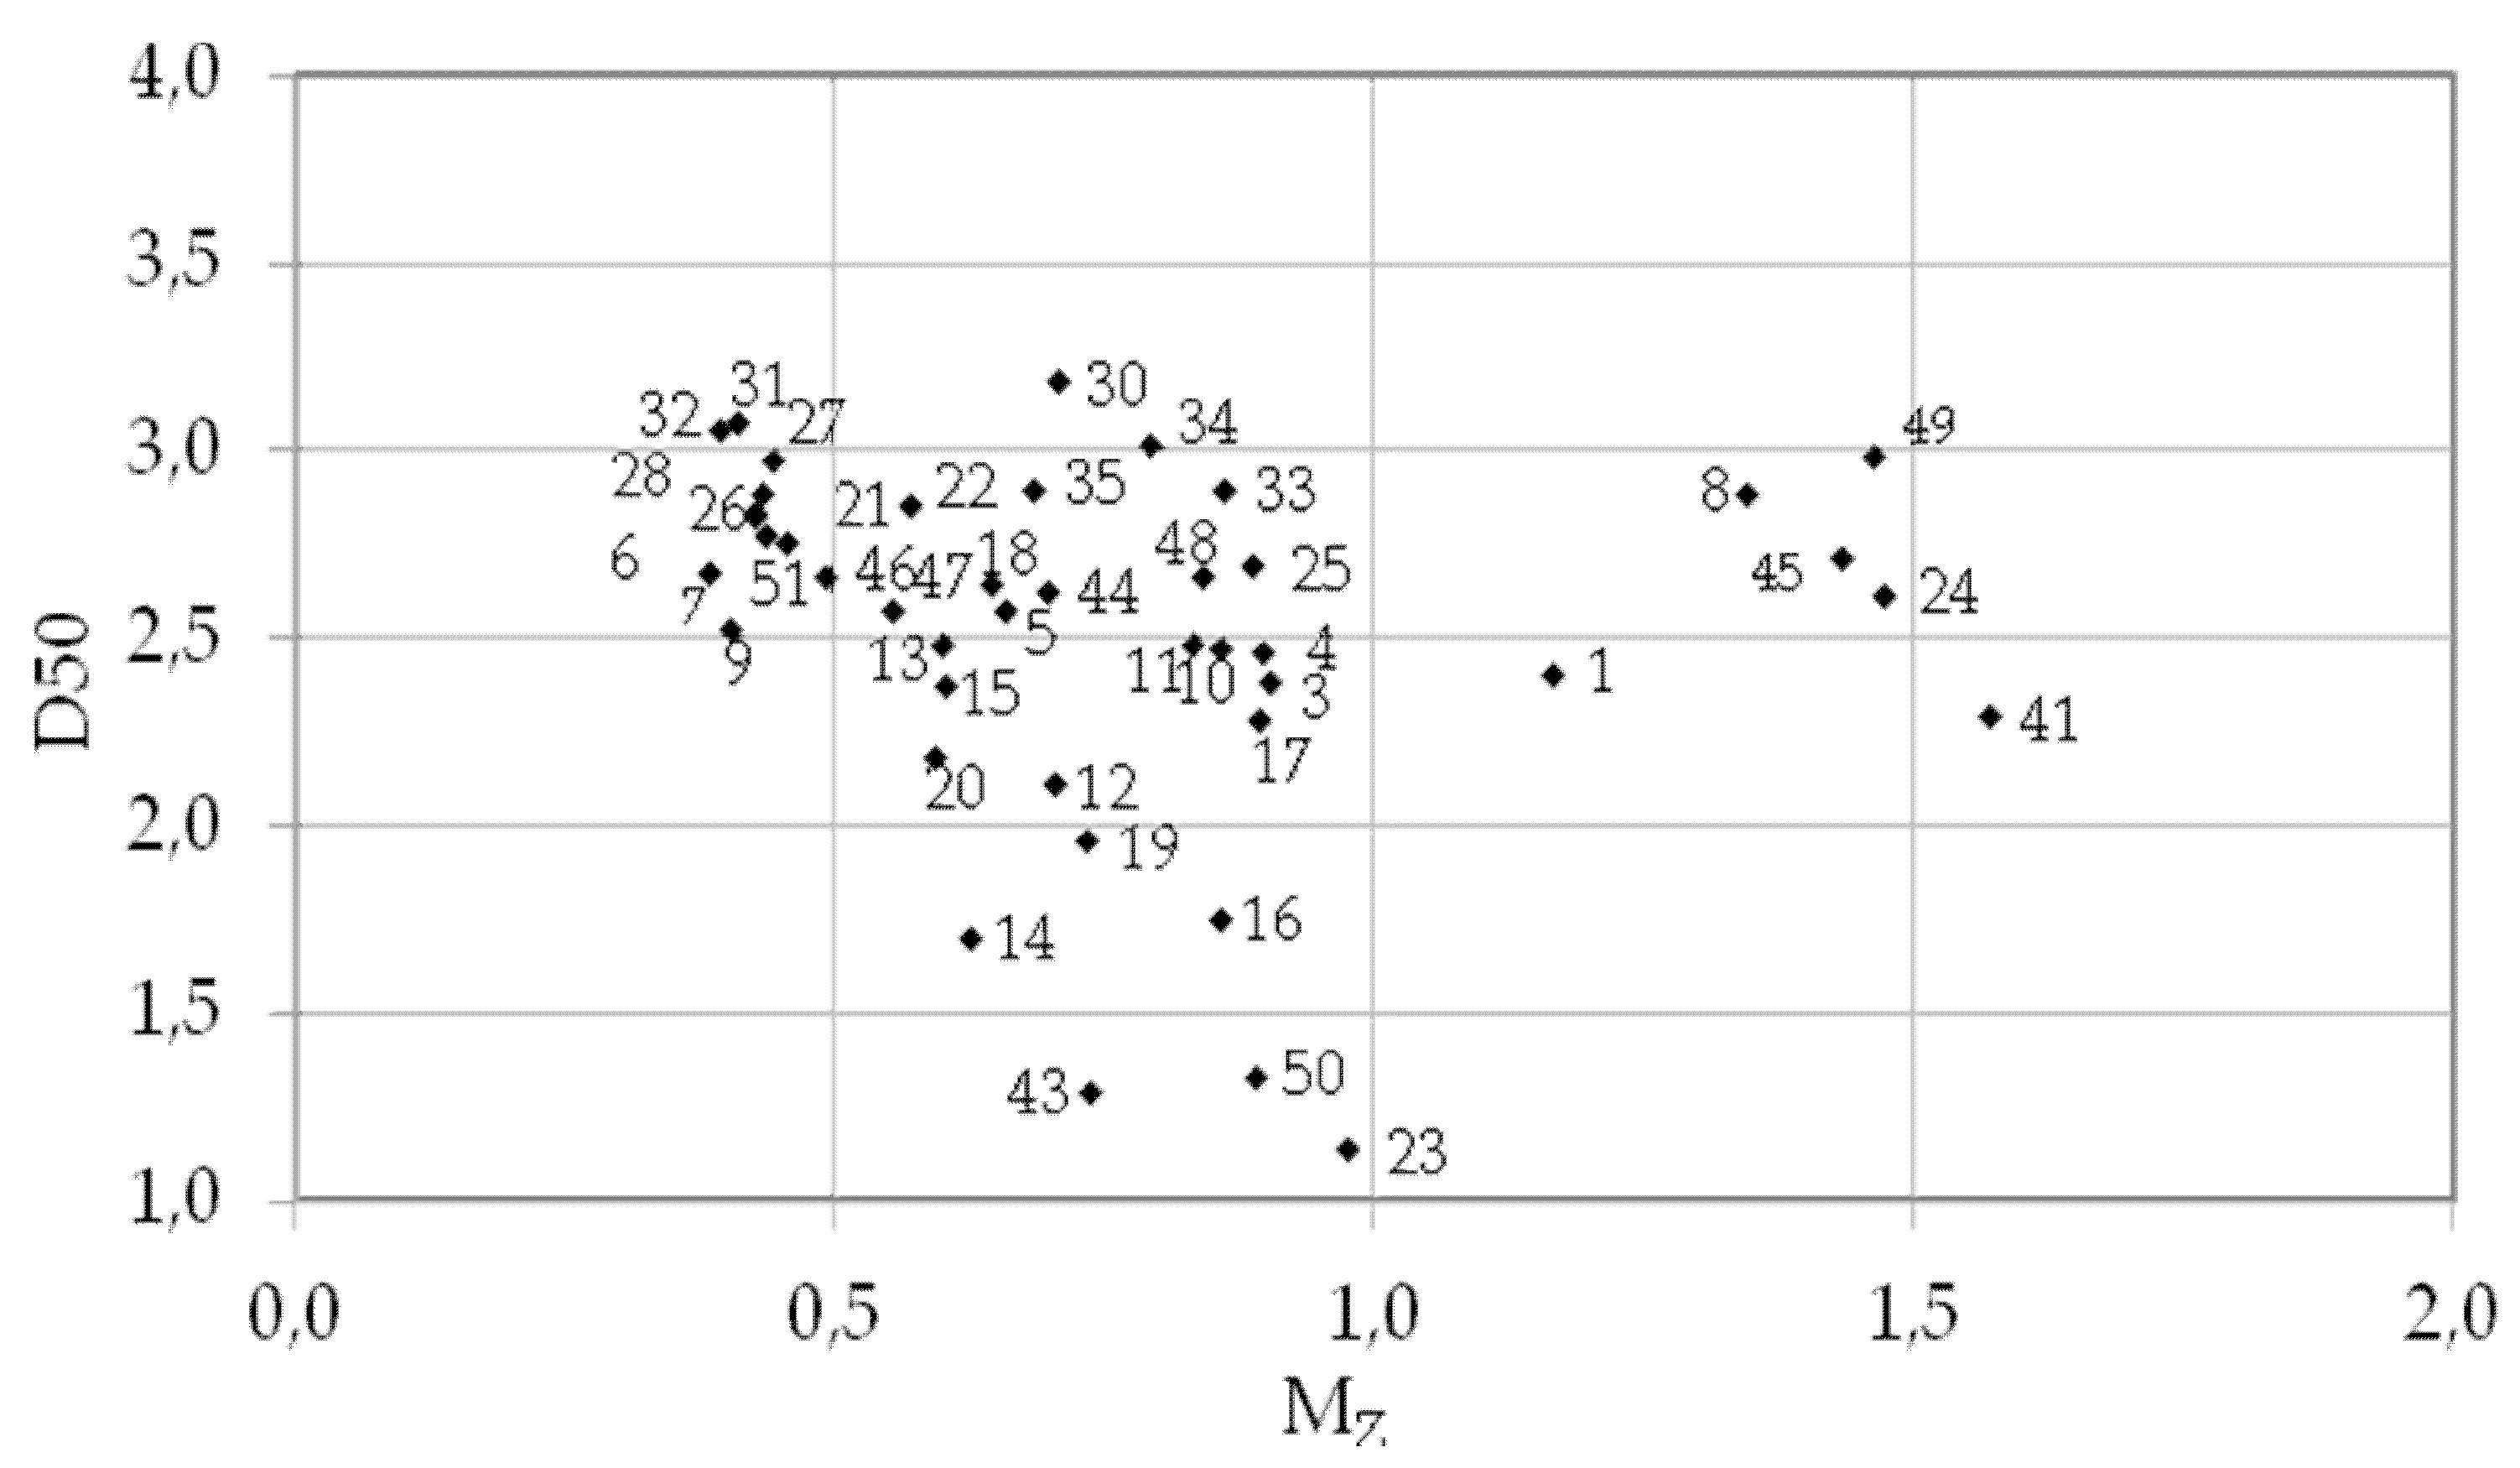
3.2. Sedimentological Features

The analysis of grain size in samples collected shows that the sediments of aeolian covers in the Szamocin, Szamoty 1 and Swoboda fields consisted of fine-grained sand. In the nearby winter crops and ruts, it was moderately well sorted, while in aeolian shadows behind obstacles it was well sorted (Table 3). Very fine, well-sorted sand was found in the aeolian cover in the Szamocin field. In the case of the Swoboda field, the accumulated mineral material was well and moderately well sorted (Table 3). Thicker fractions (deflation paving) were found in sediments taken from the dispersed field of Szamocin and Szamoty 2. They were made of medium-grain sand, poorly sorted with individual thicker grains. Such values indicate higher wind speeds and a shorter transport route. The average grain diameter (D50) and sorting (Mz) were summarized (Figure 11). Samples presented on the graph show certain discrepancies, but focus in three groups. The first (33 samples) fits in the interval D50 from 2.0 to 3.2, and MZ from 0.3 to 0.9 phi. The second group (six samples) falls in the interval D50 from 1.1 to 2.0 phi, and Mz from 0.6 to 1.0 phi. The third group (six samples) falls in the interval D50 from 2.3 to 3.0 phi, and Mz from 1.2 to 1.6 phi. Analyzing the obtained results, it may be concluded that the wind conditions for most samples were similar. The differences in size of the accumulated grains are minor. Only forms such as aeolian covers were formed from finer material, which came a longer way (Szamoty 1 field, samples no. 14, 16 and 19). Samples from the aeolian cover in the Szamoty 2 field included poorly sorted mineral (it came a shorter way, samples no. 48 and 49). Dispersions in the graph point towards differences in wind speed and transport path. Changes in wind speed and a longer or shorter transport route were visible in field studies.

4. Discussion

Literature describes examples of catastrophic dust phenomena that occurred in the USA in the twentieth century. Dust storms caused deflation in areas used for agriculture, and sediments transported by wind formed sand covers and small barchan dunes [5]. In turn, [47] indicated that during transportation, locally transferred material is accumulated within dry and water-filled drainage ditches. Moreover, accumulation also affects the blocking of local roads that need to be cleaned [47]. Accumulation zones identified in this study were similar. Aeolian covers were found on the Szamoty 1, Szamoty 2 and Swoboda fields. A drift and aeolian cover filling the drainage ditch were also documented in the last field. The Szamocin field revealed forms that did not occur elsewhere. These included sandy tongues and a large amount of material accumulated on the humps between ruts. It should be noted that the conditions for the accumulation of aeolian sediments had a major impact on vegetation (winter crops, shrubs, and roadside trees), which was also pointed out by [47]. The growth of vegetation covered with mineral sediment was hindered in the initial phase of vegetation. This may lead to decreased crops.
The influence of climatic changes on agricultural crops is currently observed, as the agricultural sector is very susceptible to changes of air temperature and precipitation. Increased air temperature causes changes in the length of the vegetation period. A higher temperature fosters earlier crop planting, faster maturation of crops and delayed sowing of winter crops [48,49]. Climatic changes cause faster development of thermophilic weeds [50,51]. New species of pests may also appear [51,52]. In a warming climate, extreme weather events (drought, heat, heavy precipitation) will be more likely to destroy crops [53,54]. Climatic changes will cause increased yield in the countries of Northern Europe, whereas the countries of southern Europe will see a drop in agricultural efficiency [55]. There will also be a shift of species from the south of Europe to the north [56]. An increase in the frequency of strong winds causing erosion of topsoil can also be expected. Aeolian erosion is also most frequent during or shortly after ploughing of cultivated fields.
Natural extreme phenomena, which include dust storms and sand storms, cause changes in the landscape in different climate zones. They shape the terrain by building it up and/or filling land with sediments. They cause changes in air quality and negatively affect the human economy. This is related to the granulation of soils. Soils developed on post-glacial sediments contain a lot of the finest fractions, i.e., dusts and sands, which have been classified as very susceptible to wind erosion [49]. The soil erodibility coefficient amounts up to 68% for Poland [57]. This is related to the occurrence of post-glacial sediments, rich in the smallest fractions [57]. Significant susceptibility of soils to aeolian erosion in Poland is also indicated by [58]. It is claimed that 28% of arable land is exposed to wind erosion, and in particular arable land on light, sandy soils. Analysis of granulation in samples taken in the fields showed that fine grain sands were subject to accumulation. In the Szamocin field, the presence of very fine-grained sand was found in only three samples. This indicates that the wind speed was so large that it carried the smallest particles outside areas subject to deflation.
Strong and gusty wind in the research area elevated the mineral material to 15–20 m. Grains of sand and dust begin to move when the wind speed exceeds 4 m s−1 [8]. Research on aeolian processes taking place in Iceland indicates that volcanic dust rises at very low wind speeds and remains even when the wind decreases [59]. In the analyzed areas, intense deflation occurred when the wind reached a speed above 8 m∙s−1. Suspension and saltation predominate in transport, and larger particles are dragged [60,61,62]. The sandy material was eroded and accumulated, as was the case with other authors [62]. Samples collected from Szamocin, Szamoty 1, Szamoty 2 and Swoboda fields did not contain a dusty fraction due to wind transport outside the research area. This was fostered by wind gusts exceeding 15 m∙s−1.
The type of transport dependent on wind and land cover as well as the size of transferred sediment was worked on in experimental conditions on research plots [28] and in wind tunnels set up in agricultural areas [30], and spaced between olive trees [29]. Using artificial conditions, the authors attempted to identify the main factors affecting changes in the soil profile considering the type and volume of material blown. Depending on the type of substrate, the main type of transport is saltation, followed by surface creep of material. Erosive wind speeds determined during the research were 8.8 m∙s−1 [28], 8 m∙s−1 [30] and 7.6 m∙s−1 [29]. These values are close to the wind velocity responsible for deflation (8 m∙s−1) in the analyzed fields.
It is difficult to completely determine deflation in areas used for agriculture in Germany [24]. It is estimated that it can amount to 16–20 t·km−2 and that it is close to the global constant. On April 8, 2011, a dust storm also occurred in Germany, but there are no works available on this topic. As far as the analyzed areas near Szamocin are concerned, the eroded material was accumulated locally. This applies in general to the coarse fraction. Based on field observations, it was estimated that the total transport of blown material may have exceeded 5 km.
The size of aeolian accumulation during four days of extreme aeolian processes exceeded the results obtained by [63]. Fields around Szamocin demonstrated an accumulation from 372.5 to 2831 t·km−2 while the yearly average that we have calculated was 178.7 t·km−2. The average annual mineral precipitation value for Równina Wrzesińska (Wrzesińska Plain) was at a level of 280 t·km−2 annually [64]. On the other hand, catastrophic values for this area have been set at 6400 t·km−2 per year with a maximum of 15,000 t·km−2 annually [65]. These are lower values in relation to results obtained in the fields near Szamocin, which ranged from 33,990 to 258,328 t·km−2 annually. In the study of [24], data regarding deposition averaged at 0.14 g/m/d, with a maximum drop of 0.30 g/m/d. The actual value of accumulated material in the analyzed site was much higher due to a large amount of silty material discharged outside the research areas. In the case of fields near Szamocin, the amount of material blown outside the research site is impossible to estimate. Small areas covered with deflation (a few hectares for each research field) provided a great number of dusts to the atmosphere (Table 1). This was caused by the occurrence of postglacial sediments, which are mainly represented by clays and sands rich in silted fractions.
In Szamocin, Szamoty 2 and Swoboda field, winter crops grew, which caused slowing down of transport and accumulation of material. Such a situation was described by [66]. Their models concerning soil both resistant and non-resistant to erosion showed microforms such as ridges, furrows, and clods. Aeolian microforms were distributed in an uneven way (microshadows). They occurred behind clods of soil, stones, and clumps of vegetation. Only sandy ripple marks were formed on the surface of aeolian covers. There were many more lumps on the resistant soil and it formed a kind of crust. The extraction of mineral material in these cultivated fields caused depletion of soils from the smallest fractions. This process affects the humidity changes in the soil profile and reveals the level of humus. Hard, dry soil and clods were not conducive to erosion, but were perfect places for sediment accumulation during saltation and surface creep.

5. Conclusions

This article presents the results of environmental changes after the occurrence of a dust storm. The dust storm that took place in the period of 7–10 April 2011 caused the formation of various accumulative forms resulting from the sediment deposited. A thorough analysis of the morphological characteristics of the accumulative forms was conducted and the average quantity of blown mineral material was calculated.
Aeolian processes presented in the article were of an extreme nature. The wind speeds recorded at the weather station in Piła on the days of extreme aeolian processes in the vicinity of Szamocin were much higher than the average for the long-term period. The speeds were probably higher in the research area due to extensive open spaces of arable fields. An additional, very important element conditioning such strong deflation, transport and accumulation processes was a heavily dry soil, as a result of precipitation that was much lower than the average long-period sum in March and the beginning of April 2011. On the other hand, average daily air temperatures were higher than those for the average long-term period. A long period of drought in the spring season, strong, gusty wind on 7–10 April 2011 and freshly ploughed fields were the main cause of extreme aeolian processes. Soil particles were transported in the process of traction and saltation. The finest fractions formed suspended matter that was blown away beyond the area of each of the analyzed fields. The volume of mineral material accumulated in the fields exceeded the values recorded in Poland so far. On 8 April 2011, catastrophic aeolian processes also took place in Germany.
The amount of erosion and aeolian accumulation considerably exceeds the results presented in Polish literature so far. This is probably related to the duration of a strong, gusty wind that lasted for four days. Sandy accumulative forms were created in the immediate vicinity of deflation areas. The finest material was blown away.
Crop rotation used by farmers means that aeolian erosion may occur in a given year on a given field surface, and in the following year, mineral material blown from the neighboring field can be accumulated in the winter crop. This affects the even course of aeolian erosion over a larger area. Aeolian transport which took place in the analyzed areas caused the accumulation of aeolian covers with the largest surfaces and thickness. Aeolian covers negatively affected the growth of vegetation in the spring season, which could have deteriorated crop yields. Small areas of fields subject to deflation constituted the source of transport of a large amount of mineral material.
The results of research from agricultural land obtained directly after sediment accumulation indicate that the soils in agricultural fields near Szamocin are very susceptible to being blown away. Deflation took place even at the wind speed of 4 m·s−1 (IMWM Piła station). Areas built of sandy sediments, not only used for agricultural purposes, form an ideal place for the occurrence of deflation. Climatic changes which have been intensifying in the recent decade include the change in temperature and humidity. In countries with farming-base economies, climatic changes will lead to the loss of crops. The intensifying phenomena connected to aeolian processes should undergo in-depth examination, during and after the occurrence of aeolian processes, to increase knowledge on this subject.

Author Contributions

Conceptualization, M.H. and M.R.; Methodology, M.H.; Formal Analysis, M.H.; Data Curation, M.W.; Writing—Original Draft Preparation, M.H. and M.R.; Writing—Review and Editing, M.H. and M.R.; Visualization, M.R. and A.K.

Funding

The APC was funded by the Polish Ministry of Science (Project Supporting Maintenance of Research Potential of the Department of Physical Education. Health and Tourism at Kazimierz Wielki University No. BS/2016/N1).

Acknowledgments

Hydrometeorological data was obtained from the Institute of Meteorology and Water Management, National Research Institute in Warsaw. We would like thank anonymous reviewers. Their comments were very important and helped to improve the manuscript.

Conflicts of Interest

The authors declare no conflict of interest.

References

  1. Goudie, A.; Middleton, N.J. Desert Dust in the Global System; Springer: Berlin/Heidelberg, Germany, 2006; ISBN 978-3-540-32355-6. [Google Scholar]
  2. Bullard, J.E.; Baddock, M.; Bradwell, T.; Crusius, J.; Darlington, E.; Gaiero, D.; Gassó, S.; Gisladottir, G.; Hodgkins, R.; McCulloch, R.; et al. High Latitude Dust in the Earth System. Rev. Geophys. 2016, 54, 447–485. [Google Scholar] [CrossRef]
  3. Dagsson-Waldhauserova, P.; Arnalds, O.; Olafsson, H. Long-term variability of dust events in Iceland. Atmos. Chem. Phys. 2014, 14, 13411–13422. [Google Scholar] [CrossRef]
  4. Arnalds, O.; Dagsson-Waldhauserova, P.; Olafsson, H. The Icelandic volcanic aeolian environment: Processes and impacts—A review. Aeolian Res. 2016, 20, 176–195. [Google Scholar] [CrossRef]
  5. Lee, J.A.; Gill, T.E. Multiple causes of wind erosion in the Dust Bowl. Aeolian Res. 2015, 19, 15–36. [Google Scholar] [CrossRef]
  6. Yang, B.; Bra, A.; Zhang, Z.; Dong, Z.; Esper, J. Dust storm frequency and its relation to climate changes in Northern China during the past 1000 years. Atmos. Environ. 2007, 41, 9288–9299. [Google Scholar] [CrossRef]
  7. Al-Dabbas, M.; Abbas, M.A.; Al-Khafaji, R. The mineralogical and micro-organisms effects of regional dust storms over Middle East Region. Int. J. Water Res. Arid Environ. 2011, 1, 129–141. [Google Scholar]
  8. Sissakian, V.K.; Al-Ansari, N.; Knutsson, S. Sand and dust storm events in Iraq. Nat. Sci. 2013, 5, 1084–1094. [Google Scholar] [CrossRef]
  9. Griffin, D.W. Atmospheric movement of microorganisms in clouds of desert dust and implications for human health. Clin. Microbiol. Rev. 2007, 20, 459–477. [Google Scholar] [CrossRef] [PubMed]
  10. Schweitzer, M.D.; Calzadilla, A.S.; Salamo, O.; Sharifi, A.; Kumar, N.; Holt, G.; Mirsaeidi, M. Lung health in era of climate change and dust storms. Environ. Res. 2018, 163, 36–42. [Google Scholar] [CrossRef] [PubMed]
  11. Rashki, A.; Kaskaoutis, D.G.; Francois, P.; Kosmopoulos, P.G.; Legrand, M. Dust-storm dynamics over Sistan region, Iran: Seasonality, transport characteristics and affected areas. Aeolian Res. 2015, 16, 35–48. [Google Scholar] [CrossRef]
  12. Pullen, A.; Kapp, P.; McCallister, A.T.; Chang, H.; Gehrels, G.E.; Garzione, C.N.; Ding, L. Qaidam Basin and northern Tibetan Plateau as dust sources for the Chinese Loess Plateau and paleoclimatic implications. Geology 2011, 39, 1031–1034. [Google Scholar] [CrossRef]
  13. Huneeus, N.; Basart, S.; Fiedler, S.; Morcrette, J.-J.; Benedetti, A.; Mulcahy, J.; Terradellas, E.; Pérez García-Pando, C.; Pejanovic, G.; Nickovic, S.; et al. Forecasting the northern African dust outbreak towards Europe in April 2011: A model intercomparison. Atmos. Chem. Phys. 2016, 16, 4967–4986. [Google Scholar] [CrossRef]
  14. Hladil, J.; Strnad, L.; Šálek, M.; Jankovská, V.; Šimandl, P.; Schwarz, J.; Smolík, J.; Lisá, L.; Koptíková, L.; Rohovec, J.; et al. An anomalous atmospheric dust deposition event over Central Europe, 24 March 2007, and fingerprinting of the SE Ukrainian source. Bull. Geosci. 2008, 83, 175–206. [Google Scholar] [CrossRef]
  15. Zolotokrylin, A.N. Dry winds, dust storms and prevention of damage to agricultural land. In Natural Disasters; Kotlyakov, V.M., Ed.; Encyclopedia of Life Support Systems (EOLSS): Paris, France, 2010; Volume II, pp. 1–18. [Google Scholar]
  16. Sandstorm Causes Deadly Autobahn Crash. Available online: http://www.spiegel.de/international/germany/mass-pileup-in-northern-germany-sandstorm-causes-deadly-autobahn-crash-a-755945.html (accessed on 9 January 2019).
  17. Germany: Freak Sandstorm Causes Deadly Motorway Pile-up. Available online: https://www.bbc.com/news/world-europe-13023407 (accessed on 9 January 2019).
  18. Švehlik, R. Aeolian erosion at foot of the White Carpathians. In Vistuliańsko-Holoceńskie Zjawiska I Procesy Eoliczne (Wybrane Zagadnienia); Nowaczyk, B., Szczypek, T., Eds.; Stowarzyszenie Geomorfologów Polskich: Poznań, Poland, 1994; pp. 69–75. ISBN 83-902295-5-2. [Google Scholar]
  19. Wojtanowicz, J. Contemporary Aeolian Processes; UMCS Press: Lublin, Poland, 2010; ISBN 978-83-227-3144-4. [Google Scholar]
  20. Stefanski, R.; Sivakumar, M.V.K. Impacts of Sand and Dust Storms on Agriculture and Potential Agricultural Applications of a SDSWS. IOP Conf. Ser. Earth Environ. Sci. 2016, 7. [Google Scholar] [CrossRef]
  21. Fullen, M.A. Wind erosion of arable soils in East Shropshire (England) during spring 1983. Catena 1985, 12, 111–120. [Google Scholar] [CrossRef]
  22. Švehlik, R. Influence of anthropogenous activities on the spread of wind erosion. In Nature Use in the Different Conditions of Human Impact; Jankowski, A.T., Pirozhnmik, I.I., Eds.; University of Silesia Press in Katowice: Sosnowiec, Poland, 2000; pp. 85–90. [Google Scholar]
  23. Goossenss, D.; Gross, J. Similarities and dissimilarities between the dynamics of sand and dust during wind erosion of loamy sand soil. Catena 2002, 47, 269–289. [Google Scholar] [CrossRef]
  24. Goossenss, D.; Gross, J.; Spaan, W. Aeolian dust dynamics in agricultural land areas in Lower Saxony, Germany. Earth Surf. Proc. Land 2001, 26, 701–720. [Google Scholar] [CrossRef]
  25. O’Loingsigh, T.; McTainsh, G.H.; Tapper, N.J.; Shinkfield, P. Lost in code: A critical analysis of using meteorological data for wind erosion monitoring. Aeolian Res. 2010, 2, 49–57. [Google Scholar] [CrossRef] [Green Version]
  26. O’Loingsigh, T.; McTainsh, G.H.; Tews, E.K.; Strong, C.L.; Leys, J.F.; Shinkfield, P.; Tapper, N.J. The Dust Storm Index (DSI): A method for monitoring broadscale wind erosion using meteorological records. Aeolian Res. 2014, 12, 29–40. [Google Scholar] [CrossRef]
  27. Goossenss, D.; Nolet, C.; Etyemezian, V.; Duarte-Campos, L.; Bakker, G.; Riksen, M. Field testing, comparison, and discussion of five aeolian sand transport measuring devices operating on different measuring principles. Aeolian Res. 2018, 32, 1–13. [Google Scholar] [CrossRef]
  28. Zobeck, T.M.; Van Pelt, R.S. Wind-induced dust generation and transport mechanics on a bare agricultural field. J. Hazard. Mater. 2006, 132, 26–38. [Google Scholar] [CrossRef] [PubMed]
  29. Asensio, C.; Lozano, F.J.; Gallardo, P.; Giménez, A. Soil wind erosion in ecological olive trees in the Tabernas desert (southeastern Spain): A wind tunnel experiment. Solid Earth 2016, 7, 1233–1242. [Google Scholar] [CrossRef]
  30. Tanner, S.; Katra, I.; Haim, A.; Zaady, E. Short-term soil loss by eolian erosion in response to different rain-fed agricultural practices. Soil Tillage Res. 2016, 155, 49–156. [Google Scholar] [CrossRef]
  31. Wang, X. Mapping the Global Dust Storm Records: Review of Dust Data Sources in Supporting Modeling/Climate Study. Curr. Pollut. Rep. 2015, 1, 82–94. [Google Scholar] [CrossRef] [Green Version]
  32. Zaady, E.; Katra, I.; Shuker, S.; Knoll, Y.; Shlomo, S. Tree Belts for Decreasing Aeolian Dust-Carried Pesticides from Cultivated Areas. Geosciences 2018, 8, 286. [Google Scholar] [CrossRef]
  33. Podsiadłowski, S. The method of measuring wind erosion with deflametron the Wielkopolska-Kujawy Lowland. Rocz. Akad. Rol. W Pozn. 1994, 260, 77–85. [Google Scholar]
  34. Józefaciuk, A.; Józefaciuk, C. Erosion of the Agroecosystems; The State Inspection for Environmental Protection; Library of Environmental Monitoring: Warszawa, Poland, 1995; pp. 1–168. ISBN 83-86676-66-3. [Google Scholar]
  35. Nowaczyk, B. The age of dunes, their granulometric and structural features and the pattern of atmospheric circulation in Poland in the late Vistulian and Holocene. In Geografia; UAM Press: Poznań, Poland, 1986; Volume 28. [Google Scholar]
  36. Nowaczyk, B. Development of dunes and aeolian covers sand in Poland in the Late Vistulian and Holocene. In Polish Geography. Problems, Researches, Application; Chojnicki, Z., Parysek, J., Eds.; Bogucki Wyd. Nauk. S.C.: Poznań, Poland, 2000; pp. 133–152. [Google Scholar]
  37. Nowaczyk, B. A lithological and morphological record of wind activity in Poland in the last 30,000 years. Geogr. J. 2002, 73, 275–311. [Google Scholar]
  38. Jankowski, M. Chronology of dune-forming processes in the Toruń Basin in the light of paleopedological researches. Pol. Geogr. Rev. 2007, 79, 251–269. [Google Scholar]
  39. Rogulska, E.; Hojan, M.; Giętkowski, T.; Krupa, A.; Rurek, M. Characteristic of dune in Emilianowo. J. Health Sci. 2013, 3, 167–172. [Google Scholar]
  40. Rurek, M. Characteristics of the dune in Wybranowo next to Janowiec Wielkopolski. J. Health Sci. 2013, 3, 271–281. [Google Scholar]
  41. Zieliński, P.; Sokołowski, R.J.; Woronko, B.; Jankowski, M.; Fedorowicz, S.; Zaleski, I.; Molodkov, A.; Weckwerth, P. The depositional conditions of the fluvio-aeolian succesion during the last climate minimum based on the examples from Poland and NW Ukraine. Quat. Int. 2014, 386, 30–41. [Google Scholar] [CrossRef]
  42. Woronko, B.; Zieliński, P.; Sokołowski, R.J. Climate evolution during the Pleniglacial and Late Glacial as recorded in quartz grain morphoscopy of fluvial to aeolian successions of the European Sand Belt. Geologos 2015, 21, 89–103. [Google Scholar] [CrossRef] [Green Version]
  43. Gębica, P.; Bluszcz, A.; Woronko, B. Origin and age of dune in the Dąbrowki village (Sandomierz Basin, Wisłok valley) in the light of lithological analysis of sediments and OSL dating. In Selected Issues of Aeolian Geomorphology; Święchowicz, J., Michno, A., Eds.; Institute of Geography and Spatial Management, Jagiellonian University: Kraków, Poland, 2016; pp. 305–330. ISBN 978-83-64089-22-0. [Google Scholar]
  44. Folk, R.L.; Ward, W.C. Brazos River bar: A study in the significance of grain size parameters. J. Sediment. Petrol. 1957, 27, 3–26. [Google Scholar] [CrossRef]
  45. Institute of Meteorology and Water Management [IMWM-PIB]. Synoptic Maps of Europe. 2011. Available online: www.pogodynka.pl (accessed on 4 December 2017).
  46. Kozarski, J.; Szupryczyński, J. The terraces of the Noteć ice-marginal streamway between Nakło and Milicz. Pol. Geogr. Rev. 1958, 30, 671–684. [Google Scholar]
  47. Riksen, M. Off-site effects of wind erosion on agricultural land in Northwestern Europe. In Wind Erosion and Dust Dynamics: Observations, Simulations, Modelling; Goossenss, D., Riksen, M., Eds.; ESW Publications: Wageningen, The Netherlands, 2004; pp. 103–121. ISBN 9067548138. [Google Scholar]
  48. Marcinkowski, P.; Piniewski, M. Climate change effect on sowing and harvest dates of spring barley and maize in Poland. Int. Agrophys. 2018, 32, 265–271. [Google Scholar] [CrossRef]
  49. Mahato, A. Climate Change and its Impact on Agriculture. Int. J. Sci. Res. Publ. 2014, 4, 1–6. [Google Scholar]
  50. Baker, R.H.A.; Sansford, C.E.; Jarvis, C.H.; Cannon, R.J.C.; MacLeod, A.; Walters, K.F.A. The role of climatic mapping in predicting the potential geographical distribution of non-indigenous pests under current and future climates. Agric. Ecosyst. Environ. 2000, 82, 57–71. [Google Scholar] [CrossRef]
  51. Hart, K.; Allen, B.; Keenleyside, C.; Nanni, S.; Maréchal, A.; Paquel, K.; Nesbit, M.; Ziemann, J. Research for Agri Committee—The Consequences of Climate Change for EU Agriculture; Follow-Up to the Cop21—Un Paris Climate Change Conference 2017, Policy Department B: Structural and Cohesion Policies; European Parliament: Brussels, Belgium, 2017; ISBN 978-92-846-0646-7. [Google Scholar]
  52. Bale, J.S.; Masters, G.J.; Hodkinson, I.D.; Awmack, C.; Bezemer, T.M.; Brown, V.K.; Butterfield, J.; Buse, A.; Coulson, J.C.; Farrar, J.; et al. Herbivory in global climate change research: Direct effects of rising temperature on insect herbivores. Glob. Chang. Biol. 2002, 8, 1–16. Available online: https://doi.org/10.1046/j.1365-2486.2002.00451.x (accessed on 27 February 2019). [CrossRef]
  53. Kundzewicz, Z.W.; Piniewski, M.; Mezghani, A.; Okruszko, T.; Pińskwar, I.; Kardel, I.; Hov, Ř.; Szcześniak, M.; Szwed, M.; Benestad, R.E.; Marcinkowski, P.; et al. Assessment of climate change and associated impact on selected sectors in Poland. Acta Geophys. 2018, 66, 1509–1523. [Google Scholar] [CrossRef]
  54. Piniewski, M.; Szcześniak, M.; Huang, S.; Kundzewicz, Z.W. Projections of runoff in the Vistula and the Odra river basins with the help of the SWAT model. Hydrol. Res. 2018, 49, 303–317. [Google Scholar] [CrossRef]
  55. Bindi, M.; Olesen, J.E. The responses of agriculture in Europe to climate change. Reg. Enviorn. Chang. 2011, 11 (Suppl. 1), 151–158. [Google Scholar] [CrossRef]
  56. Audsley, E.; Pearn, K.R.; Simota, C.; Cojocaru, G.; Koutsidou, E.; Rousevell, M.D.A.; Trnka, M.; Alexandrov, V. What can scenario modelling tell us about future European scale agricultural land use, and what not? Environ. Sci. Policy 2006, 9, 148–162. [Google Scholar] [CrossRef] [Green Version]
  57. Borrelli, P.; Ballabio, C.; Panagos, P.; Montanarella, L. Wind erosion susceptibility of European soils. Geoderma 2014, 232–234, 471–478. [Google Scholar] [CrossRef]
  58. Józefaciuk, A.; Józefaciuk, C. Attempt to assess the threat of land in Poland by wind erosion. Pol. J. Agron. (Earlier Pamiętniki Puławskie) 1979, 71, 12–21. [Google Scholar]
  59. Dagsson-Waldhauserova, P.; Arnalds, O.; Olafsson, H.; Skrabalova, L.; Sigurdardottir, G.M.; Branis, M.; Hladil, J.; Skala, R.; Havratil, T.; Chadimova, L.; et al. properties of suspended dust during moist and low wind conditions in Iceland. Icel Agric. Sci. 2014, 27, 25–39. [Google Scholar]
  60. Zhou, X.; Xu, X.; Yan, P.; Weng, Y.; Wang, J. Dynamic characteristics of spring sandstorms in 2000. Sci. China 2002, 45, 921–930. [Google Scholar] [CrossRef]
  61. Labiadh, M.; Bergametti, G.; Kardous, M.; Perrier, S.; Grand, N.; Attoui, B.; Sekrafi, S.; Marticorena, B. Soil erosion by wind over tilled surfaces in South Tunisia. Geoderma 2013, 202–203, 8–17. [Google Scholar] [CrossRef]
  62. Broomandi, P.; Dabir, B.; Bonakdarpour, B.; Rashidi, Y. Identification of dust storm origin in South-West of Iran. J. Environ. Health Sci. Eng. 2017, 15, 16. [Google Scholar] [CrossRef] [PubMed]
  63. Kostrzewski, A.; Szpikowski, J. Seasonal and spatial variation in aeolian fallout and transport in the Młyński Potok catchment. In Integrated Monitoring of the Natural Environment. Base Station Storkowo; Kostrzewski, A., Ed.; Library of Environmental Monitoring: Warszawa, Poland, 1994; pp. 165–184. [Google Scholar]
  64. Stach, A. Sedimentological characteristics of contemporary aeolian covers (Borkowo, Września Plant). Spraw PTPN 1991, 108, 77–81. [Google Scholar]
  65. Kostrzewski, A.; Stach, A.; Szpikowski, J. Aeolian transport and deposit as an index of soil erosion (The Drawsko Lake District, Września Plant). Annales of the Agricultural Academy in Poznan, Poland, 266. Melio Environ. Eng. 1994, 14, 201–209. [Google Scholar]
  66. Nordstrom, K.F.; Hotta, S. Wind erosion from cropland in the USA: A review of problems, solutions and prospects. Geoderma 2004, 121, 157–167. [Google Scholar] [CrossRef]
Figure 1. Research area location against the background of the map of Poland and Europe.
Geosciences 09 00106 g001
Figure 2. Wind direction in days with extreme aeolian processes and in the long-term period of 1978–2017 for IMWM Piła station.
Geosciences 09 00106 g002
Figure 3. Meteorological conditions in days with extreme aeolian processes and over a long period (1978–2017) for IMWM Piła station.
Geosciences 09 00106 g003
Figure 4. Examples of aeolian transport in the research areas: (AD)—Szamocin Field, (E)—Szamoty 2 Field, (F)—Swoboda Field (photos taken on 9 April 2011).
Geosciences 09 00106 g004
Figure 5. Aeolian erosive and accumulative forms in the research fields. (A,B)—traces of aeolian corrasion; (C,D)—deflation surface with aeolian paving; (photos taken on 9 April 2011).
Geosciences 09 00106 g005
Figure 6. Covers and accumulative forms in respective research areas: (A)—Szamocin, (B)—Szamoty 1, (C)—Szamoty 2, (D)—Swoboda. Ranges of covers and accumulative forms were determined based on GPS RTK (Real Time Kinematics) measurements.
Geosciences 09 00106 g006
Figure 7. Aeolian accumulative forms in the research fields. (AC)—aeolian covers; (D,E)—aeolian shadows; (F)—aeolian microshadows; (G,H)—accumulation near shrubs; (photos taken on 9 April, 2011).
Geosciences 09 00106 g007
Figure 8. Aeolian accumulative forms in the research fields. (A,B)—aeolian ripple marks (photos taken on 9 April 2011).
Geosciences 09 00106 g008
Figure 9. Aeolian accumulative forms in the research fields. (A)—drift; (B)—accumulation near trees (reduced); (C)—increased accumulation near shrubs (photos taken on 9 April, 2011).
Geosciences 09 00106 g009
Figure 10. Diagram of aeolian forms formed on croplands.
Geosciences 09 00106 g010
Figure 11. Summary of the average grain size (D50) and sorting (Mz) for samples collected from fields near Szamocin.
Geosciences 09 00106 g011
Table 1. Meteorological data for days with a dust storm for IMWM Piła station. For precipitation, data is available every 6 h.
Temperature [°C]Humidity [%]Wind Speed [m·s−1]Wind Gust [m·s−1]Wind Direction [°]Precipitation [mm]
Days of April
Hours789107891078910789107891078910
012.27.67.53966771723661-1211-2492942922800.1---
112.77.37.22.7957070754652912--258293299280----
2137.16.92.3947269773652-11--257305299290----
313.276.21.4937271843752-14--255306293300----
413.26.95.60.9937474863542-0--241302293290----
513.46.95.72.6927573784552-12--246299289290----
612.96.96.75.1947469684653-12--226300311325----
713.96.97.76.6917561624565----235290328336----
815.6798.582765256555510-10-255290341328----
917.67.49.610.374794549655611-1012260280344333----
1019.87.310.512.1518541466576--1311277270336329----
1119.28.110.813.545783844957615-1211280270330332----
1214.69.110.813.5736939437668121211132882603433280.3---
1313.311.410.613.47763384088761516-12288273338327----
1412.21211.512.983643633764512139-289270342360----
1511.412.710.911.87063363557651114-10304290332353----
1611.111.99.811.4606439435964-18--3012903308----
1710.510.69.610.86060415169531315--297300333349----
189.810.27.49.65365505678221316--298299290100.2---
199.4105.28.15766616078211416--29629527010----
209.19.34.86.15969636876221213--294296270329----
218.78.73.956070677377211212--296306270306----
228.38.53.74.86368667677211215--294299270306----
237.983.75.16570677475211310--292300280246----
Table 2. Morphometric and volumetric characteristics of accumulative forms in the research area.
Place of SamplingLength [m]Width [m]Surface [m2]Average Thickness [m]Min Thickness [m]Max Thickness [m]Amount of Material in Form [m3]Total Amount of Material in Form [t]Weight of Material in Form [t/km−2]
Szamocin Field (area 8.5 ha)
tongue30175100.0250.020.0312.7519.0372.5
rut501.2600.0850.070.15.17.601266.5
hump between ruts500.6300.040.020.061.21.8596.0
winter crop strip5031500.0250.020.033.75.6372.5
Szamoty 1 Field (area 2.4 ha)
aeolian cover10022000.040.020.06811.9596.0
Szamoty 2 Field (area 3.6 ha)
aeolian cover480838400.060.040.08230.4343.3894.0
Swoboda Field (area 6.6 ha)
drift 10.750.50.3750.190.140.240.070.12831.0
drift 262.55312.50.050.040.0615.623,9745,0
cover in ditch12522500.10.070.1325.037,21490,0
Average35.550.041018.0
Actual accumulation (sum of sediments from all forms)336.12450.49164.0
Table 3. Parameters of granulation of collected samples.
Research FieldSample NumberMean Grain Diameter (phi)Sorting (phi)Sorting (phi)
Szamocin Field82.571.344poorly
92.540.403well
102.480.858moderately
112.440.832moderately
240.921.366poorly
411.911.57poorly
430.951.35poorly
442.610.697moderately well
452.331.431poorly
462.660.492well
472.590.554moderately well
12.241.165poorly
21.850.998moderately
32.320.903moderately
42.400.896moderately
52.570.658moderately well
62.800.435well
72.640.384well
303.170.708moderately
313.060.409well
323.040.394well
332.740.861moderately
342.910.793moderately
352.850.685moderately well
Szamoty Field 1122.170.704moderately
132.510.599moderately well
141.750.625moderately well
152.390.602moderately well
161.840.858moderately
172.300.892moderately
182.670.644moderately well
192.090.734moderately
202.240.594moderately well
Szamoty Field 2482.570.84moderately
492.521.463poorly
Swoboda Field212.880.427well
222.860.569moderately well
231.380.976moderately
242.251.471poorly
252.610.887moderately
262.870.427well
272.990.441well
282.930.434well
501.520.889moderately
512.770.456well

