Quantitative Hazard Assessment of Landslides Using the Levenburg–Marquardt Back Propagation Neural Network Method in a Pipeline Area


Abstract
1. Introduction
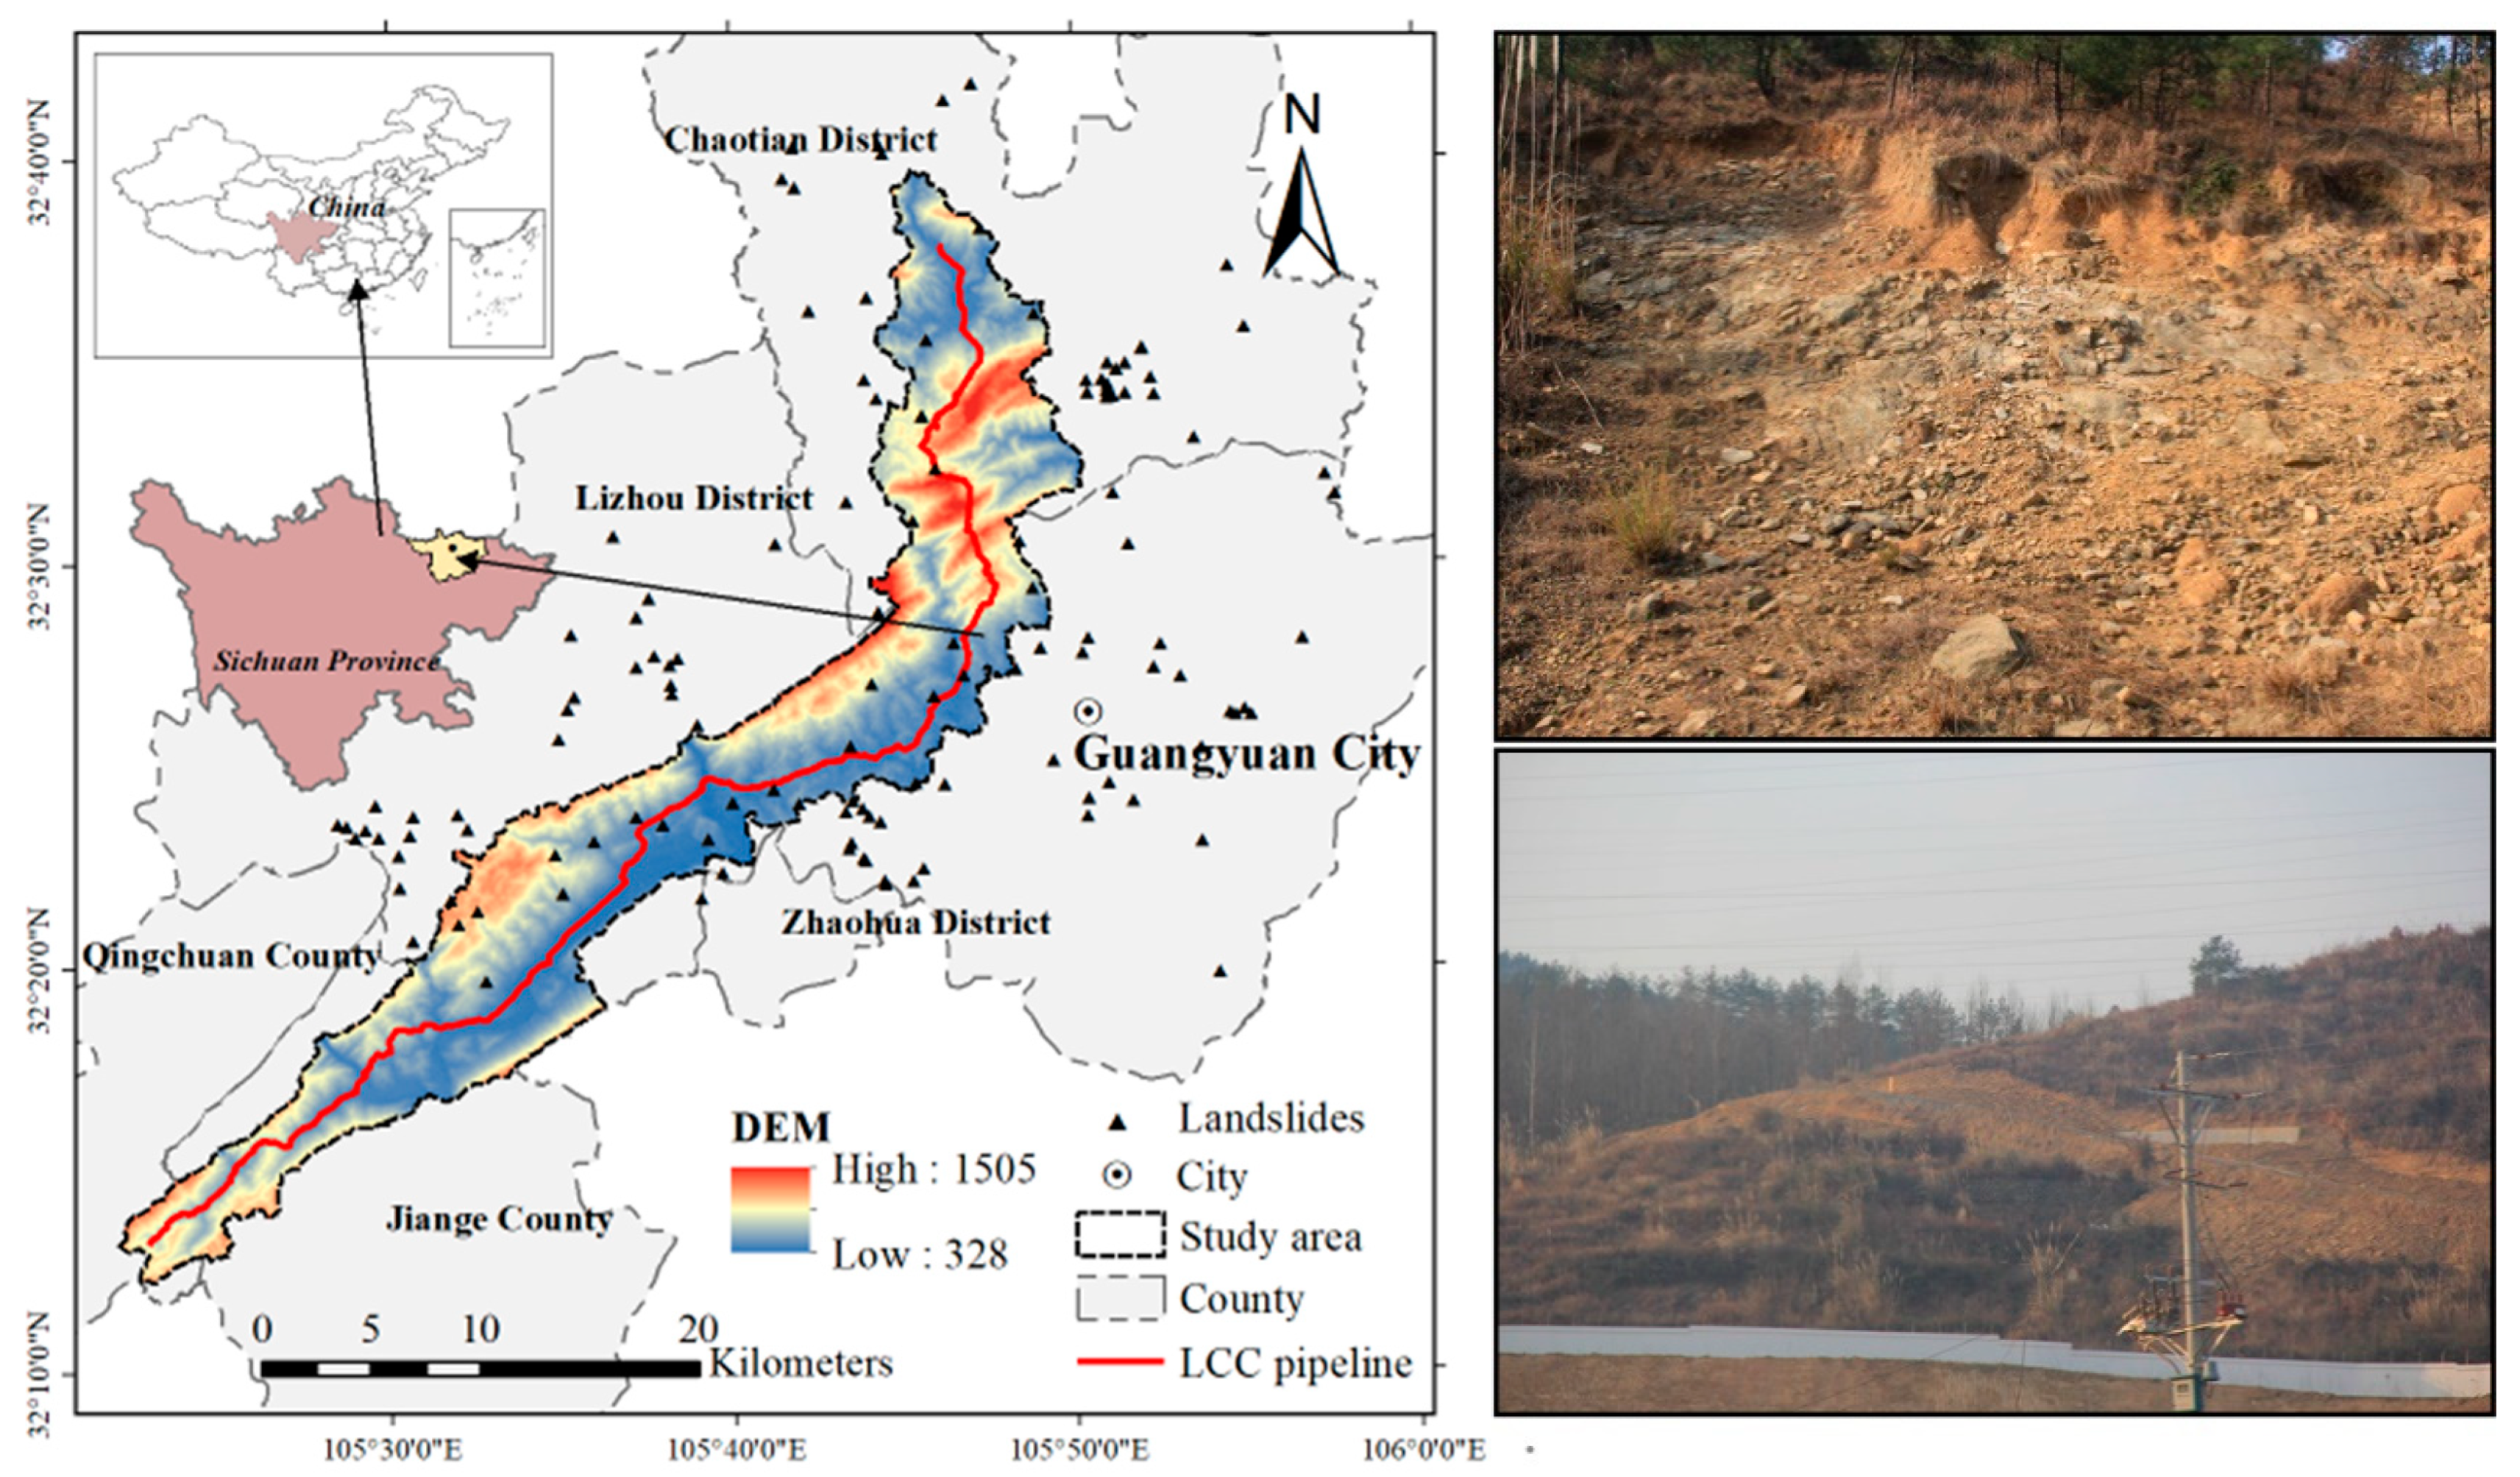
2. Study Area
3. Data Sources
4. Methods
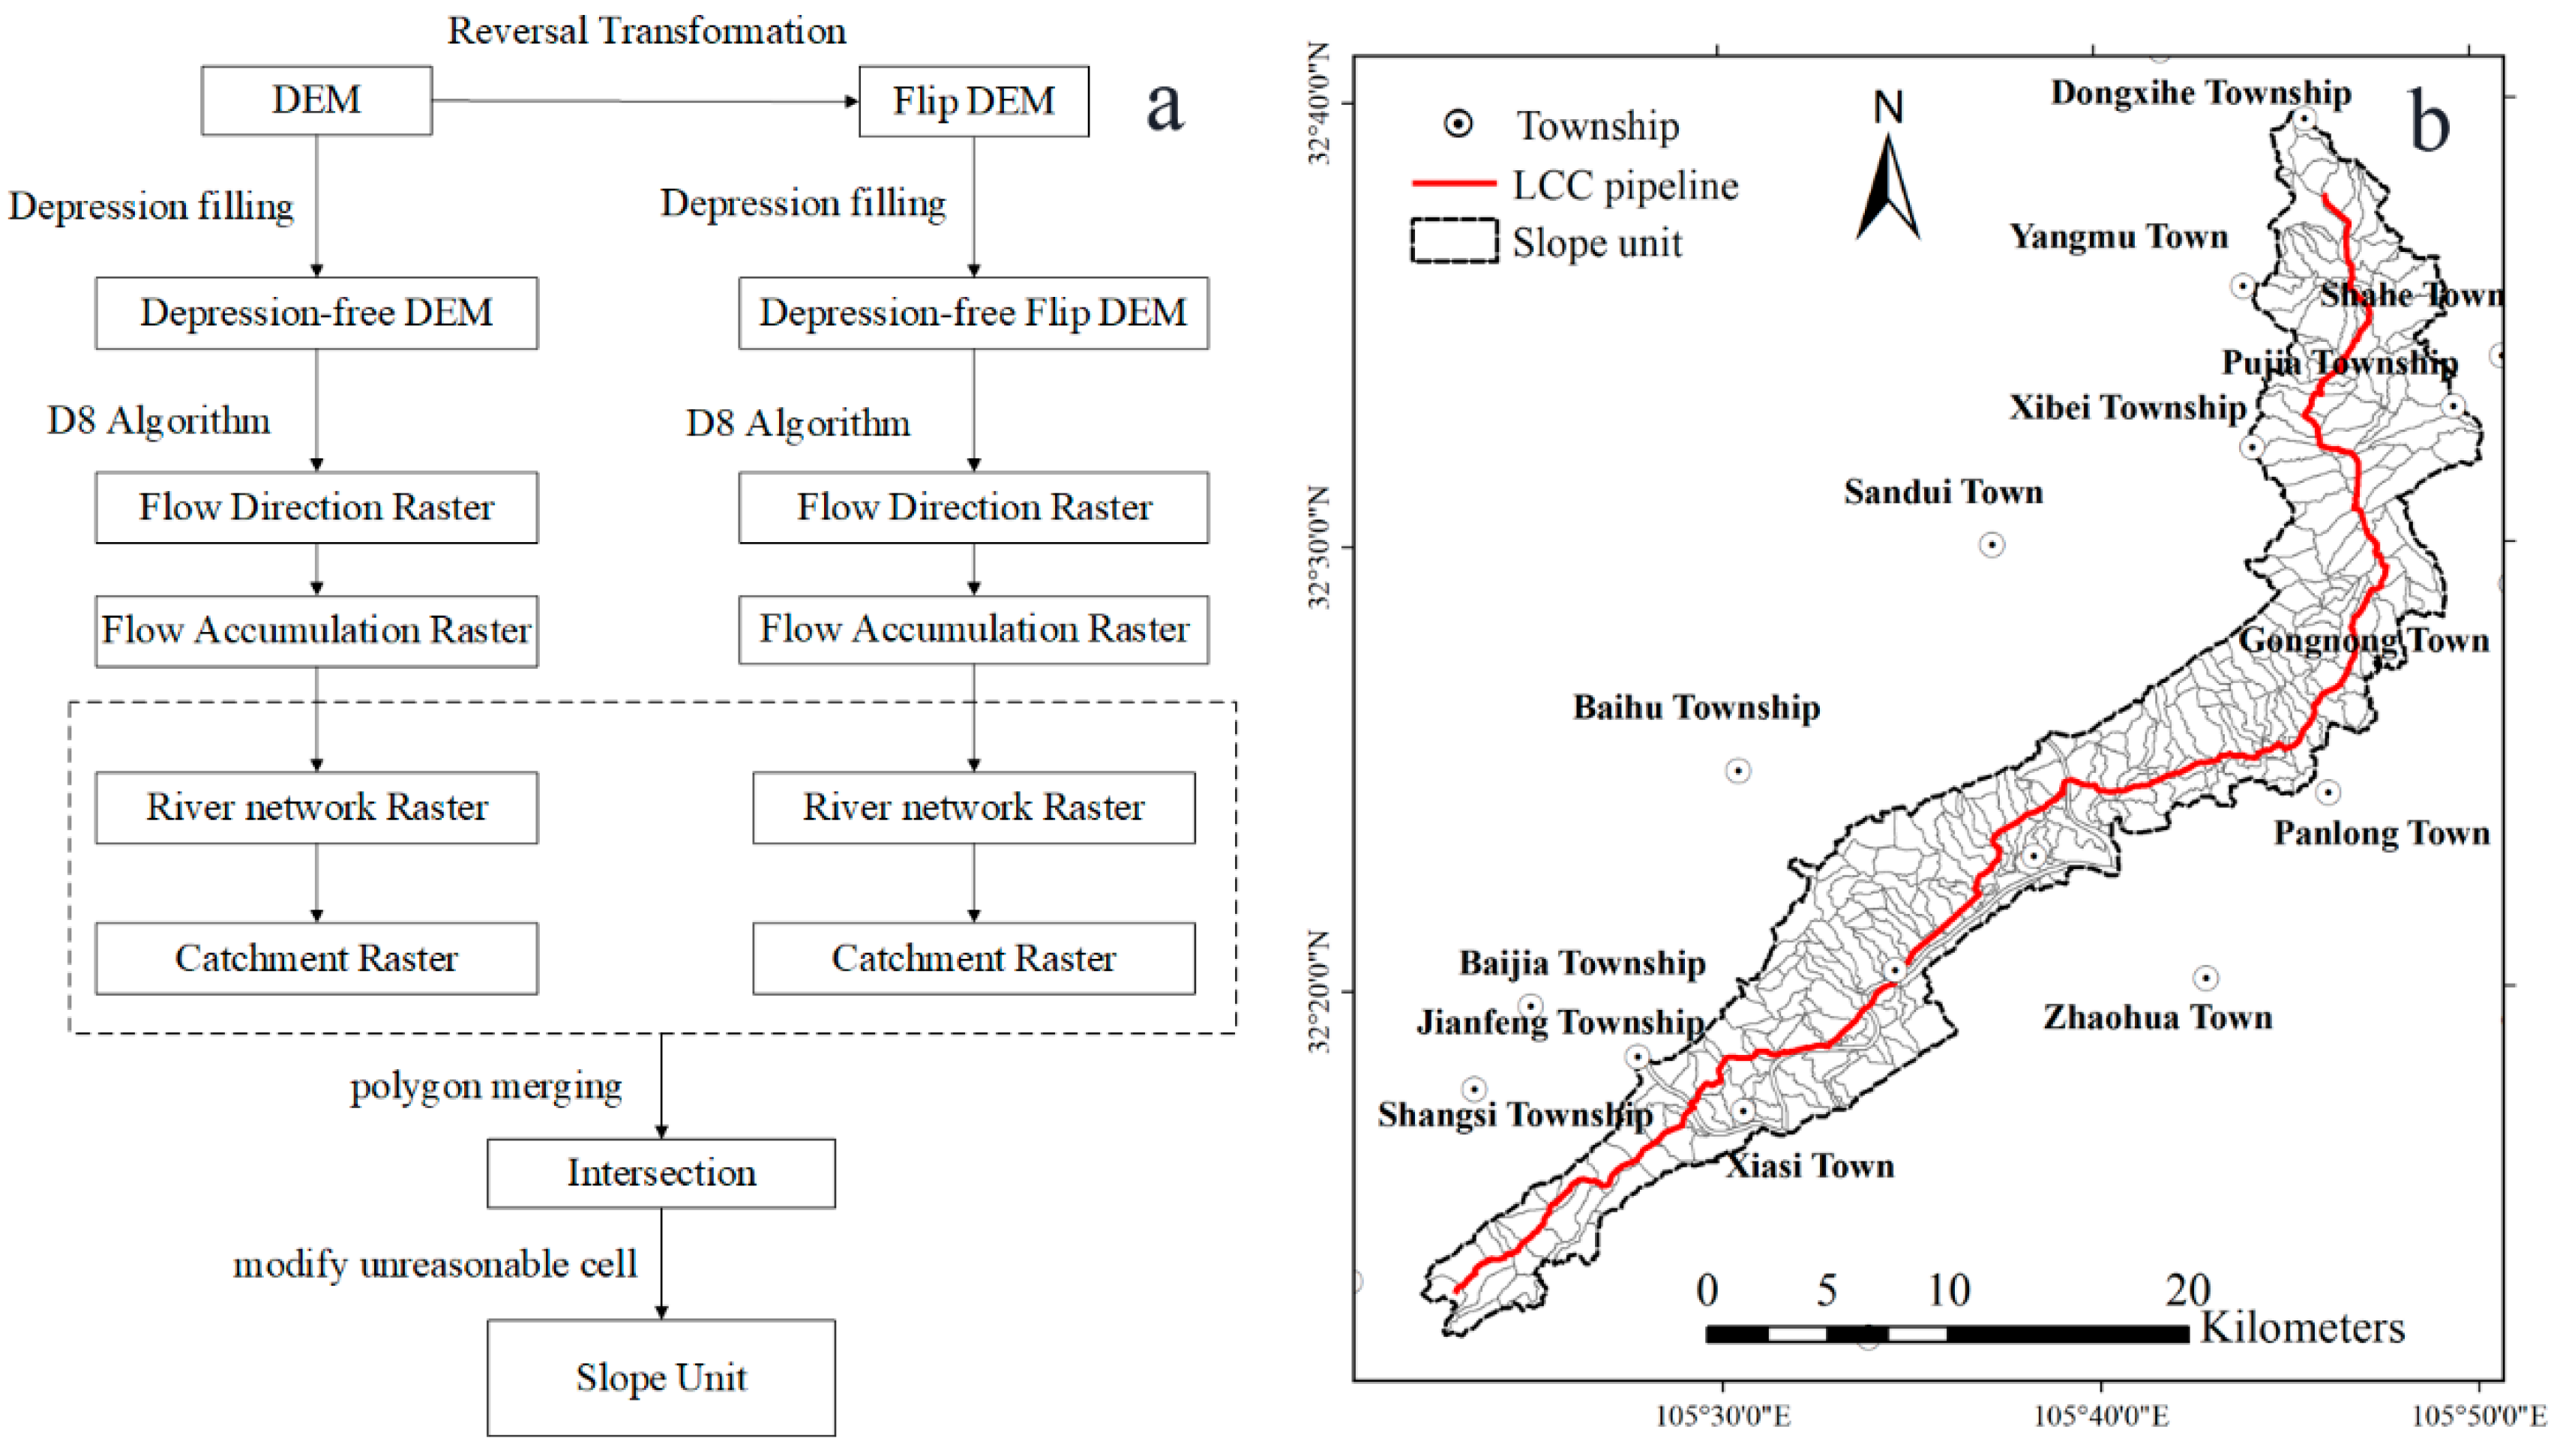
4.1. Assessment Unit
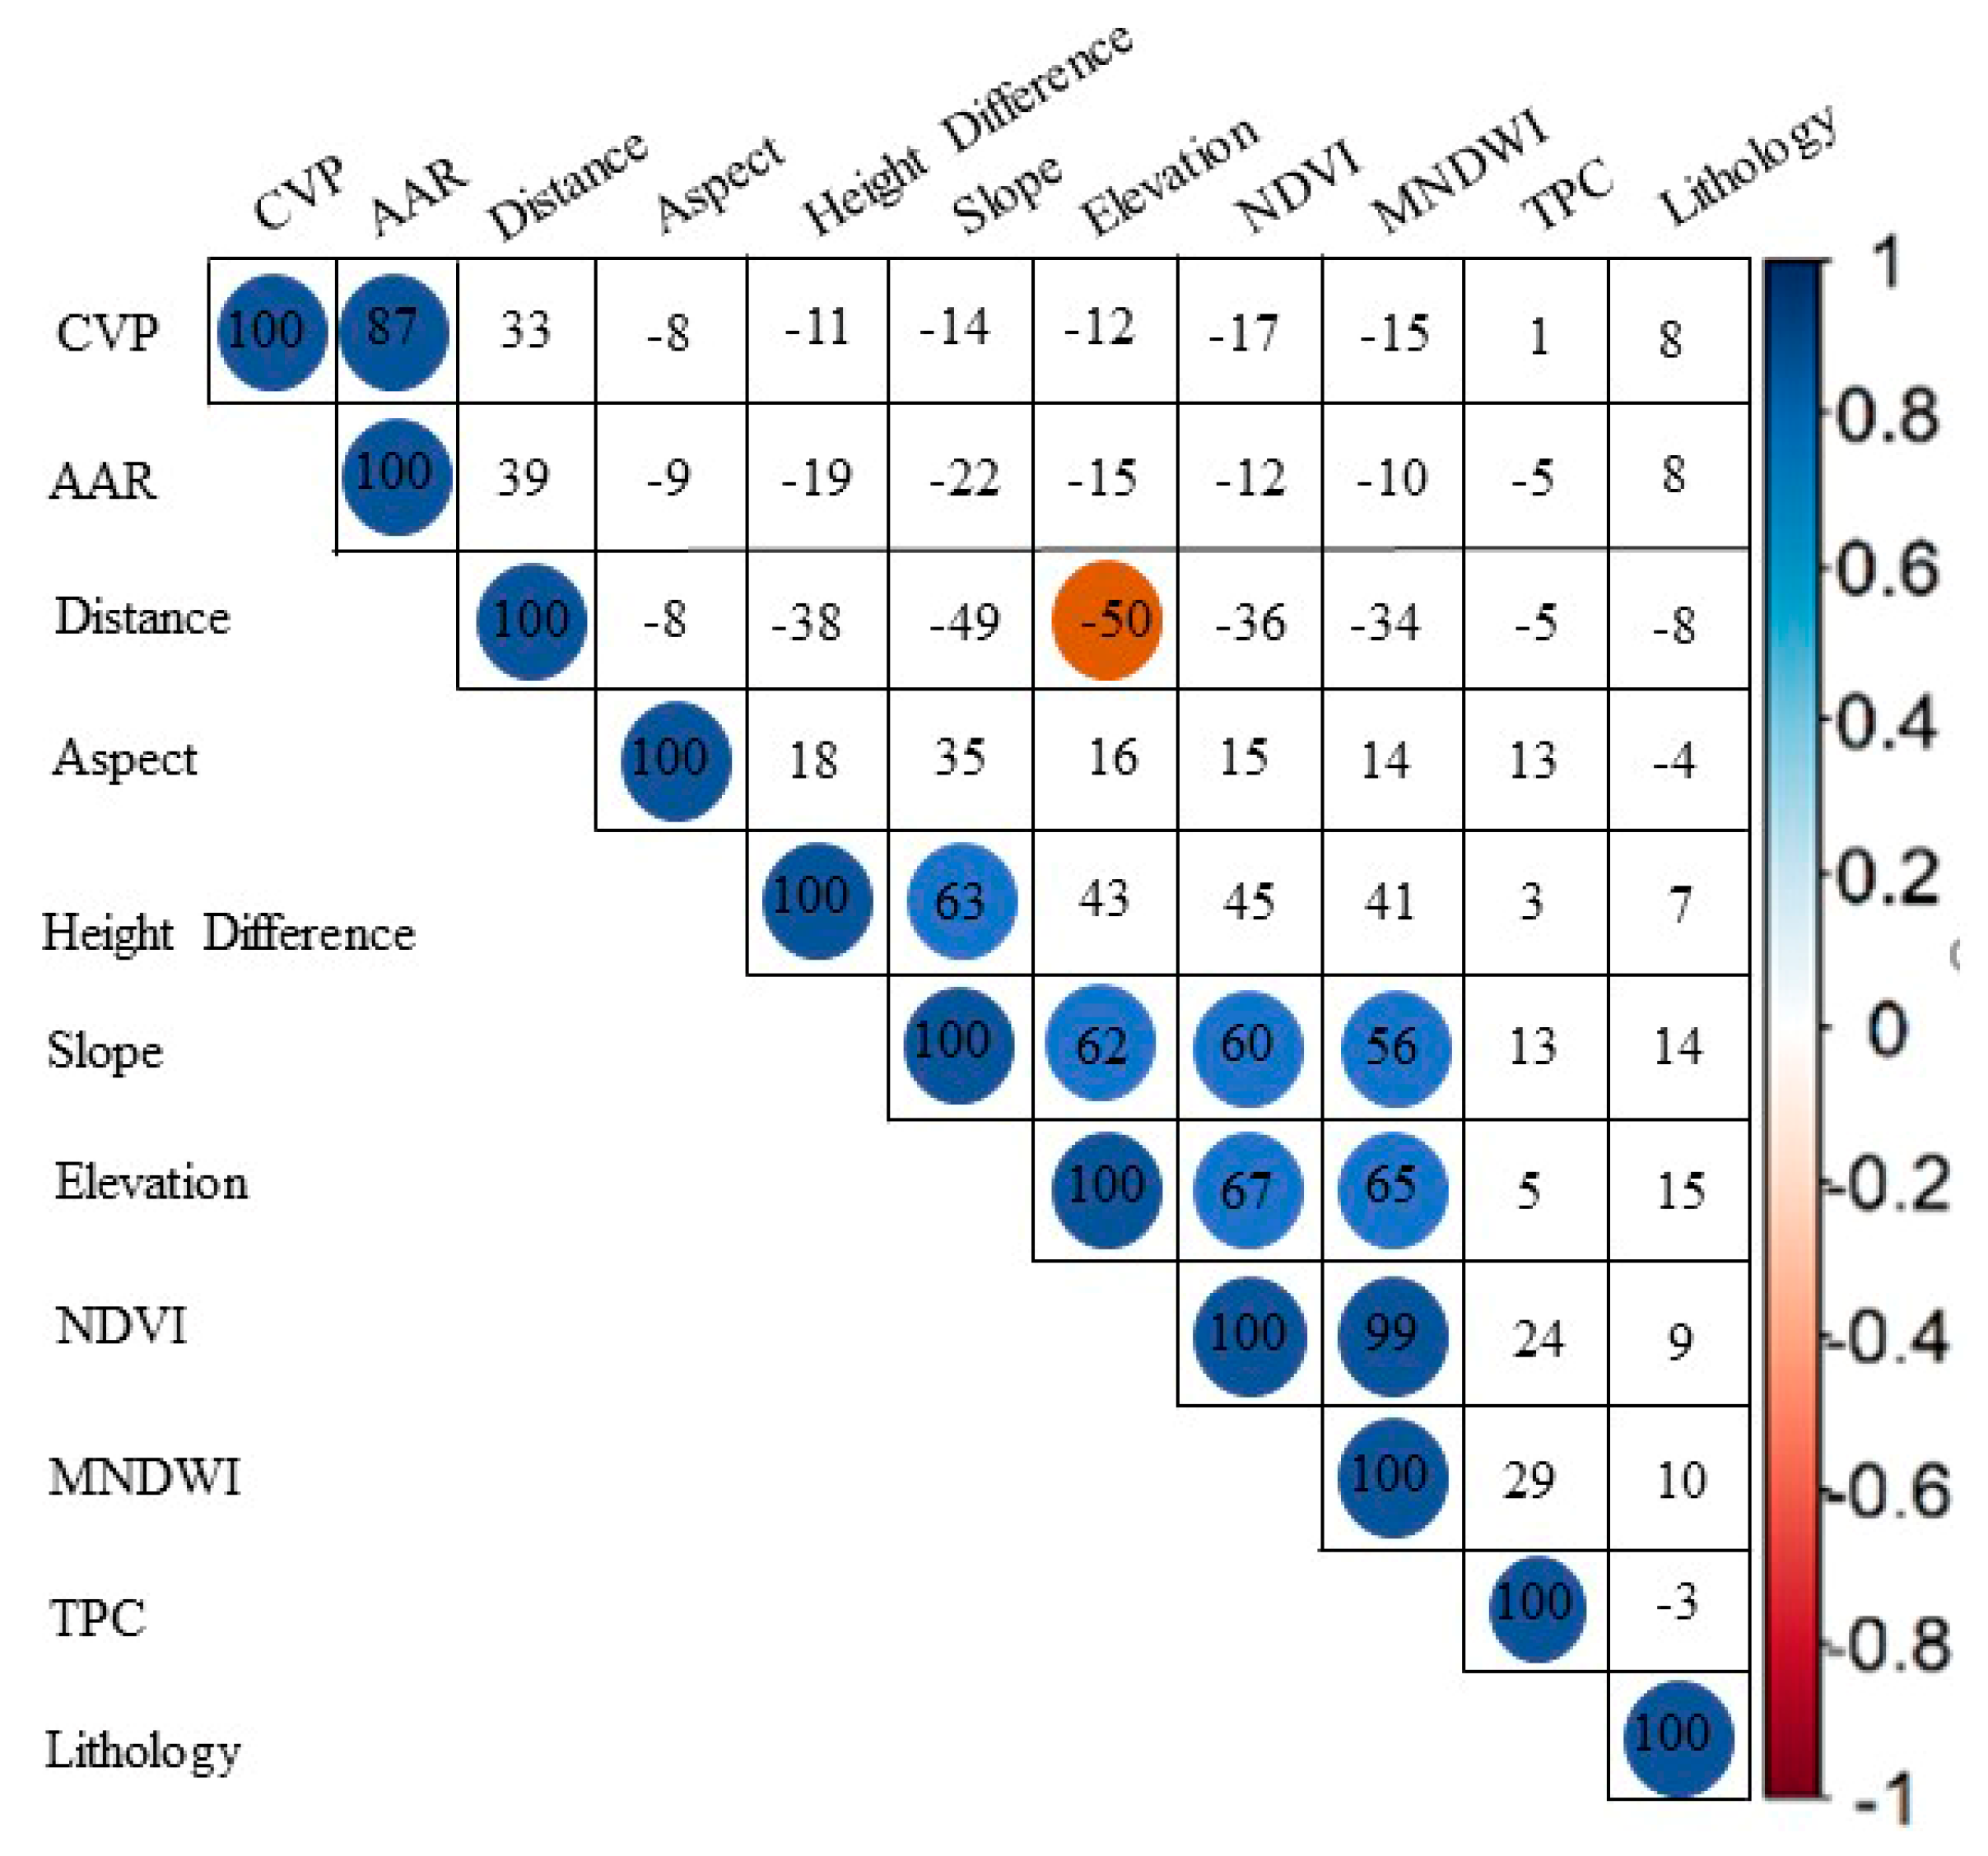
4.2. Assessment Factors
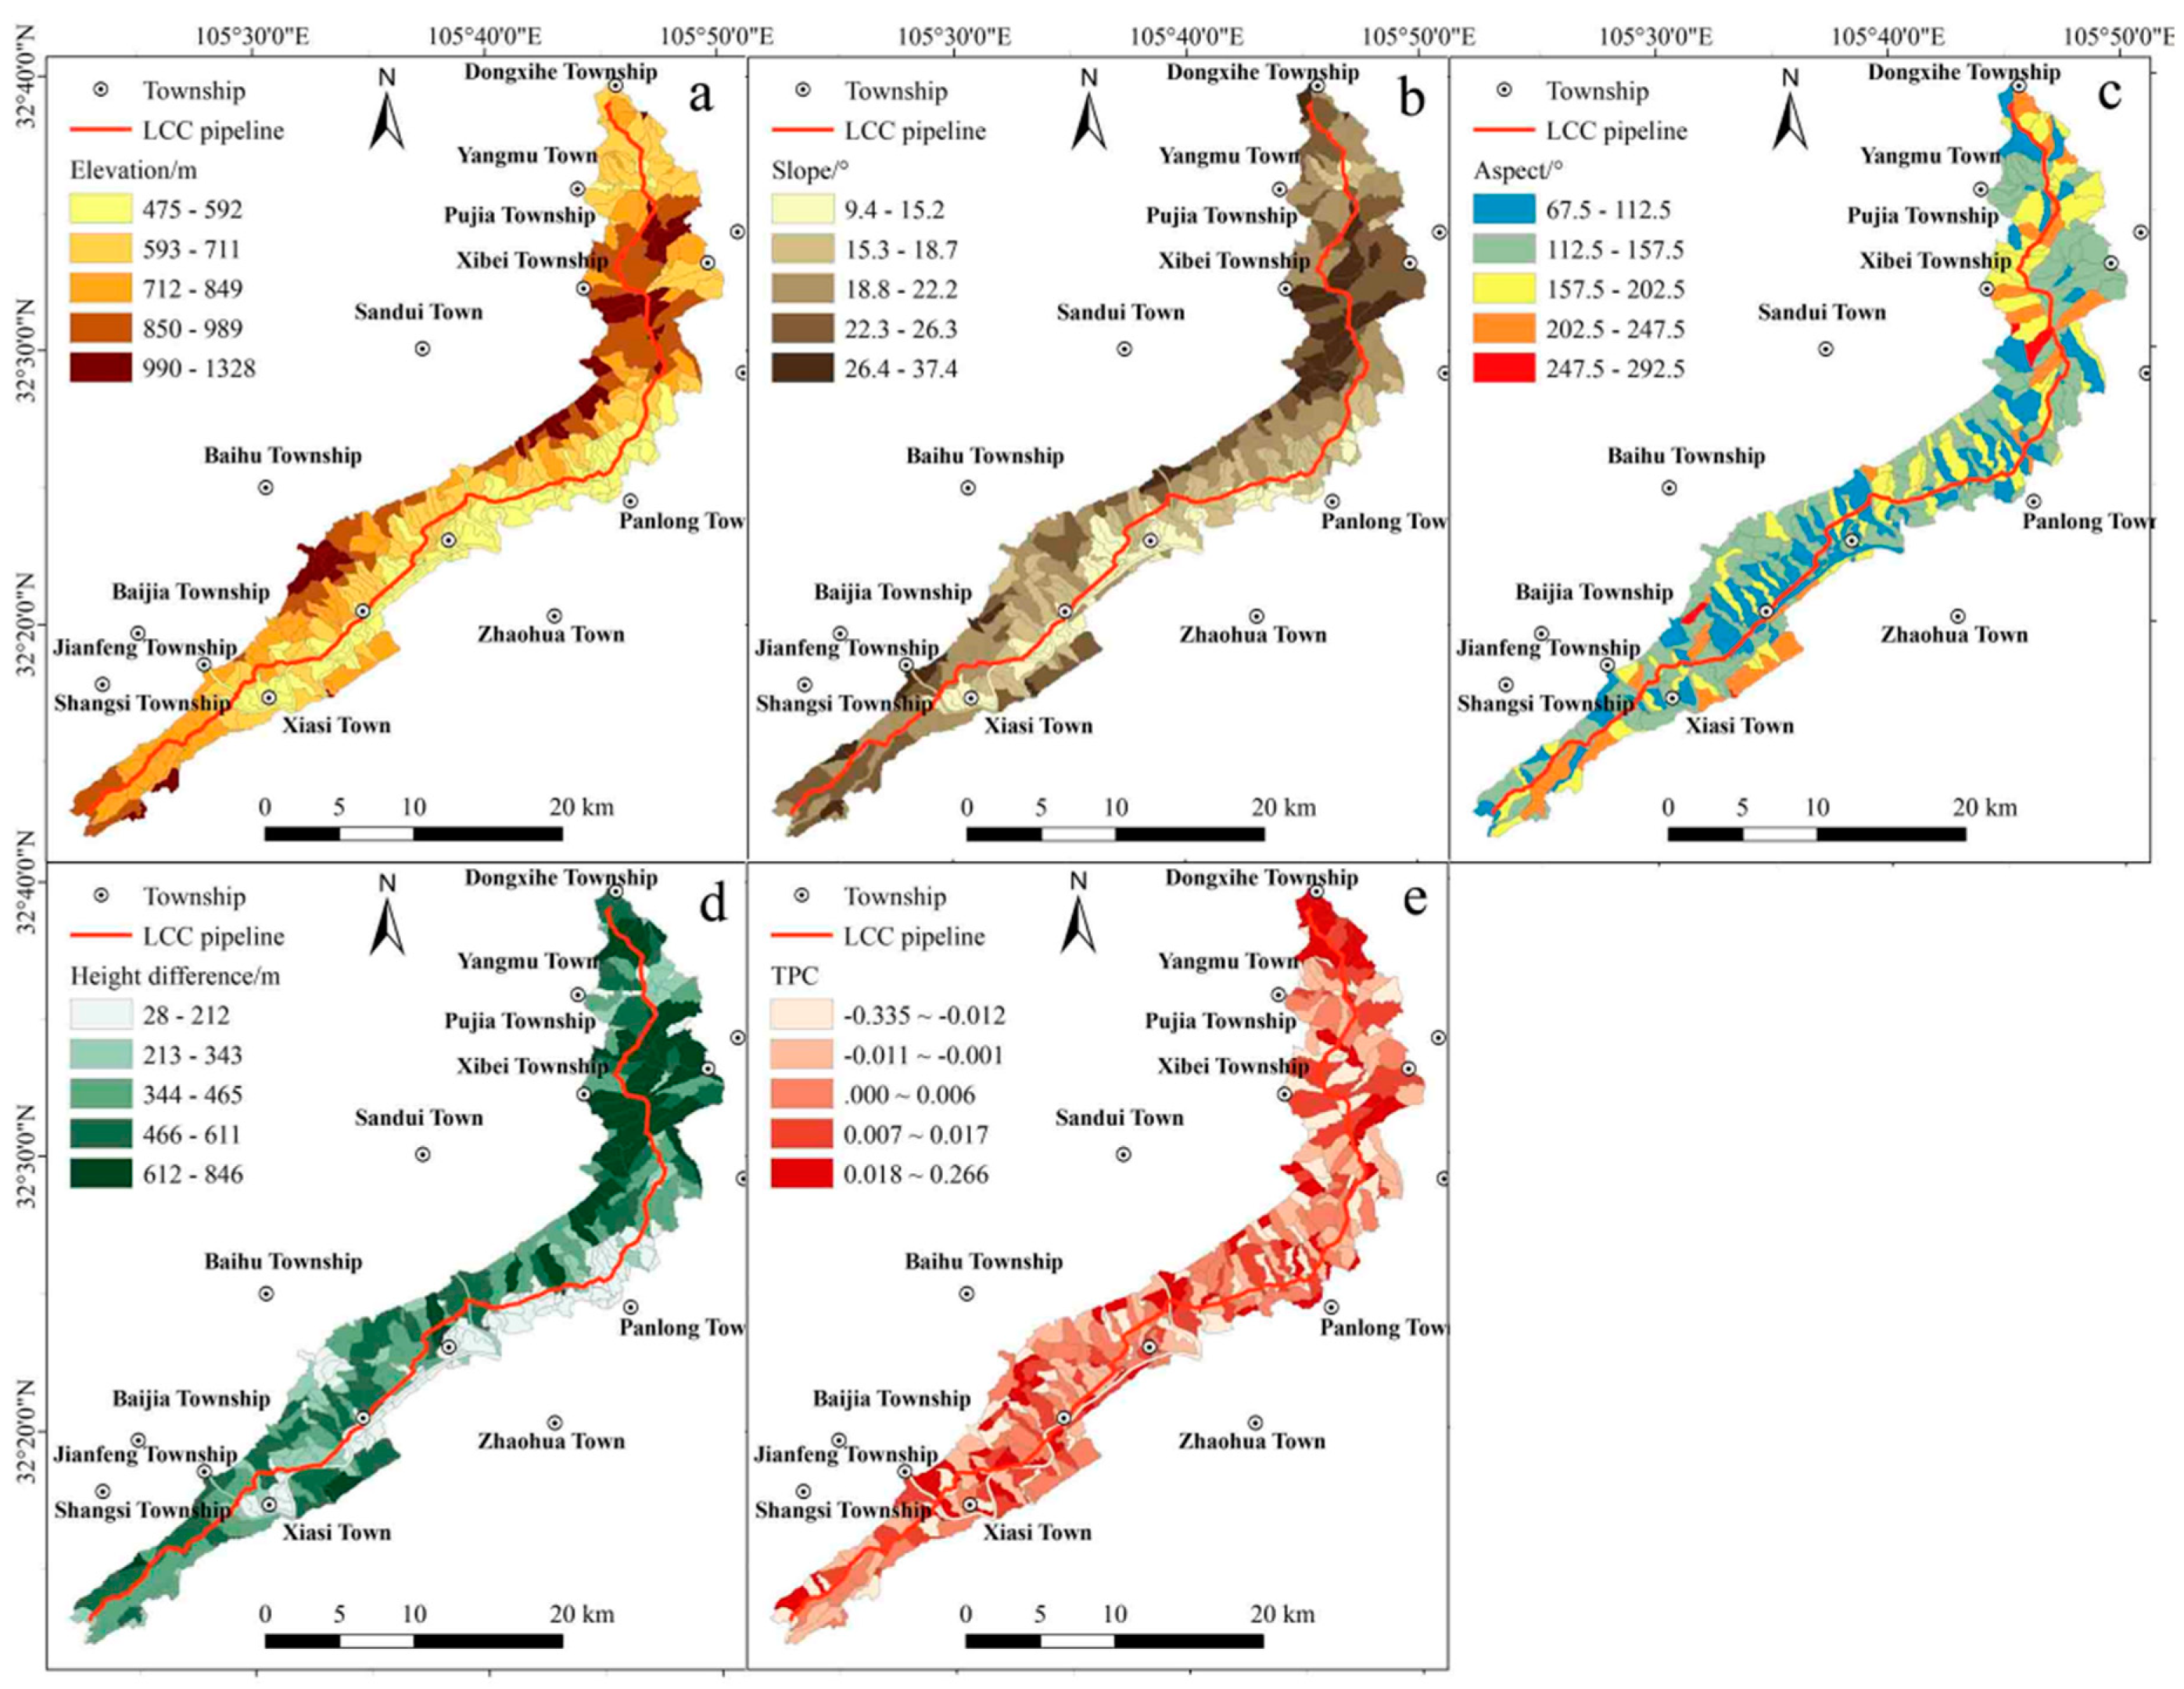
4.2.1. Landform
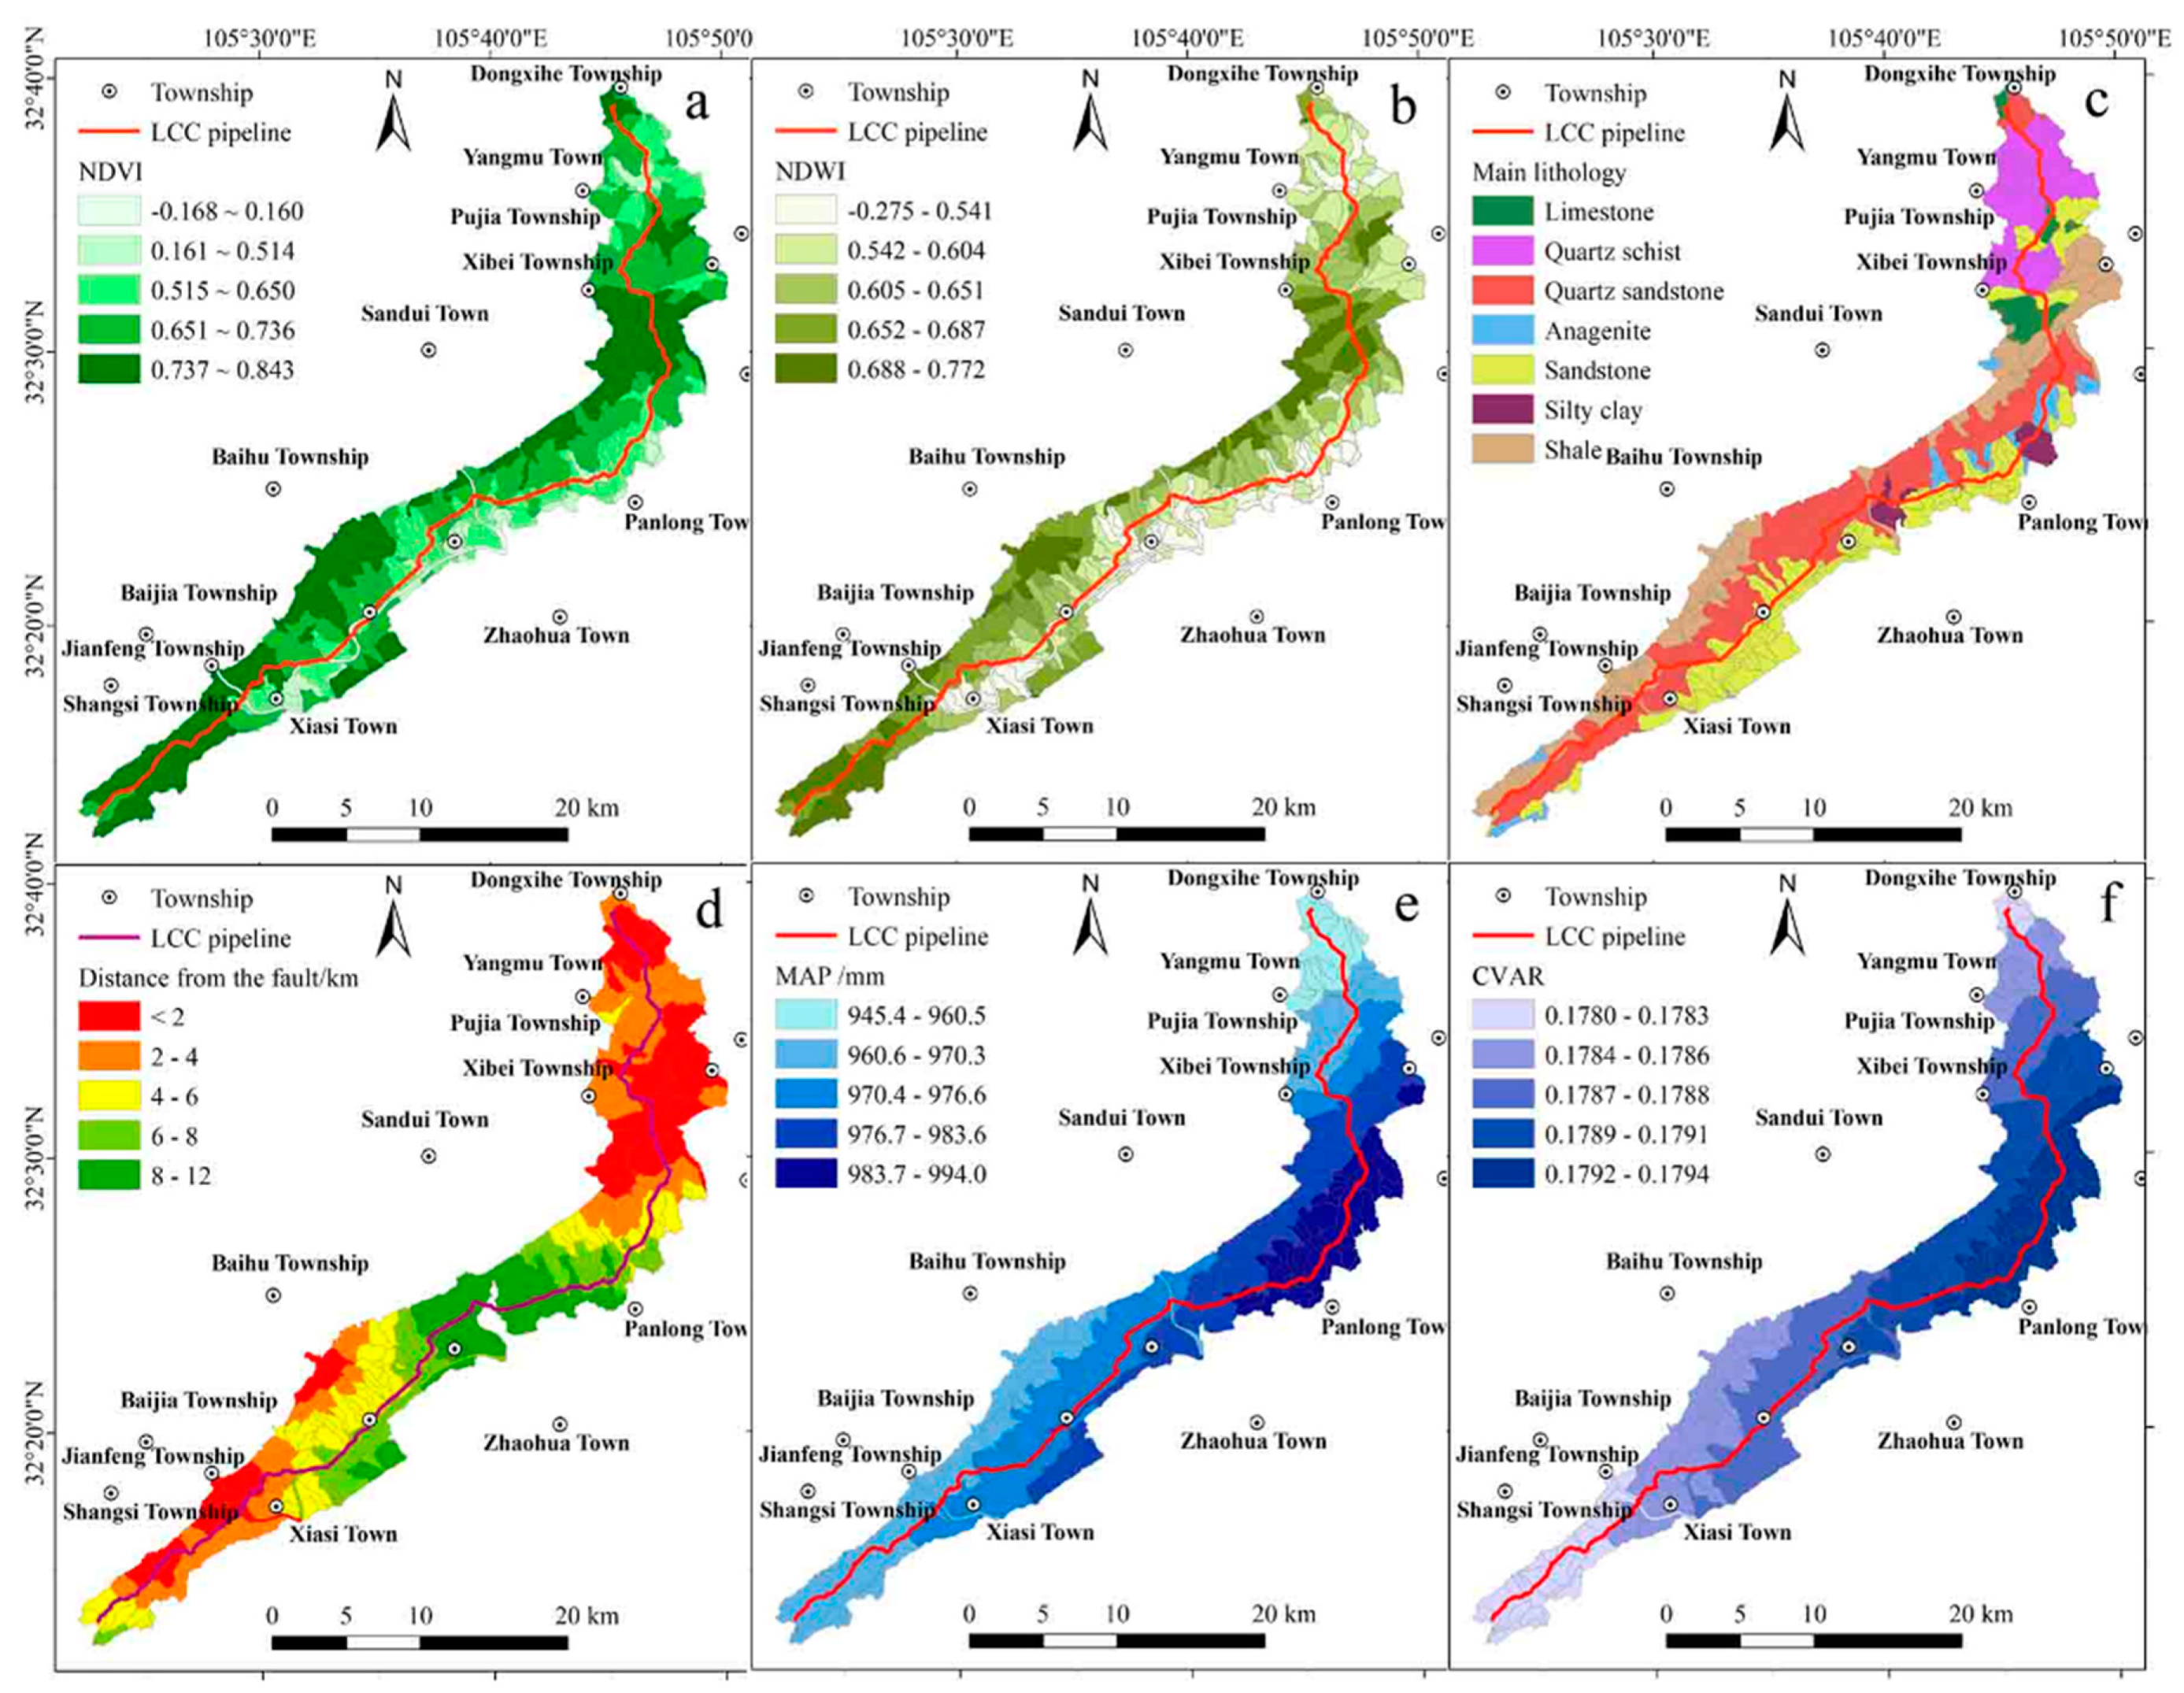
4.2.2. Land Cover
4.2.3. Geology
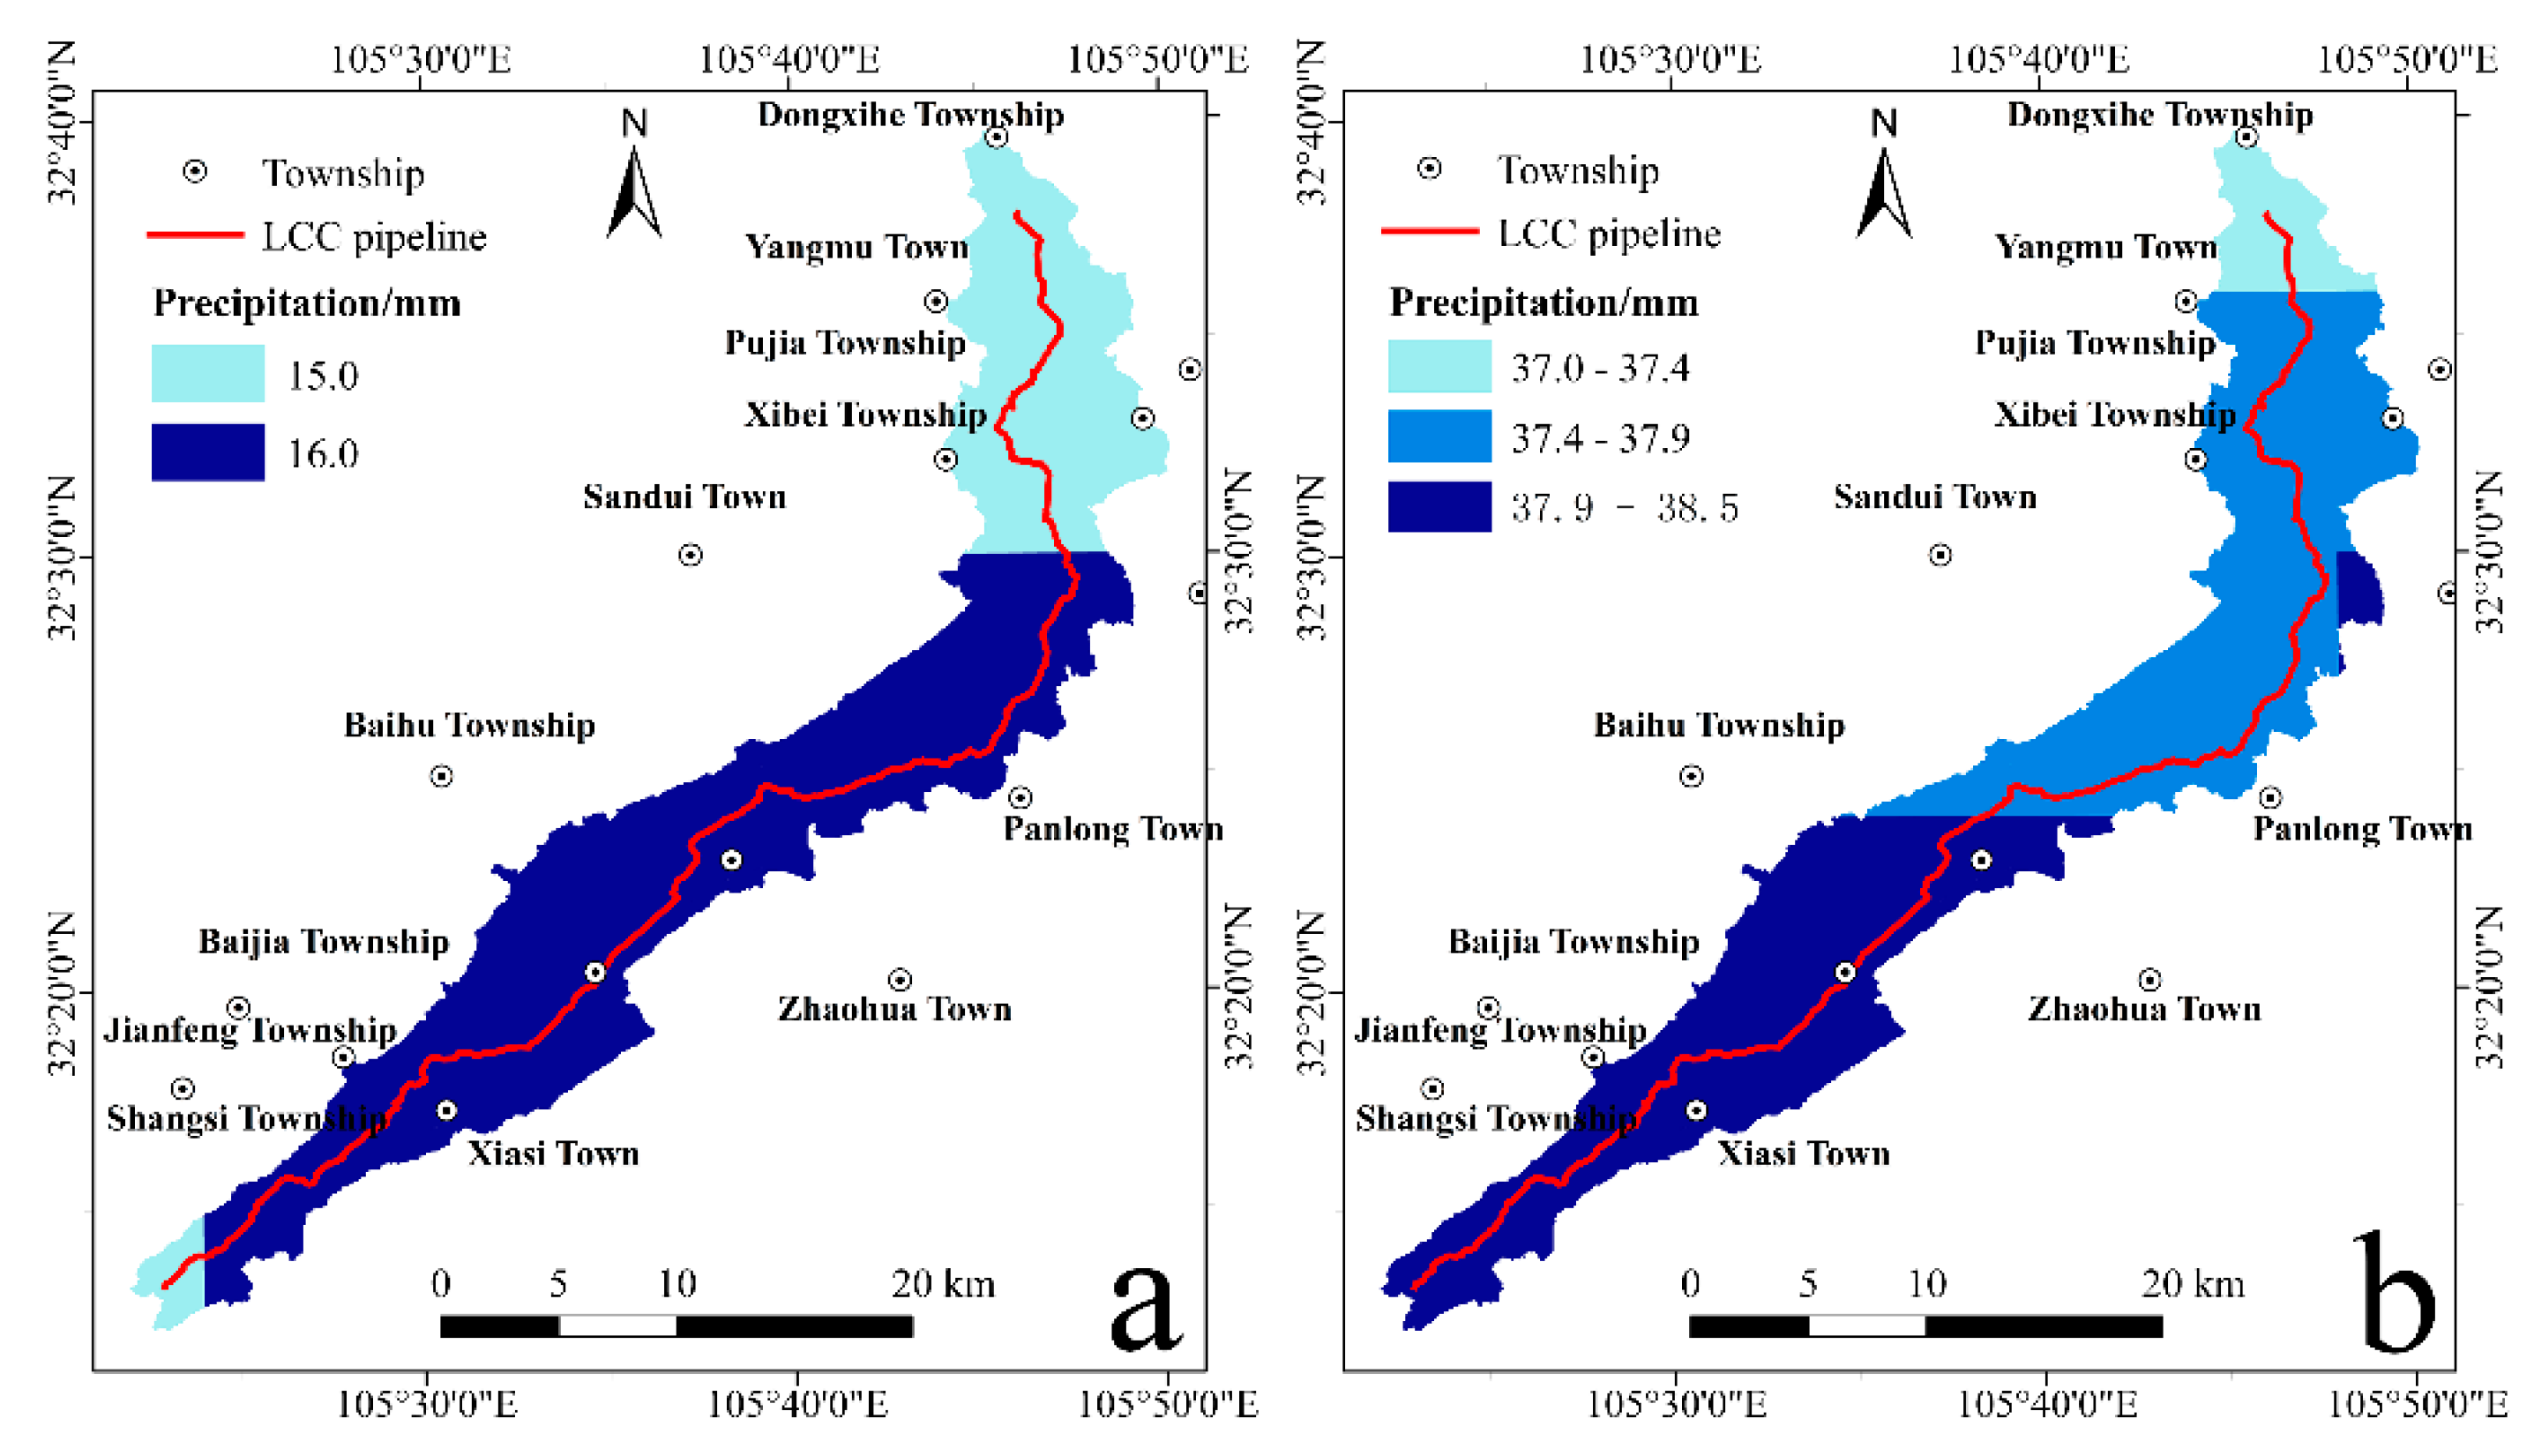
4.2.4. Precipitation
4.2.5. Determination of Assessment Indicator
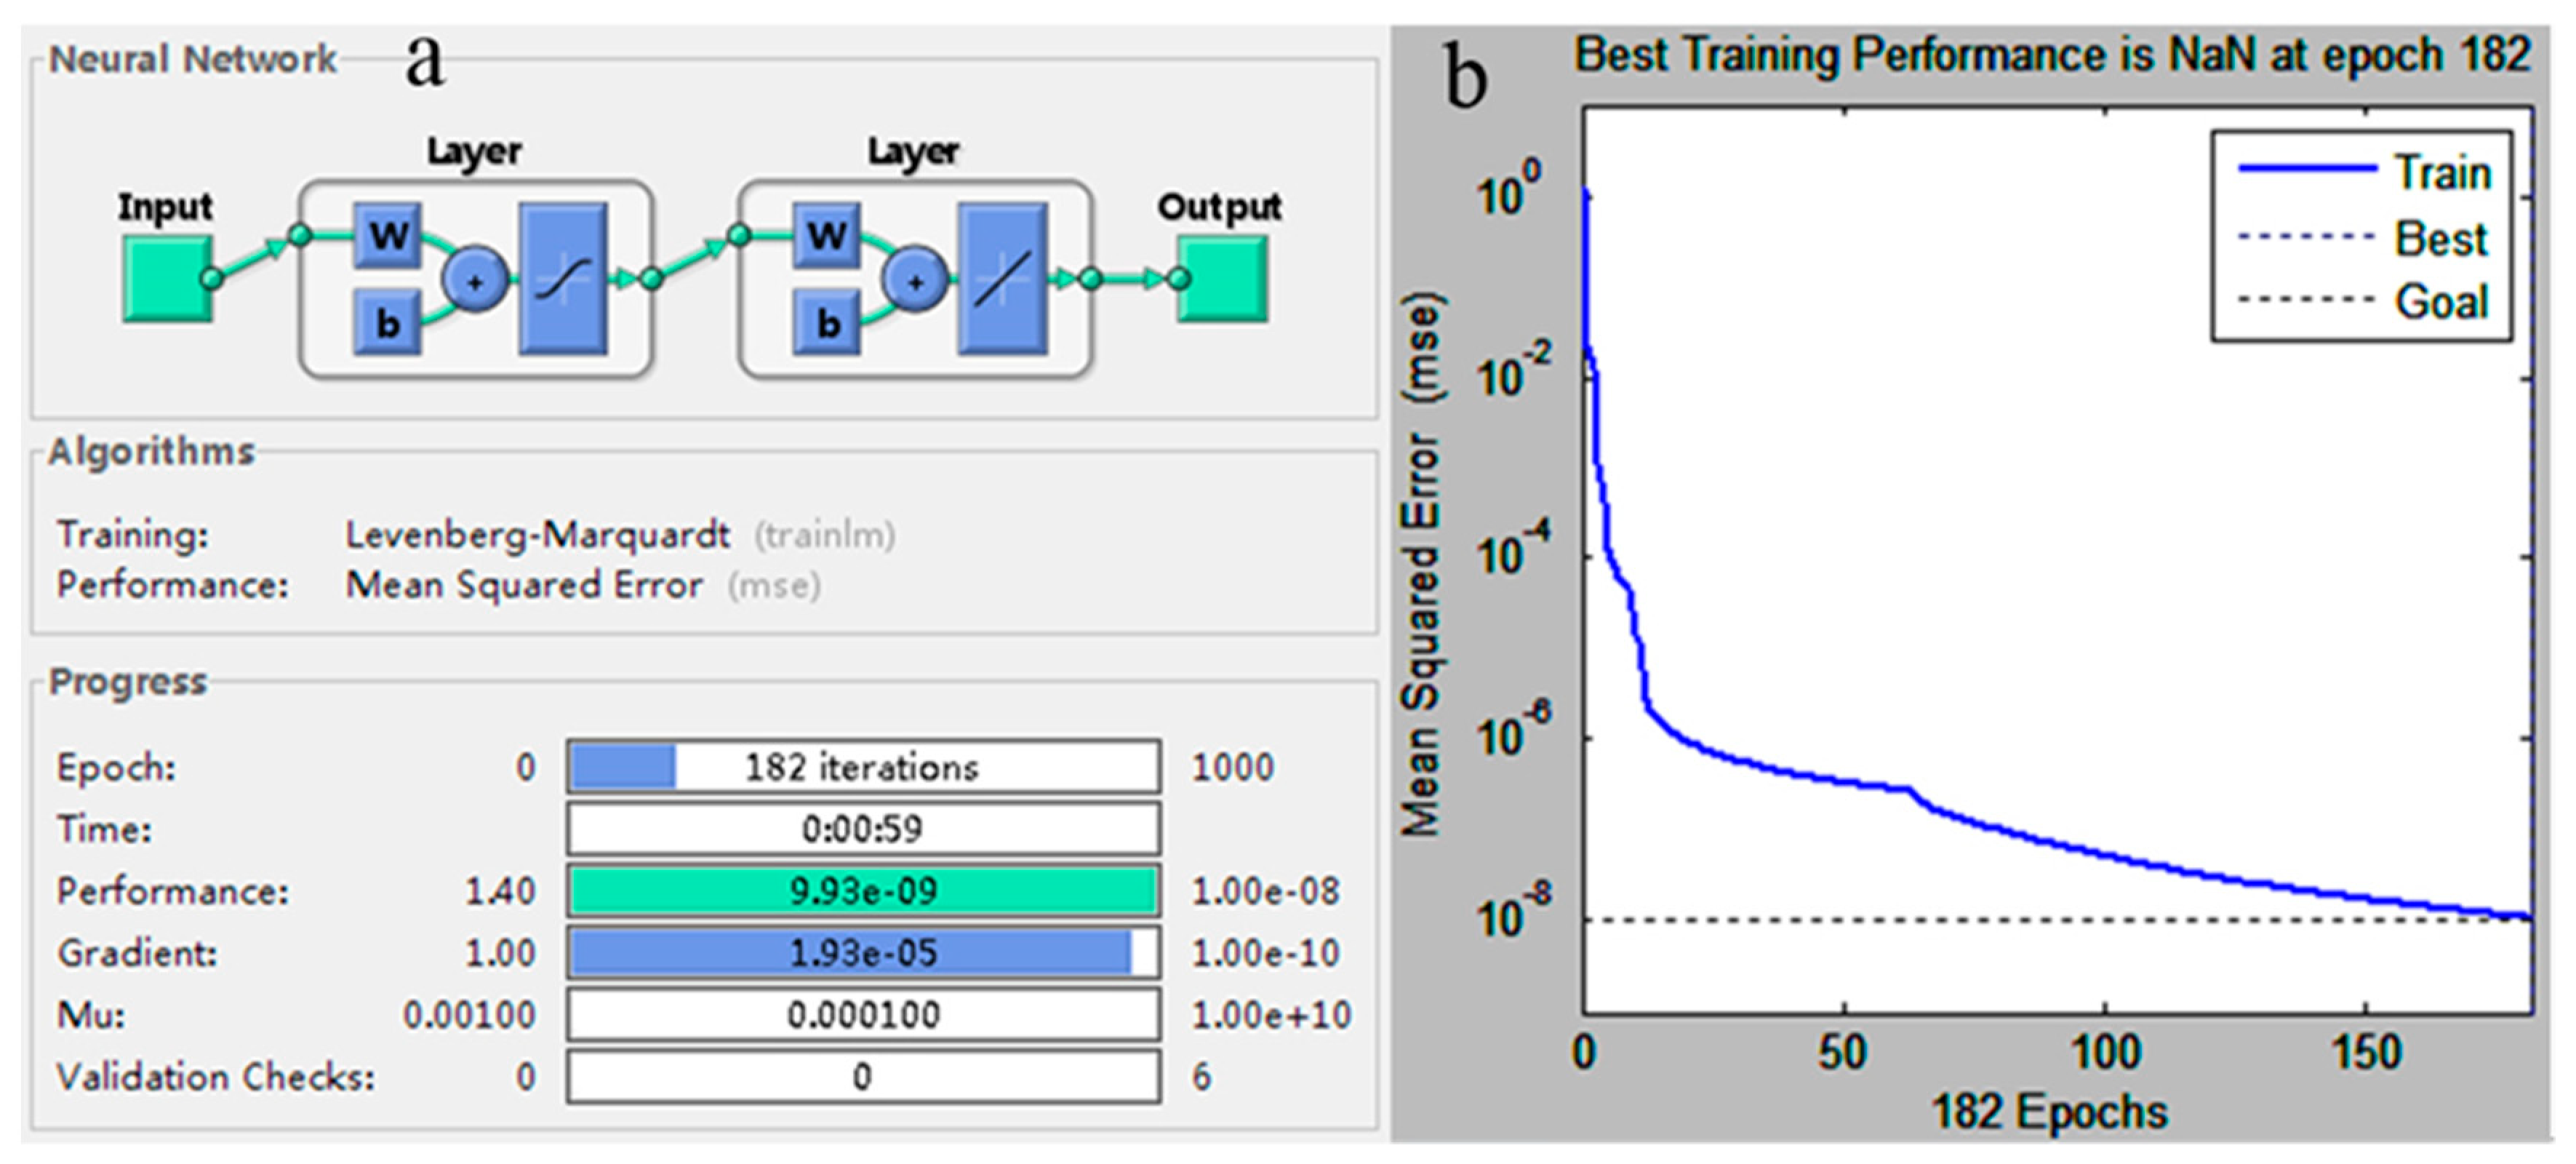
4.3. LM-BP Neural Network Mode
4.3.1. LM-BP Neural Network Theory
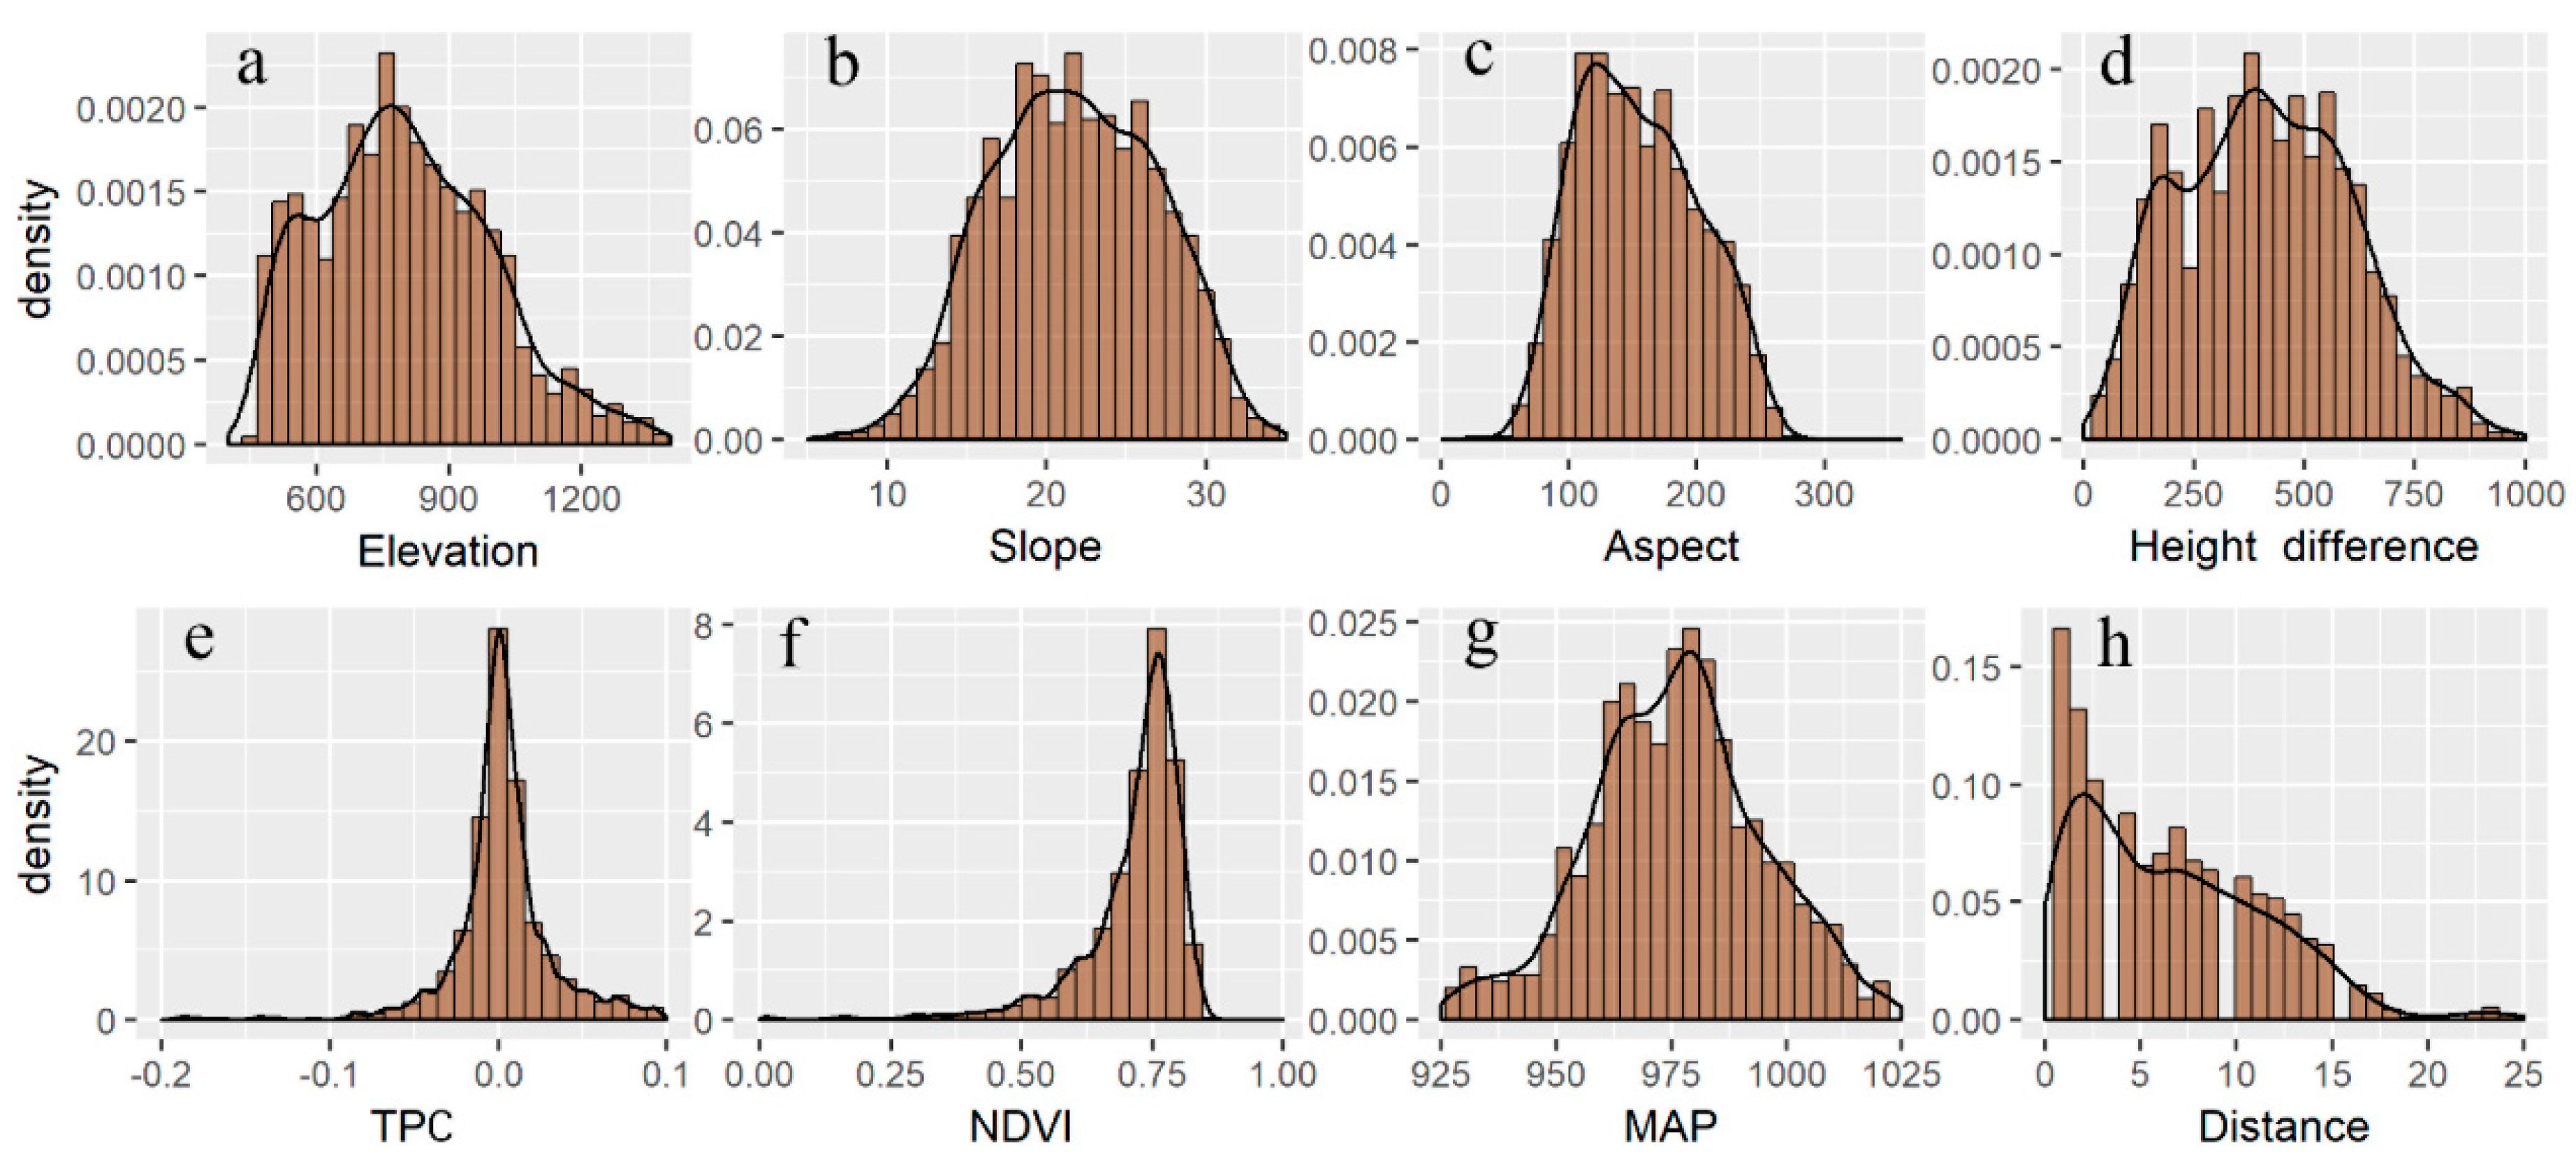
4.3.2. Indexes Distribution
4.3.3. Standard Sample
4.3.4. Model Establishment
- net.trainParam.show = 60;
- net.trainParam.lr = 0.5;
- net.trainParam.epochs = 1000;
- net.trainParam.goal = 1 × 10⁻⁸;
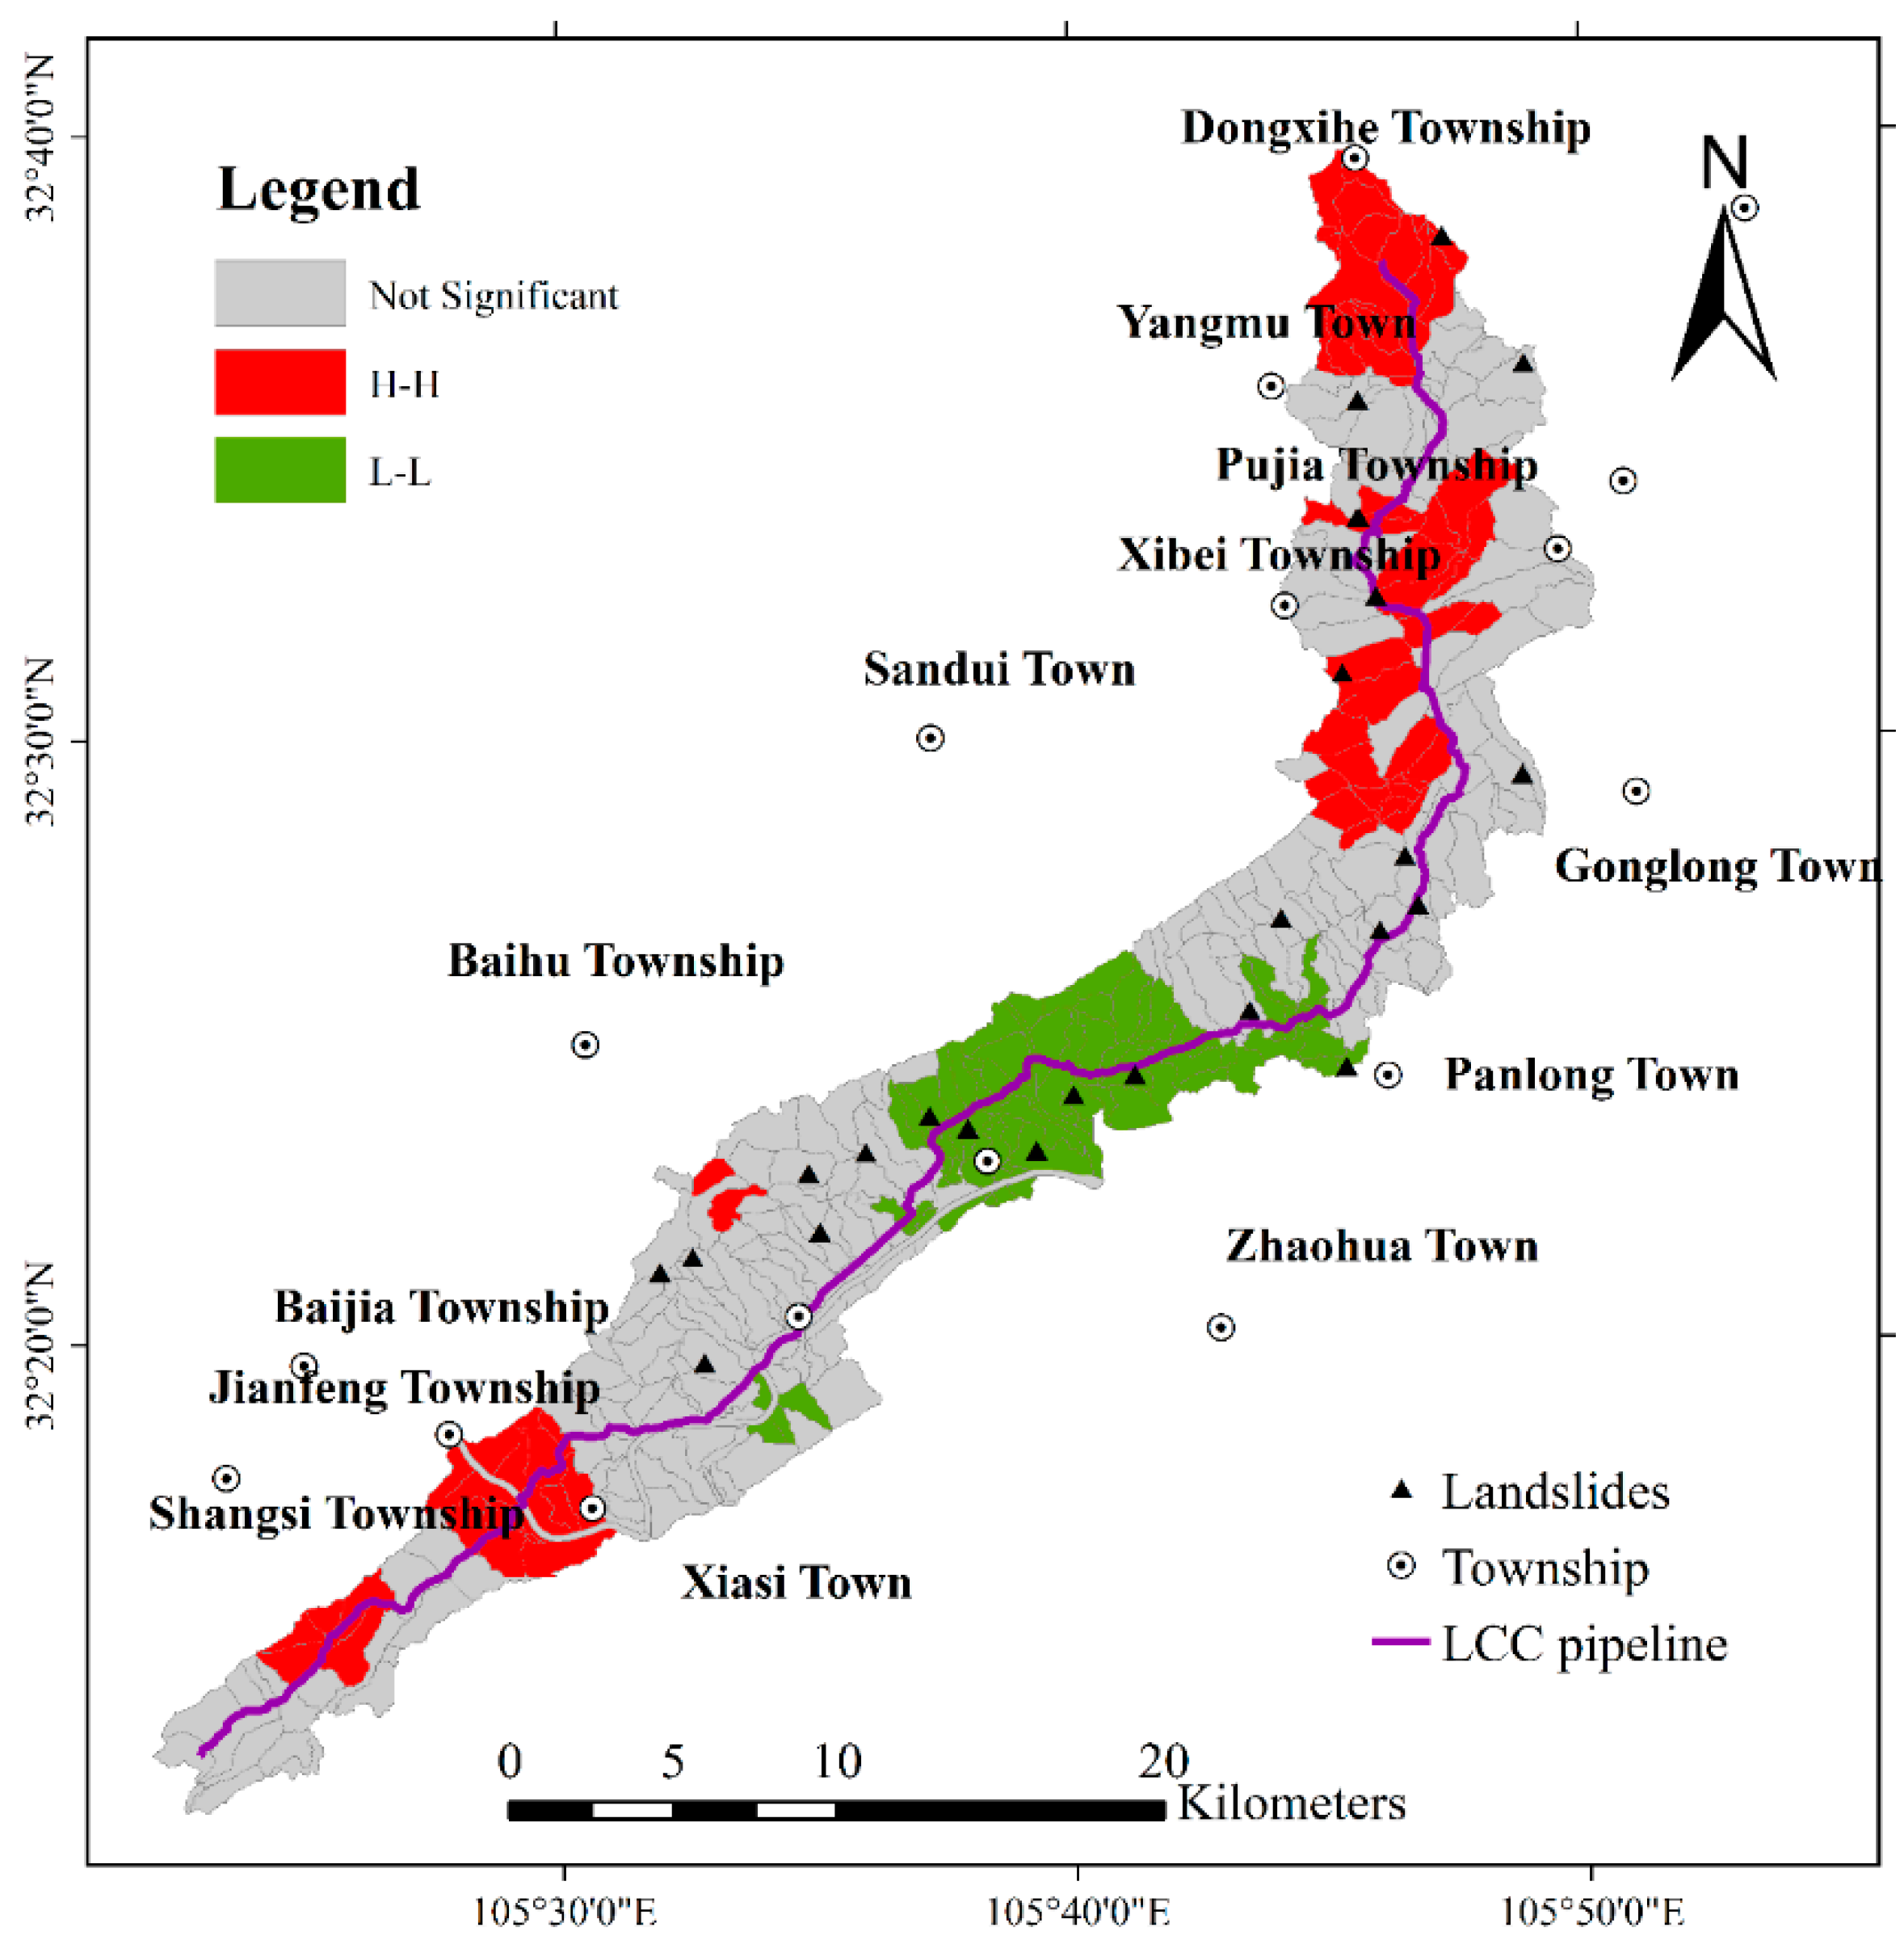
4.4. Spatial Autocorrelation Analysis
5. Results and Discussion
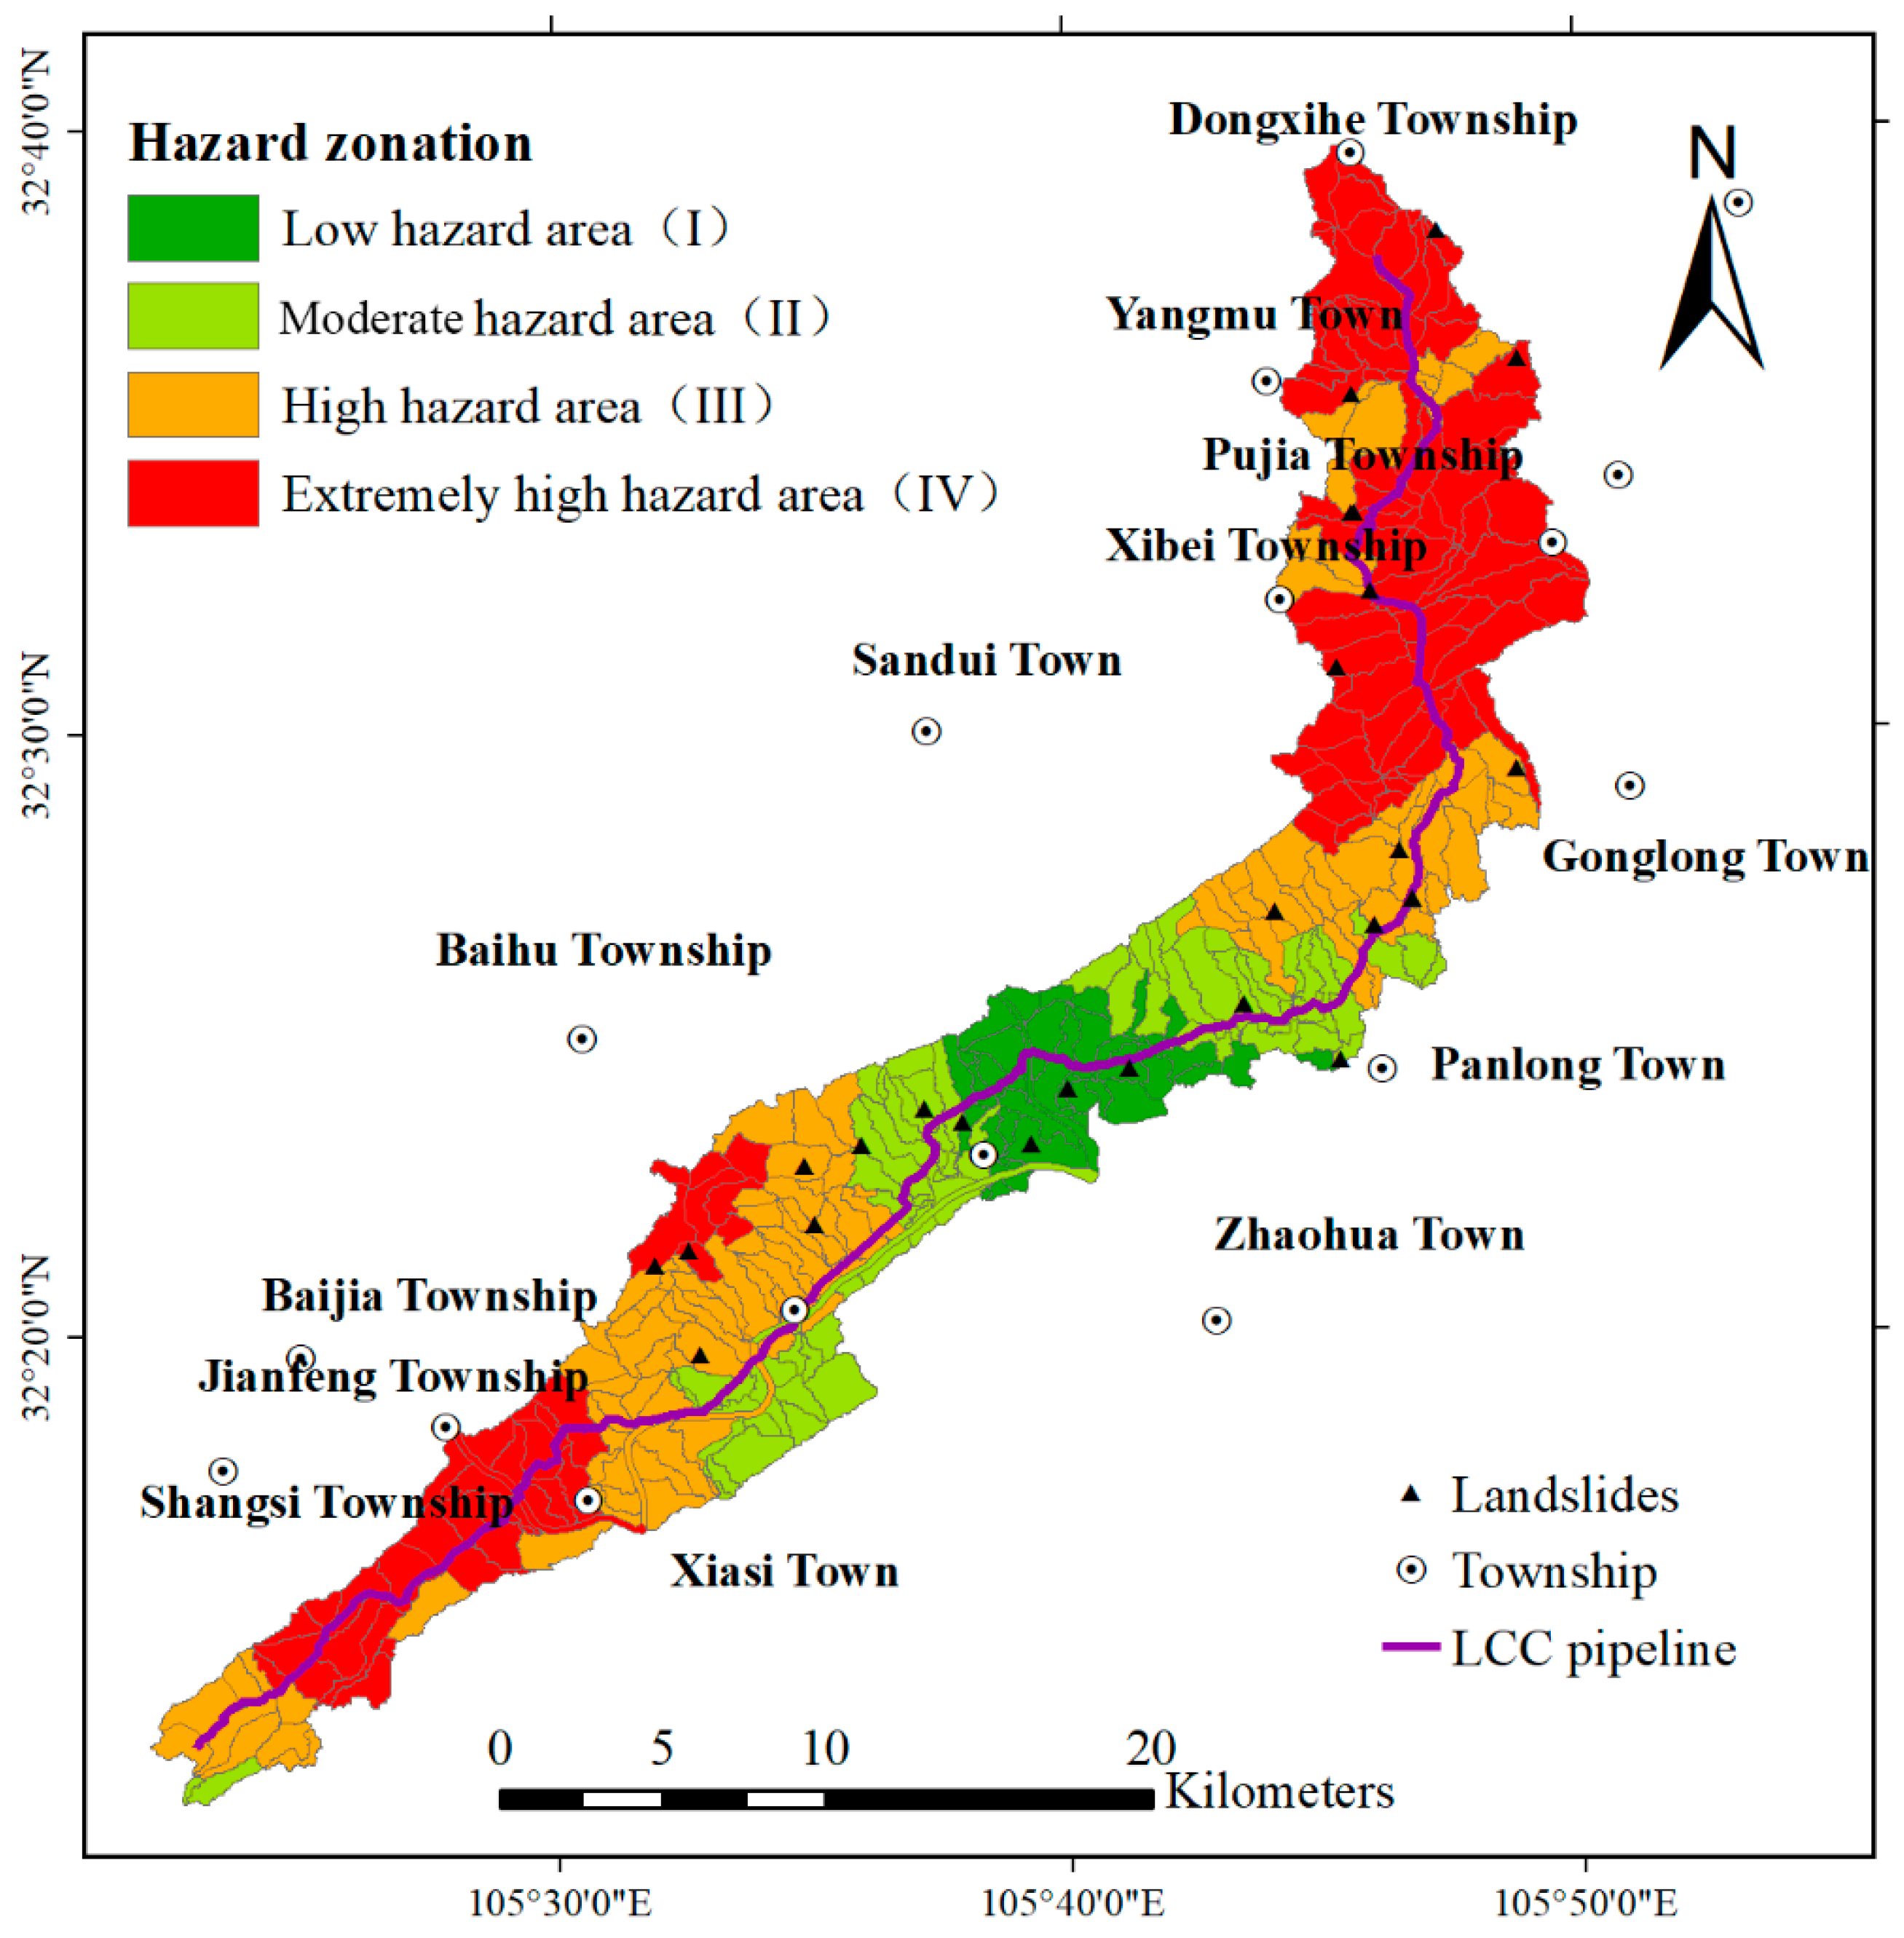
5.1. Hazard Results
5.2. Validation and Comparison
5.3. Discussion
6. Conclusions
Author Contributions
Funding
Acknowledgments
Conflicts of Interest
Appendix A

| FID | Name | Location | X | Y |
|---|---|---|---|---|
| 1 | Xuetangtou landslide | Zhujia village | 105.9091 | 32.6219 |
| 2 | Tangjiawan landslide | Jiefang village | 105.7713 | 32.6903 |
| 3 | Xingziwan landslide | Shimen village | 105.7850 | 32.6972 |
| 4 | Longdongwan landslide | Zhongba village | 105.7395 | 32.6720 |
| 5 | Dadihe landslide | Jinhua village | 105.6923 | 32.6581 |
| 6 | Fanjiahe landslide | Jinhua village | 105.6982 | 32.6547 |
| 7 | Panganxingchu landslide | Huashi village | 105.6976 | 32.6710 |
| 8 | Guojialianglandslide | Qinling village | 105.8590 | 32.5694 |
| 9 | Liujiawanlandslide | Qinling village | 105.8712 | 32.5757 |
| 10 | Liangshanglandslide | Sanwan village | 105.7318 | 32.5753 |
| 11 | Lingshanpolandslide | Sanwan village | 105.7379 | 32.5672 |
| 12 | Hejiagoulandslide | Baihu village | 105.8398 | 32.5744 |
| 13 | Wangjiapinglandslide | Baihu village | 105.8474 | 32.5750 |
| 14 | Gongluyanxianlandslide | Baihu village | 105.8404 | 32.5695 |
| 15 | Hanpayanlandslide | Tangjia village | 105.8670 | 32.5883 |
| 16 | Qizulandslide | Nanhua village | 105.8546 | 32.5792 |
| 17 | Yizulandslide | Sanwan village | 105.8670 | 32.5883 |
| 18 | Qinlingcun landslide | Qinling village | 105.8924 | 32.5506 |
| 19 | Luojiawan landslide | Jinzuo village | 105.8731 | 32.5690 |
| 20 | Bailintou landslide | Tangjia village | 105.9169 | 32.5964 |
| 21 | Fengcaoyan landslide | Shangba village | 105.7230 | 32.5250 |
| 22 | Huangjiagou landslide | Guankou village | 105.7550 | 32.5171 |
| 23 | Xujialiangshang landslide | Shiya village | 105.7662 | 32.5382 |
| 24 | Guoduzi landslide | Jinding village | 105.7331 | 32.6093 |
| 25 | Huoshipocun landslide | Huoshipo village | 105.7884 | 32.6376 |
| 26 | Yangmuzhenwuxingcun landslide | Wuxing village | 105.7600 | 32.5602 |
| 27 | Zhangbimufanghou landslide | Wuxing village | 105.7601 | 32.5598 |
| 28 | Goujiayan landslide | Jinbi village | 105.8148 | 32.6023 |
| 29 | Yangtangwan landslide | Yuanxi village | 105.7621 | 32.5913 |
| 30 | Yagentou landslide | Baiyun village | 105.7049 | 32.6040 |
| 31 | Dawangshan landslide | Ezhang village | 105.5110 | 32.3445 |
| 32 | Miaoziping landslide | Guanyin village | 105.4748 | 32.3927 |
| 33 | Luchanghe landslide | Guanyin village | 105.4788 | 32.3920 |
| 34 | Tianwan landslide | Weizi village | 105.4943 | 32.3873 |
| 35 | Huangtuliang landslide | Weizi village | 105.4927 | 32.4004 |
| 36 | Tielugoukufang landslide | Xujia village | 105.5114 | 32.3957 |
| 37 | Erdaowan landslide | Xujia village | 105.5377 | 32.3906 |
| 38 | Dachitang landslide | Xujia village | 105.5328 | 32.3966 |
| 39 | Lijiagou landslide | Yongjiu village | 105.5098 | 32.3879 |
| 40 | Wangjialiang landslide | Yongjiu village | 105.5043 | 32.3799 |
| 41 | Luojiahe landslide | Yongjiu village | 105.5044 | 32.3664 |
| 42 | Shizuozi landslide | Anquan village | 105.6546 | 32.3859 |
| 43 | Mamaliang landslide | Hongxing village | 105.6326 | 32.3921 |
| 44 | Liujiahe landslide | Anquan village | 105.6617 | 32.3722 |
| 45 | Zuomushugou landslide | Cangxi village | 105.5865 | 32.4399 |
| 46 | Wangjiahe landslide | Fanjia village | 105.5822 | 32.4276 |
| 47 | Yanglaoyewan landslide | Hongxing village | 105.6514 | 32.3616 |
| 48 | Choubaoshang landslide | Laolin village | 105.6199 | 32.3956 |
| 49 | Longquanshuiku landslide | Longquan village | 105.5991 | 32.3855 |
| 50 | Hejialiang landslide | Longquan village | 105.5804 | 32.3800 |
| 51 | Zhangjiagou landslide | Shiqiao village | 105.5840 | 32.3637 |
| 52 | Zhangjiadibuwendingxiepo | Songjia village | 105.6495 | 32.4332 |
| 53 | Huachangli landslide | Songjia village | 105.6375 | 32.4461 |
| 54 | Cushizhan landslide | Songjia village | 105.6400 | 32.4607 |
| 55 | Dacaodi landslide | Fengjia village | 105.5464 | 32.3278 |
| 56 | Leijialiang landslide | Leijia village | 105.5292 | 32.3614 |
| 57 | Zhangshuyan landslide | Leijia village | 105.5329 | 32.3512 |
| 58 | Lijiagai landslide | Zhanggong village | 105.5426 | 32.3569 |
| 59 | Mengjiashan landslide | Lianhua village | 105.8949 | 32.3844 |
| 60 | Renjiahe landslide | Daguang village | 105.9443 | 32.4679 |
| 61 | Hetaofuyanbei landslide | Shuigui village | 105.8754 | 32.4658 |
| 62 | Qiaogoutou landslide | Shuigui village | 105.8846 | 32.4524 |
| 63 | Luojiagou landslide | Shuigui village | 105.8720 | 32.4562 |
| 64 | Lijiagou landslide | Wanyuan village | 105.8497 | 32.4088 |
| 65 | Pengjiadagouhuibiliang landslide | Wanyuan village | 105.8615 | 32.4015 |
| 66 | Yanjiawan landslide | Qianfo village | 105.8376 | 32.4622 |
| 67 | Dishanshang landslide | Datang village | 105.8527 | 32.5282 |
| 68 | Sandaoguai landslide | Qianfo village | 105.8402 | 32.4682 |
| 69 | Zuoyagou landslide | Xiaotang village | 105.8600 | 32.5070 |
| 70 | Fangjiazuo landslide | Xuedi village | 105.9605 | 32.5275 |
| 71 | Wangjiashan landslide | Xuedi village | 105.9561 | 32.5355 |
| 72 | Zhengjiagouanzhidian landslide | Zhengjiagou village | 105.8134 | 32.4890 |
| 73 | Lizhouzhongzhuan landslide | Nvhuanglujuweihuizu village | 105.8049 | 32.4558 |
| 74 | Zhengjiagou landslide | Zhengjiagou village | 105.8071 | 32.5083 |
| 75 | Feimaohou landslide | Tongxin village | 105.7648 | 32.4443 |
| 76 | Guangcaotou landslide | Xuegong village | 105.7381 | 32.4796 |
| 77 | Fanjiaping landslide | Jingu village | 105.6991 | 32.4003 |
| 78 | Houjiahe landslide | Shengli village | 105.8395 | 32.3948 |
| 79 | Lijialiang landslide | Shengli village | 105.8402 | 32.4024 |
| 80 | Liujiaping landslide | Taoyuan village | 105.9031 | 32.3305 |
| 81 | Zhoujiapo landslide | Zhoujia village | 105.8231 | 32.4182 |
| 82 | Qingyanzi landslide | Jingsai village | 105.7246 | 32.3844 |
| 83 | Lijiazui landslide | Taiyang village | 105.7242 | 32.4242 |
| 84 | Xulongkou landslide | Dongsheng village | 105.7346 | 32.4496 |
| 85 | Zhoujiawan landslide | Gonghe village | 105.7304 | 32.3778 |
| 86 | Majiawan landslide | Nanshan village | 105.7410 | 32.3674 |
| 87 | Zhangjiayan landslide | Nanshan village | 105.7592 | 32.3733 |
| 88 | Chengjiayan landslide | Nanshan village | 105.7543 | 32.3686 |
| 89 | Ningjiazui landslide | Rongli village | 105.7384 | 32.3927 |
| 90 | Lijiagou landslide | Shengou village | 105.6867 | 32.4067 |
| 91 | Gaojialing landslide | Xinnong village | 105.7219 | 32.3970 |
| 92 | Maanqiao landslide | Baozhu village | 105.6093 | 32.5111 |
| 93 | Longjiagouxiepo | Yangpan village | 105.6879 | 32.5077 |
| 94 | Qinjialiang landslide | Baiyan village | 105.5882 | 32.4705 |
| 95 | Shizishupo landslide | Jingtian village | 105.6260 | 32.4857 |
| 96 | Zhoujiapo landslide | Liangshui village | 105.6204 | 32.4776 |
| 97 | Yanwanli landslide | Makou village | 105.6204 | 32.4570 |
| 98 | Yangjiagou landslide | Wujiahao village | 105.8171 | 32.4642 |
| 99 | Xiaopingzi landslide | Shilong village | 105.6667 | 32.4012 |
| 100 | Jiuhuayan landslide | Jiuhua village | 105.8947 | 32.4231 |
| 101 | Fanghoupo landslide | Paoshi village | 105.9114 | 32.4368 |
| 102 | Yuanpaoling landslide | Paoshi village | 105.9194 | 32.4364 |
| 103 | Huajiazuo landslide | Yangliu village | 105.7792 | 32.4530 |
| 104 | Zhangjiashan landslide | Yangliu village | 105.7750 | 32.4666 |
| 105 | Zuojialiang landslide | Zuojialiang village | 105.7557 | 32.4086 |
| 106 | Xingguanglu landslide | Xingguanglujuweihuizu village | 105.7697 | 32.4081 |
| FID | Name | Number | Location | X | Y | A | B | C * |
|---|---|---|---|---|---|---|---|---|
| 1 | Huachangli landslide | LZQ10067 | Songjia village | 105.5867 | 32.3625 | 0 | 0.1 | -- |
| 2 | Shagouzi landslide | YB-0099 | Tianxiong village | 105.6906 | 32.3400 | 14 | 8 | -- |
| 3 | Choujiagou landslide | YB-0100 | Shipan village | 105.7036 | 32.3675 | 6 | 4 | -- |
| 4 | Zhouxingwenfanghou landslide | YB-0144 | Xinfan village | 105.6183 | 32.3239 | 4 | 4 | -- |
| 5 | Huoshipo landslide | C01 | Huoshipo village | 105.7708 | 32.6324 | 16 | 15 | -- |
| 6 | Dawuliang landslide | C06 | Shanya village | 105.7972 | 32.5303 | 81 | 80 | -- |
| 7 | Shanzuocun landslide | C14 | Shanya village | 105.7950 | 32.5194 | 14 | 35 | Large |
| 8 | Yujiaping landslide | C32 | Shika village | 105.8536 | 32.5547 | 76 | 60 | Medium |
| 9 | Dajiashan landslide | C90 | Chaotian village | 105.8553 | 32.6353 | 11 | 10.5 | -- |
| 10 | Shuimohe landslide | C126 | Yuanxi village | 105.8156 | 32.5367 | 0 | 0 | -- |
| 11 | Dabaishu landslide | H0002 | Ma village | 105.4733 | 32.3806 | 15 | 0 | -- |
| 12 | Chaeryan landslide | H0122 | Ma village | 105.4783 | 32.3764 | 64 | 0 | Medium |
| 13 | Dajiatou landslide | H0139 | Guanyin village | 105.4697 | 32.3725 | 4 | 0 | -- |
| 14 | Dazuo landslide | H0228 | Huaguang village | 105.4492 | 32.3636 | 22 | 0 | -- |
| 15 | Hengdaliang landslide | H0231 | Huoshi village | 105.4536 | 32.3361 | 22 | 0 | -- |
| 16 | Fanshurong landslide | H0244 | Jianfeng village | 105.3881 | 32.2758 | 48 | 0 | Medium |
| 17 | Fanwuyuan landslide | H0245 | Jianfeng village | 105.3928 | 32.2778 | 4 | 0 | -- |
| 18 | Weihaishe landslide | H0246 | Jianfeng village | 105.3842 | 32.2736 | 16 | 0 | -- |
| 19 | Nanzuozi landslide | JG-0004 | Maoer village | 105.3958 | 32.2561 | 40 | 120 | -- |
| 20 | Dapingshan landslide | JG-0012 | Maoer village | 105.4297 | 32.2686 | 2 | 6 | Minor |
| 21 | Tiaotiaoshi landslide | JG-0017 | Sanfang village | 105.4731 | 32.3181 | 6 | 22 | -- |
| 22 | Longjiangkou landslide | JG-0020 | Weigan village | 105.4433 | 32.2958 | 2 | 3 | -- |
| 23 | Xiasicun landslide | JG-0028 | Xiasi village | 105.4656 | 32.2947 | 1 | 30 | -- |
| 24 | Dacangcun landslide | JG-0029 | Dacang village | 105.5108 | 32.2553 | 14 | 30 | -- |
| 25 | Shibanxiaofenlin landslide | JG-0030 | Guaizao village | 105.5311 | 32.3050 | 1 | 5 | -- |
| 26 | Lijiaba landslide | JG-0031 | Yaogou village | 105.5136 | 32.3050 | 4 | 5 | -- |
| 27 | Wutaicun landslide | JG-0032 | Wutai village | 105.4553 | 32.2483 | 17 | 12 | -- |
| 28 | Laoyaogou landslide | JG-0033 | Yaogou village | 105.5108 | 32.3078 | 13 | 12 | -- |
| 29 | Daijiabaozuomian landslide | JG-0039 | Youyu village | 105.4586 | 32.2678 | 16 | 50 | -- |
| 30 | Heishitoubang landslide | JG-0040 | Youyu village | 105.4731 | 32.2806 | 11 | 15 | -- |
| 31 | Shiwengcunyizu landslide | JG-0041 | Shiweng village | 105.4511 | 32.2608 | 10 | 8 | -- |
| 32 | Datiangai landslide | JG-0045 | Yaogou village | 105.5125 | 32.3083 | 8 | 7 | -- |
| 33 | Dashuliangxia landslide | JG-0306 | Youyu village | 105.4586 | 32.2681 | 13 | 10 | -- |
| 34 | Liangjiaping landslide | JG-0307 | Shangsi village | 105.4619 | 32.3136 | 6 | 3 | -- |
| 35 | Shitianzun landslide | JG-0310 | Xiaochang village | 105.4406 | 32.2394 | 3 | 2 | minor |
| 36 | Shiguangpo landslide | JG-0343 | Yaogou village | 105.5083 | 32.3189 | 10 | 6 | minor |
| 37 | Nongjiakan landslide | JG-0344 | Youyu village | 105.4614 | 32.2697 | 12 | 20 | -- |
| 38 | Dengzhuba landslide | JG-0357 | Guaizao village | 105.5278 | 32.3028 | 9 | 6 | minor |
References
- Ding, M.; Heiser, M.; Hübl, J.; Fuchs, S. Regional vulnerability assessment for debris flows in China—A CWS approach. Landslides 2016, 13, 537–550. [Google Scholar] [CrossRef]
- Kouli, M.; Loupasakis, C.; Soupios, P.; Vallianatos, F. Landslide hazard zonation in high risk areas of Rethymno Prefecture, Crete Island, Greece. Nat. Hazards 2010, 52, 599–621. [Google Scholar] [CrossRef]
- Hong, H.; Pradhan, B.; Xu, C.; Bui, D.T. Spatial prediction of landslide hazard at the Yihuang area (China) using two-class kernel logistic regression, alternating decision tree and support vector machines. Catena 2015, 133, 266–281. [Google Scholar] [CrossRef]
- Ray, P.K.C.; Dimri, S.; Lakhera, R.C.; Sati, S. Fuzzy-based method for landslide hazard assessment in active seismic zone of Himalaya. Landslides 2007, 4, 101–111. [Google Scholar]
- Li, G.; Zhang, P.; Li, Z.; Ke, Z.; Wu, G. Safety length simulation of natural gas pipeline subjected to transverse landslide. Electron. J. Geotech. Eng. 2016, 21, 4387–4399. [Google Scholar]
- Liu, F.Z.; Liu, J.P. Research on Erlang Temple landslide monitoring along Lan-Cheng-Yu Pipeline. Eng. Surv. Mapp. 2012, 21, 41–44. (In Chinese) [Google Scholar]
- Zheng, J.Y.; Zhang, B.J.; Liu, P.F.; Wu, L.L. Failure analysis and safety evaluation of buried pipeline due to deflection of landslide process. Eng. Fail. Anal. 2012, 25, 156–168. [Google Scholar] [CrossRef]
- Sari, D.A.P.; Innaqa, S. Hazard, Vulnerability and Capacity Mapping for Landslides Risk Analysis using Geographic Information System (GIS). In IOP Conference Series: Materials Science and Engineering; IOP Publishing: Bristol, UK, 2017; Volume 209, p. 012106. [Google Scholar]
- Guzzetti, F.; Reichenbach, P.; Cardinali, M.; Galli, M.; Ardizzone, F. Probabilistic landslide hazard assessment at the basin scale. Geomorphology 2005, 72, 272–299. [Google Scholar] [CrossRef]
- Wang, H.; Wang, G.; Liu, G.; Xu, W. GIS-based landslide hazard assessment: An overview. Prog. Phys. Geogr. 2005, 29, 548–567. [Google Scholar]
- Juez, C.; Murillo, J.; Garcia-Navarro, P. 2D simulation of granular flow over irregular steep slopes using global and local coordinates. J. Comput. Phys. 2013, 255, 166–204. [Google Scholar] [CrossRef]
- Juez, C.; Caviedes-Voullième, D.; Murillo, J.; Garcia-Navarro, P. 2D dry granular free-surface transient flow over complex topography with obstacles. Part II: Numerical predictions of fluid structures and benchmarking. Comput. Geosci. 2014, 73, 142–163. [Google Scholar] [CrossRef]
- Lacasta, A.; Juez, C.; Murillo, J.; Garcia-Navarro, P. An efficient solution for hazardous geophysical flows simulation using GPUs. Comput. Geosci. 2015, 78, 63–72. [Google Scholar] [CrossRef]
- Scavia, C. Preliminary study for landslide hazard assessment: GIS techniques and a multivariate statistical approach. In Landslides in Research, Theory and Practice: Proceedings of the 8th International Symposium on Landslides held in Cardiff on 26–30 June 2000; Thomas Telford Publishing: London, UK, 2000; pp. 1–215. [Google Scholar]
- Dhakal, A.S.; Amada, T.; Aniya, M. Landslide hazard mapping and its evaluation using GIS: An investigation of sampling schemes for a grid-cell based quantitative method. Photogramm. Eng. Remote Sens. 2000, 66, 981–989. [Google Scholar]
- Chung, C.-J.F.; Fabbri, A.G.; Van Westen, C.J.; Westen, C.J. Multivariate Regression Analysis for Landslide Hazard Zonation. Submar. Mass Mov. Their Conseq. 1995, 5, 107–133. [Google Scholar]
- Singh, K.; Kumar, V. Hazard assessment of landslide disaster using information value method and analytical hierarchy process in highly tectonic Chamba region in bosom of Himalaya. J. Mt. Sci. 2018, 15, 808–824. [Google Scholar] [CrossRef]
- Barredo, J.; Benavides, A.; Hervás, J.; Van Westen, C.J. Comparing heuristic landslide hazard assessment techniques using GIS in the Tirajana basin, Gran Canaria Island, Spain. Int. J. Appl. Earth Obs. Geoinf. 2000, 2, 9–23. [Google Scholar] [CrossRef]
- Zhao, T. Explore the Landslide Hazard Assessment Method on the Basis of Artificial Neural Network. Urban. Archit. 2013, 20, 306–307. (In Chinese) [Google Scholar]
- Pradhan, B.; Saro, L. Delineation of landslide hazard areas on Penang Island, Malaysia, by using frequency ratio, logistic regression, and artificial neural network models. Environ. Earth Sci. 2010, 60, 1037–1054. [Google Scholar] [CrossRef]
- Xiong, J.; Li, J.; Cheng, W.; Wang, N.; Guo, L. A GIS-Based support vector machine model for flash flood vulnerability assessment and mapping in China. ISPRS Int. J. Geo-Inf. 2019, 8, 297. [Google Scholar] [CrossRef]
- Sarkar, S.; Gupta, P.K. Techniques for Landslide Hazard Zonation-Application to Srinagar-Rudraprayag Area of Gar. J. Geol. Soc. India 2005, 65, 217–230. [Google Scholar]
- Li, P.L.; Tian, W.P.; Li, J.C. Analysis of landslide stability based on BP neural network. J. Guangxi Univ. 2013, 38, 905–911. (In Chinese) [Google Scholar]
- Su, G.; Deng, F. On the Improving Backpropagation Algorithms of the Neural Networks Based on MATLAB Language: A Review. Bull. Sci. Tech. 2003, 2, 130–135. (In Chinese) [Google Scholar]
- Li, J.; Feng, J.; Wang, W.; Zhang, F. Spatial and Temporal Changes in Solar Radiation of Northwest China Based LM-BP Neural Network. Sci. Geogr. Sin. 2016, 36, 780–786. (In Chinese) [Google Scholar]
- Li, J.; Wang, W.; Zhang, F. Simulation of solar radiation in northwest China based on LM-BP neural network. Arid Land Geogr. 2015, 28, 438–445. (In Chinese) [Google Scholar] [CrossRef]
- Hao, J.; Liu, J. Zonaion of Danger Degree of Geological Hazards over Lanzhou-Chengdu-Chongqing Products Pipeline. Oil Gas Storage Transp. 2008, 4, 49–53. (In Chinese) [Google Scholar]
- Zhang, Y.; Shi, J.; Gan, J.; Liu, C. Analysis of Distribution Characteristics and Influencing Factors of Secondary Geohazards in Guangyuan City—Taking Chaotian District as an Example. J. Catastr. 2011, 26, 75–79. (In Chinese) [Google Scholar]
- Li, S.; Jian, j.; Wu, Z.; Li, S.; Li, H.; Bai, K.; Ke, Q.; Xu, Y.; Hu, Y. A Design of the Geo-Environmental Management Database System for Guangyuan City. J. Geol. Hazards Environ. Preserv. 2012, 23, 36–42. (In Chinese) [Google Scholar]
- Qiu, D.; Niu, R.; Zhao, Y.N.; Wu, X. Risk Zoning of Earthquake-Induced Landslides Based on Slope Units: A Case Study on Lushan Earthquake. J. Jilin Univ. 2015, 45, 1470–1478. [Google Scholar]
- Cullen, C.A.; Al-Suhili, R.; Khanbilvardi, R. Guidance Index for Shallow Landslide Hazard Analysis. Remote. Sens. 2016, 8, 866. [Google Scholar] [CrossRef]
- Li, B.S.; Gao, Y.J. Application of the improved fuzzy analytic hierarchy process for landslide hazard assessment based on RS and GIS. In International Conference on Intelligent Earth Observing and Applications 2015; International Society for Optics and Photonics: Bellingham, WA, USA, 2015; p. 980833. [Google Scholar]
- Jaiswal, P.; Van Westen, C.J.; Jetten, V. Quantitative landslide hazard assessment along a transportation corridor in southern India. Eng. Geol. 2010, 116, 236–250. [Google Scholar] [CrossRef]
- Pardeshi, S.D.; Autade, S.E.; Pardeshi, S.S. Landslide hazard assessment: Recent trends and techniques. SpringerPlus 2013, 2, 523. [Google Scholar] [CrossRef] [PubMed]
- Chang, H.; Kim, N.K. The evaluation and the sensitivity analysis of GIS-based landslide susceptibility models. Geosci. J. 2004, 8, 415–423. [Google Scholar] [CrossRef]
- Hu, W.; Xu, Q.; Wang, G.H.; Asch, T.W.J.V.; Hicher, P.Y. Sensitivity of the initiation of debris flow to initial soil moisture. Landslides 2015, 12, 1139–1145. [Google Scholar] [CrossRef]
- Luo, Z.F.; Tan, D.J. Landslide Hazard Evaluation in Debris Flow Catchment Area Based on GIS and Information Method. China Saf. Sci. J. 2011, 21, 144–150. (In Chinese) [Google Scholar]
- Krishnan, M.V.N.; Pratheesh, P.; Rejith, P.G.; Vijith, H. Determining the Suitability of Two Different Statistical Techniques in Shallow Landslide (Debris Flow) Initiation Susceptibility Assessment in the Western Ghats. Environ. Res. Eng. Manag. 2015, 70, 27–39. [Google Scholar] [CrossRef][Green Version]
- Chen, H.; Lin, G.-W.; Lu, M.-H.; Shih, T.-Y.; Horng, M.-J.; Wu, S.-J.; Chuang, B. Effects of topography, lithology, rainfall and earthquake on landslide and sediment discharge in mountain catchments of southeastern Taiwan. Geomorphology 2011, 133, 132–142. [Google Scholar] [CrossRef]
- Guzzetti, F.; Cardinali, M.; Reichenbach, P. The Influence of Structural Setting and Lithology on Landslide Type and Pattern. Environ. Eng. Geosci. 1996, 2, 531–555. [Google Scholar] [CrossRef]
- Xiang, L.Z.; Cui, P.; Zhang, J.Q.; Huang, D.C.; Fang, H.; Zhou, X.J. Triggering factors susceptibility of earthquake-induced collapses and landslides in Wenchuan County. J. Sichuan Univ. 2010, 42, 105–112. (In Chinese) [Google Scholar]
- Xin, Y.; Chong, X.U.; Dai, F.C. Contribution of strata lithology and slope gradient to landslides triggered by Wenchuan Ms 8 earthquake, Sichuan, China. Geol. Bull. China 2009, 28, 1156–1162. (In Chinese) [Google Scholar]
- Peng, L.; Xu, S.N.; Hou, J.W.; Peng, J.H. Quantitative risk analysis for landslides: The case of the Three Gorges area, China. Landslides 2015, 12, 943–960. [Google Scholar] [CrossRef]
- Zhang, Q.; Xu, Q.; Wu, L.; Li, J. BP neural network model for forecasting volume of landslide group in Nanjiang. Hydrogeol. Eng. Geol. 2015, 42, 134–139. (In Chinese) [Google Scholar]
- Yang, S.Q.; Xing, X.Y.; Dong, W.H.; Li, S.P.; Zhang, Z.C.; Wang, Q.Y.; Yang, P.; Zhang, Y. The spatio-temporal response of influenza A (H1N1) to meteorological factors in Beijing. Acta Geogr. Sin. 2018, 73, 460–473. (In Chinese) [Google Scholar]
- Xiong, J.; Li, J.; Cheng, W.; Zhou, C.; Guo, L.; Zhang, X.; Wang, N.; Li, W. Spatial-temporal distribution and the influencing factors of mountain flood disaster in southwest China. Acta Geogr. Sin. 2019, 74, 1374–1391. (In Chinese) [Google Scholar]
- Liesbet, V.; Goele, V.; Miet, V.D.E.; Liesbeth, V.; Jean, P. Landslide risk assessment in a densely populated hilly area. Landslides 2015, 12, 787–798. [Google Scholar]
- Kargel, J.S.; Leonard, G.J.; Shugar, D.H.; Haritashya, U.K.; Bevington, A.; Fielding, E.J.; Fujita, K.; Geertsema, M.; Miles, E.S.; Steiner, J. Geomorphic and geologic controls of geohazards induced by Nepal’s 2015 Gorkha earthquake. Science 2016, 351, aac8353. [Google Scholar] [CrossRef]
- Huang, R.; Li, W. Development and distribution of geohazards triggered by the 5.12 Wenchuan Earthquake in China. Sci. China Ser. E Technol. Sci. 2009, 52, 810–819. [Google Scholar] [CrossRef]
- Ma, F.; Wang, J.; Yuan, R.; Zhao, H.; Guo, J. Application of analytical hierarchy process and least-squares method for landslide susceptibility assessment along the Zhong-Wu natural gas pipeline, China. Landslides 2013, 10, 481–492. [Google Scholar] [CrossRef]
- Jaafari, A.; Najafi, A.; Pourghasemi, H.R.; Rezaeian, J.; Sattarian, A. GIS-based frequency ratio and index of entropy models for landslide susceptibility assessment in the Caspian forest, northern Iran. Int. J. Environ. Sci. Technol. 2014, 11, 909–926. [Google Scholar] [CrossRef]
- Kawagoe, S.; Kazama, S.; Sarukkalige, P.R. Probabilistic modelling of rainfall induced landslide hazard assessment. Hydrol. Earth Syst. Sci. 2010, 14, 1047–1061. [Google Scholar] [CrossRef]
- Abdi, E.; Majnounian, B.; Genet, M.; Rahimi, H. Quantifying the effects of root reinforcement of Persian Ironwood (Parrotia persica) on slope stability; a case study: Hillslope of Hyrcanian forests, northern Iran. Ecol. Eng. 2010, 36, 1409–1416. [Google Scholar] [CrossRef]
- Yilmaz, I.; Keskin, I. GIS based statistical and physical approaches to landslide susceptibility mapping (Sebinkarahisar, Turkey). Bull. Int. Assoc. Eng. Geol. 2009, 68, 459–471. [Google Scholar] [CrossRef]
- Roessner, S.; Wetzel, H.-U.; Kaufmann, H.; Sarnagoev, A. Potential of Satellite Remote Sensing and GIS for Landslide Hazard Assessment in Southern Kyrgyzstan (Central Asia). Nat. Hazards 2005, 35, 395–416. [Google Scholar] [CrossRef]
- Behling, R.; Roessner, S.; Kaufmann, H.; Kleinschmit, B. Automated Spatiotemporal Landslide Mapping over Large Areas Using RapidEye Time Series Data. Remote. Sens. 2014, 6, 8026–8055. [Google Scholar] [CrossRef]
- Jan, K. Landslide temporal analysis and susceptibility assessment as bases for landslide mitigation, Machu Picchu, Peru. Environ. Earth Sci. 2013, 70, 913–925. [Google Scholar]
- Rossi, M.; Witt, A.; Guzzetti, F.; Malamud, B.D.; Peruccacci, S. Analysis of historical landslide time series in the Emilia-Romagna region, northern Italy. Earth Surf. Process. Landf. 2010, 35, 1123–1137. [Google Scholar] [CrossRef]
- Hong, H.; Pradhan, B.; Sameen, M.I.; Kalantar, B.; Zhu, A.; Chen, W. Improving the accuracy of landslide susceptibility model using a novel region-partitioning approach. Landslides 2018, 15, 1–20. [Google Scholar] [CrossRef]
- Chen, W.; Peng, J.; Hong, H.; Shahabi, H.; Pradhan, B.; Liu, J.; Zhu, A.-X.; Pei, X.; Duan, Z. Landslide susceptibility modelling using GIS-based machine learning techniques for Chongren County, Jiangxi Province, China. Sci. Total. Environ. 2018, 626, 1121–1135. [Google Scholar] [CrossRef]


| Hazard Level * | Rock Groups | Quantization |
|---|---|---|
| I | medium thick bedded sandstone, medium thick bedded conglomerate, limestone, dolomite, silicalite, granite, diorite | 1 |
| II | argillaceous materials like shale, sandstone and conglomerate interbedded with mudstone; argillaceous materials like carbonate, silicalite interbedded with shale, and clay rock; siltstone, shale, calcilutite, slate, phyllite, clay stone | 2 |
| III | Thin to thick bedded siltstone, thin to thick bedded shale, thin to thick bedded calcilutite, thin to thick bedded tuff, thin to thick bedded killas, thin to thick bedded phyllite, thin to thick bedded clay rock, thin to thick bedded coal-bearing sandstone, thin to thick bedded conglomerate, thin to thick bedded pyroclastic rock, thin to thick bedded coal-bearing carbona, blastopsammite, blastoaleuritic siltstone, blasto-tuff | 3 |
| IV | sand, gravelly soil, land pebble, sand pebble soil, gravel soil | 4 |
| Type | Indexes |
|---|---|
| Landform | Slope |
| Aspect | |
| Elevation | |
| Height Difference | |
| Topographic profile curvature (TPC) | |
| Land cover | NDVI |
| Geology | Lithology |
| Distance from the fault | |
| Precipitation | Annual mean rainfall (AAR) |
| Indexes | Interval | Hazard Degree Monotonicity * | Hazard Level |
|---|---|---|---|
| Elevation | [1000, Highest] | ↓ | I |
| [Lowest, 600) | ↑ | II | |
| [800, 1000) | ↓ | III | |
| [600, 700) ∪ [700, 800) | ↑, ↓ | IV | |
| Slope | [60, 90) | ↓ | I |
| [0, 15) | ↑ | II | |
| [30, 60) | ↓ | III | |
| [15, 20) ∪ [20, 30) | ↑, ↓ | IV | |
| Aspect | [0, 45) ∪ [270, 360) | ↑, ↓ | I |
| [225, 270) ∪ [45, 90) | ↓, ↑ | II | |
| [90, 135) ∪ [180, 225) | ↑, ↓ | III | |
| [135, 157.5) ∪ [157.5, 180) | ↑, ↓ | IV | |
| Height difference | [Lowest, 100) | ↑ | I |
| [900, Highest] ∪ [100, 200) | ↓, ↑ | II | |
| [600, 900) ∪ [200, 300) | ↓, ↑ | III | |
| [300, 450) ∪ [450, 600) | ↑, ↓ | IV | |
| TPC | [Lowest, −0.025) | ↑ | I |
| [0.025, Highest] | ↓ | II | |
| [−0.025, −0.01) ∪ [0.01, 0.025) | ↑, ↓ | III | |
| [−0.01, 0) ∪ [0, 0.01) | ↑, ↓ | IV | |
| NDVI | [−1,0) | ↑ | I |
| [0, 0.6) ∪ [0.9, 1] | ↑, ↓ | II | |
| [0.6, 0.7) ∪ [0.8, 0.9) | ↑, ↓ | III | |
| [0.7, 0.75) ∪ [0.75, 0.8) | ↑, ↓ | IV | |
| AAR | [1100, Highest) | ↓ | I |
| [Lowest, 960) | ↑ | II | |
| [990, 1100) | ↓ | III | |
| [960, 975) ∪ [975, 990) | ↑, ↓ | IV | |
| Distance from the fault | [20, Highest] | ↓ | I |
| [15, 20) | ↓ | II | |
| [5, 15) | ↓ | III | |
| [0, 5) | ↓ | IV |
| Sample Type | ID | Input | Output | ||||||||
|---|---|---|---|---|---|---|---|---|---|---|---|
| Aspect | Slope | Elevation | NDVI | AAR | Height Difference | TPC | Distance | Lithology | |||
| Training sample | 1 | 0.2 | 89.9 | 438 | −1 | 908.1 | 33 | −0.582 | 25 | 1 | 0 |
| 200 | 359.5 | 60 | 499 | 1 | 924.9 | 200 | 0.628 | 18.77 | 1 | 0.25 | |
| 400 | 269.3 | 15 | 1002 | 0.5 | 949.8 | 902 | −0.142 | 12.52 | 2 | 0.5 | |
| 600 | 224.4 | 30.2 | 802 | 0.3 | 999.9 | 600 | 0 | 6.26 | 3 | 0.75 | |
| 800 | 135.1 | 30 | 798 | 0 | 1023.2 | 599 | 0 | 0 | 4 | 1 | |
| Test sample | 1 | 27.2 | 72.3 | 458 | 0.8 | 911.6 | 59 | −0.544 | 25 | 1 | 0 |
| 5 | 38.6 | 62.1 | 497 | 0.86 | 919.1 | 152 | −0.03 | 19.74 | 1 | 0.22 | |
| 10 | 74.7 | 11.9 | 1382 | 0.53 | 949.9 | 1146 | 0.148 | 13.16 | 2 | 0.48 | |
| 15 | 115.6 | 57.5 | 933 | 0.32 | 994.2 | 835 | −0.015 | 6.58 | 3 | 0.74 | |
| 20 | 178.3 | 29.6 | 795 | 0.04 | 1022.7 | 446 | 0.001 | 0 | 4 | 1 | |
| Number | Expected Value | Network Output | Error | Relative Error (%) |
|---|---|---|---|---|
| 1 | 0 | 0.0006 | 0.0006 | - |
| 2 | 0.06 | 0.0548 | −0.0052 | 8.67 |
| 3 | 0.11 | 0.1113 | 0.0013 | 1.18 |
| 4 | 0.16 | 0.1699 | 0.0099 | 6.19 |
| 5 | 0.22 | 0.2302 | 0.0102 | 4.64 |
| 6 | 0.27 | 0.2614 | −0.0086 | 3.19 |
| 7 | 0.32 | 0.315 | −0.005 | 1.56 |
| 8 | 0.37 | 0.3697 | −0.0003 | 0.08 |
| 9 | 0.43 | 0.4266 | −0.0034 | 0.79 |
| 10 | 0.48 | 0.4899 | 0.0099 | 2.06 |
| 11 | 0.53 | 0.5153 | −0.0147 | 2.77 |
| 12 | 0.58 | 0.5765 | −0.0035 | 0.06 |
| 13 | 0.64 | 0.6405 | 0.0005 | 0.08 |
| 14 | 0.69 | 0.701 | 0.011 | 1.59 |
| 15 | 0.74 | 0.7523 | 0.0123 | 1.66 |
| 16 | 0.79 | 0.8094 | 0.0194 | 2.46 |
| 17 | 0.85 | 0.8616 | 0.0116 | 1.36 |
| 18 | 0.9 | 0.9155 | 0.0155 | 1.72 |
| 19 | 0.95 | 0.9675 | 0.0175 | 1.84 |
| 20 | 1 | 1.0173 | 0.0173 | 1.73 |
| Landslide Hazard Level | Number of Slope | Percentage | Area (km2) | Percentage |
|---|---|---|---|---|
| I | 33 | 10.48% | 32.63 | 8.76% |
| II | 62 | 19.68% | 65.53 | 17.60% |
| III | 112 | 35.56% | 123.55 | 33.18% |
| IV | 108 | 34.29% | 150.65 | 40.46% |
| Total | 315 | 100% | 372.36 | 100% |
| Landslide Hazard Level | Hazard Situation of Landslides | Control Measures |
|---|---|---|
| I | Basic stable; landslide hazard will not occur unless there are strong earthquakes, long continuous rainfall or heavy rainstorms. | Inspections |
| II | Potentially unstable; there is a trend of small landslides based on analysis of the geological structure and landform, and there is no sign of deformation at present. | A key inspection or simple monitoring |
| III | Unstable; there are medium and small landslides in the process of deformation, or there will obviously be deformation in the near future, such as clearly visible cracks, subsidence, and tympanites even shearing out in the frontal part of landslide. | Key monitoring or hazard mitigating |
| IV | Extremely unstable; there are large or giant landslides deforming, or being obviously deformed with clearly visible cracks in the near future. | An Implementation of prevention and control engineering in the short term |
| Hazard Level | Number of Landslides | Proportion (%) | Area of Each Grade (km2) | Landslide Density (/km2) |
|---|---|---|---|---|
| I | 3 | 12.0 | 32.63 | 0.0919 |
| II | 4 | 16.0 | 65.53 | 0.0610 |
| III | 9 | 36.0 | 123.55 | 0.0728 |
| IV | 9 | 36.0 | 150.65 | 0.0597 |
| Landslide Hazard Level | Number of Landslides | Percentage (%) | Area (km2) | Landslide Density (/km2) |
|---|---|---|---|---|
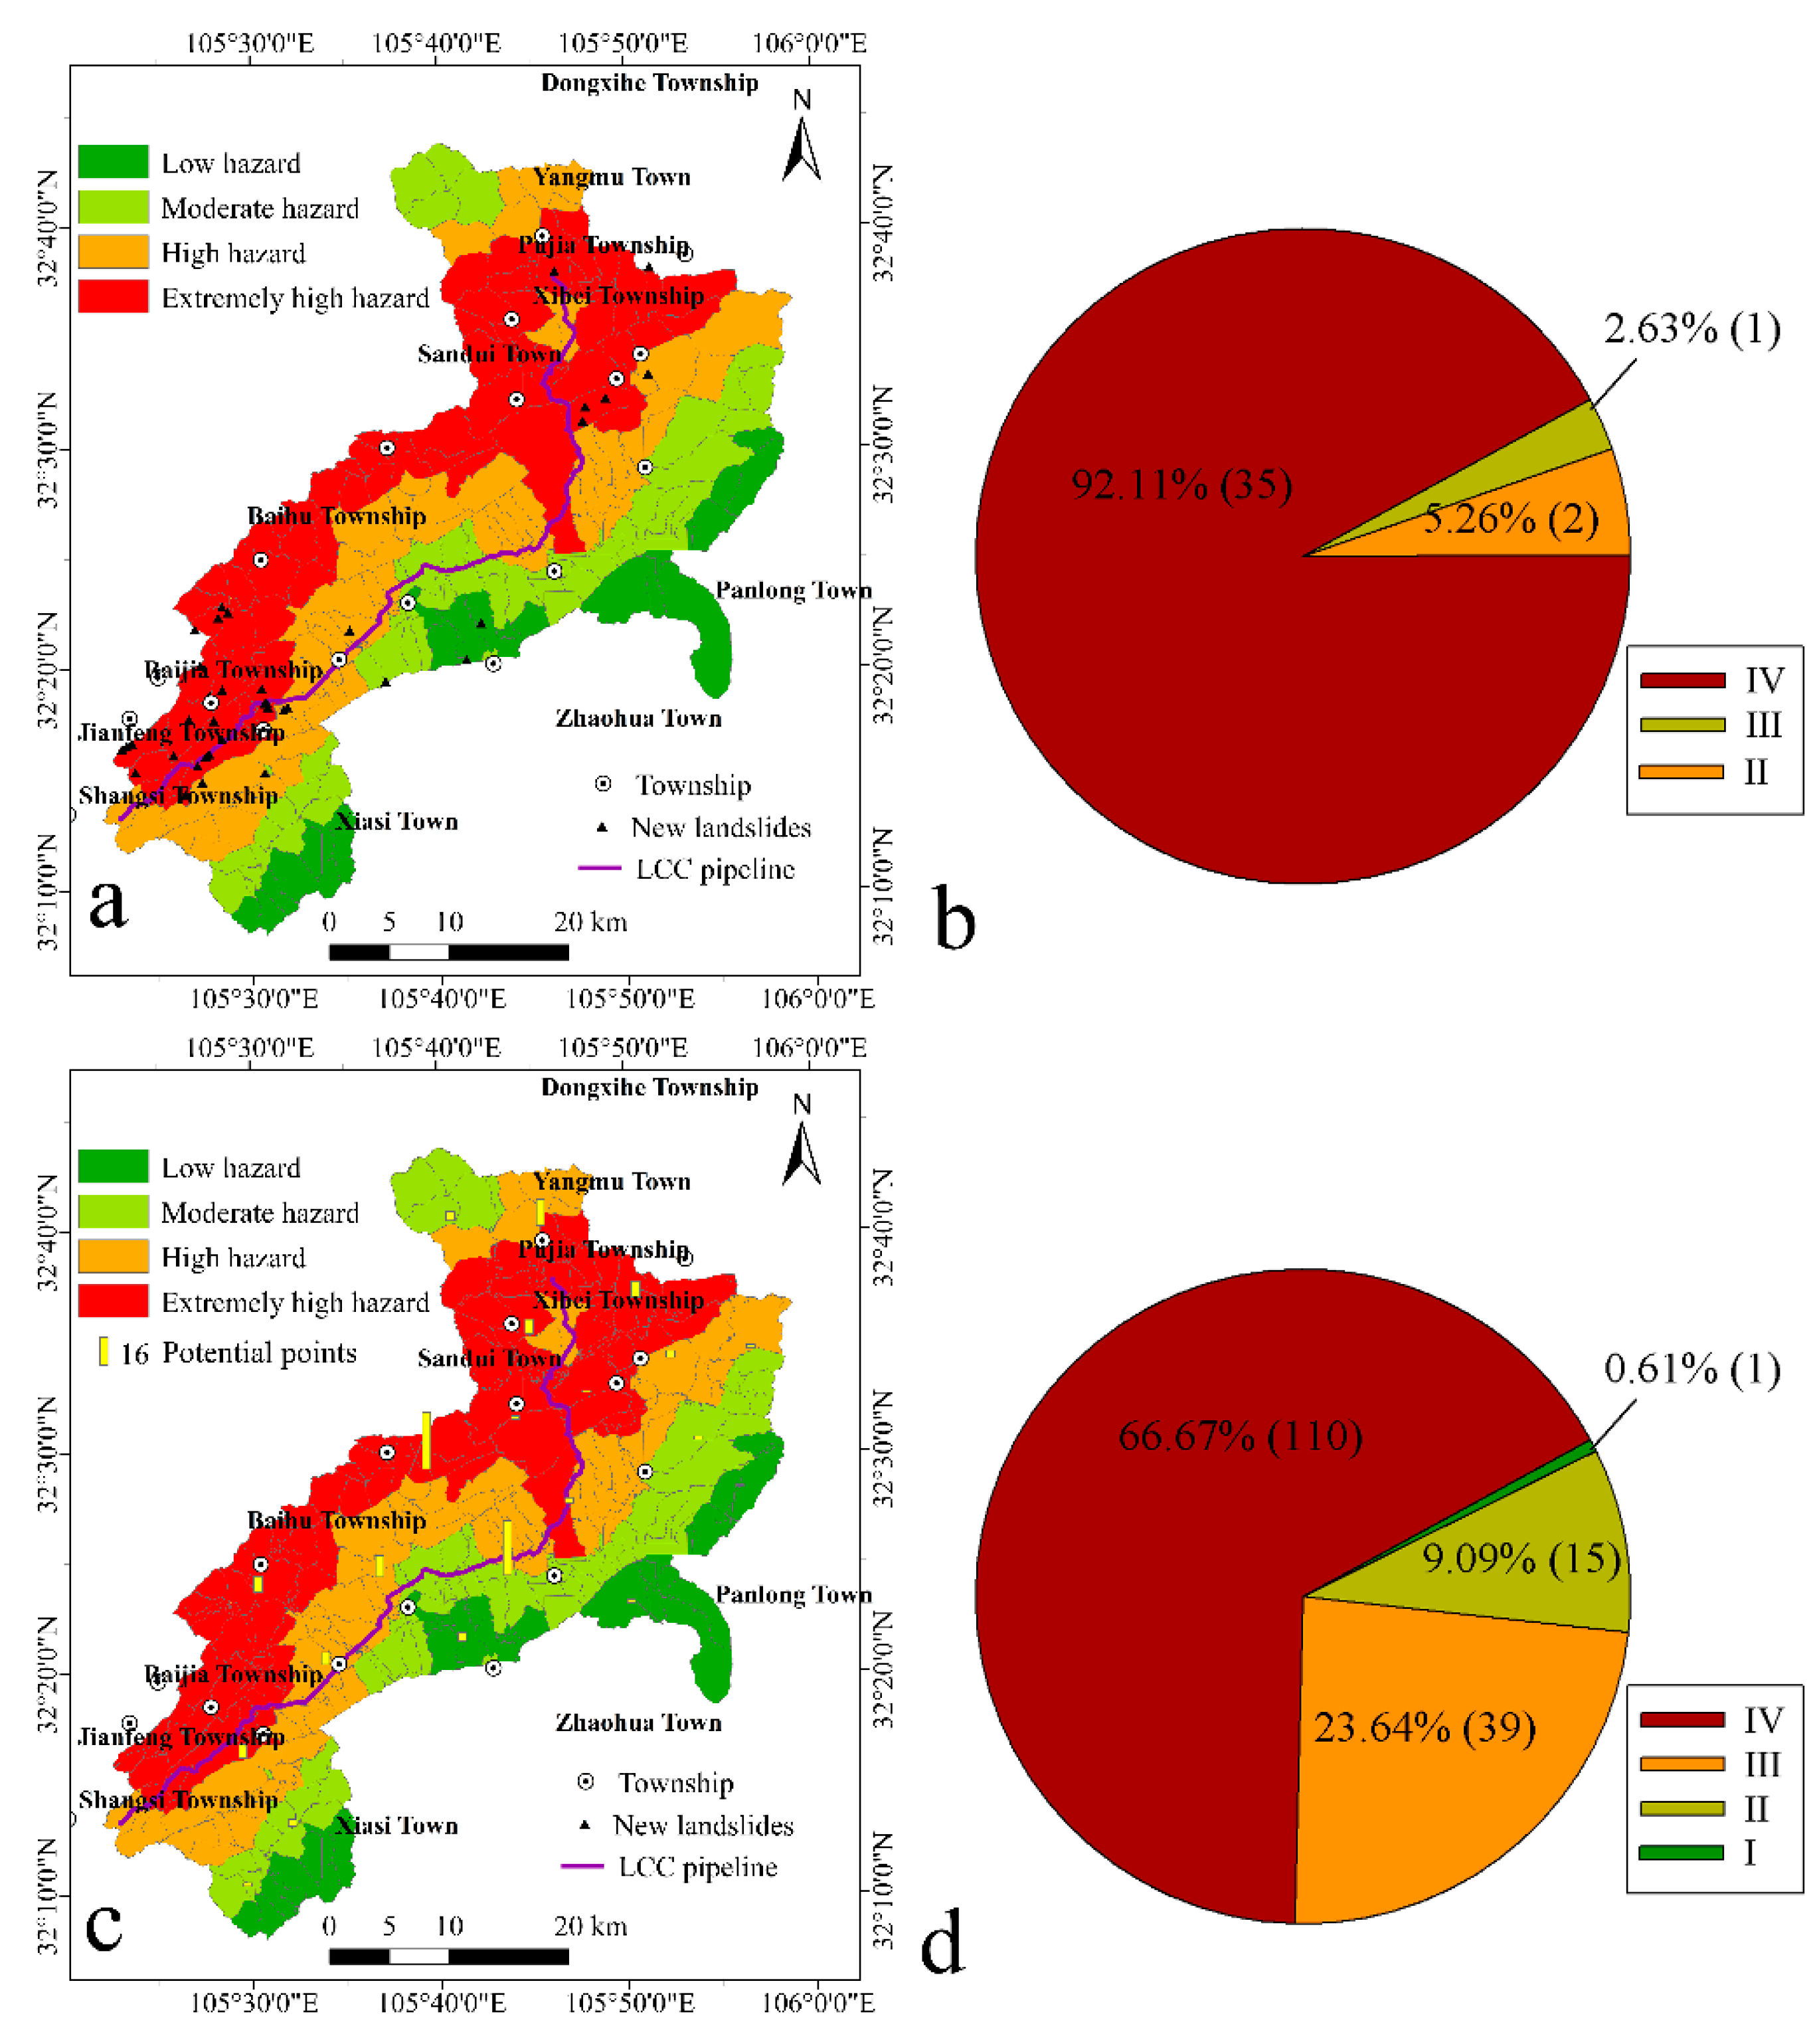
| I | 0 | 0 | 49.22 | 0 |
| II | 2 | 5.26 | 293.22 | 0.0084 |
| III | 1 | 2.63 | 394.86 | 0.0025 |
| IV | 35 | 92.11 | 822.17 | 0.0426 |
© 2019 by the authors. Licensee MDPI, Basel, Switzerland. This article is an open access article distributed under the terms and conditions of the Creative Commons Attribution (CC BY) license (http://creativecommons.org/licenses/by/4.0/).
Share and Cite
Xiong, J.; Li, J.; Zhang, H.; Sun, M.; Cheng, W. Quantitative Hazard Assessment of Landslides Using the Levenburg–Marquardt Back Propagation Neural Network Method in a Pipeline Area. Geosciences 2019, 9, 449. https://doi.org/10.3390/geosciences9100449
Xiong J, Li J, Zhang H, Sun M, Cheng W. Quantitative Hazard Assessment of Landslides Using the Levenburg–Marquardt Back Propagation Neural Network Method in a Pipeline Area. Geosciences. 2019; 9(10):449. https://doi.org/10.3390/geosciences9100449
Chicago/Turabian StyleXiong, Junnan, Jin Li, Hao Zhang, Ming Sun, and Weiming Cheng. 2019. "Quantitative Hazard Assessment of Landslides Using the Levenburg–Marquardt Back Propagation Neural Network Method in a Pipeline Area" Geosciences 9, no. 10: 449. https://doi.org/10.3390/geosciences9100449
APA StyleXiong, J., Li, J., Zhang, H., Sun, M., & Cheng, W. (2019). Quantitative Hazard Assessment of Landslides Using the Levenburg–Marquardt Back Propagation Neural Network Method in a Pipeline Area. Geosciences, 9(10), 449. https://doi.org/10.3390/geosciences9100449