The Taphonomy of Proterozoic Microbial Mats and Implications for Early Diagenetic Silicification

 ,
, 
Abstract
1. Introduction
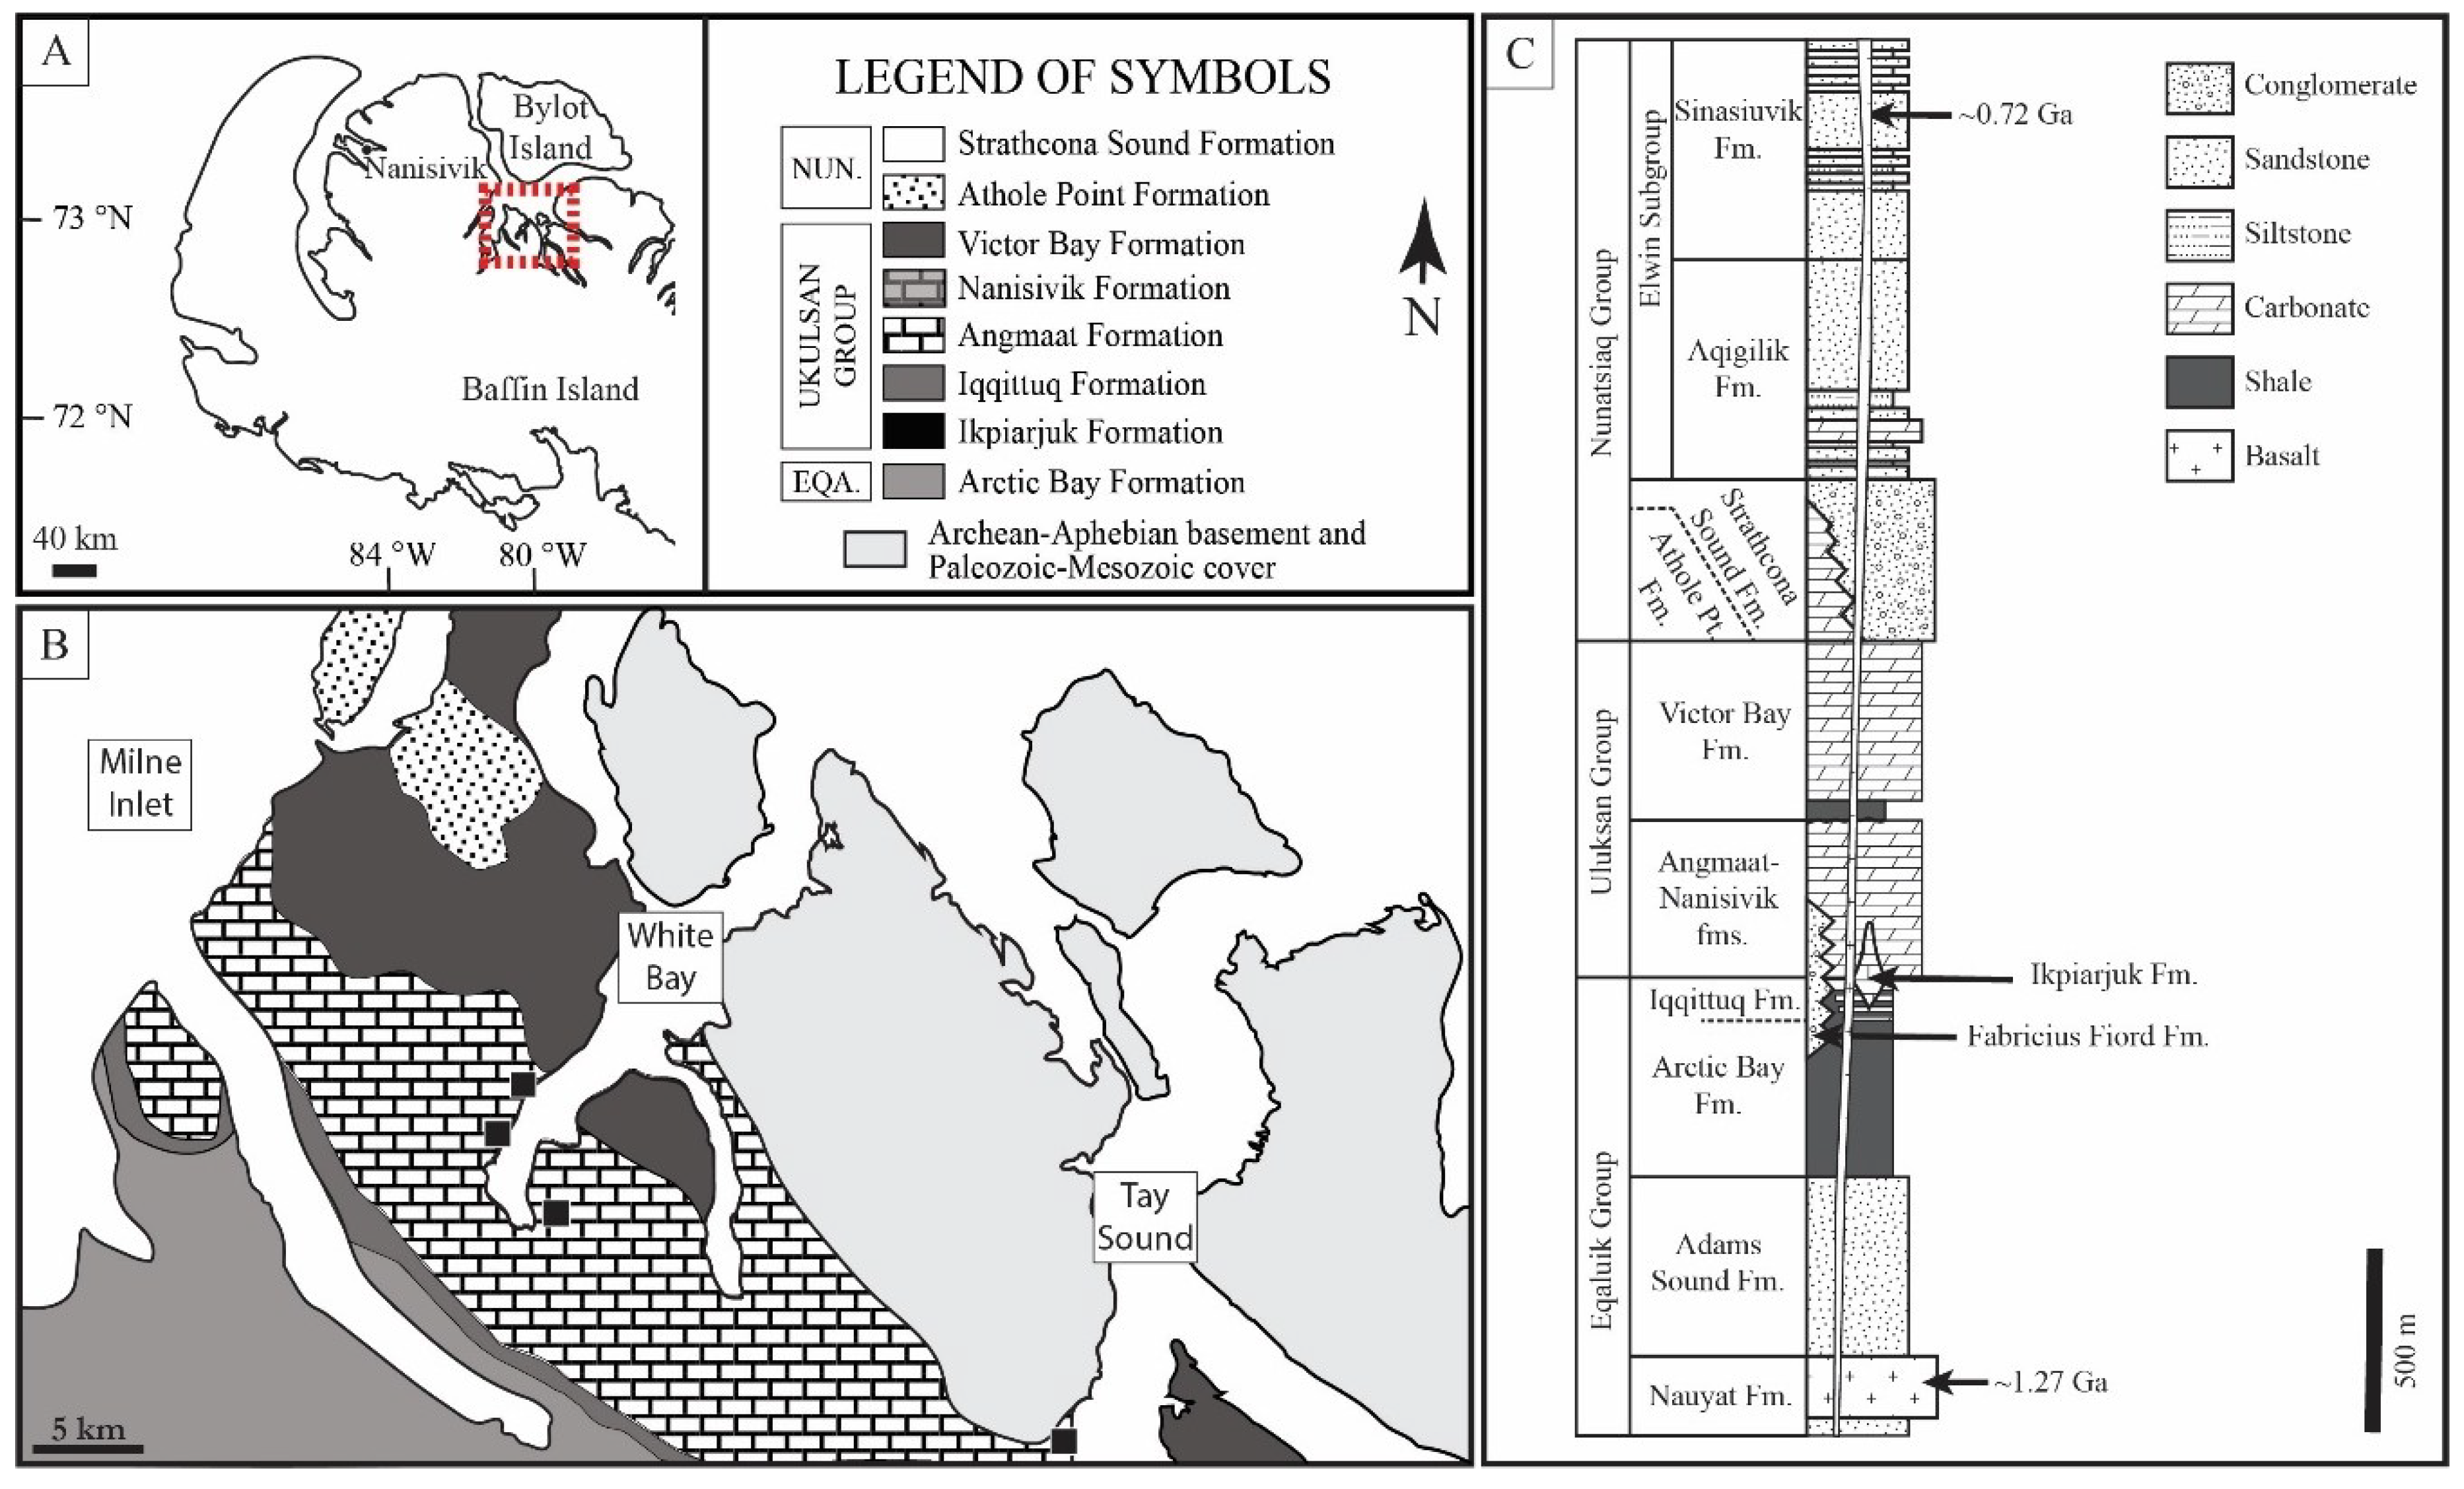
2. Geologic Setting
2.1. Bylot Supergroup
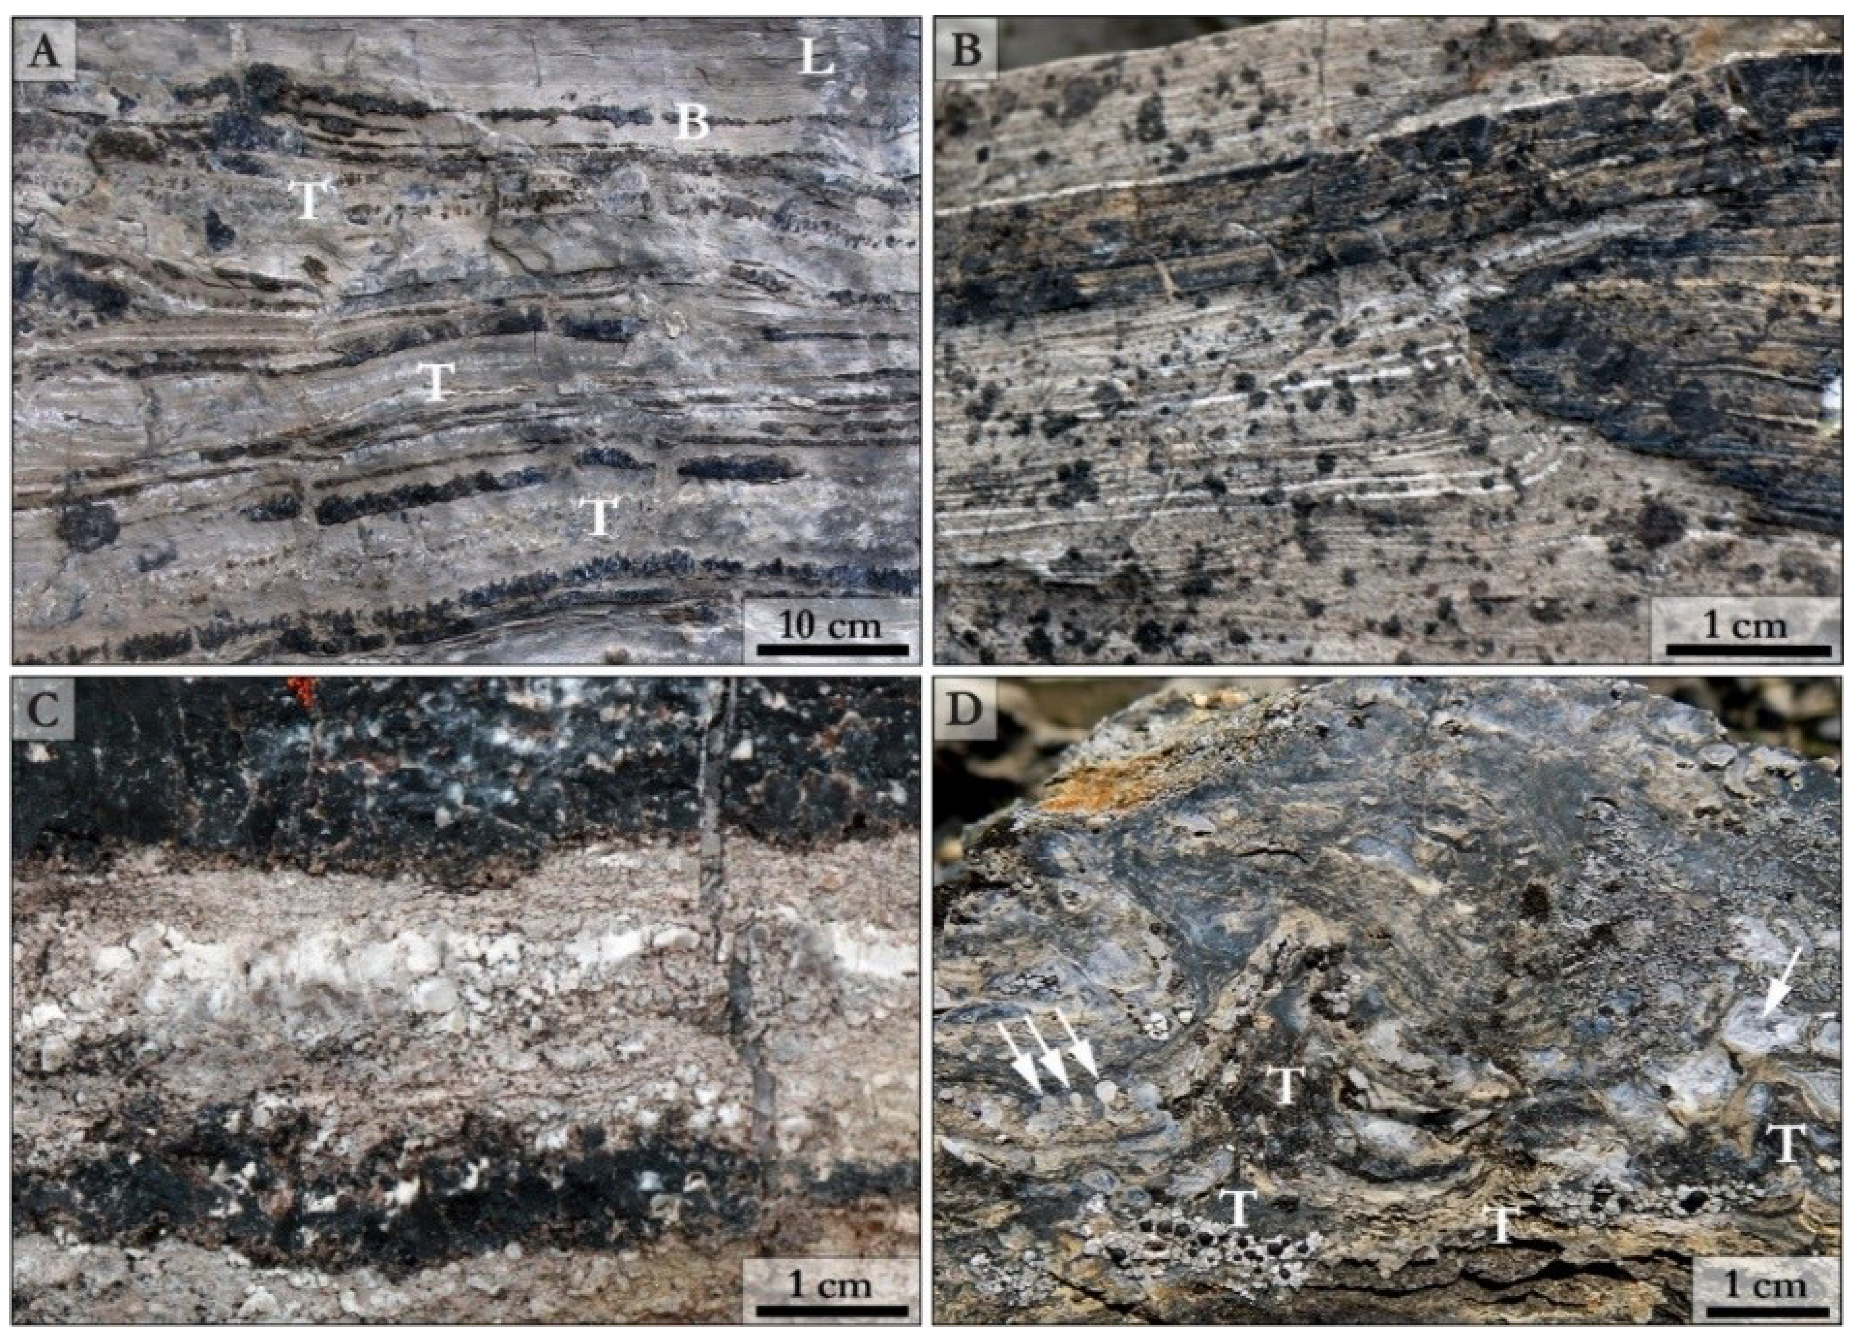
2.2. Angmaat Formation Chert
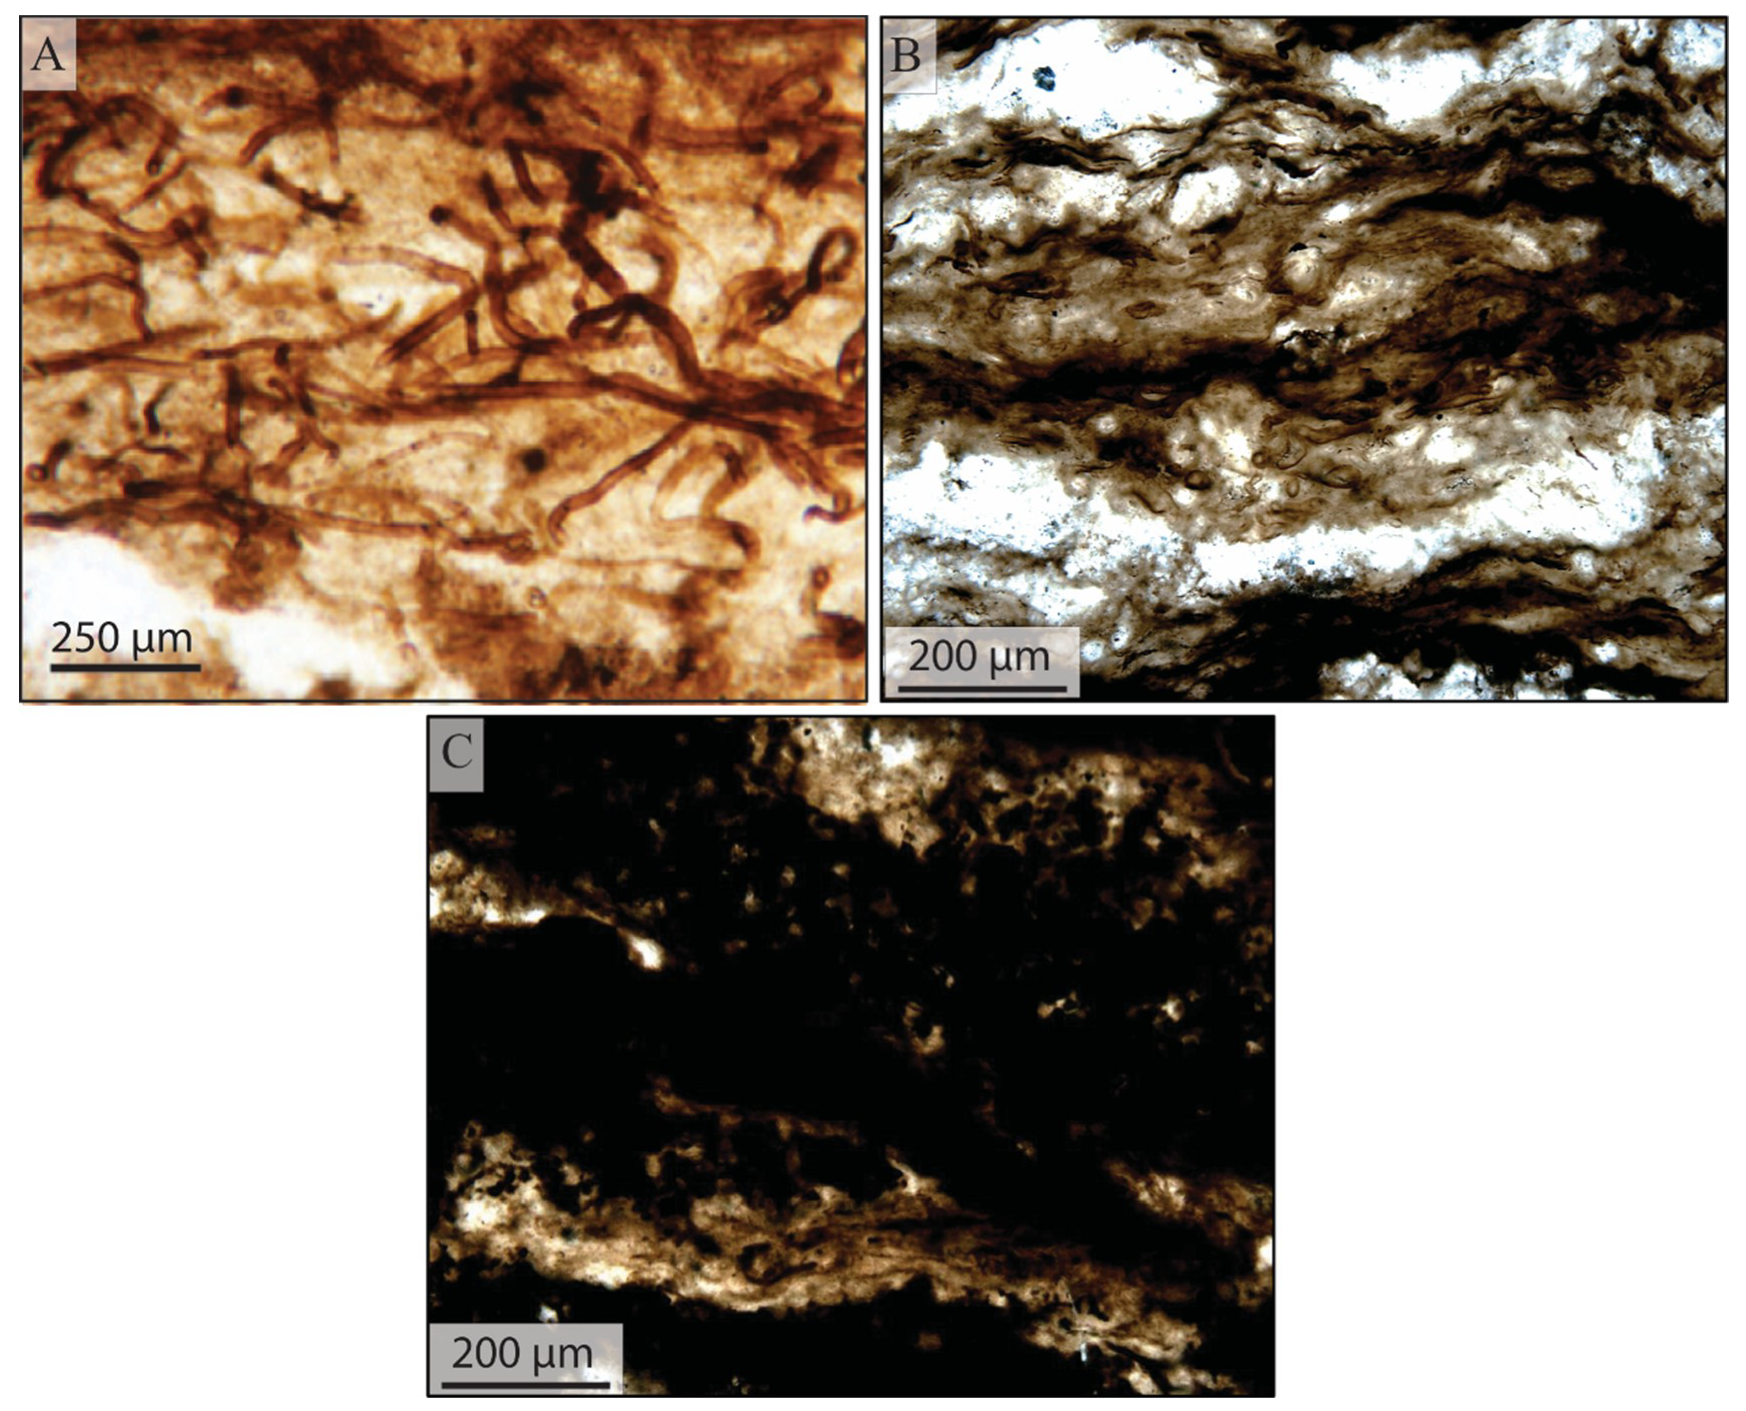
2.3. Microbial Assemblages of the Angmaat Formation
3. Methods
4. Taphonomic Techniques
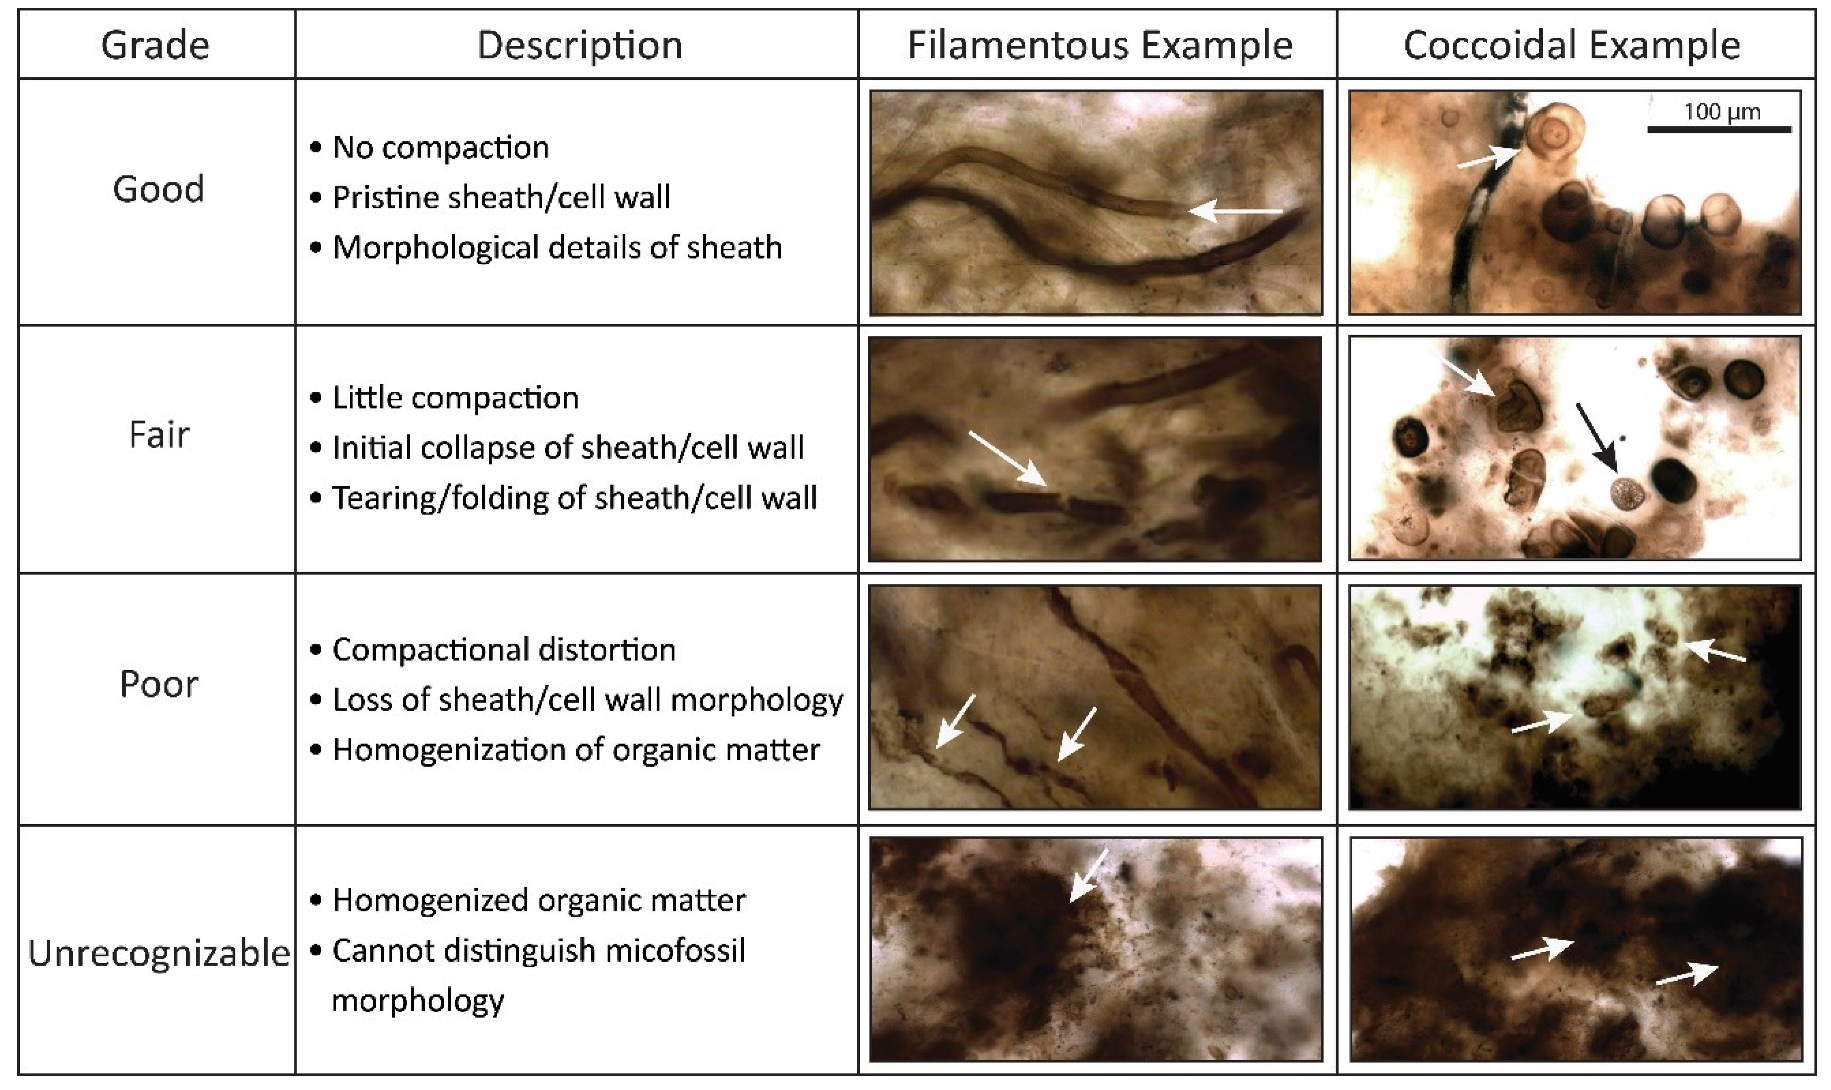
4.1. Taphonomic Classification
4.2. Taphonomic Analysis Using Traditional Point Counting
4.3. Taphonomic Analysis Using Image Mosaics
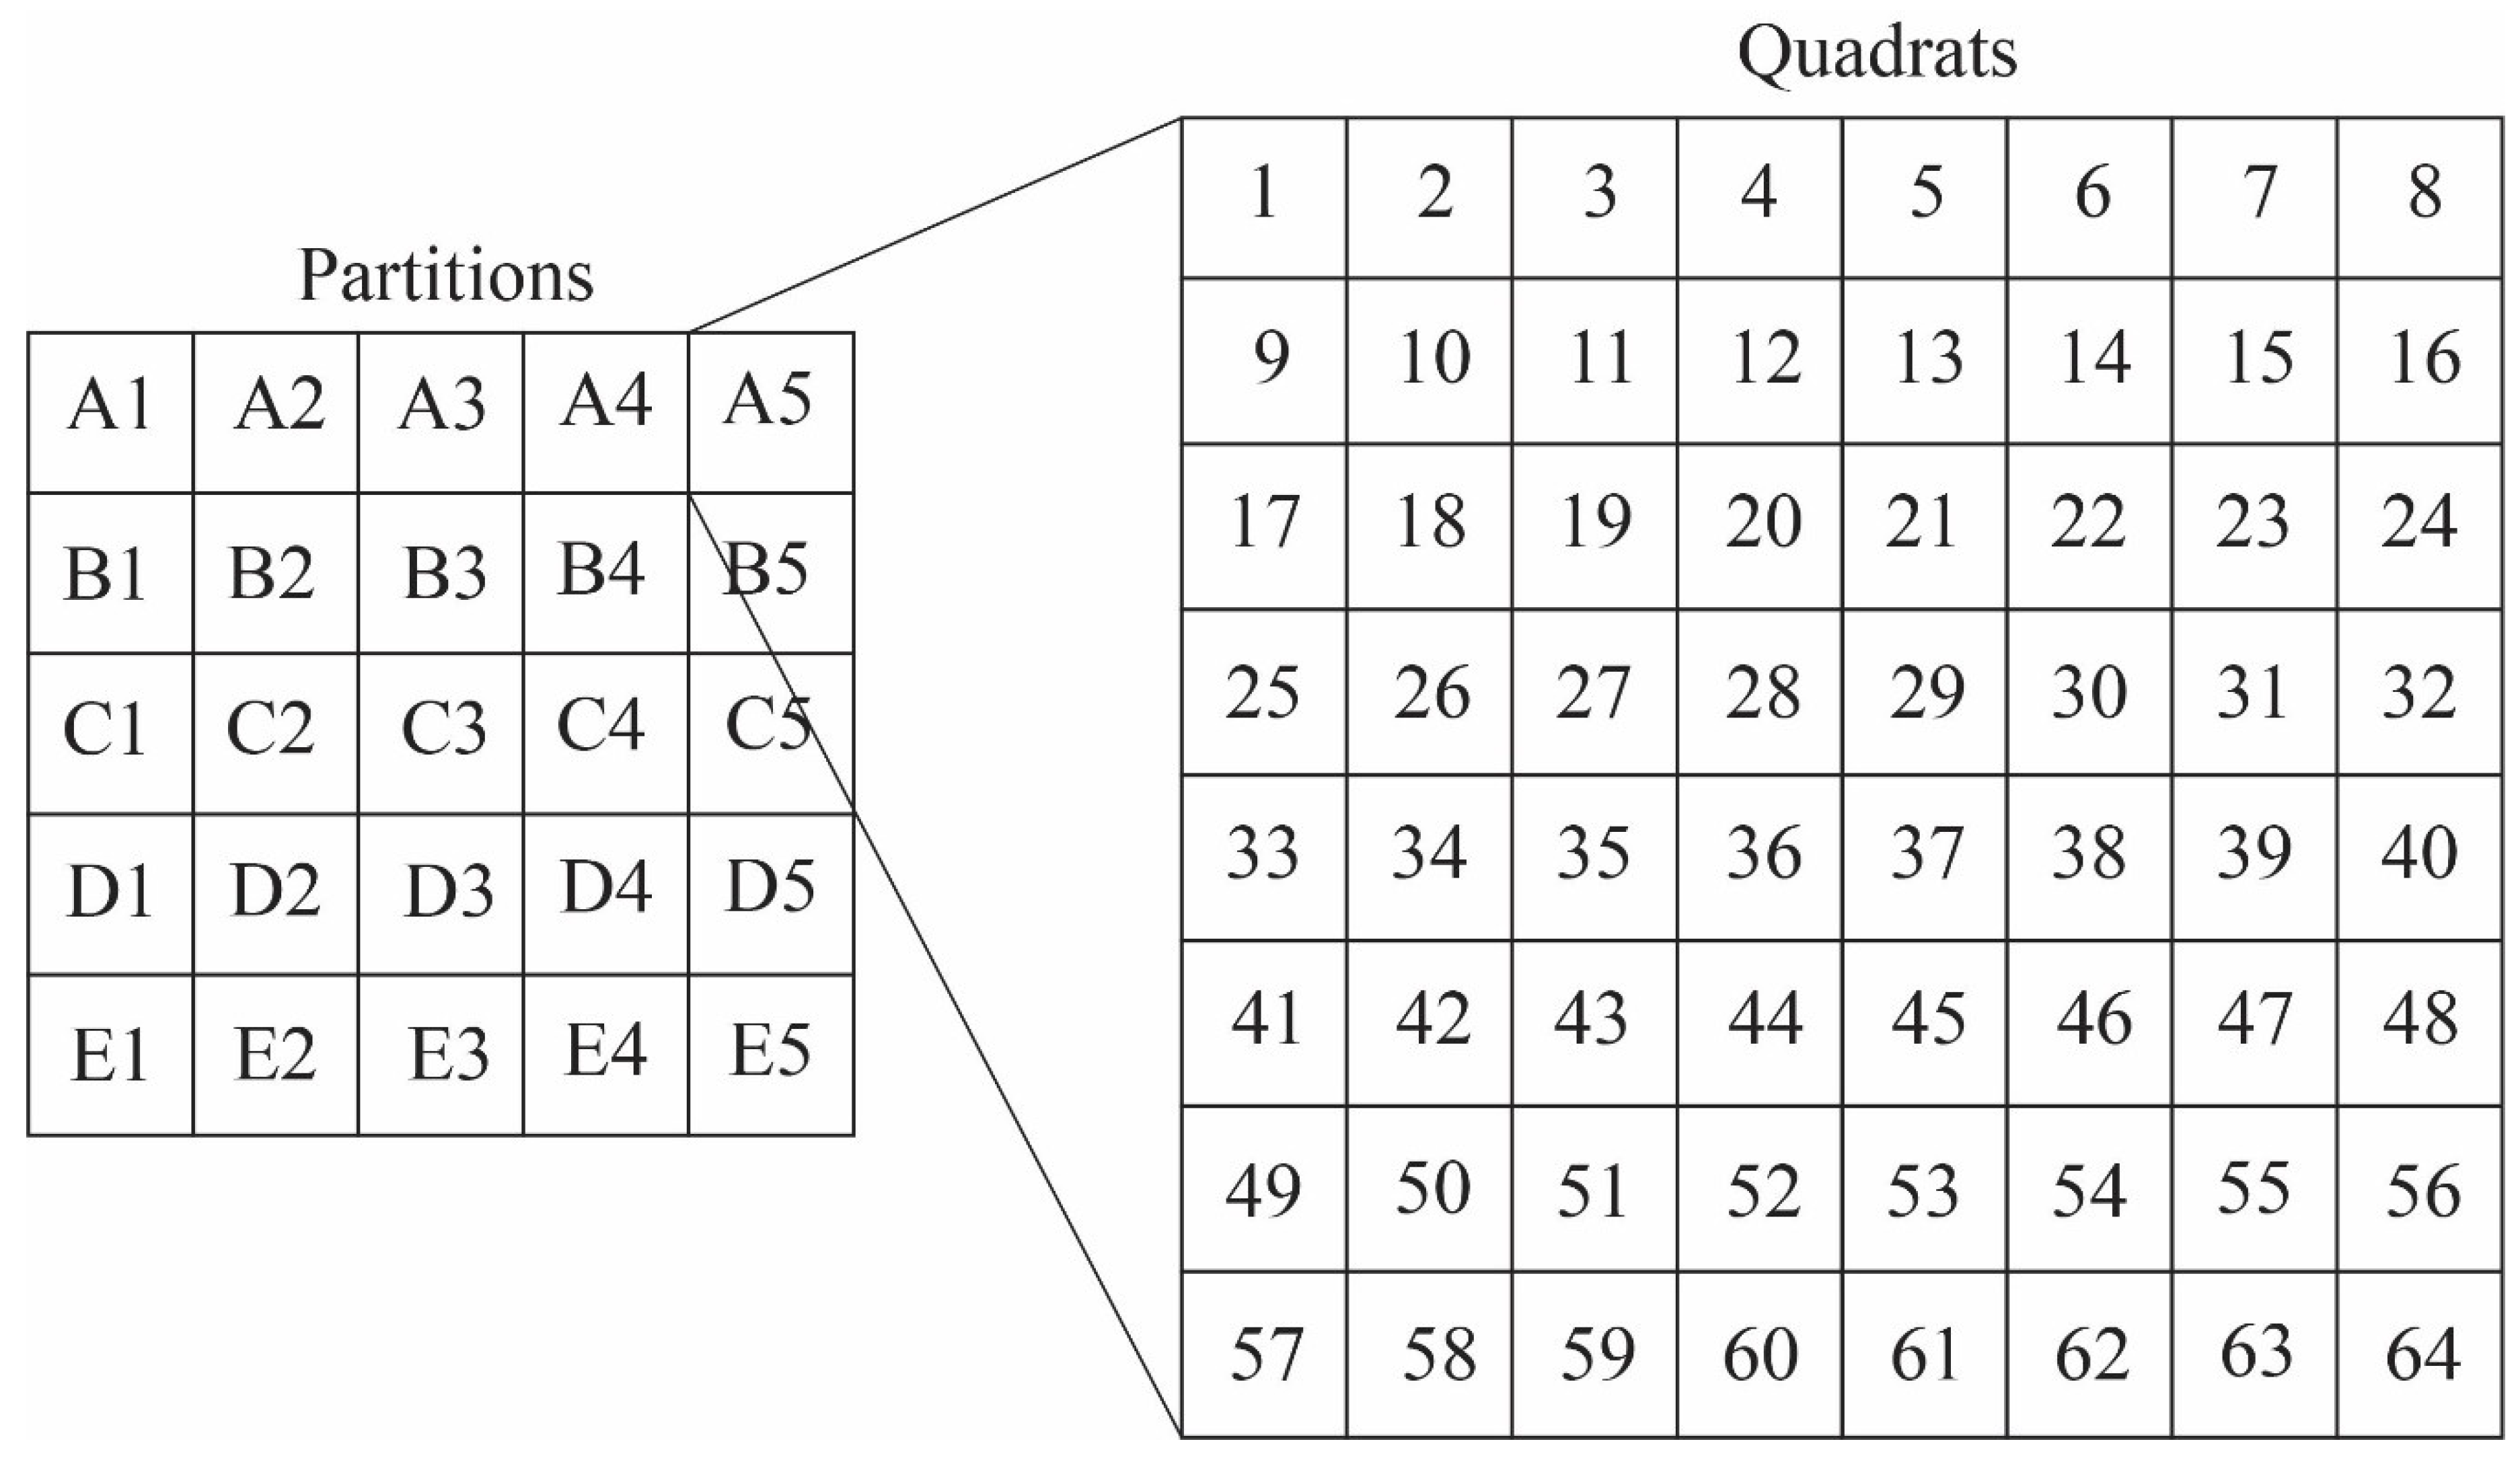
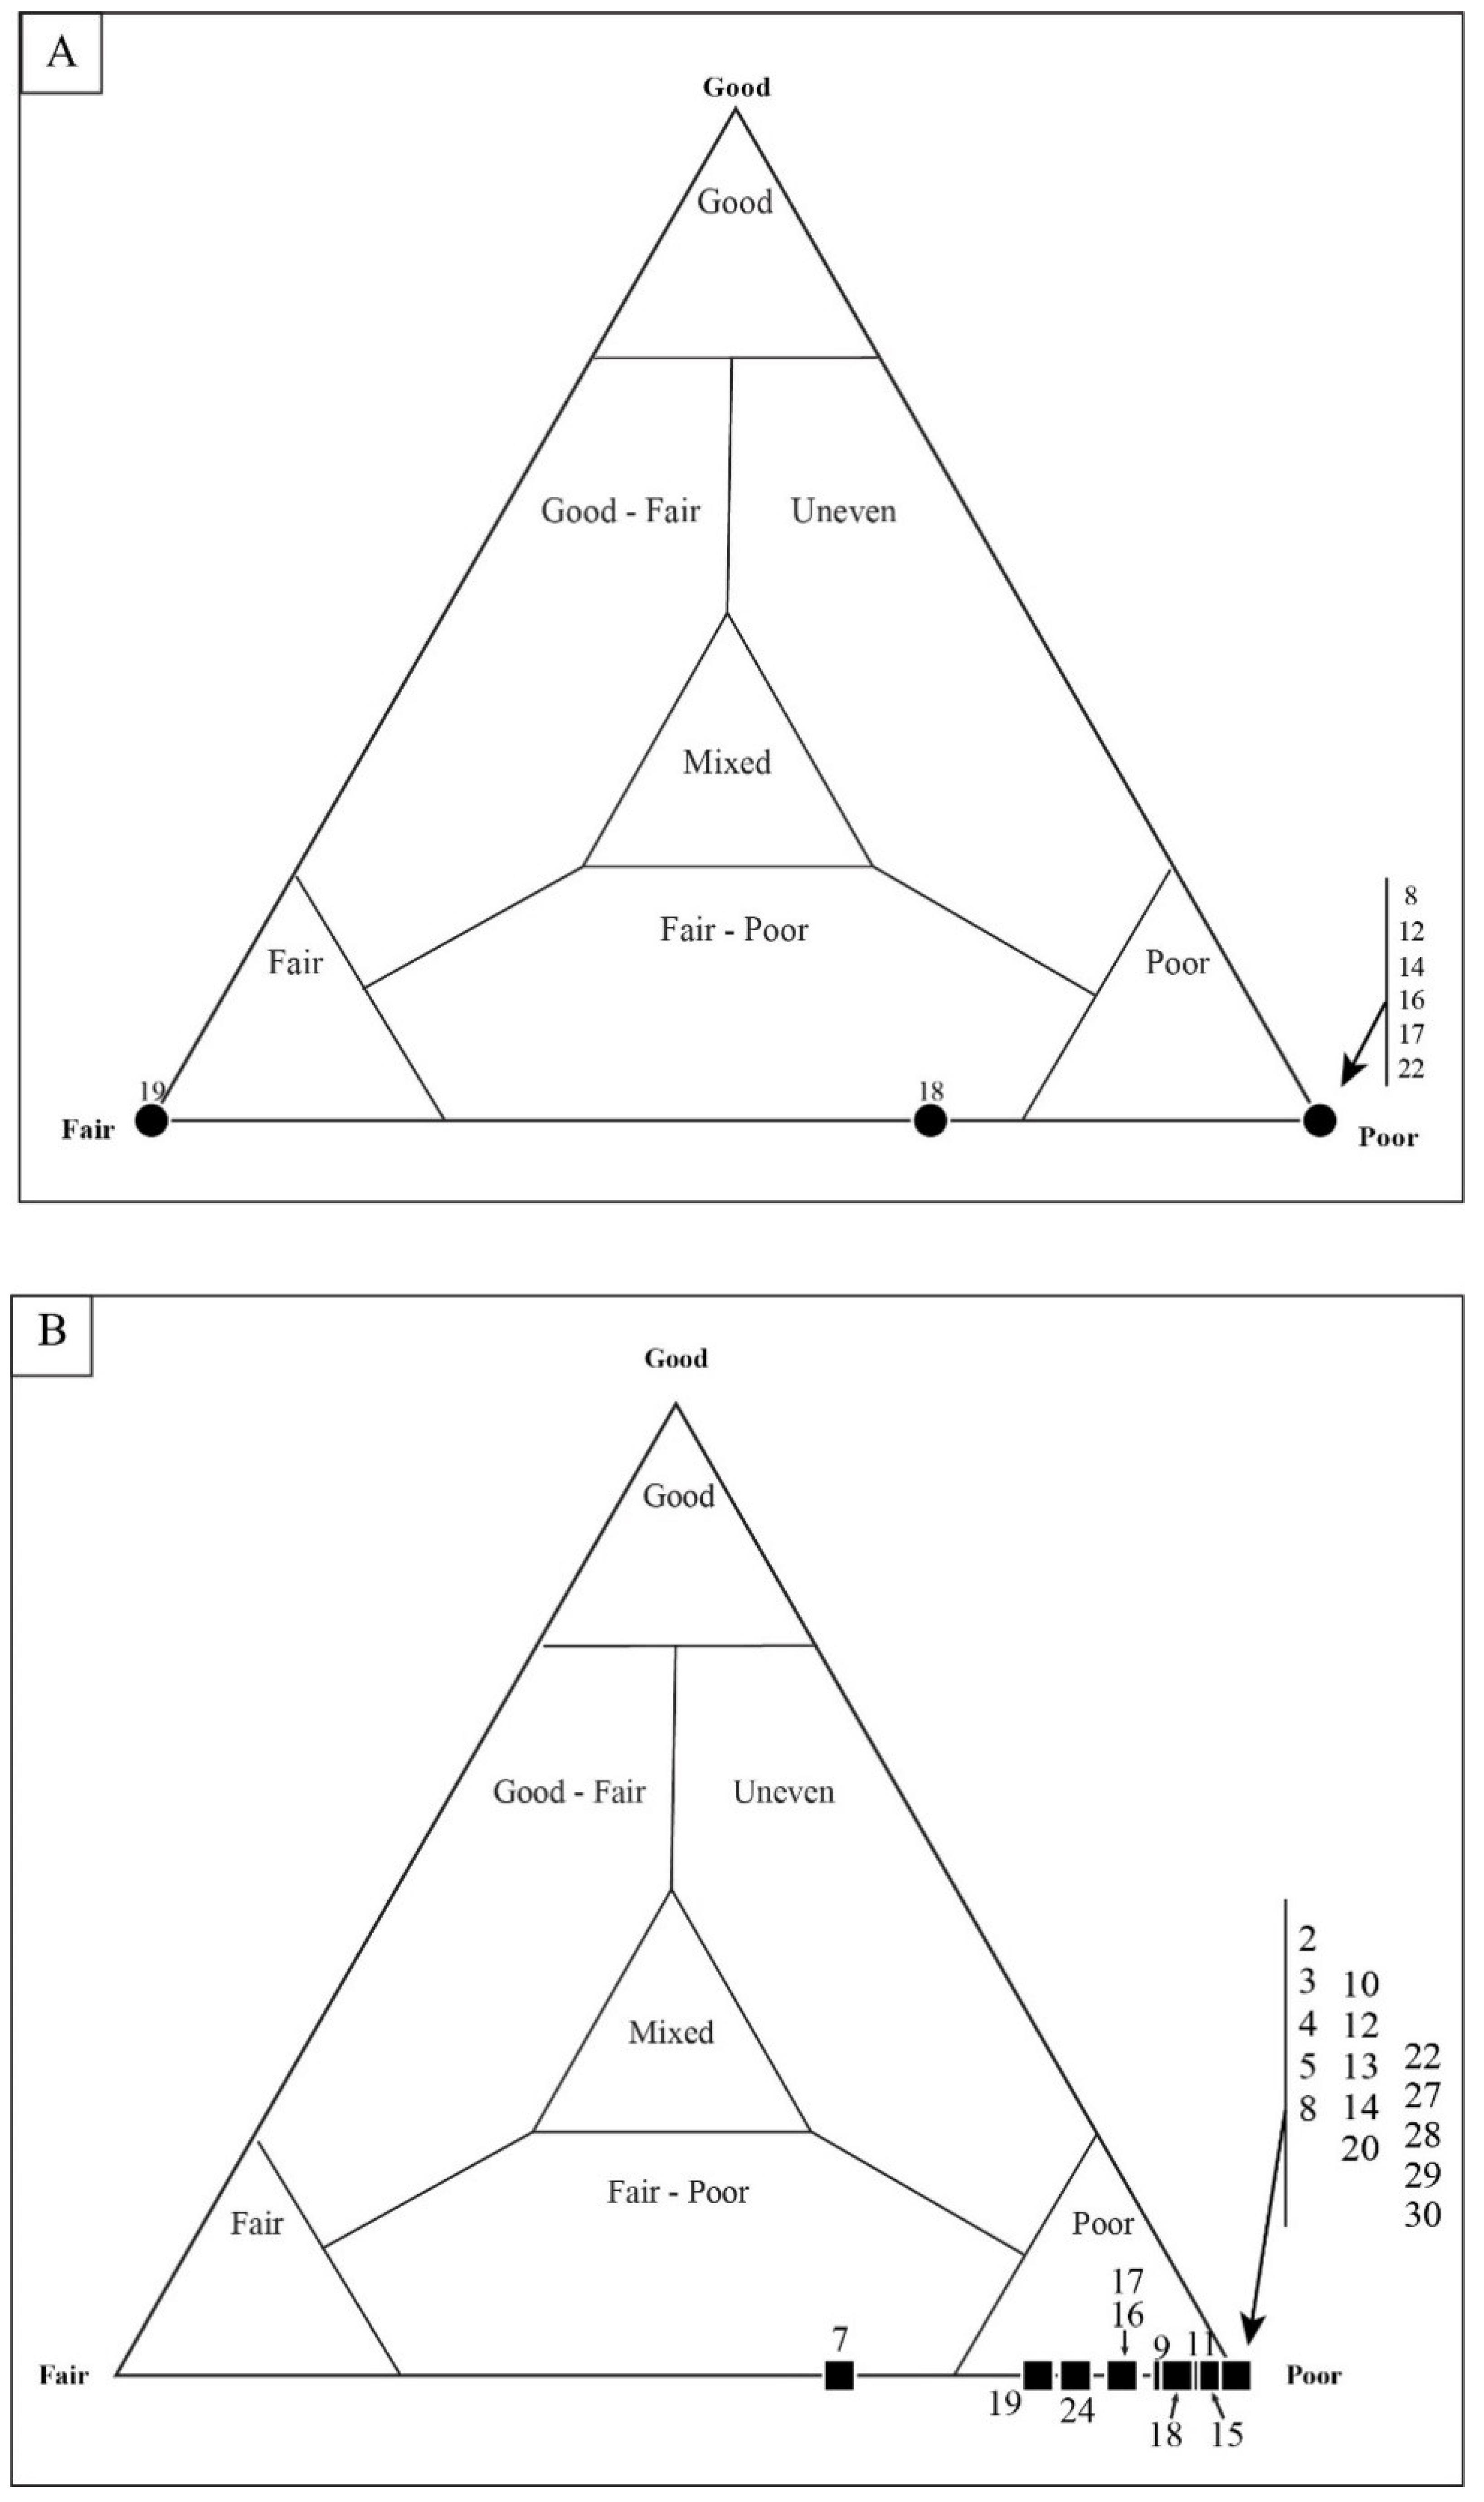
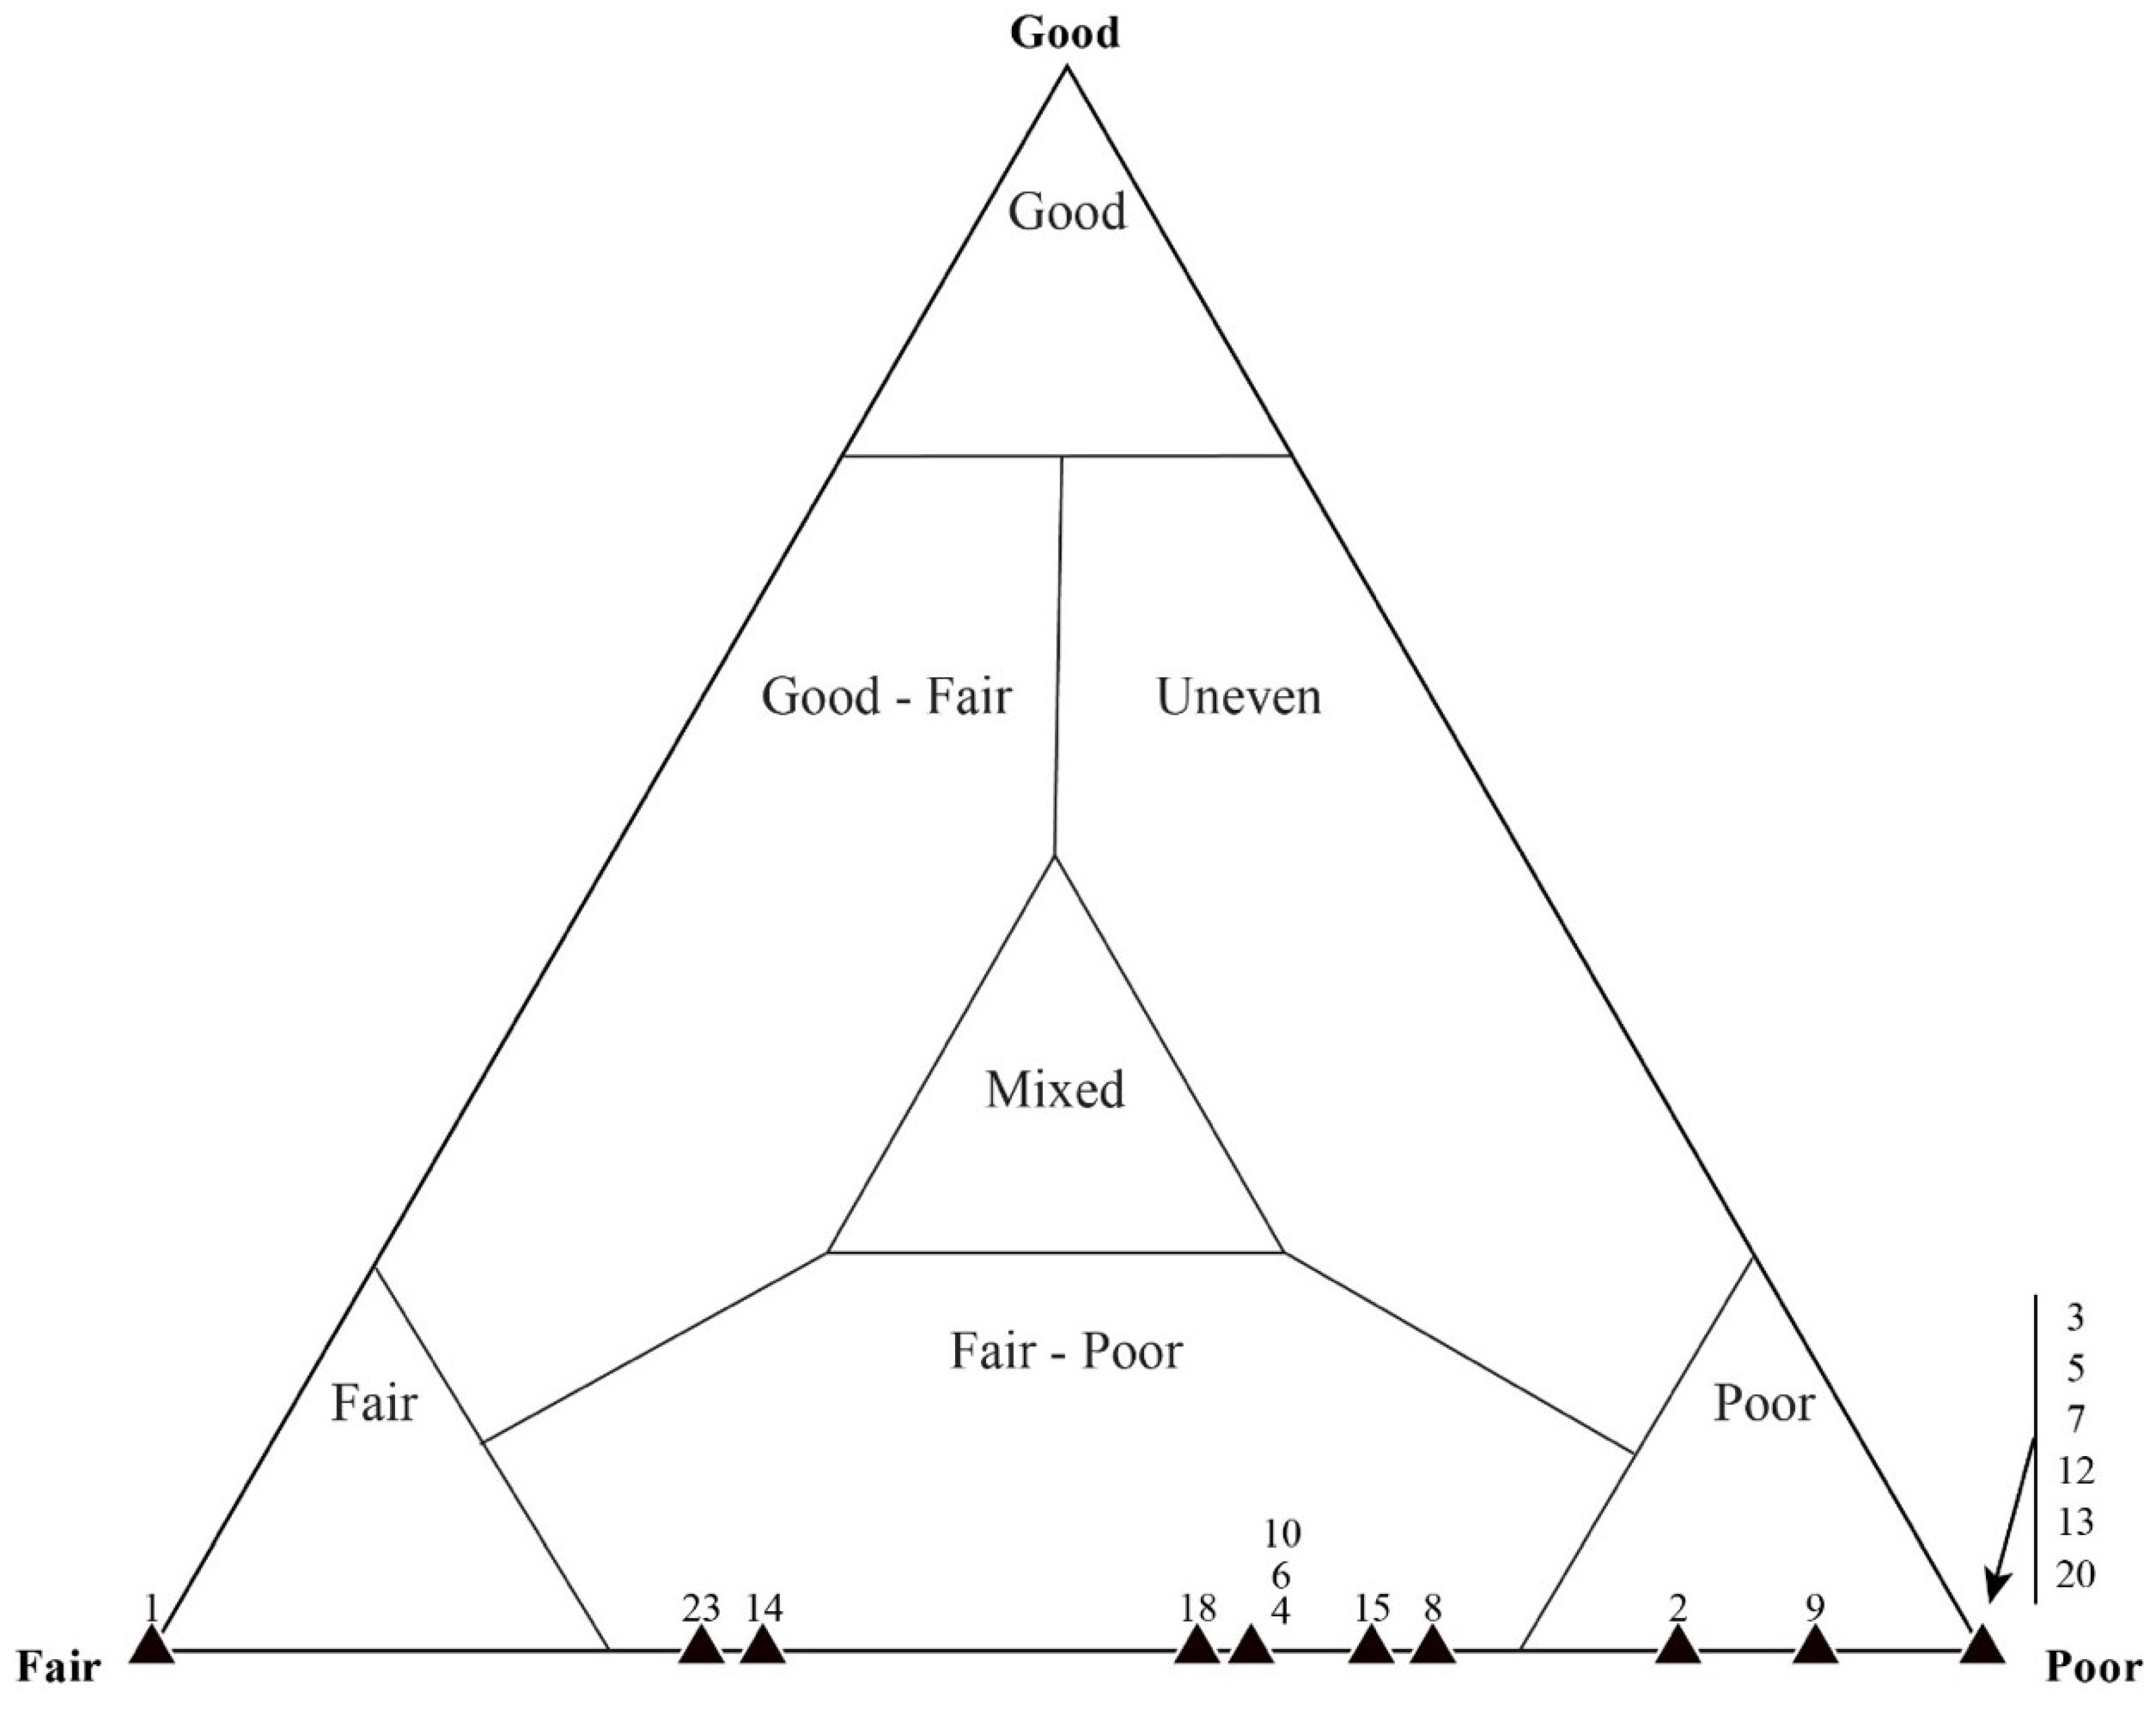
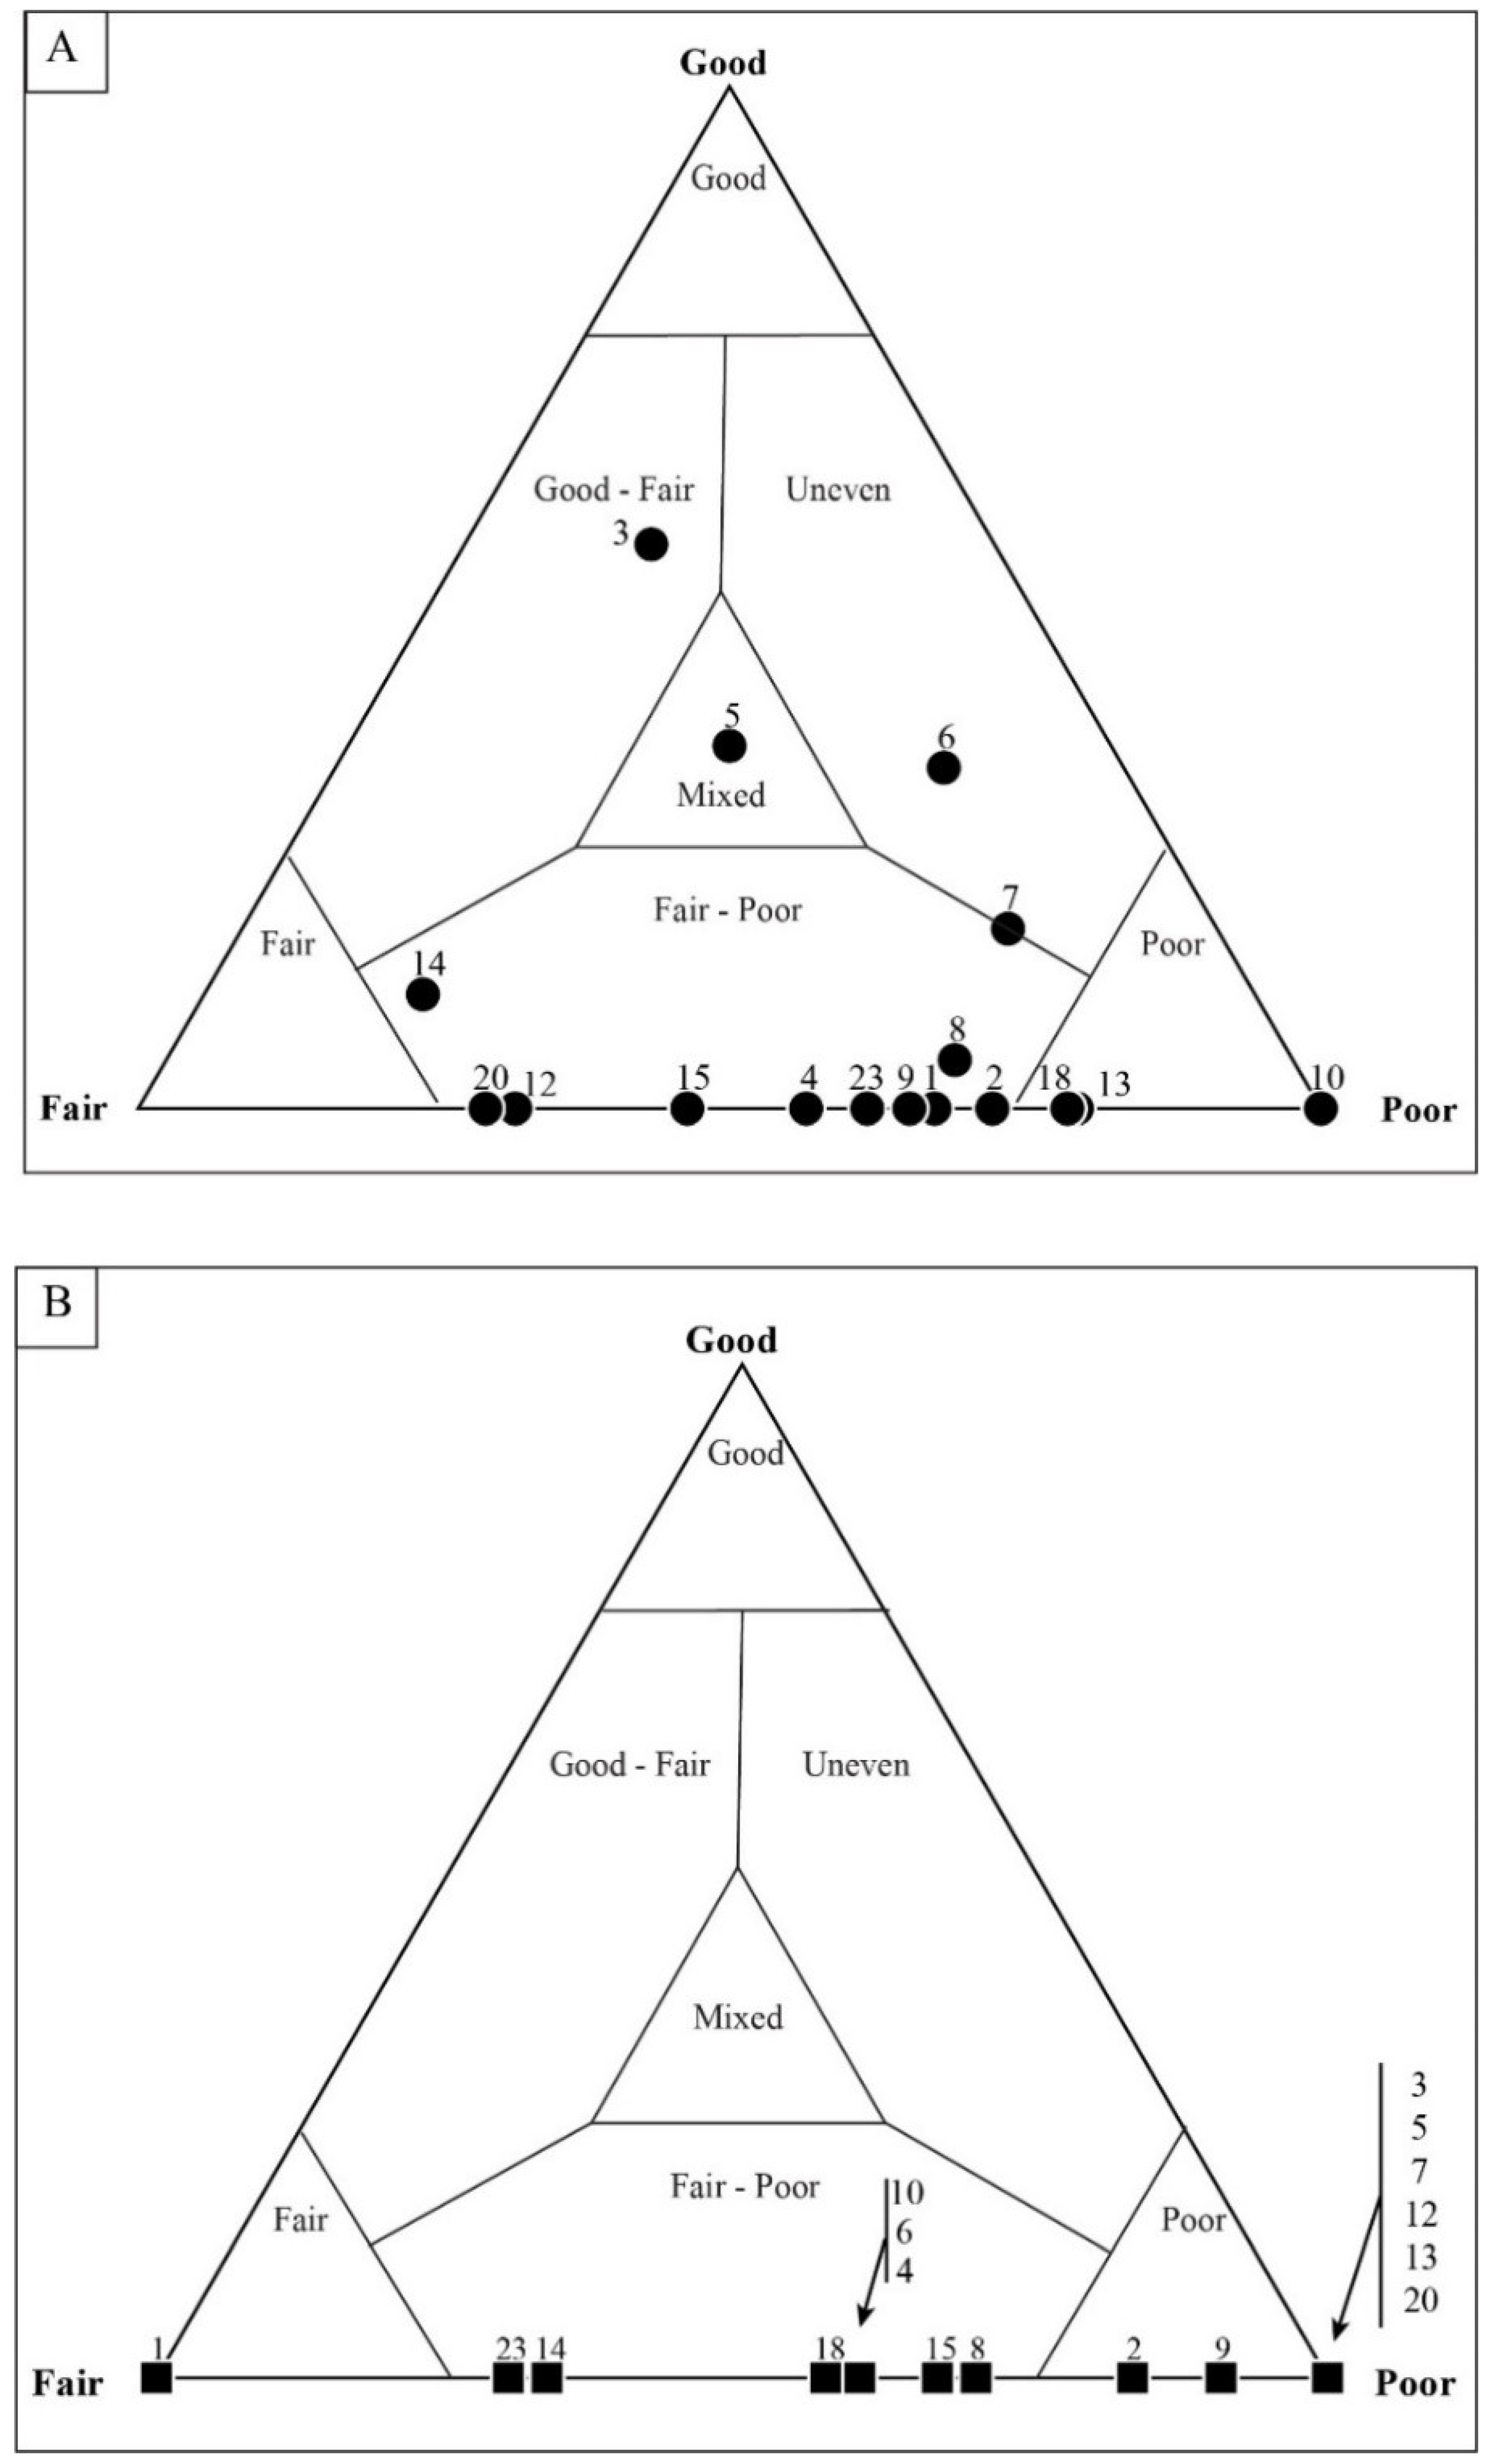
Quadrat Sampling within Image Mosaics
5. Results
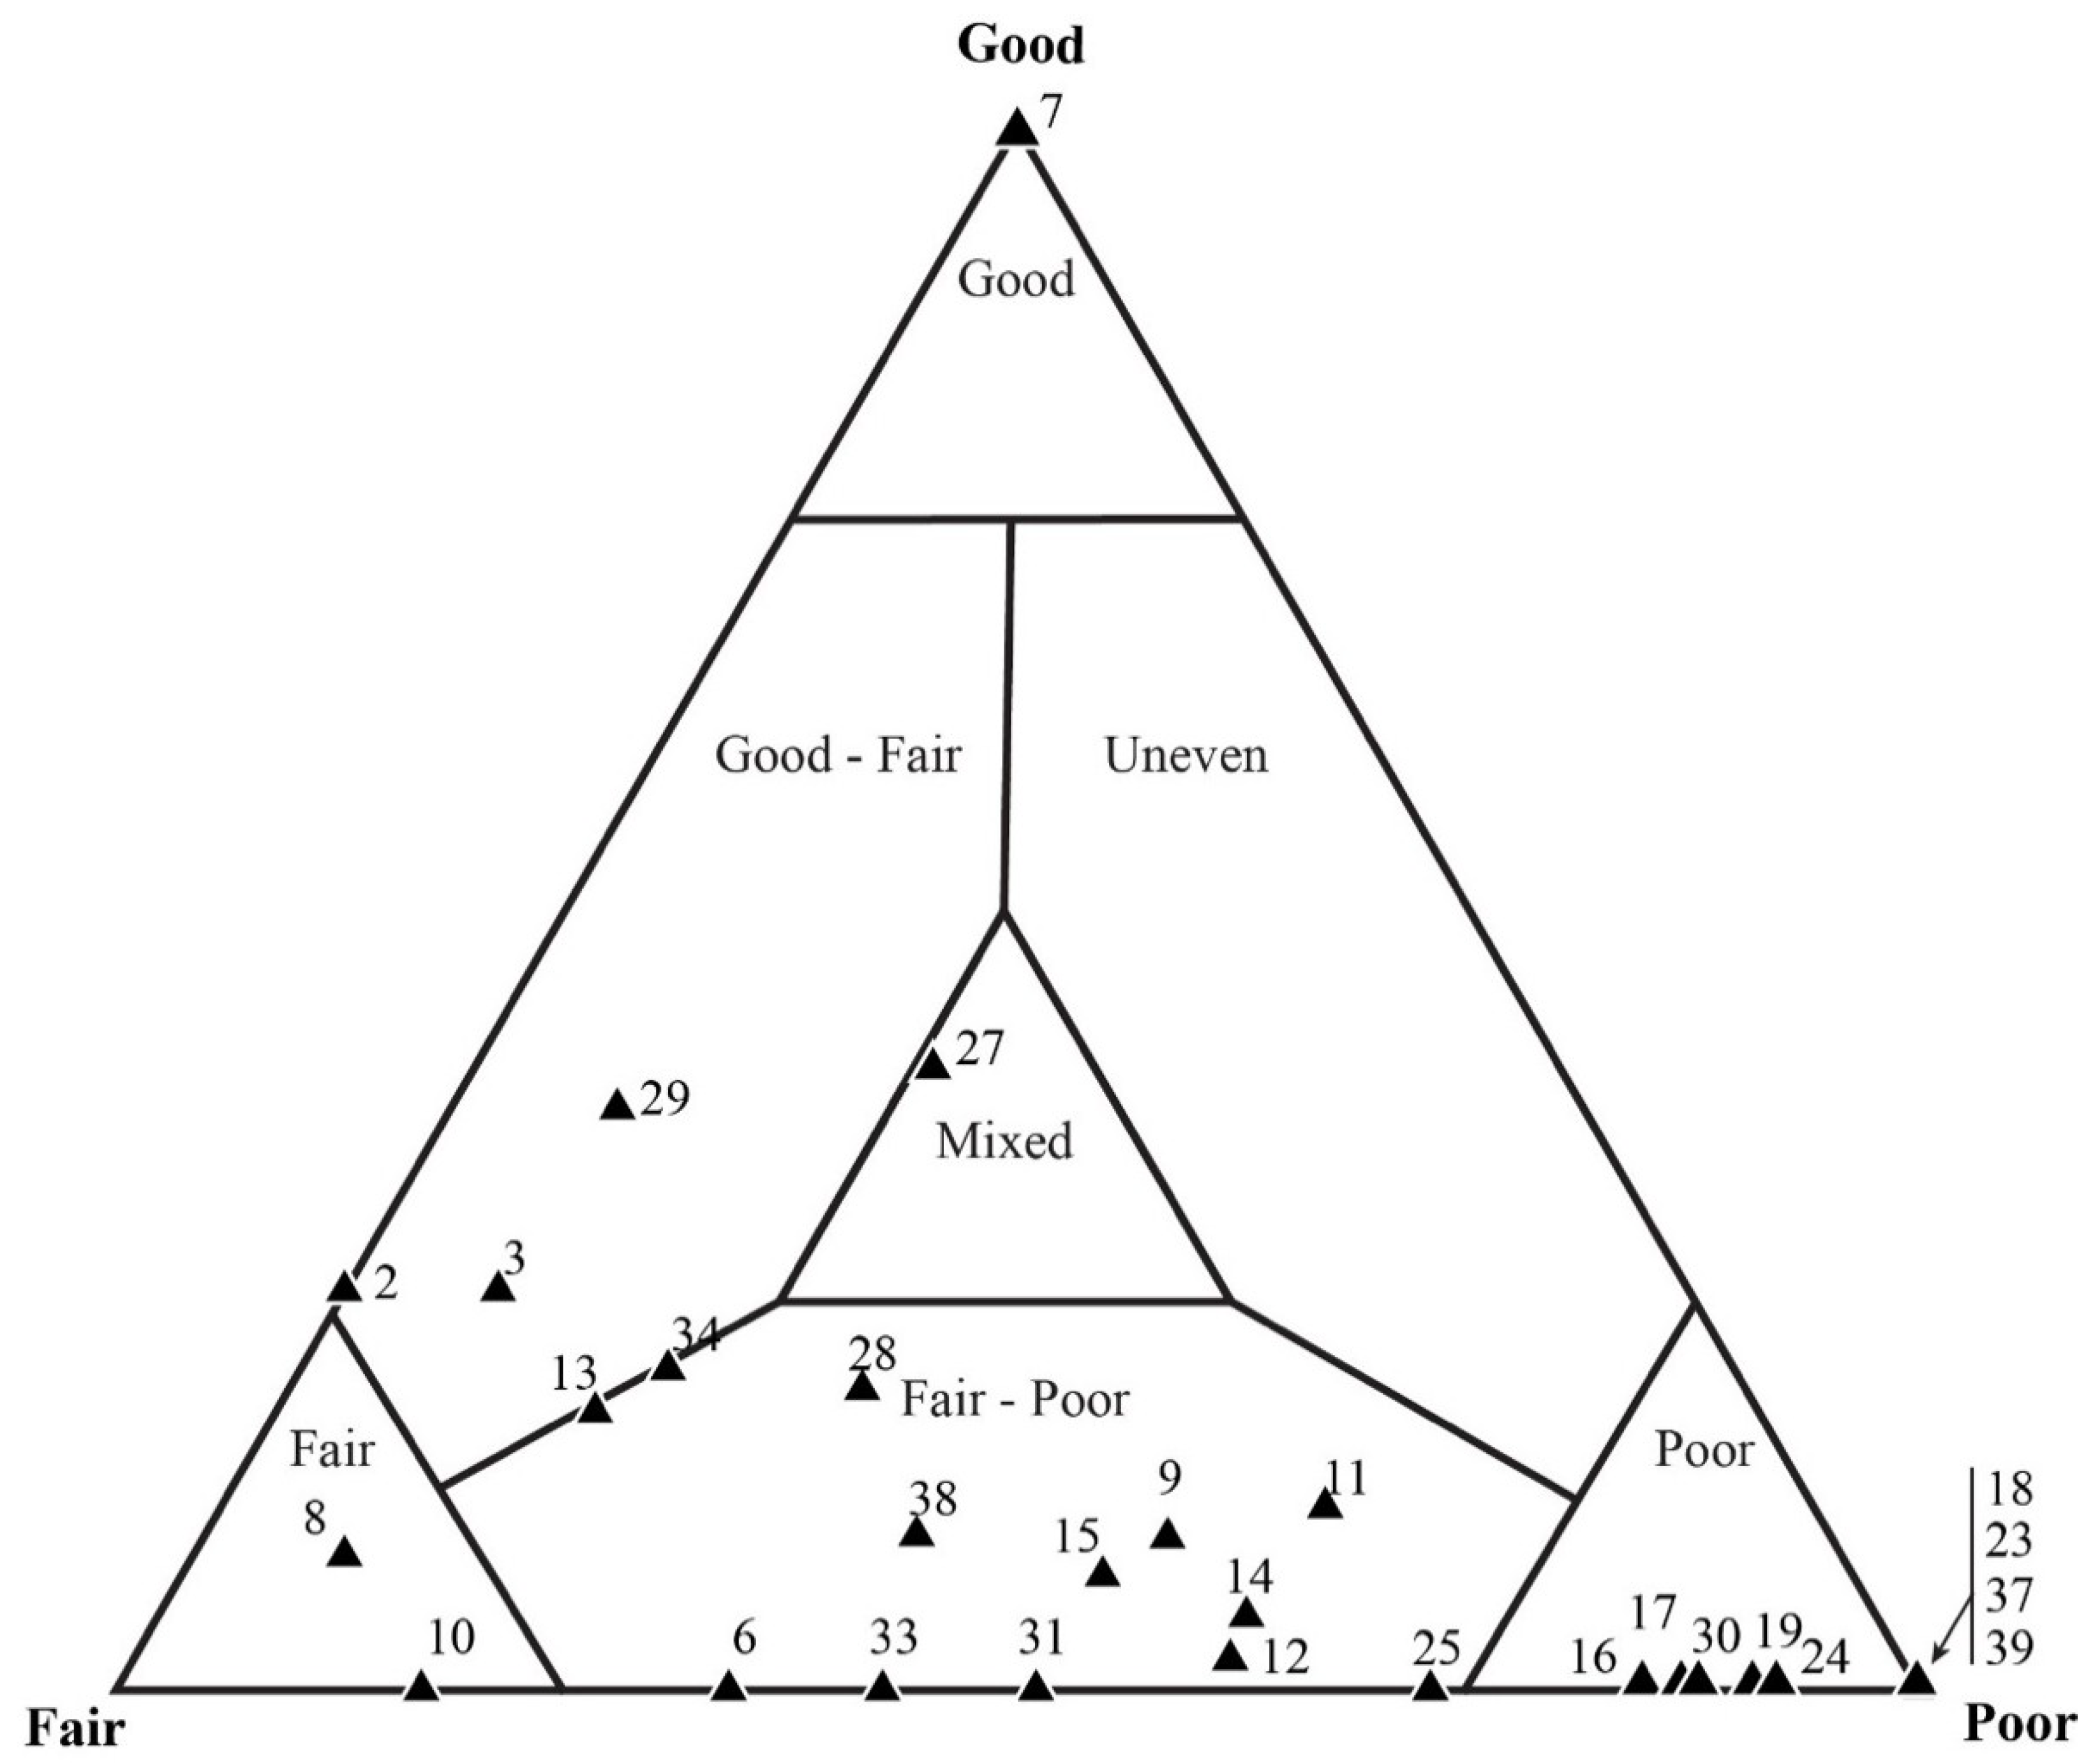
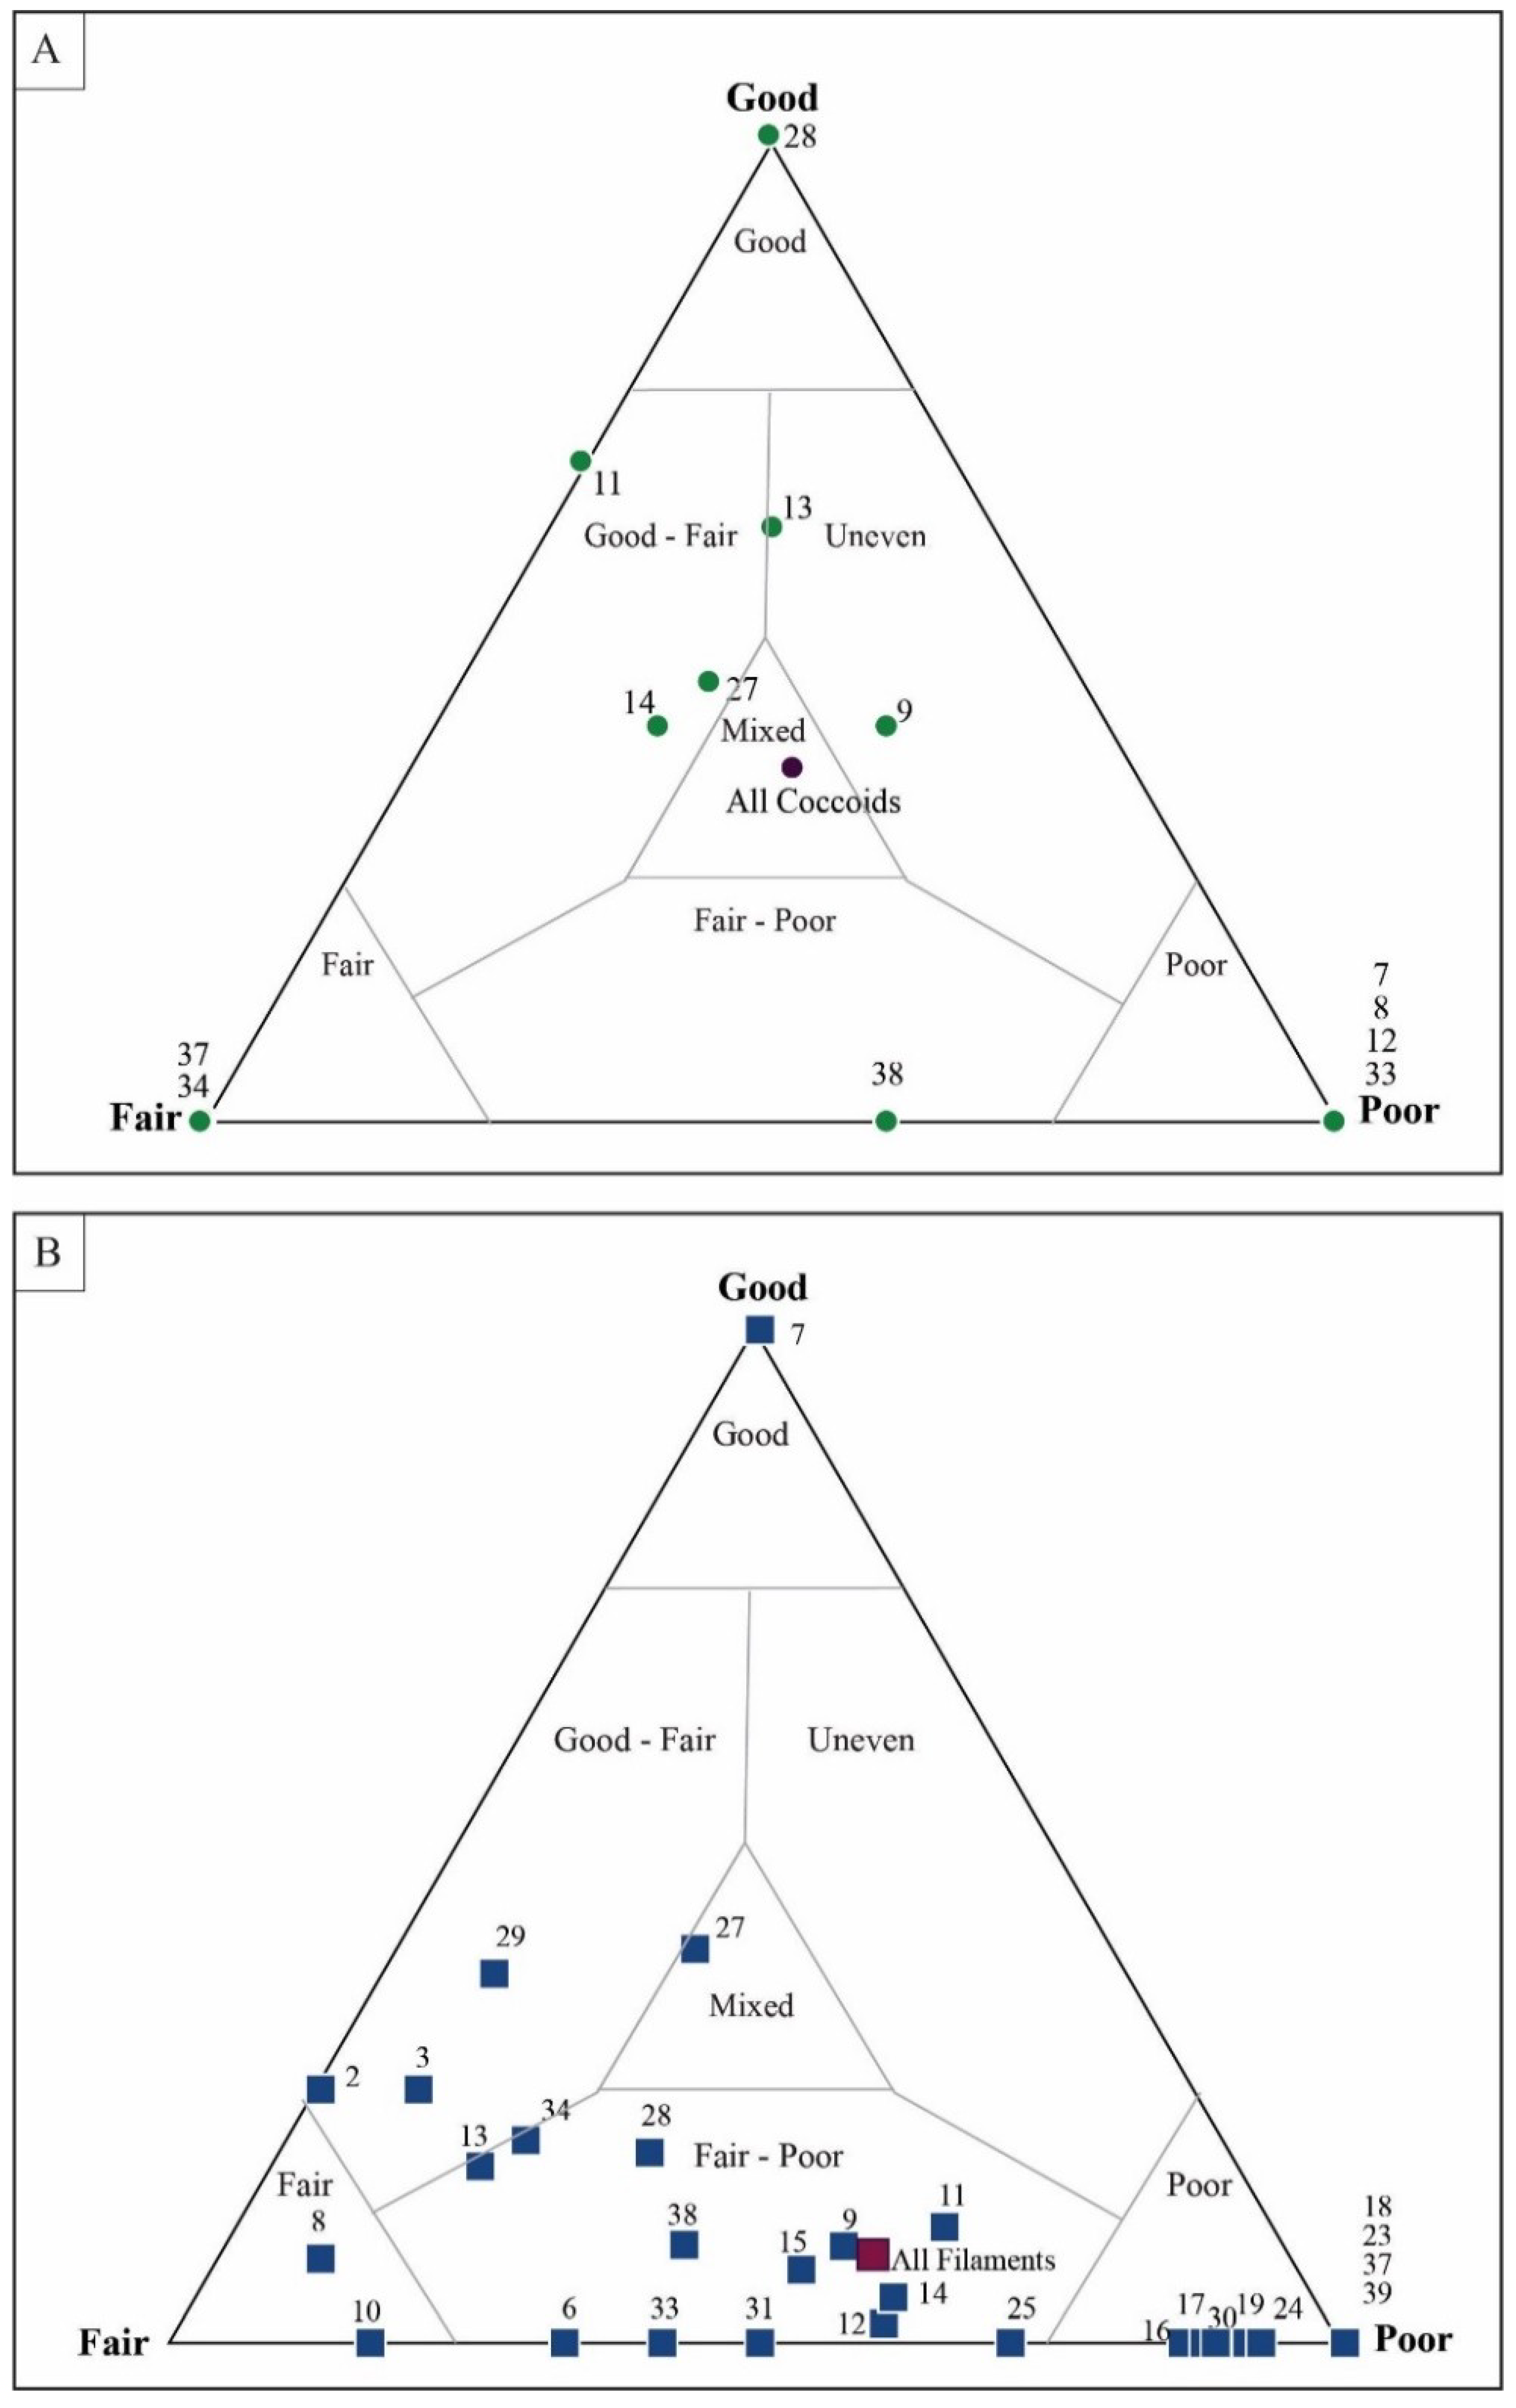
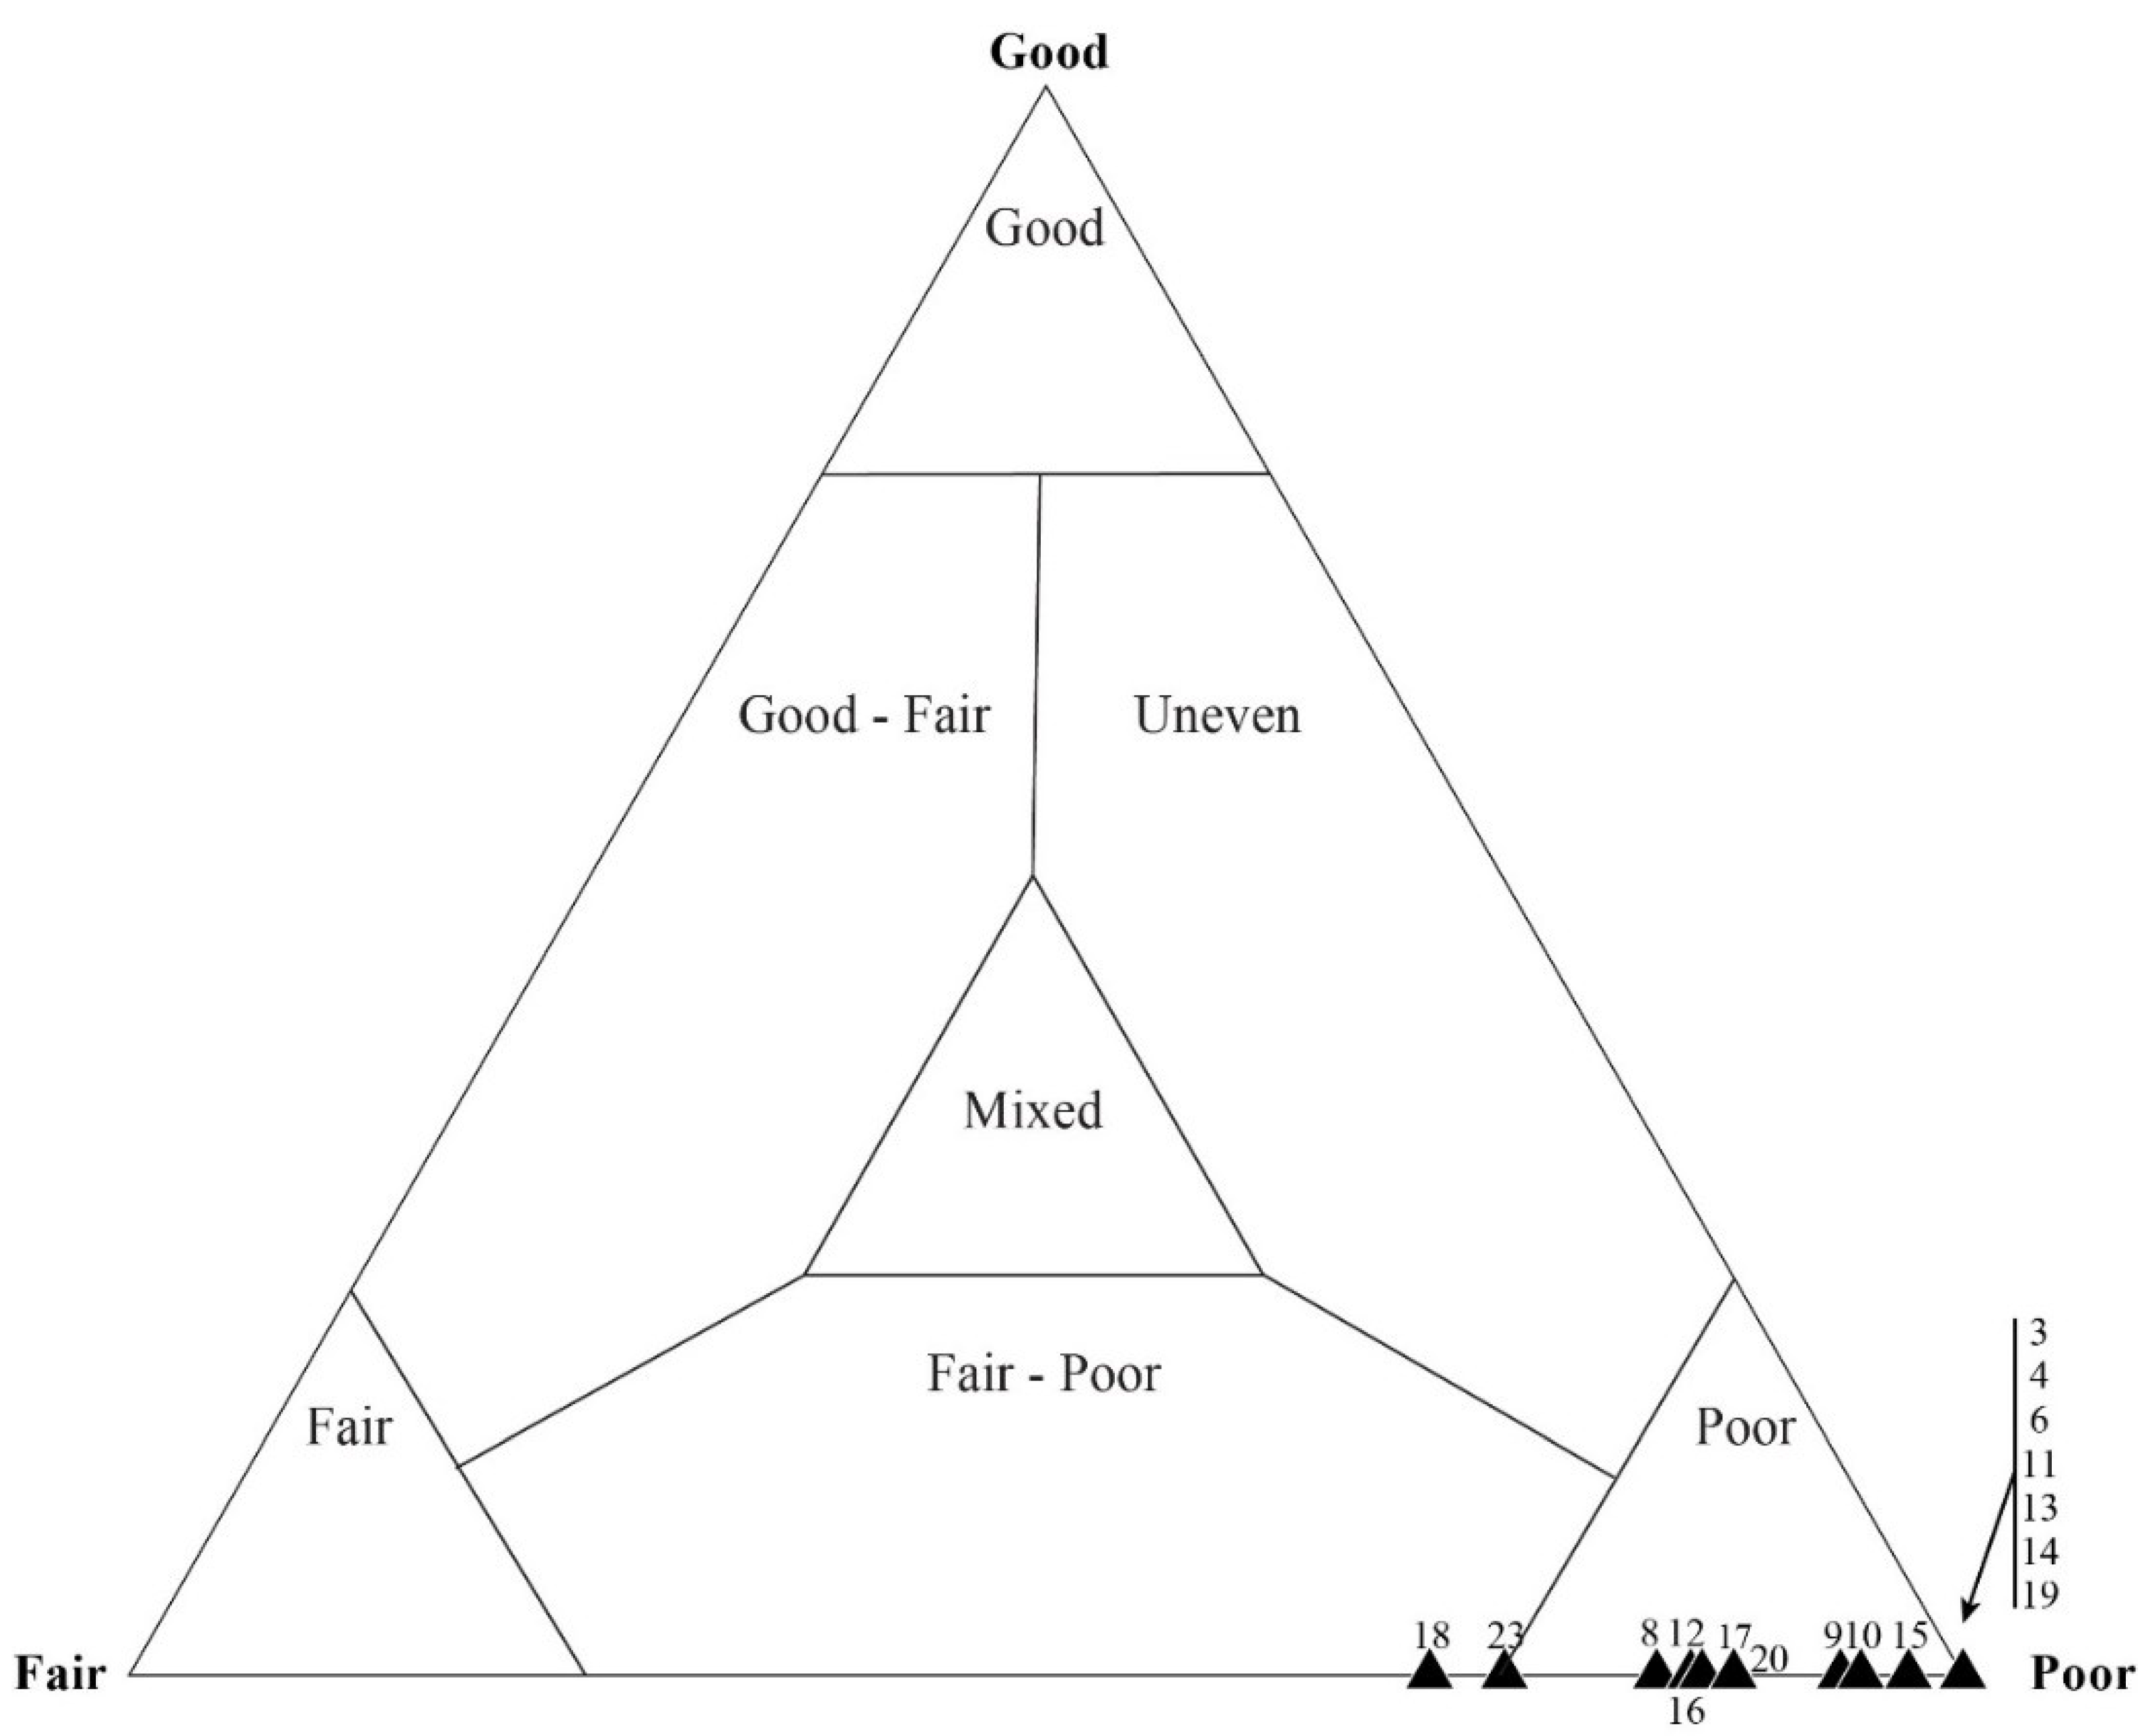
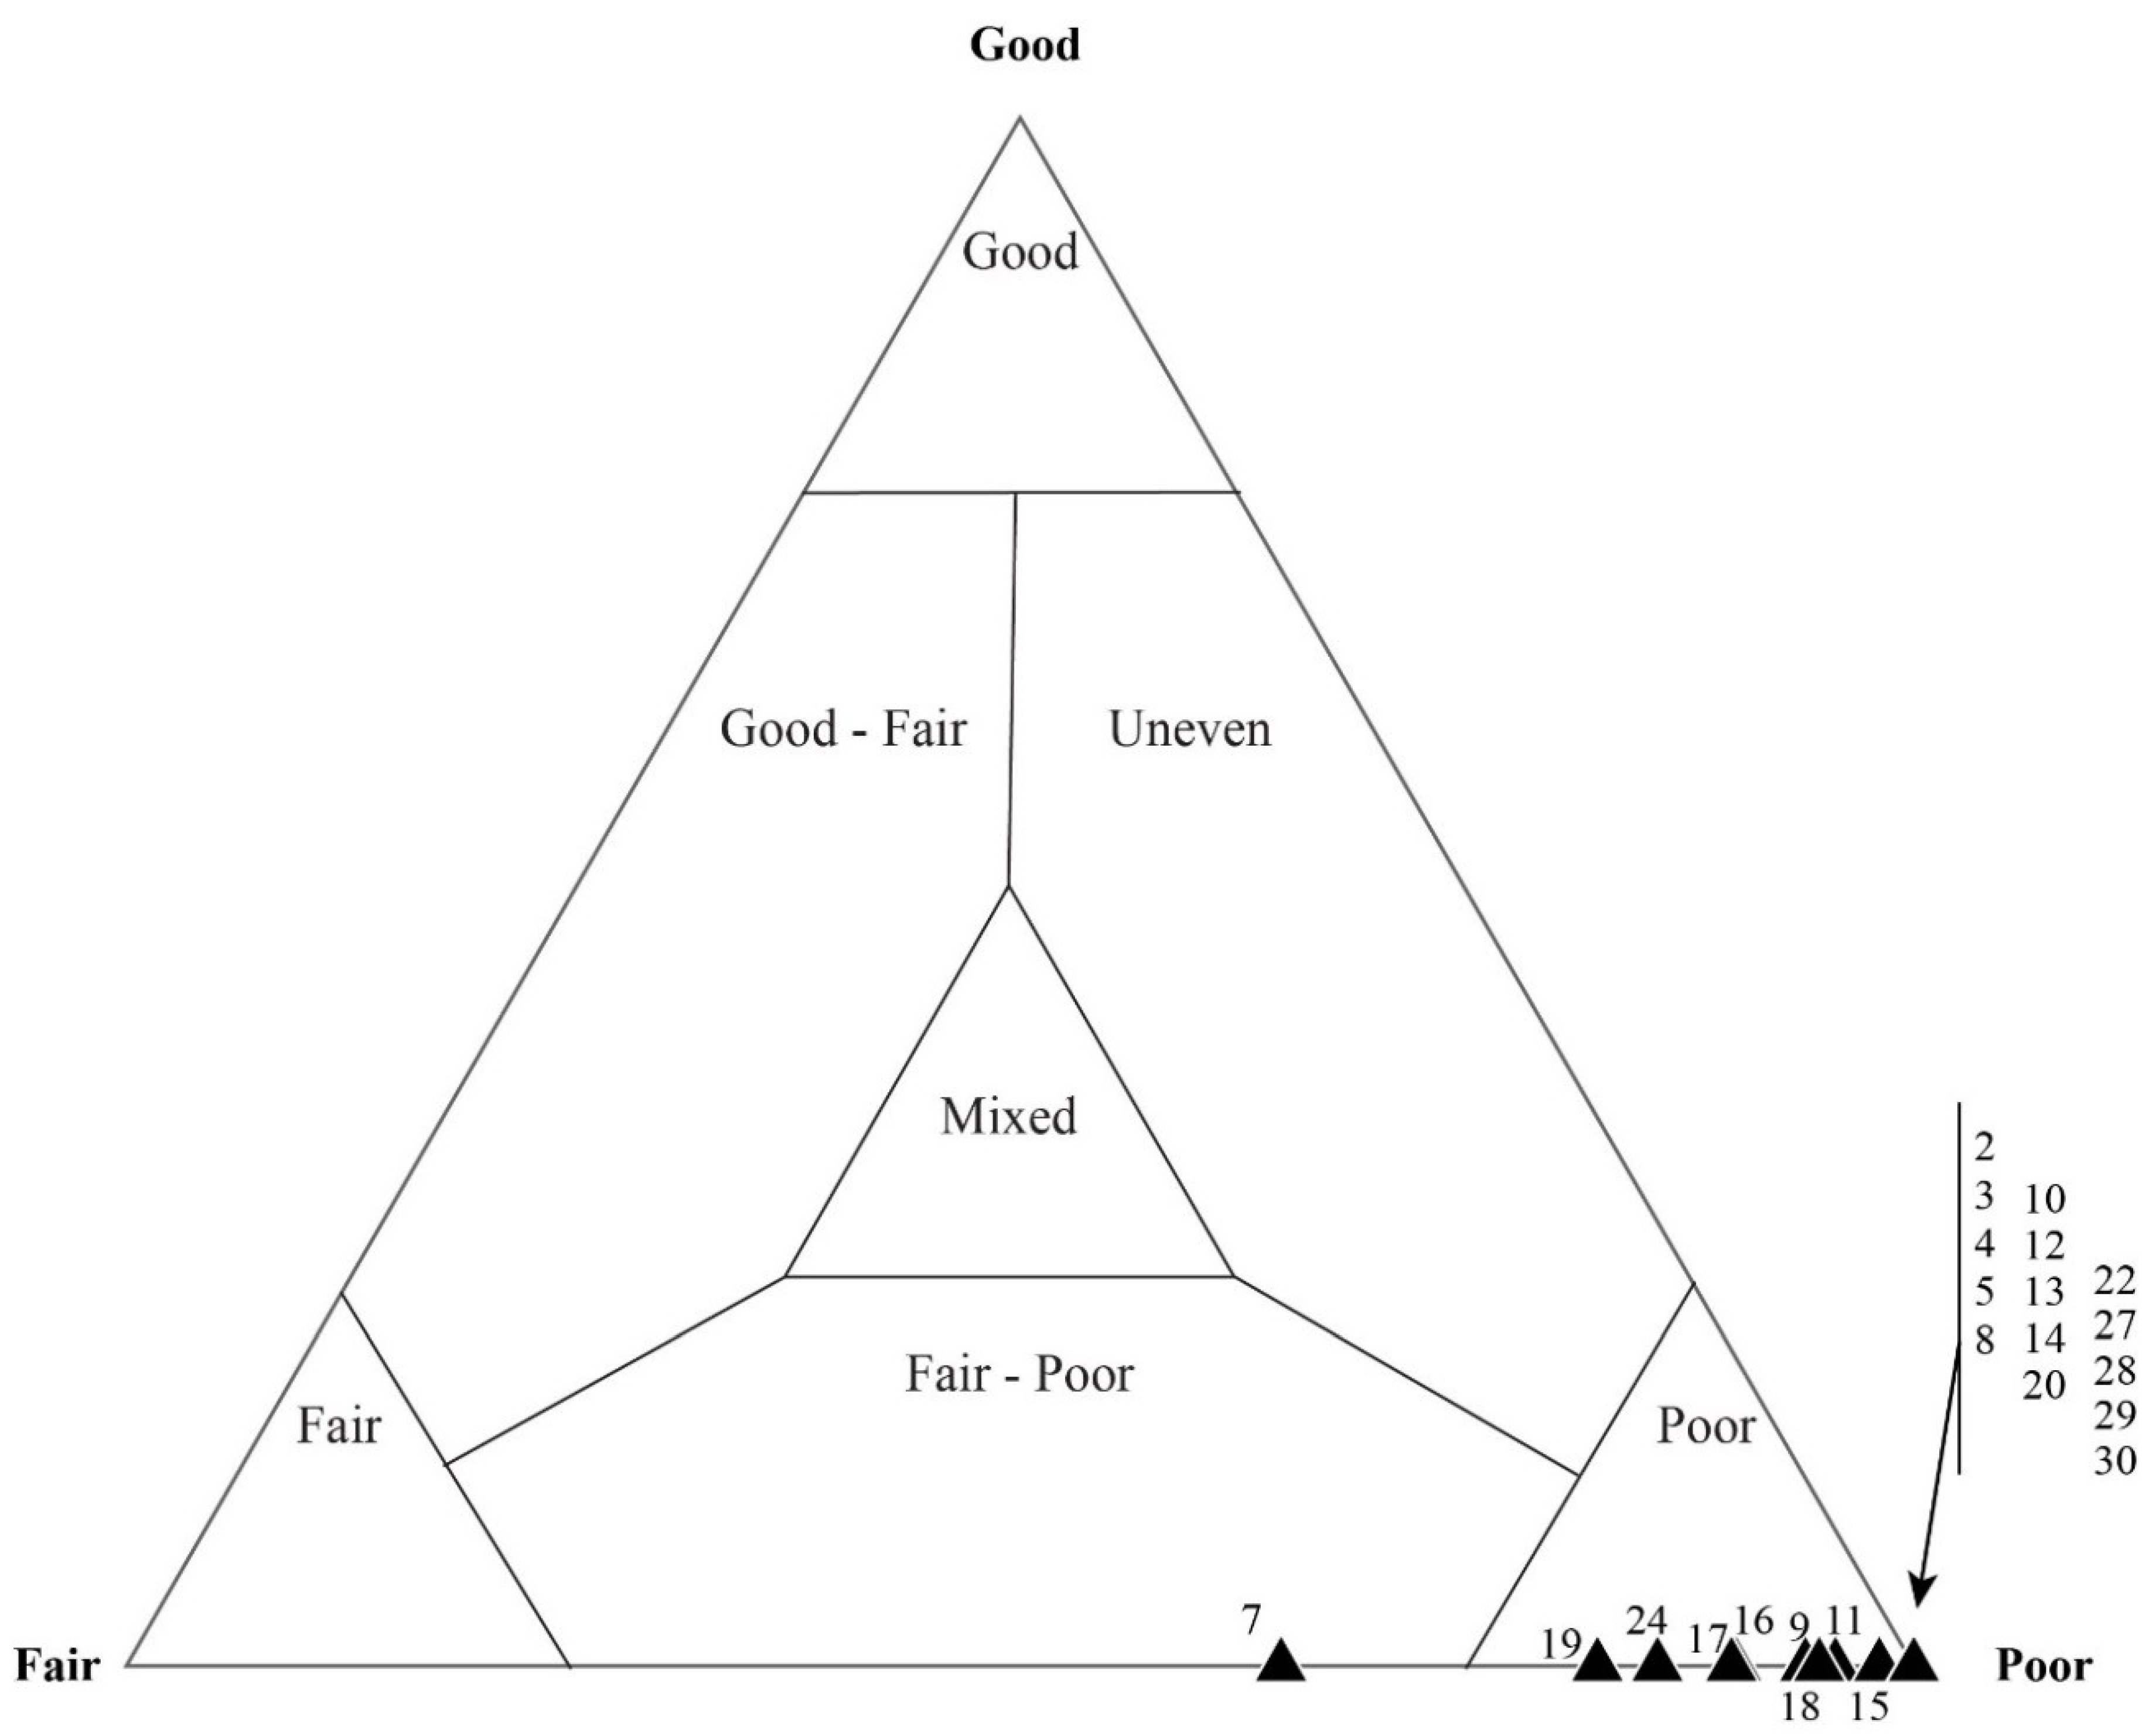
5.1. Mesoscale Taphonomic Patterns
5.1.1. Filamentous Constituents
5.1.2. Coccoidal Constituents
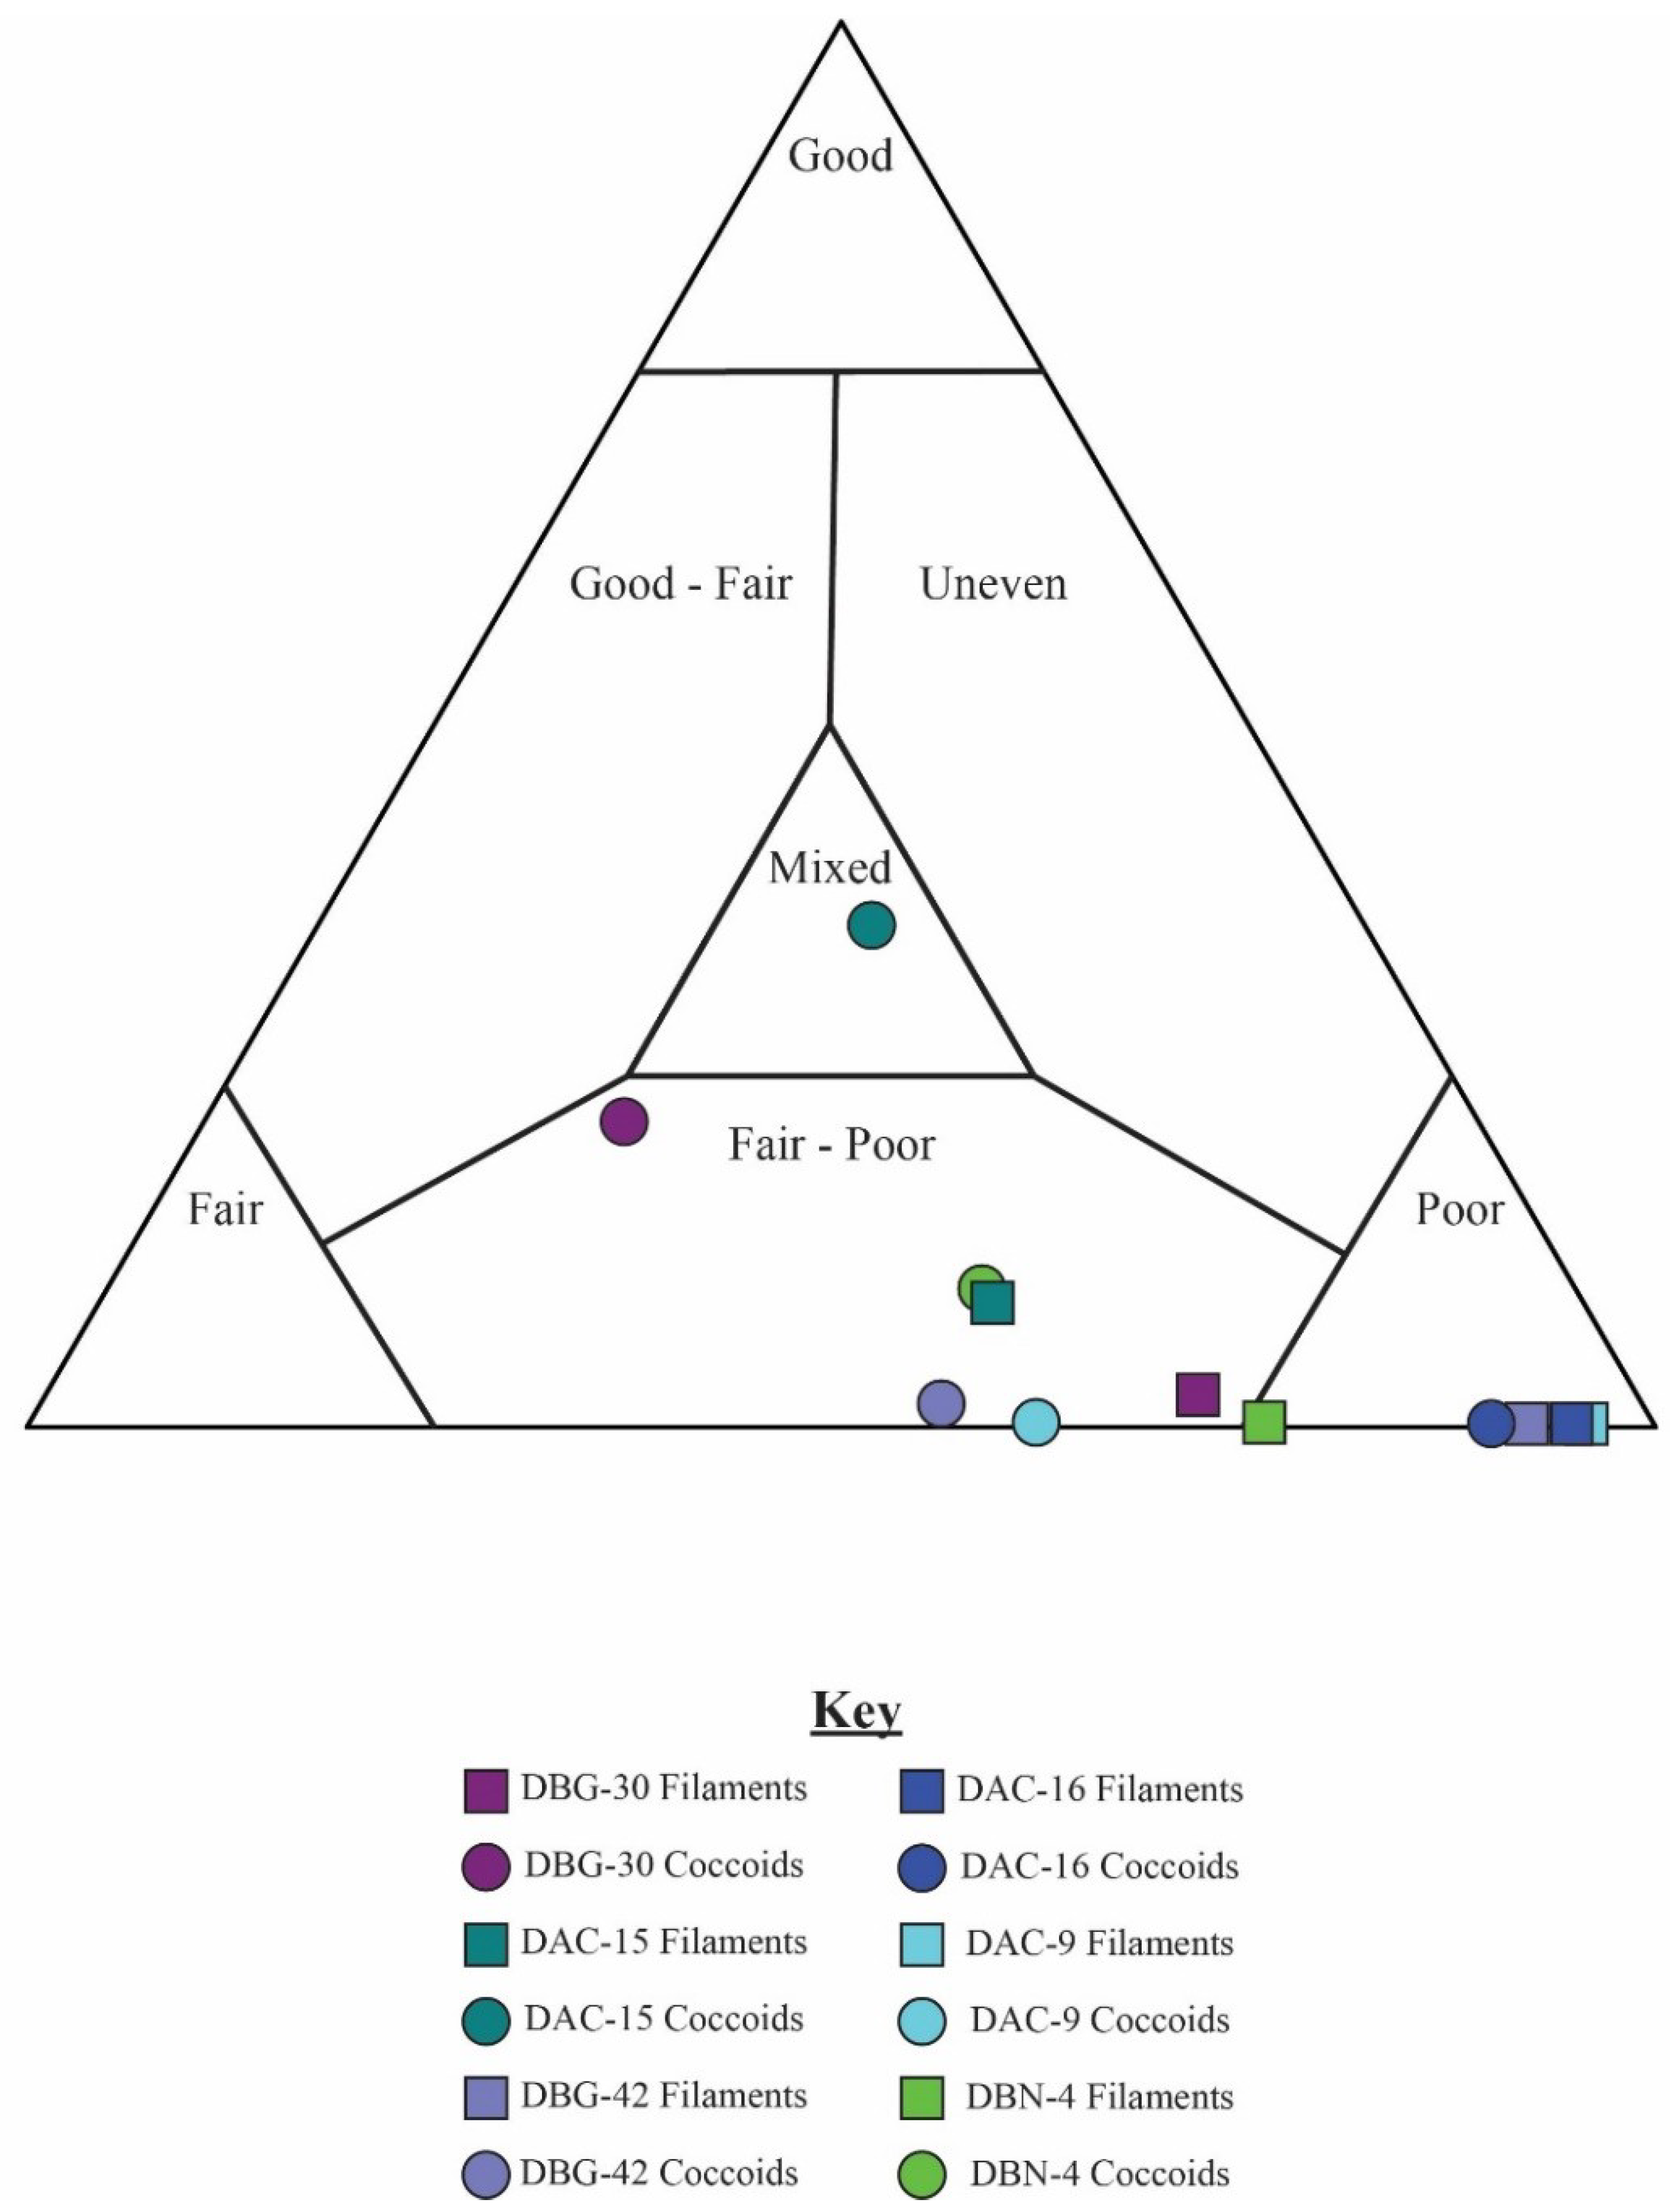
5.2. Results of Traditional Point-Counting
5.3. Results of Quadrat Sampling
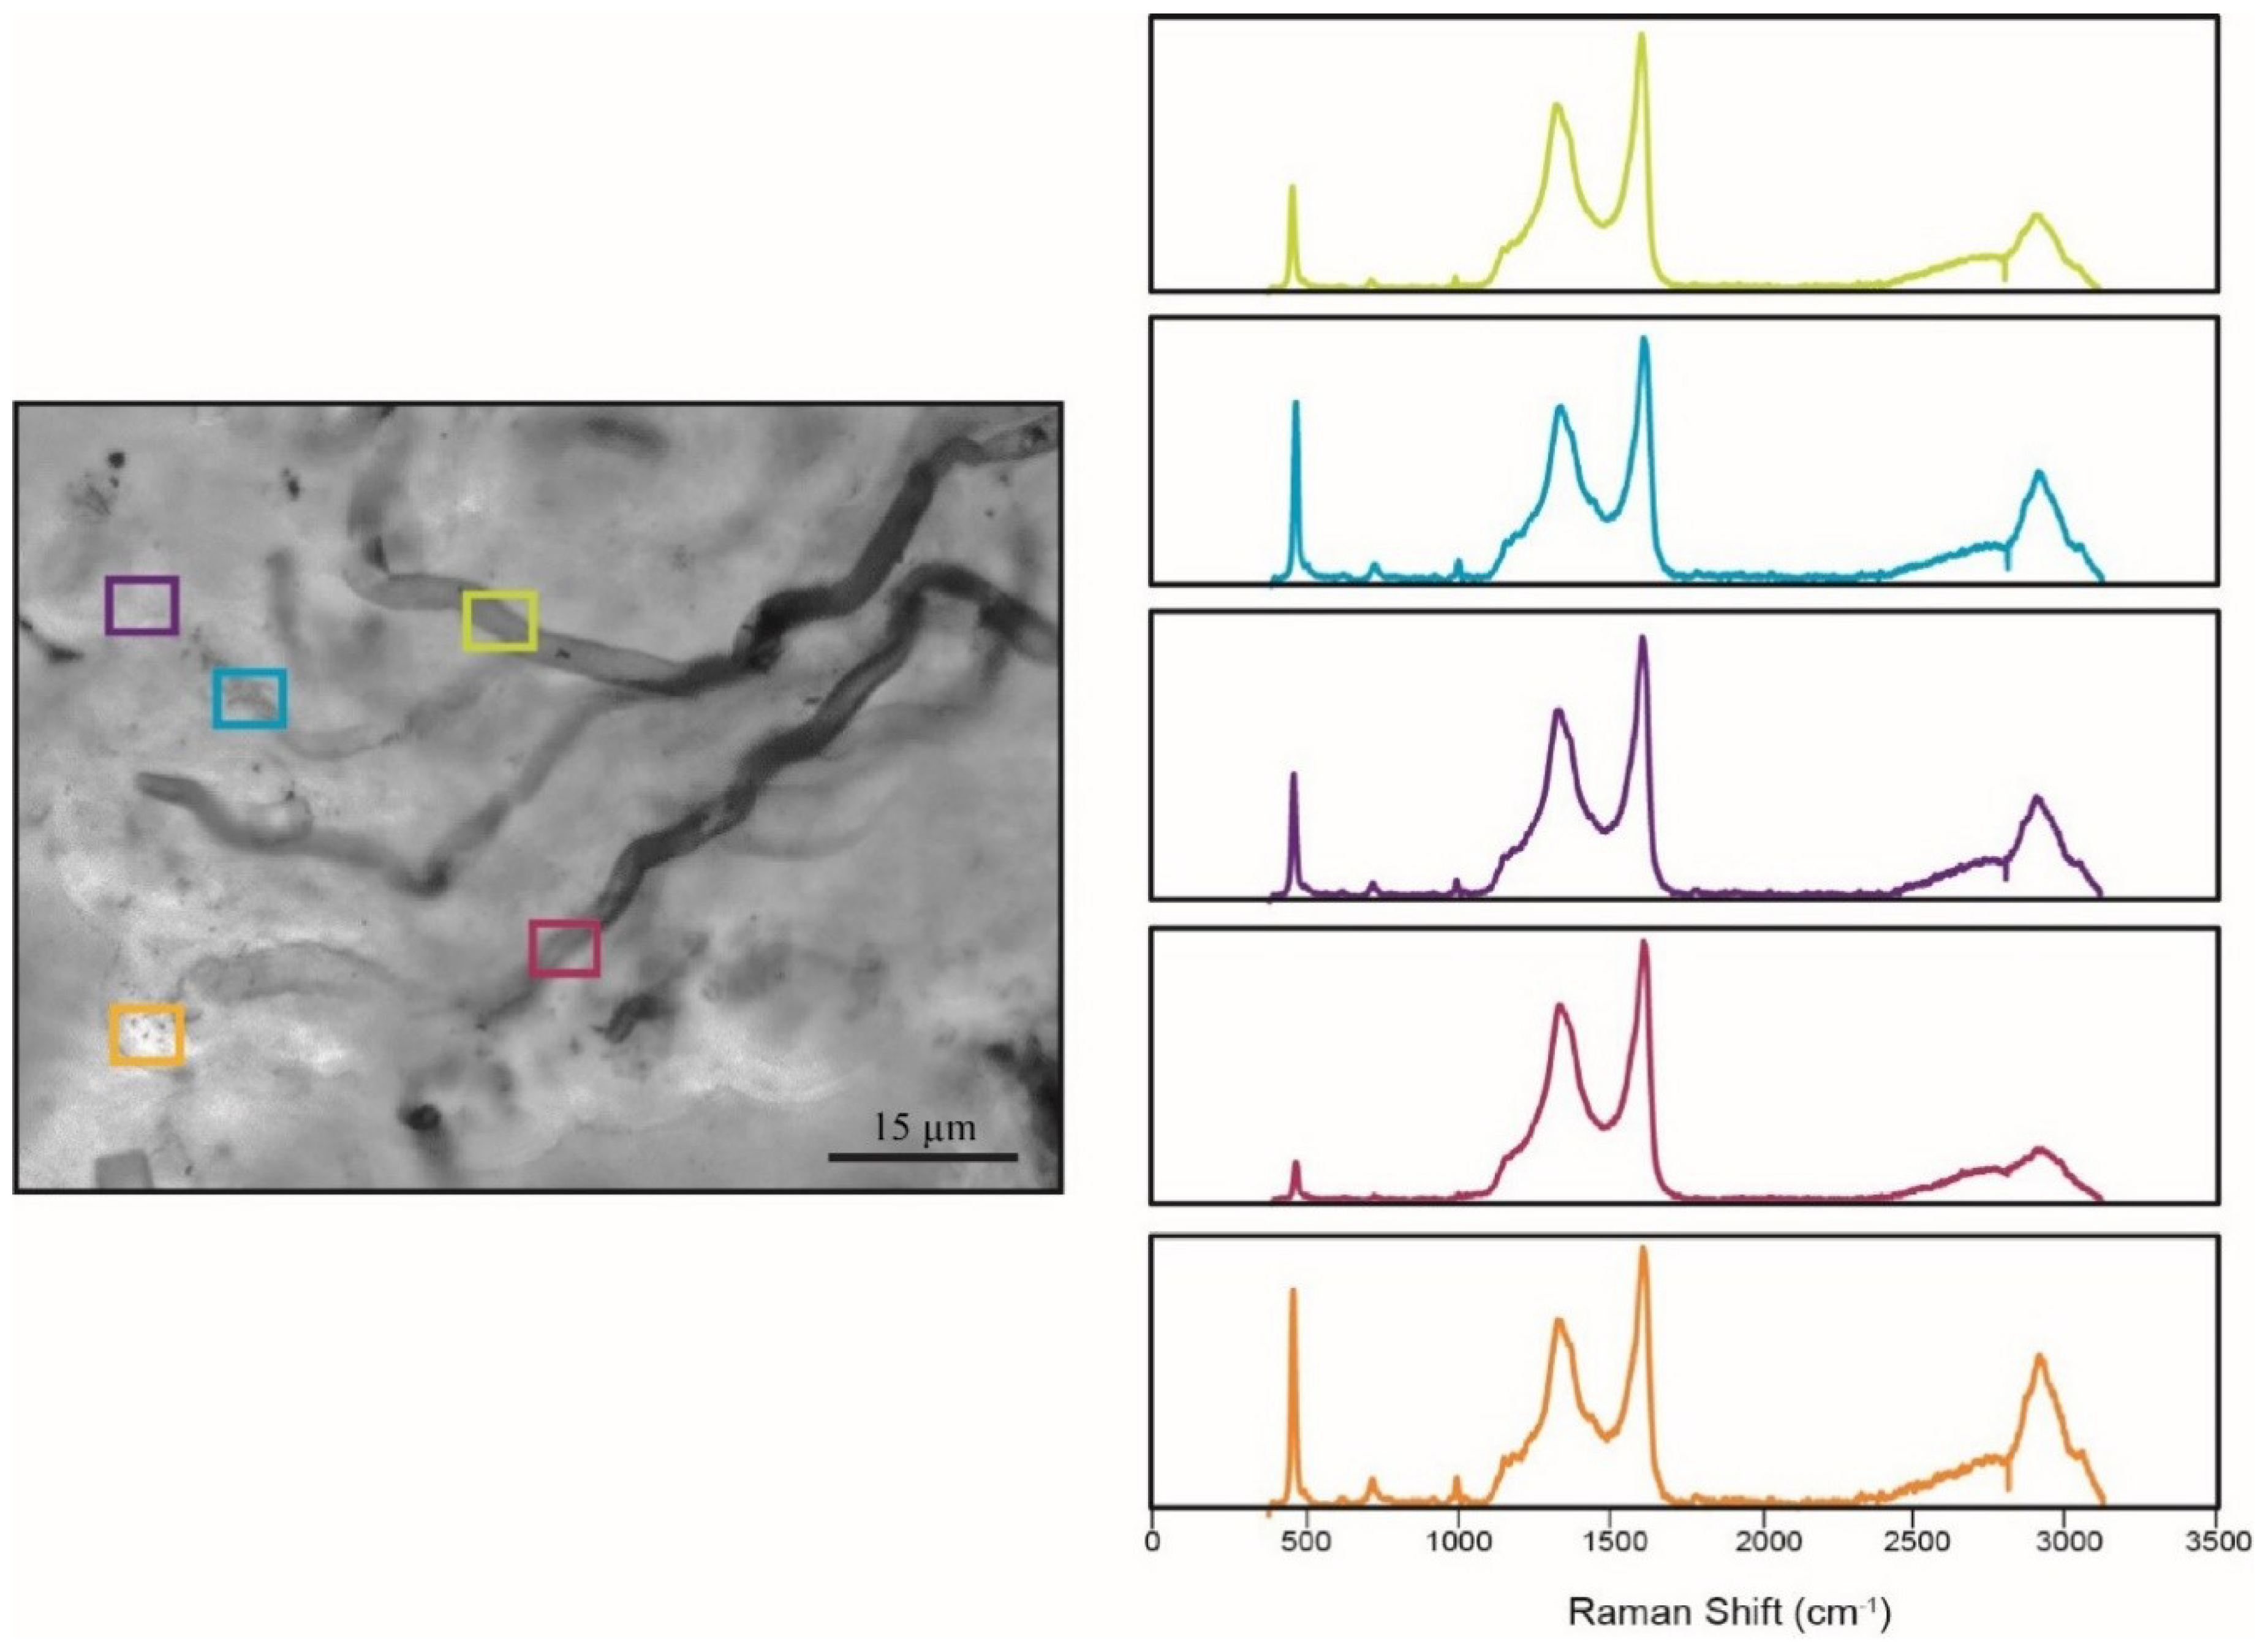
5.4. Raman Spectroscopy
6. Discussion
6.1. Taphonomic Analyses Using Quadrat Sampling on Image Mosaics
6.2. Mat Fabrics and Implications for Silicification
7. Conclusions
Author Contributions
Funding
Conflicts of Interest
References
- van Gemerden, H. Marine Sediments, Burial, Pore Water Chemistry, Microbiology and Diagenesis Microbial mats: A joint venture. Mar. Geol. 1993, 113, 3–25. [Google Scholar] [CrossRef]
- Sprachta, S.; Camoin, G.; Golubic, S.; Le Campion, T. Microbialites in a modern lagoonal environment: Nature and distribution, Tikehau atoll (French Polynesia). Palaeogeogr. Palaeoclimatol. Palaeoecol. 2001, 175, 103–124. [Google Scholar] [CrossRef]
- Dupraz, C.; Reid, R.P.; Braissant, O.; Decho, A.W.; Norman, R.S.; Visscher, P.T. Processes of carbonate precipitation in modern microbial mats. Earth-Sci. Rev. 2009, 96, 141–162. [Google Scholar] [CrossRef]
- Franks, J.; Stolz, J.F. Flat laminated microbial mat communities. Earth-Sci. Rev. 2009, 96, 163–172. [Google Scholar] [CrossRef]
- Canfield, D.E.; Des Marais, D.J. Biogeochemical cycles of carbon, sulfur, and free oxygen in a microbial mat. Geochim. Et Cosmochim. Acta 1993, 57, 3971–3984. [Google Scholar] [CrossRef]
- Dupraz, C.; Visscher, P.T. Microbial lithification in marine stromatolites and hypersaline mats. Trends Microbiol. 2005, 13, 429–438. [Google Scholar] [CrossRef] [PubMed]
- Van Gemerden, H. Microbial mats: A joint venture. Mar. Geol. 1993, 113, 3–25. [Google Scholar] [CrossRef]
- de Wit, R.; van den Ende, F.P.; van Gemerden, H. Mathematical simulation of the interactions among cyanobacteria, purple sulfur bacteria and chemotrophic sulfur bacteria in microbial mat communities. Fems Microbiol. Ecol. 1995, 17, 117–135. [Google Scholar] [CrossRef]
- Herman, E.K.; Kump, L.R. Biogeochemistry of microbial mats under Precambrian environmental conditions: A modelling study. Geobiology 2005, 3, 77–92. [Google Scholar] [CrossRef]
- Stal, L.J. Cyanobacterial Mats and Stromatolites. In The Ecology of Cyanobacteria: Their Diversity in Time and Space; Whitton, B.A., Potts, M., Eds.; Springer: Dordrecht, The Netherlands, 2002; pp. 61–120. [Google Scholar]
- Stolz, J.F. Structure of Microbial Mats and Biofilms. In Microbial Sediments; Riding, R.E., Awramik, S.M., Eds.; Springer: Berlin/Heidelberg, Germany, 2000; pp. 1–8. [Google Scholar]
- Wacey, D.; Kilburn, M.R.; Saunders, M.; Cliff, J.; Brasier, M.D. Microfossils of sulphur-metabolizing cells in 3.4-billion-year-old rocks of Western Australia. Nat. Geosci. 2011, 4, 698. [Google Scholar] [CrossRef]
- Lepot, K.; Williford, K.H.; Ushikubo, T.; Sugitani, K.; Mimura, K.; Spicuzza, M.J.; Valley, J.W. Texture-specific isotopic compositions in 3.4 Gyr old organic matter support selective preservation in cell-like structures. Geochim. Et Cosmochim. Acta 2013, 112, 66–86. [Google Scholar] [CrossRef]
- Sugitani, K.; Mimura, K.; Takeuchi, M.; Yamaguchi, T.; Suzuki, K.; Senda, R.; Asahara, Y.; Wallis, S.; Van Kranendonk, M.J. A Paleoarchean coastal hydrothermal field inhabited by diverse microbial communities: The Strelley Pool Formation, Pilbara Craton, Western Australia. Geobiology 2015, 13, 522–545. [Google Scholar] [CrossRef] [PubMed]
- Brasier, M.; Green, O.; Lindsay, J.; Steele, A. Earth’s Oldest (~3.5 Ga) Fossils and the ‘Early Eden Hypothesis’: Questioning the Evidence. Orig. Life Evol. Biospheres 2004, 34, 257–269. [Google Scholar] [CrossRef]
- Schopf, J.W. Microfossils of the Early Archean Apex Chert: New Evidence of the Antiquity of Life. Science 1993, 260, 640–646. [Google Scholar] [CrossRef] [PubMed]
- Wacey, D.; Saunders, M.; Kong, C.; Brasier, A.; Brasier, M. 3.46 Ga Apex chert ‘microfossils’ reinterpreted as mineral artefacts produced during phyllosilicate exfoliation. Gondwana Res. 2016, 36, 296–313. [Google Scholar] [CrossRef]
- Brasier, M.D.; Green, O.R.; Lindsay, J.F.; McLoughlin, N.; Steele, A.; Stoakes, C. Critical testing of Earth’s oldest putative fossil assemblage from the ~3.5 Ga Apex chert, Chinaman Creek, Western Australia. Precambrian Res. 2005, 140, 55–102. [Google Scholar] [CrossRef]
- Schopf, J.W.; Kudryavtsev, A.B. Biogenicity of Earth’s earliest fossils: A resolution of the controversy. Gondwana Res. 2012, 22, 761–771. [Google Scholar] [CrossRef]
- Awramik, S.M.; Barghoorn, E.S. The Gunflint microbiota. Precambrian Res. 1977, 5, 121–142. [Google Scholar] [CrossRef]
- Barghoorn, E.S.; Tyler, S.A. Microorganisms from the Gunflint Chert. Science 1965, 147, 563–577. [Google Scholar] [CrossRef]
- Schopf, J.W. Microflora of the Bitter Springs Formation, Late Precambrian, Central Australia. J. Paleontol. 1968, 42, 651–688. [Google Scholar]
- Wacey, D.; Menon, S.; Green, L.; Gerstmann, D.; Kong, C.; McLoughlin, N.; Saunders, M.; Brasier, M. Taphonomy of very ancient microfossils from the ~3400 Ma Strelley Pool Formation and ~1900 Ma Gunflint Formation: New insights using a focused ion beam. Precambrian Res. 2012, 220–221, 234–250. [Google Scholar] [CrossRef]
- Knoll, A.H.; Strother, P.K.; Rossi, S. Distribution and diagenesis of microfossils from the lower proterozoic duck creek dolomite, Western Australia. Precambrian Res. 1988, 38, 257–279. [Google Scholar] [CrossRef]
- Knoll, A.H.; Swett, K.; Mark, J. Paleobiology of a Neoproterozoic Tidal Flat/Lagoonal Complex: The Draken Conglomerate Formation, Spitsbergen. J. Paleontol. 1991, 65, 531–570. [Google Scholar] [CrossRef] [PubMed]
- Sergeev, V.N.; Knoll, A.H.; Grotzinger, J.P. Paleobiology of the Mesoproterozoic Billyakh Group, Anabar Uplift, Northern Siberia. J. Paleontol. 1995, 39, 1–37. [Google Scholar]
- Horodyski, R.J.; Donaldson, J.A. Microfossils from the Middle Proterozoic Dismal Lakes Groups, Arctic Canada. Precambrian Res. 1980, 11, 125–159. [Google Scholar] [CrossRef]
- Horodyski, R.J.; Donaldson, J.A. Distribution and Significance of Microfossils in Cherts of the Middle Proterozoic Dismal Lakes Group, District of Mackenzie, Northwest Territories, Canada. J. Paleontol. 1983, 57, 271–288. [Google Scholar]
- Bartley, J.K. Actualistic Taphonomy of Cyanobacteria: Implications for the Precambrian Fossil Record. PALAIOS 1996, 11, 571–586. [Google Scholar] [CrossRef]
- French, K.L.; Hallmann, C.; Hope, J.M.; Schoon, P.L.; Zumberge, J.A.; Hoshino, Y.; Peters, C.A.; George, S.C.; Love, G.D.; Brocks, J.J.; et al. Reappraisal of hydrocarbon biomarkers in Archean rocks. Proc. Natl. Acad. Sci. USA 2015, 112, 5915–5920. [Google Scholar] [CrossRef]
- DeGregorio, B.T.; Sharp, T.G.; Flynn, G.; Wirick, S.; Hervig, R.L. Biogenic origin for Earth’s oldest putative microfossils. Geology 2009, 37, 631–634. [Google Scholar] [CrossRef]
- Qu, Y.; Engdahl, A.; Zhu, S.; Vajda, V.; McLoughlin, N. Ultrastructural Heterogeneity of Carbonaceous Material in Ancient Cherts: Investigating Biosignature Origin and Preservation. Astrobiology 2015, 15, 825–842. [Google Scholar] [CrossRef]
- Igisu, M.; Ueno, Y.; Shimojima, M.; Nakashima, S.; Awramik, S.M.; Ohta, H.; Maruyama, S. Micro-FTIR spectroscopic signatures of Bacterial lipids in Proterozoic microfossils. Precambrian Res. 2009, 173, 19–26. [Google Scholar] [CrossRef]
- Hickman-Lewis, K.; Garwood, R.J.; Withers, P.J.; Wacey, D. X-ray microtomography as a tool for investigating the petrological context of Precambrian cellular remains. Geol. Soc. Lond. Spec. Publ. 2017, 448, 33–56. [Google Scholar] [CrossRef]
- Guo, Z.; Peng, X.; Czaja, A.D.; Chen, S.; Ta, K. Cellular taphonomy of well-preserved Gaoyuzhuang microfossils: A window into the preservation of ancient cyanobacteria. Precambrian Res. 2018, 304, 88–98. [Google Scholar] [CrossRef]
- Lemelle, L.; Labrot, P.; Salomé, M.; Simionovici, A.; Viso, M.; Westall, F. In situ imaging of organic sulfur in 700–800 My-old Neoproterozoic microfossils using X-ray spectromicroscopy at the S K-edge. Org. Geochem. 2008, 39, 188–202. [Google Scholar] [CrossRef]
- Oehler, D.Z.; Robert, F.; Walter, M.R.; Sugitani, K.; Allwood, A.; Meibom, A.; Mostefaoui, S.; Selo, M.; Thomen, A.; Gibson, E.K. NanoSIMS: Insights to biogenicity and syngeneity of Archaean carbonaceous structures. Precambrian Res. 2009, 173, 70–78. [Google Scholar] [CrossRef]
- Thomen, A.; Robert, F.; Remusat, L. Determination of the nitrogen abundance in organic materials by NanoSIMS quantitative imaging. J. Anal. At. Spectrom. 2014, 29, 512–519. [Google Scholar] [CrossRef]
- Benzerara, K.; Menguy, N. Looking for traces of life in minerals. Comptes Rendus Palevol 2009, 8, 617–628. [Google Scholar] [CrossRef]
- Hesse, R. Silica diagenesis: Origin of inorganic and replacement cherts. Earth-Sci. Rev. 1989, 26, 253–284. [Google Scholar] [CrossRef]
- Iler, R.K. Chemistry of Silica—Solubility, Polymerization, Colloid and Surface Properties and Biochemistry; John Wiley & Sons: Hoboken, NJ, USA, 1979. [Google Scholar]
- Mizutani, S. Silica Minerals in the Early Stage of Diagenesis. Sedimentology 1970, 15, 419–436. [Google Scholar] [CrossRef]
- Siever, R. Silica Solubility, 0–200 °C, and the Diagenesis of Siliceous Sediments. J. Geol. 1962, 70, 127–150. [Google Scholar] [CrossRef]
- Williams, L.A.; Crerar, D.A. Silica diagenesis; II, General mechanisms. J. Sediment. Res. 1985, 55, 312–321. [Google Scholar] [CrossRef]
- Williams, L.A.; Parks, G.A.; Crerar, D.A. Silica diagenesis; I, Solubility controls. J. Sediment. Res. 1985, 55, 301–311. [Google Scholar] [CrossRef]
- Alleon, J.; Bernard, S.; Le Guillou, C.; Daval, D.; Skouri-Panet, F.; Pont, S.; Delbes, L.; Robert, F. Early entombment within silica minimizes the molecular degradation of microorganisms during advanced diagenesis. Chem. Geol. 2016, 437, 98–108. [Google Scholar] [CrossRef]
- Oehler, J.H.; Schopf, J.W. Artificial Microfossils: Experimental Studies of Permineralization of Blue-Green Algae in Silica. Science 1971, 174, 1229–1231. [Google Scholar] [CrossRef]
- Orange, F.; Lalonde, S.V.; Konhauser, K.O. The Formation and Preservation of Synechococcus elongatus Cell Molds in Simulated Silica Sinter: Implications for the Identification of Microfossils. Geomicrobiol. J. 2013, 30, 327–336. [Google Scholar] [CrossRef]
- Phoenix, V.R.; Adams, D.G.; Konhauser, K.O. Cyanobacterial viability during hydrothermal biomineralisation. Chem. Geol. 2000, 169, 329–338. [Google Scholar] [CrossRef]
- Yee, N.; Phoenix, V.R.; Konhauser, K.O.; Benning, L.G.; Ferris, F.G. The effect of cyanobacteria on silica precipitation at neutral pH: Implications for bacterial silicification in geothermal hot springs. Chem. Geol. 2003, 199, 83–90. [Google Scholar] [CrossRef]
- Igisu, M.; Yokoyama, T.; Ueno, Y.; Nakashima, S.; Shimojima, M.; Ohta, H.; Maruyama, S. Changes of aliphatic C–H bonds in cyanobacteria during experimental thermal maturation in the presence or absence of silica as evaluated by FTIR microspectroscopy. Geobiology 2018, 16, 412–428. [Google Scholar] [CrossRef]
- Benning, L.G.; Phoenix, V.R.; Yee, N.; Konhauser, K.O. The dynamics of cyanobacterial silicification: An infrared micro-spectroscopic investigation1. Geochim. Et Cosmochim. Acta 2004, 68, 743–757. [Google Scholar] [CrossRef]
- Dunham, J.I.; Kah, L.C. Understanding ‘gridwork’ textures within Proterozoic early diagenetic chert. In Proceedings of the Geological Society of America Annual Meeting, Seattle, WA, USA, 22–25 October 2017. [Google Scholar]
- Jackson, G.; Iannelli, T. Rift-related cyclic sedimentation in the Neohelikian Borden Basin, northern Baffin Island. Geol. Surv. Can. Pap. 1981, 81, 269–302. [Google Scholar]
- Kah, L.C.; Knoll, A.H. Microbenthic distribution of Proterozoic tidal flats: Environmental and taphonomic considerations. Geology 1996, 24, 79–82. [Google Scholar] [CrossRef]
- Kah, L.C.; Sherman, A.G.; Narbonne, G.M.; Knoll, A.H.; Kaufman, A.J. δ13C stratigraphy of the Proterozoic Bylot Supergroup, Baffin Island, Canada: Implications for regional lithostratigraphic correlations. Can. J. Earth Sci. 1999, 36, 313–332. [Google Scholar] [CrossRef]
- Turner, E.C. Mesoproterozoic carbonate systems in the Borden Basin, Nunavut. Can. J. Earth Sci. 2009, 46, 915–938. [Google Scholar] [CrossRef]
- Manning-Berg, A.R.; Kah, L.C.; Williford, K.H. Evaluation of preliminary techniques used to assess taphonomic variation in silicified microbial mats preserved in the Angmaat Formation, northern Baffin Island, Nunavut. In Summary of Activities 2018 Canada-Nunavut Geoscience Office; Canada-Nunavut Geoscience Office: Iquluit, NU, Canada, 2018. [Google Scholar]
- Hahn, K.E.; Turner, E.C.; Babechuk, M.G.; Kamber, B.S. Deep-water seep-related carbonate mounds in a Mesoproterozoic alkaline lake, Borden Basin (Nunavut, Canada). Precambrian Res. 2015, 271, 173–197. [Google Scholar] [CrossRef]
- Sherman, A.G.; James, N.P.; Narbonne, G.M. Evidence for reversal of basin polarity during carbonate ramp development in the Mesoproterozoic Borden Basin, Baffin Island. Can. J. Earth Sci. 2002, 39, 519–538. [Google Scholar] [CrossRef]
- Kah, L.C. Sedimentological, Geochemical, and Paleobiological Interactions on a Mesoproterozoic Carbonate Platform: Society Cliffs Formation, Northern Baffin Island, Arctic Canada. Ph.D. Thesis, Harvard University, Cambridge, MA, USA, 1997. [Google Scholar]
- Kah, L.C.; Bartley, J.K. Protracted oxygenation of the Proterozoic biosphere. Int. Geol. Rev. 2011, 53, 1424–1442. [Google Scholar] [CrossRef]
- Knoll, A.H.; Wörndle, S.; Kah, L.C. Covariance of microfossil assemblages and microbialite textures across an upper Mesoproterozoic carbonate platform. Palaios 2013, 28, 453–470. [Google Scholar] [CrossRef]
- Manning-Berg, A.R.; Kah, L.C. Proterozoic microbial mats and their constraints on environments of silicification. Geobiology 2017, 15, 469–483. [Google Scholar] [CrossRef] [PubMed]
- Turner, E.C. Structural and Stratigraphic Controls on Carbonate-Hosted Base Metal Mineralization in the Mesoproterozoic Borden Basin (Nanisivik District), Nunavut. Econ. Geol. 2011, 106, 1197–1223. [Google Scholar] [CrossRef]
- Sherman, A.G.; Narbonne, G.M.; James, N.P. Anatomy of a cyclically packaged Mesoproterozoic carbonate ramp in northern Canada. Sediment. Geol. 2001, 139, 171–203. [Google Scholar] [CrossRef]
- Narbonne, G.M.; James, N.P. Mesoproterozoic deep-water reefs from Borden Peninsula, Arctic Canada. Sedimentology 1996, 43, 827–848. [Google Scholar] [CrossRef]
- LeCheminant, A.N.; Heaman, L.M. Mackenzie igneous events, Canada: Middle Proterozoic hotspot magmatism associated with ocean opening. Earth Planet. Sci. Lett. 1989, 96, 38–48. [Google Scholar] [CrossRef]
- Gibson, T.M.; Shih, P.M.; Cumming, V.M.; Fischer, W.W.; Crockford, P.W.; Hodgskiss, M.S.W.; Wörndle, S.; Creaser, R.A.; Rainbird, R.H.; Skulski, T.M.; et al. Precise age of Bangiomorpha pubescens dates the origin of eukaryotic photosynthesis. Geology 2018, 46, 135–138. [Google Scholar] [CrossRef]
- Kah, L.C.; Bartley, J.K.; Teal, D.A. Chemostratigraphy of the Late Mesoproterozoic Atar Group, Taoudeni Basin, Mauritania: Muted isotopic variability, facies correlation, and global isotopic trends. Precambrian Res. 2012, 200–203, 82–103. [Google Scholar] [CrossRef]
- Pehrsson, S.J.; Buchan, K.L. Borden dykes of Baffin Island, Northwest Territories: A Franklin U-Pb baddeleyite age and a paleomagnetic reinterpretation. Can. J. Earth Sci. 1999, 36, 65–73. [Google Scholar] [CrossRef]
- Hofmann, H.J.; Jackson, G.D. Shelf-Facies Microfossils from the Uluksan Group (Proterozoic Bylot Supergroup), Baffin Island, Canada. J. Paleontol. 1991, 65, 361–382. [Google Scholar] [CrossRef]
- Golovenok, V.; Belova, M.Y. Rifeyskiye mikrobioty v kremnyakh iz billyakhskoy serii Anabarskogo podniatiya [Riphean microbiotas in cherts of the Billyakh Group on the Anabar Uplift]. Paleontologicheskii Zhurnal 1984, 4, 23–32. [Google Scholar]
- Green, J.W.; Knoll, A.H.; Golubi, X.S.; Swett, K. Paleobiology of Distinctive Benthic Microfossils from the Upper Proterozoic Limestone-Dolomite “Series,” Central East Greenland. Am. J. Bot. 1987, 74, 928–940. [Google Scholar] [CrossRef]
- Butterfield, N.J. Bangiomorpha pubescens n. gen., n. sp.: Implications for the evolution of sex, multicellularity, and the Mesoproterozoic/Neoproterozoic radiation of eukaryotes. Paleobiology 2000, 26, 386–404. [Google Scholar] [CrossRef]
- Schopf, J.W.; Kudryavtsev, A.B.; Agresti, D.G.; Czaja, A.D.; Wdowiak, T.J. Raman imagery: A new approach to assess the geochemical maturity and biogenicity of permineralized Precambrian fossils. Astrobiology 2005, 5, 333–371. [Google Scholar] [CrossRef]
- Czaja, A.D.; Beukes, N.J.; Osterhout, J.T. Sulfur-oxidizing bacteria prior to the Great Oxidation Event from the 2.52 Ga Gamohaan Formation of South Africa. Geology 2016, 44, 983–986. [Google Scholar] [CrossRef]
- Behrensmeyer, A.K.; Kidwell, S.M. Taphonomy’s contributions to paleobiology. Paleobiology 1985, 11, 105–119. [Google Scholar] [CrossRef]
- Behrensmeyer, A.K. Taphonomic and Ecologic Information from Bone Weathering. Paleobiology 1978, 4, 150–162. [Google Scholar] [CrossRef]
- Golubic, S.; Hofmann, H.J. Comparison of Holocene and Mid-Precambrian Entophysalidaceae (Cyanophyta) in Stromatolitic Algal Mats: Cell Division and Degradation. J. Paleontol. 1976, 50, 1074–1082. [Google Scholar]
- Oehler, J.H. Experimental studies in Precambrian paleontology: Structural and chemical changes in blue-green algae during simulated fossilization in synthetic chert. Geol. Soc. Am. Bull. 1976, 87, 117–129. [Google Scholar] [CrossRef]
- Hofmann, H.J. Precambrian Microflora, Belcher Islands, Canada: Significance and Systematics. J. Paleontol. 1976, 50, 1040–1073. [Google Scholar]
- Knoll, A.H.; Golubic, S. Anatomy and taphonomy of a precambrian algal stromatolite. Precambrian Res. 1979, 10, 115–151. [Google Scholar] [CrossRef]
- Knoll, A.H.; Barghoorn, E.S. Precambrian Eukaryotic Organisms: A Reassessment of the Evidence. Science 1975, 190, 52–54. [Google Scholar] [CrossRef]
- Horodyski, R.J.; Bloeser, B.; Haar, S.V. Laminated algal mats from a coastal lagoon, Laguna Mormona, Baja California, Mexico. J. Sediment. Res. 1977, 47, 680–696. [Google Scholar]
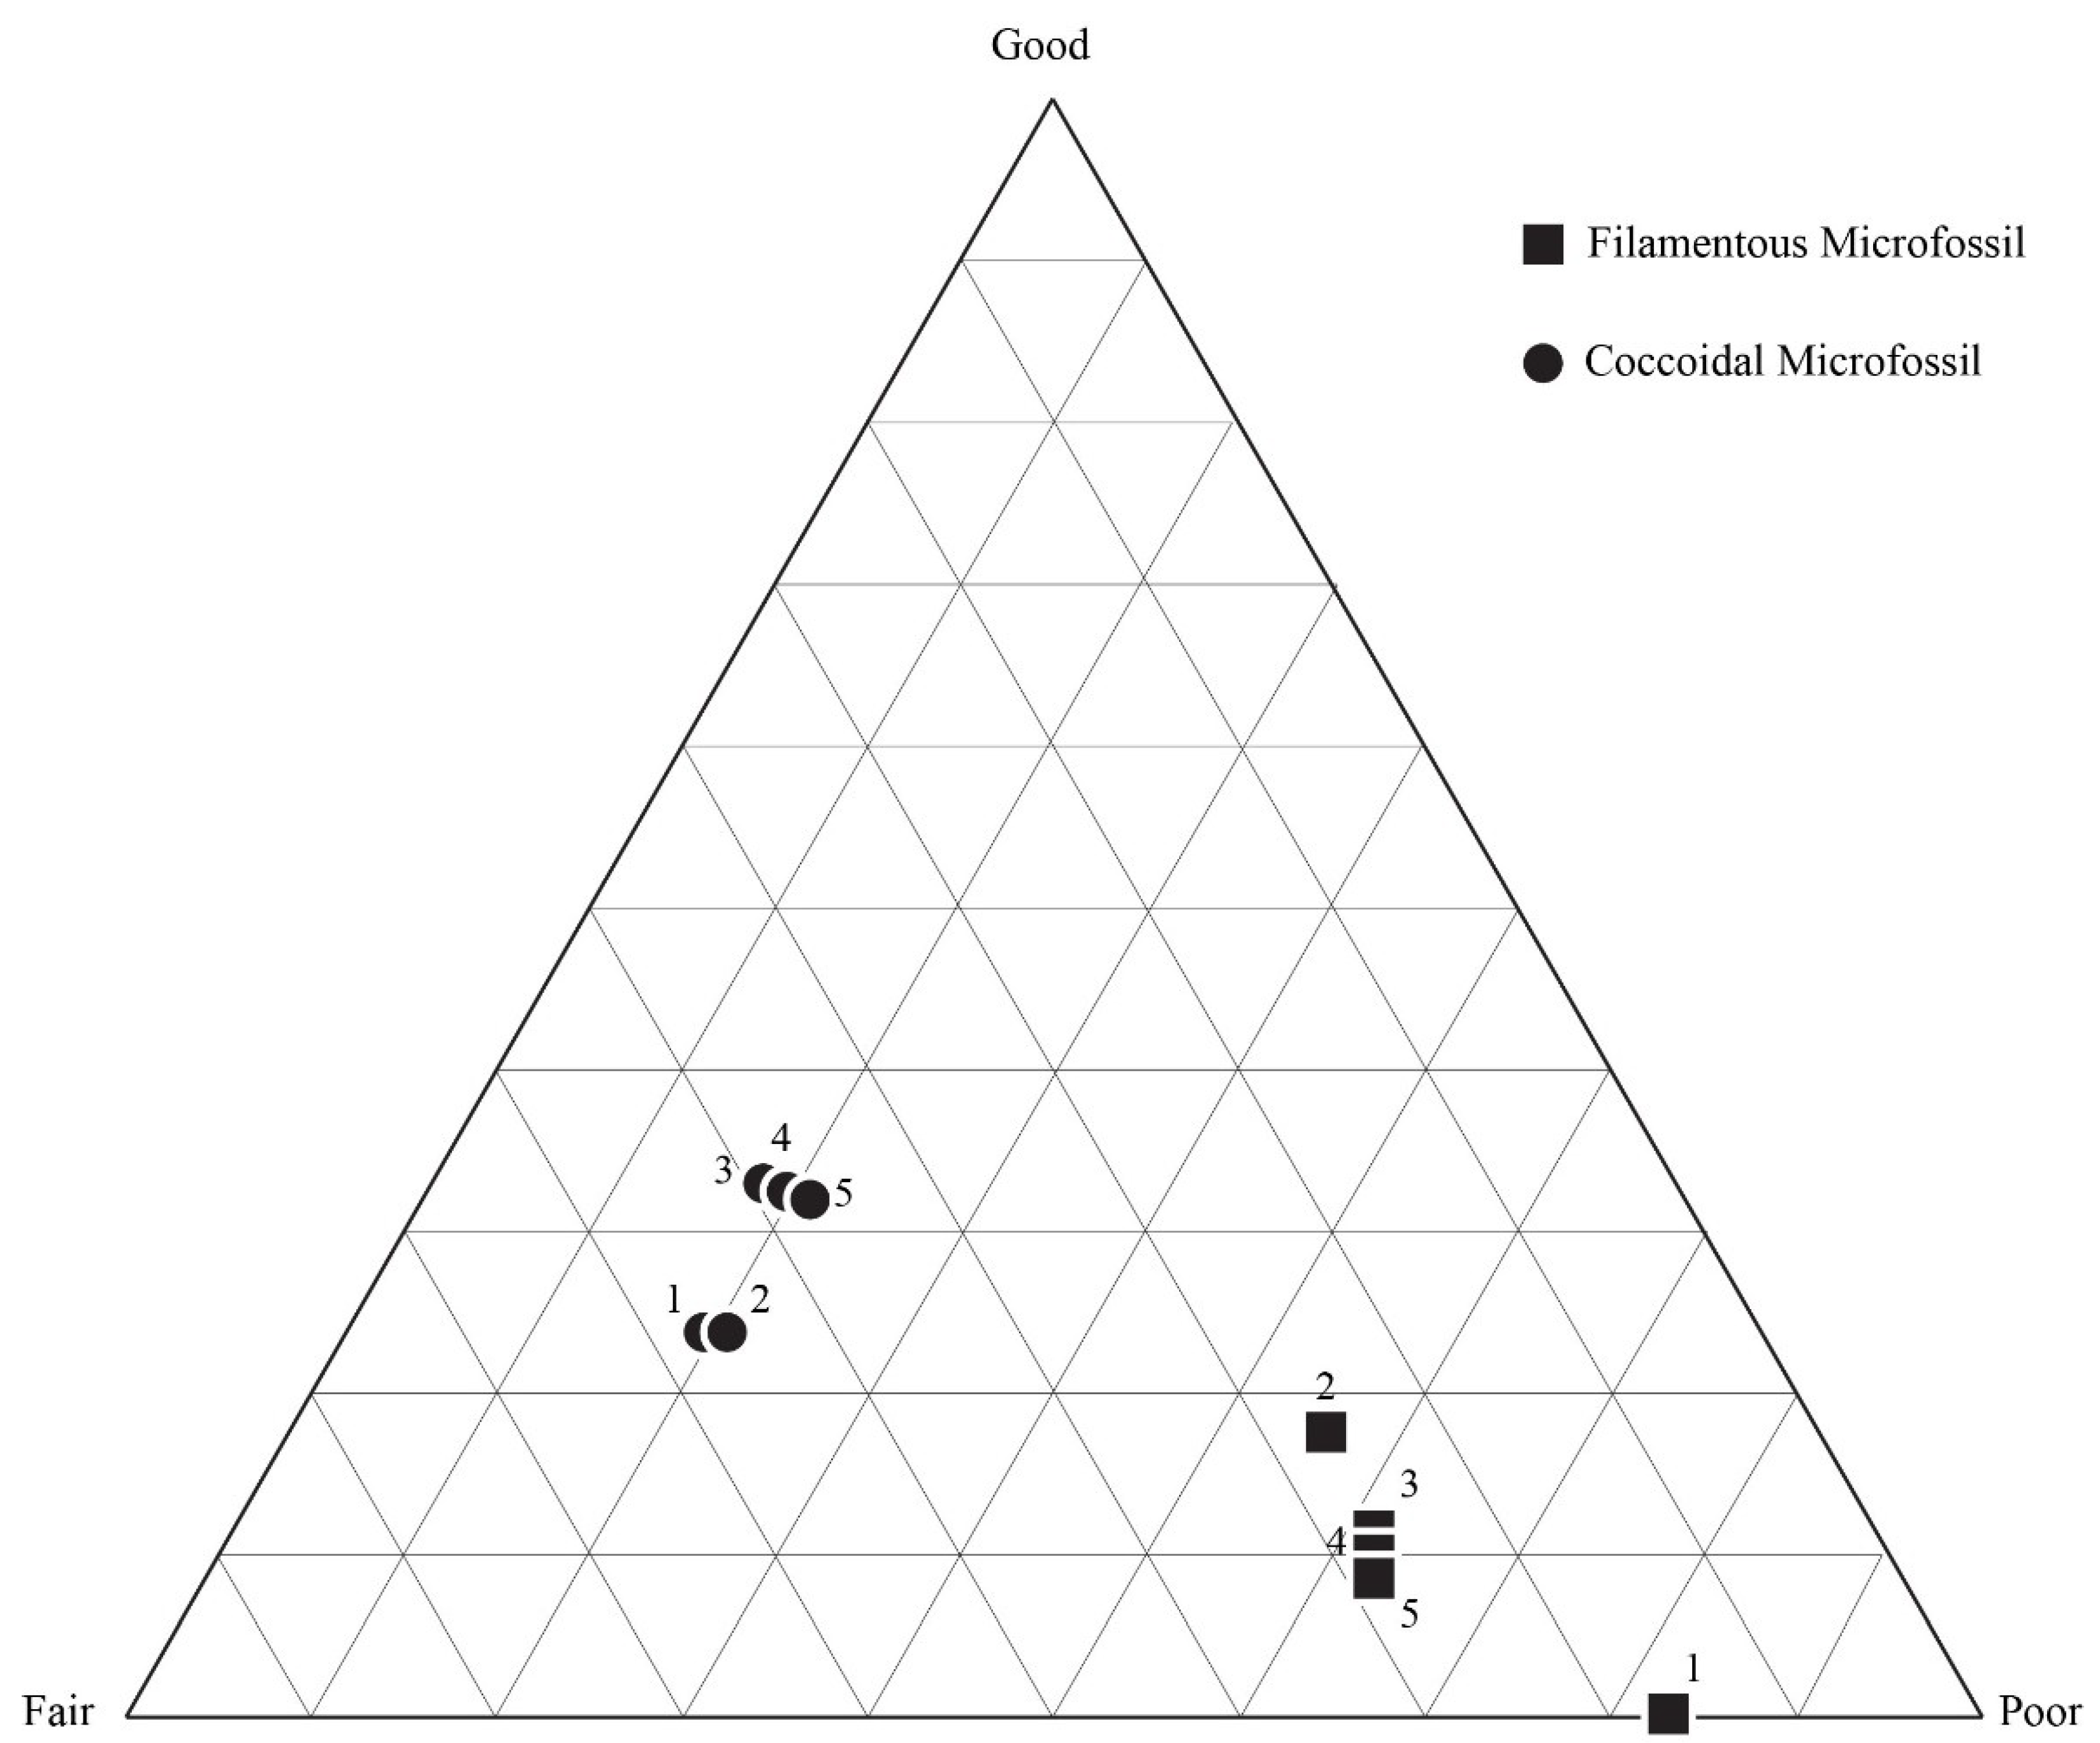
- Kowalewski, M.; Flessa, K.W.; Hallman, D.P. Ternary Taphograms: Triangular Diagrams Applied to Taphonomic Analysis. PALAIOS 1995, 10, 478–483. [Google Scholar] [CrossRef]
- Howarth, R.J. Improved estimators of uncertainty in proportions, point-counting, and pass-fail test results. Am. J. Sci. 1998, 298, 594–607. [Google Scholar] [CrossRef]
- Weltje, G.J. Quantitative analysis of detrital modes: Statistically rigorous confidence regions in ternary diagrams and their use in sedimentary petrology. Earth-Sci. Rev. 2002, 57, 211–253. [Google Scholar] [CrossRef]
- Systems, C.R. Sample Size Calculator. Available online: https://www.surveysystem.com/sscalc.htm (accessed on 8 January 2018).
- Williford, K.H. DQW2 20xt Oil 2x Red. Available online: http://gigapan.com/gigapans/52663df35ba394d3cb7110452f8ebce0 (accessed on 27 July 2015).
- Kenkel, N.C.; Juhász-Nagy, P.; Podani, J. On sampling procedures in population and community ecology. Vegetatio 1989, 83, 195–207. [Google Scholar] [CrossRef]
- Heslehurst, M. The Point Quadrat Method of Vegetation Analysis: A Review; University of Reading: Reading, UK, 1971. [Google Scholar]
- Weaver, J.E. The Quadrat Method in Teaching Ecology. Plant World 1918, 21, 267–283. [Google Scholar]
- Toporski, J.K.; Steele, A.; Westall, F.; Thomas-Keprta, K.L.; McKay, D.S. The simulated silicification of bacteria-New clues to the modes and timing of bacterial preservation and implications for the search for extraterrestrial microfossils. Astrobiology 2002, 2, 1–26. [Google Scholar] [CrossRef]
- Lazzeri, M.; Mauri, F. First-Principles Calculation of Vibrational Raman Spectra in Large Systems: Signature of Small Rings in Crystalline SiO2. Phys. Rev. Lett. 2003, 90, 036401. [Google Scholar] [CrossRef] [PubMed]
- Wacey, D. Techniques for Investigating Early Life on Earth. In Early Life on Earth: A Practical Guide; Spinger: Dordrecht, The Netherlands, 2009; pp. 87–123. [Google Scholar]
- Schopf, J.W.; Kudryavtsev, A.B.; Czaja, A.D.; Tripathi, A.B. Evidence of Archean life: Stromatolites and microfossils. Precambrian Res. 2007, 158, 141–155. [Google Scholar] [CrossRef]
- Williford, K.H.; Ushikubo, T.; Schopf, J.W.; Lepot, K.; Kitajima, K.; Valley, J.W. Preservation and detection of microstructural and taxonomic correlations in the carbon isotopic compositions of individual Precambrian microfossils. Geochim. Et Cosmochim. Acta 2013, 104, 165–182. [Google Scholar] [CrossRef]
- Wacey, D. In situ Morphologic, Elemental and Isotopic Analysis of Archean Life. In Evolution of Archean Crust and Early Life; Dilek, Y., Furnes, H., Eds.; Springer: Dordrecht, The Netherlands, 2014; pp. 351–365. [Google Scholar]
- Peng, X.T.; Guo, Z.X.; House, C.H.; Chen, S.; Ta, K.W. SIMS and NanoSIMS analyses of well-preserved microfossils imply oxygen-producing photosynthesis in the Mesoproterozoic anoxic ocean. Chem. Geol. 2016, 441, 24–34. [Google Scholar] [CrossRef]
- R Reid, R.P.; Visscher, P.T.; Decho, A.W.; Stolz, J.F.; Bebout, B.M.; Dupraz, C.; Macintyre, I.G.; Paerl, H.W.; Pinckney, J.L.; Prufert-Bebout, L.; et al. The role of microbes in accretion, lamination and early lithification of modern marine stromatolites. Nature 2000, 406, 989. [Google Scholar] [CrossRef]
- Jorgensen, B.B.; Revsbech, N.P.; Cohen, Y. Photosynthesis and structure of benthic microbial mats: Microelectrode and SEM studies of four cyanobacterial communities1. Limnol. Oceanogr. 1983, 28, 1075–1093. [Google Scholar] [CrossRef]
- Stal, L.J. Microbial Mats in Coastal Environments; Springer: Berlin/Heidelberg, Germany, 1994; pp. 21–32. [Google Scholar]
- Altermann, W.; Kazmierczak, J. Archean microfossils: A reappraisal of early life on Earth. Res. Microbiol. 2003, 154, 611–617. [Google Scholar] [CrossRef] [PubMed]
- Schopf, J.W. Precambrian paleobiology: Problems and perspectives. Annu. Rev. Earth Planet. Sci. 1975, 3, 213–249. [Google Scholar] [CrossRef]
- Bartley, J.; Knoll, A.; Grotzinger, J.P.; Sergeev, V. Lithification and Fabric Genesis in Precipitated Stromatolites and Associated Peritidal Carbonates; Mesoproterozoic Billyakh Group: Siberia, Russia, 2000; Volume 67. [Google Scholar]
- Francis, S.; Barghoorn, E.S.; Margulis, L. On the experimental silicification of microorganisms. III. Implications of the preservation of the green prokaryotic alga prochloron and other coccoids for interpretation of the microbial fossil record. Precambrian Res. 1978, 7, 377–383. [Google Scholar] [CrossRef]
- Decho, A.W. Microbial biofilms in intertidal systems: An overview. Cont. Shelf Res. 2000, 20, 1257–1273. [Google Scholar] [CrossRef]
- Krylov, I.; Orleanskii, V.; Tikhomirova, N. Chertification: Secular Preparations. Priroda 1989, 4, 73–78. [Google Scholar]
- Decho, A.W. Overview of biopolymer-induced mineralization: What goes on in biofilms? Ecol. Eng. 2010, 36, 137–144. [Google Scholar] [CrossRef]
- Heaney, P.J. A proposed mechanism for the growth of chalcedony. Contr. Mineral. Petrol. 1993, 115, 66–74. [Google Scholar] [CrossRef]
- Ortega-Calvo, J.J.; Hernandez-Marine, M.; Saiz-Jimenez, C. Biodeterioration of building materials by cyanobacteria and algae. Int. Biodeterior. 1991, 28, 165–185. [Google Scholar] [CrossRef]
- Sergeev, V.N.; Gerasimenko, L.M.; Zavarzin, G.A. The Proterozoic History and Present State of Cyanobacteria. Microbiology 2002, 71, 623–637. [Google Scholar] [CrossRef]
- Knoll, A.H. Exceptional Preservation of Photosynthetic Organisms in Silicified Carbonates and Silicified Peats. Philos. Trans. R. Soc. B Biol. Sci. 1985, 311, 111–122. [Google Scholar] [CrossRef]
- Wacey, D.; Gleeson, D.; Kilburn, M.R. Microbialite taphonomy and biogenicity: New insights from NanoSIMS. Geobiology 2010, 8, 403–416. [Google Scholar] [CrossRef] [PubMed]


| Sample | Classification | Organisms | Total Counts | Total Filament | Total Coccoid | % G | % F | % P | % Area Unrec |
|---|---|---|---|---|---|---|---|---|---|
| DBG-30 | Good | Coccoidal | 658 | 75 | 583 | 20 | 49 | 31 | 13.1 |
| DBG-42 | Fair | Coccoidal | 659 | 283 | 376 | 1 | 28 | 71 | 6.1 |
| DBN-4 | Poor | Coccoidal | 643 | 133 | 510 | 8 | 34 | 59 | 2.0 |
| DAC-15 | Good | Filamentous | 609 | 553 | 56 | 11 | 35 | 53 | 0.5 |
| DAC-24 | Fair | Filamentous | 149 | 148 | 1 | 1 | 41 | 58 | 3.6 |
| DAC-16 | Fair | Mixed | 634 | 614 | 20 | 0 | 7 | 93 | 4.2 |
| DAC-9 | Poor | Mixed | 175* | 162 | 13 | 0 | 9 | 91 | 2.6 |
| Sample | Taphonomic Classification | Average RIP | Average SD | n |
|---|---|---|---|---|
| DBG-30 | Good | 7.4 | 0.2 | 10 |
| DAC-15 | Good | 6.6 | 0.3 | 13 |
| DBG-42 | Fair | 7.3 | 0.3 | 13 |
| DBN-4 | Poor | 7.0 | 0.3 | 13 |
| DAC-18 | Poor | 6.6 | 0.2 | 17 |
| Angmaat Average | 7.0 | 0.4 | 66 |
© 2019 by the authors. Licensee MDPI, Basel, Switzerland. This article is an open access article distributed under the terms and conditions of the Creative Commons Attribution (CC BY) license (http://creativecommons.org/licenses/by/4.0/).
Share and Cite
Manning-Berg, A.R.; Wood, R.S.; Williford, K.H.; Czaja, A.D.; Kah, L.C. The Taphonomy of Proterozoic Microbial Mats and Implications for Early Diagenetic Silicification. Geosciences 2019, 9, 40. https://doi.org/10.3390/geosciences9010040
Manning-Berg AR, Wood RS, Williford KH, Czaja AD, Kah LC. The Taphonomy of Proterozoic Microbial Mats and Implications for Early Diagenetic Silicification. Geosciences. 2019; 9(1):40. https://doi.org/10.3390/geosciences9010040
Chicago/Turabian StyleManning-Berg, Ashley R., R. Seth Wood, Kenneth H. Williford, Andrew D. Czaja, and Linda C. Kah. 2019. "The Taphonomy of Proterozoic Microbial Mats and Implications for Early Diagenetic Silicification" Geosciences 9, no. 1: 40. https://doi.org/10.3390/geosciences9010040
APA StyleManning-Berg, A. R., Wood, R. S., Williford, K. H., Czaja, A. D., & Kah, L. C. (2019). The Taphonomy of Proterozoic Microbial Mats and Implications for Early Diagenetic Silicification. Geosciences, 9(1), 40. https://doi.org/10.3390/geosciences9010040