Mapping Archaeology While Mapping an Empire: Using Historical Maps to Reconstruct Ancient Settlement Landscapes in Modern India and Pakistan
Abstract
1. Introduction
2. Reconstructing Archaeological Landscapes Remotely
3. Mapping Territory and Surveying Archaeology: The Survey of India, the Archaeological Survey of India, and the 1” to 1-Mile Map Series
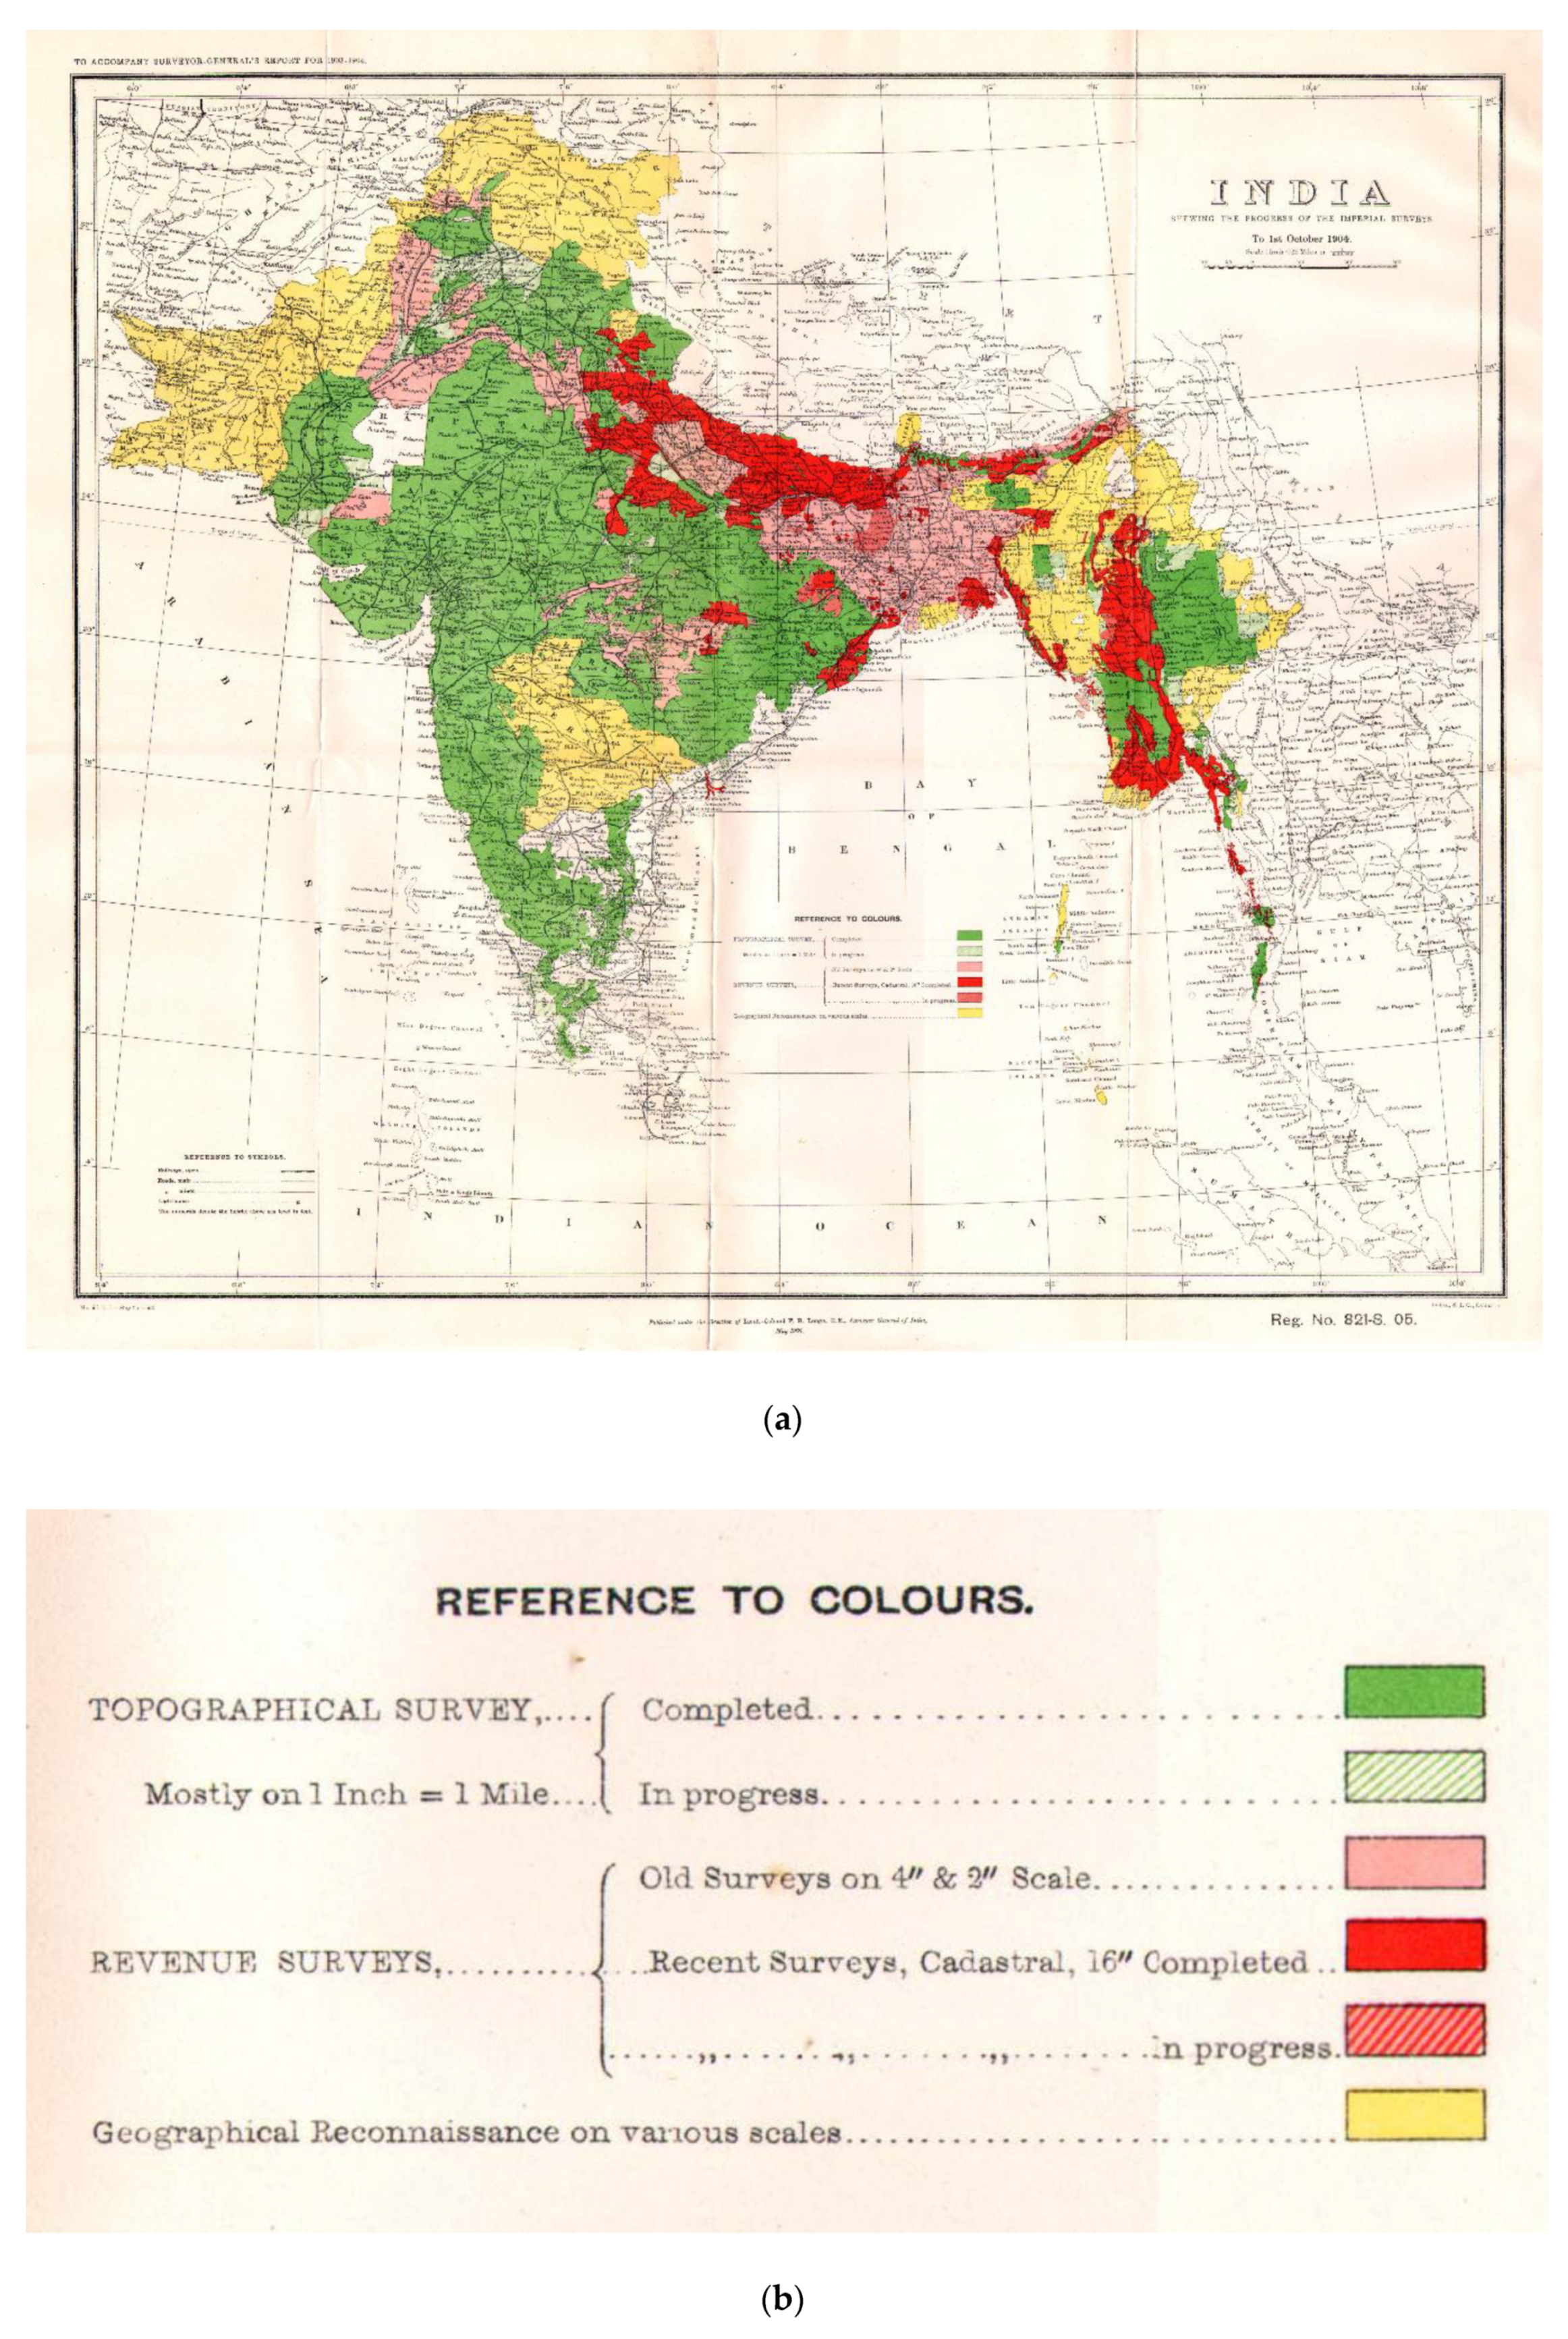
3.1. Systematic Mapping in Nation States and Imperial Dominions: Trigonometry, Topography and Archaeology
“In the first method the shade is formed by strokes of the pencil or pen radiating from or converging into any curved part of a hill, according as it projects or re-enters:—they are supposed to describe the same course as water would do, if it would trickle in streams down the slopes, and are darker or lighter according to the steepness of the slope. The other method has the shade formed by lines parallel, or nearly so, to the horizon. It is much more easy to apply, and more natural than the former, and has some claim to particular notice from its easy application in sketching, and the facility with which it may be demonstrated and acquired. The horizontal manner marks the contours of hills by waving lines, each line continuing on the same level, while following every undulation of the ground. In practice, either or both of the styles may be used at the pleasure of the draftsman, or as may be best suited to the nature of the ground he wishes to portray”([9], pp. 297–300)
3.2. Parallel Developments in the Ordnance Survey and the Survey of India
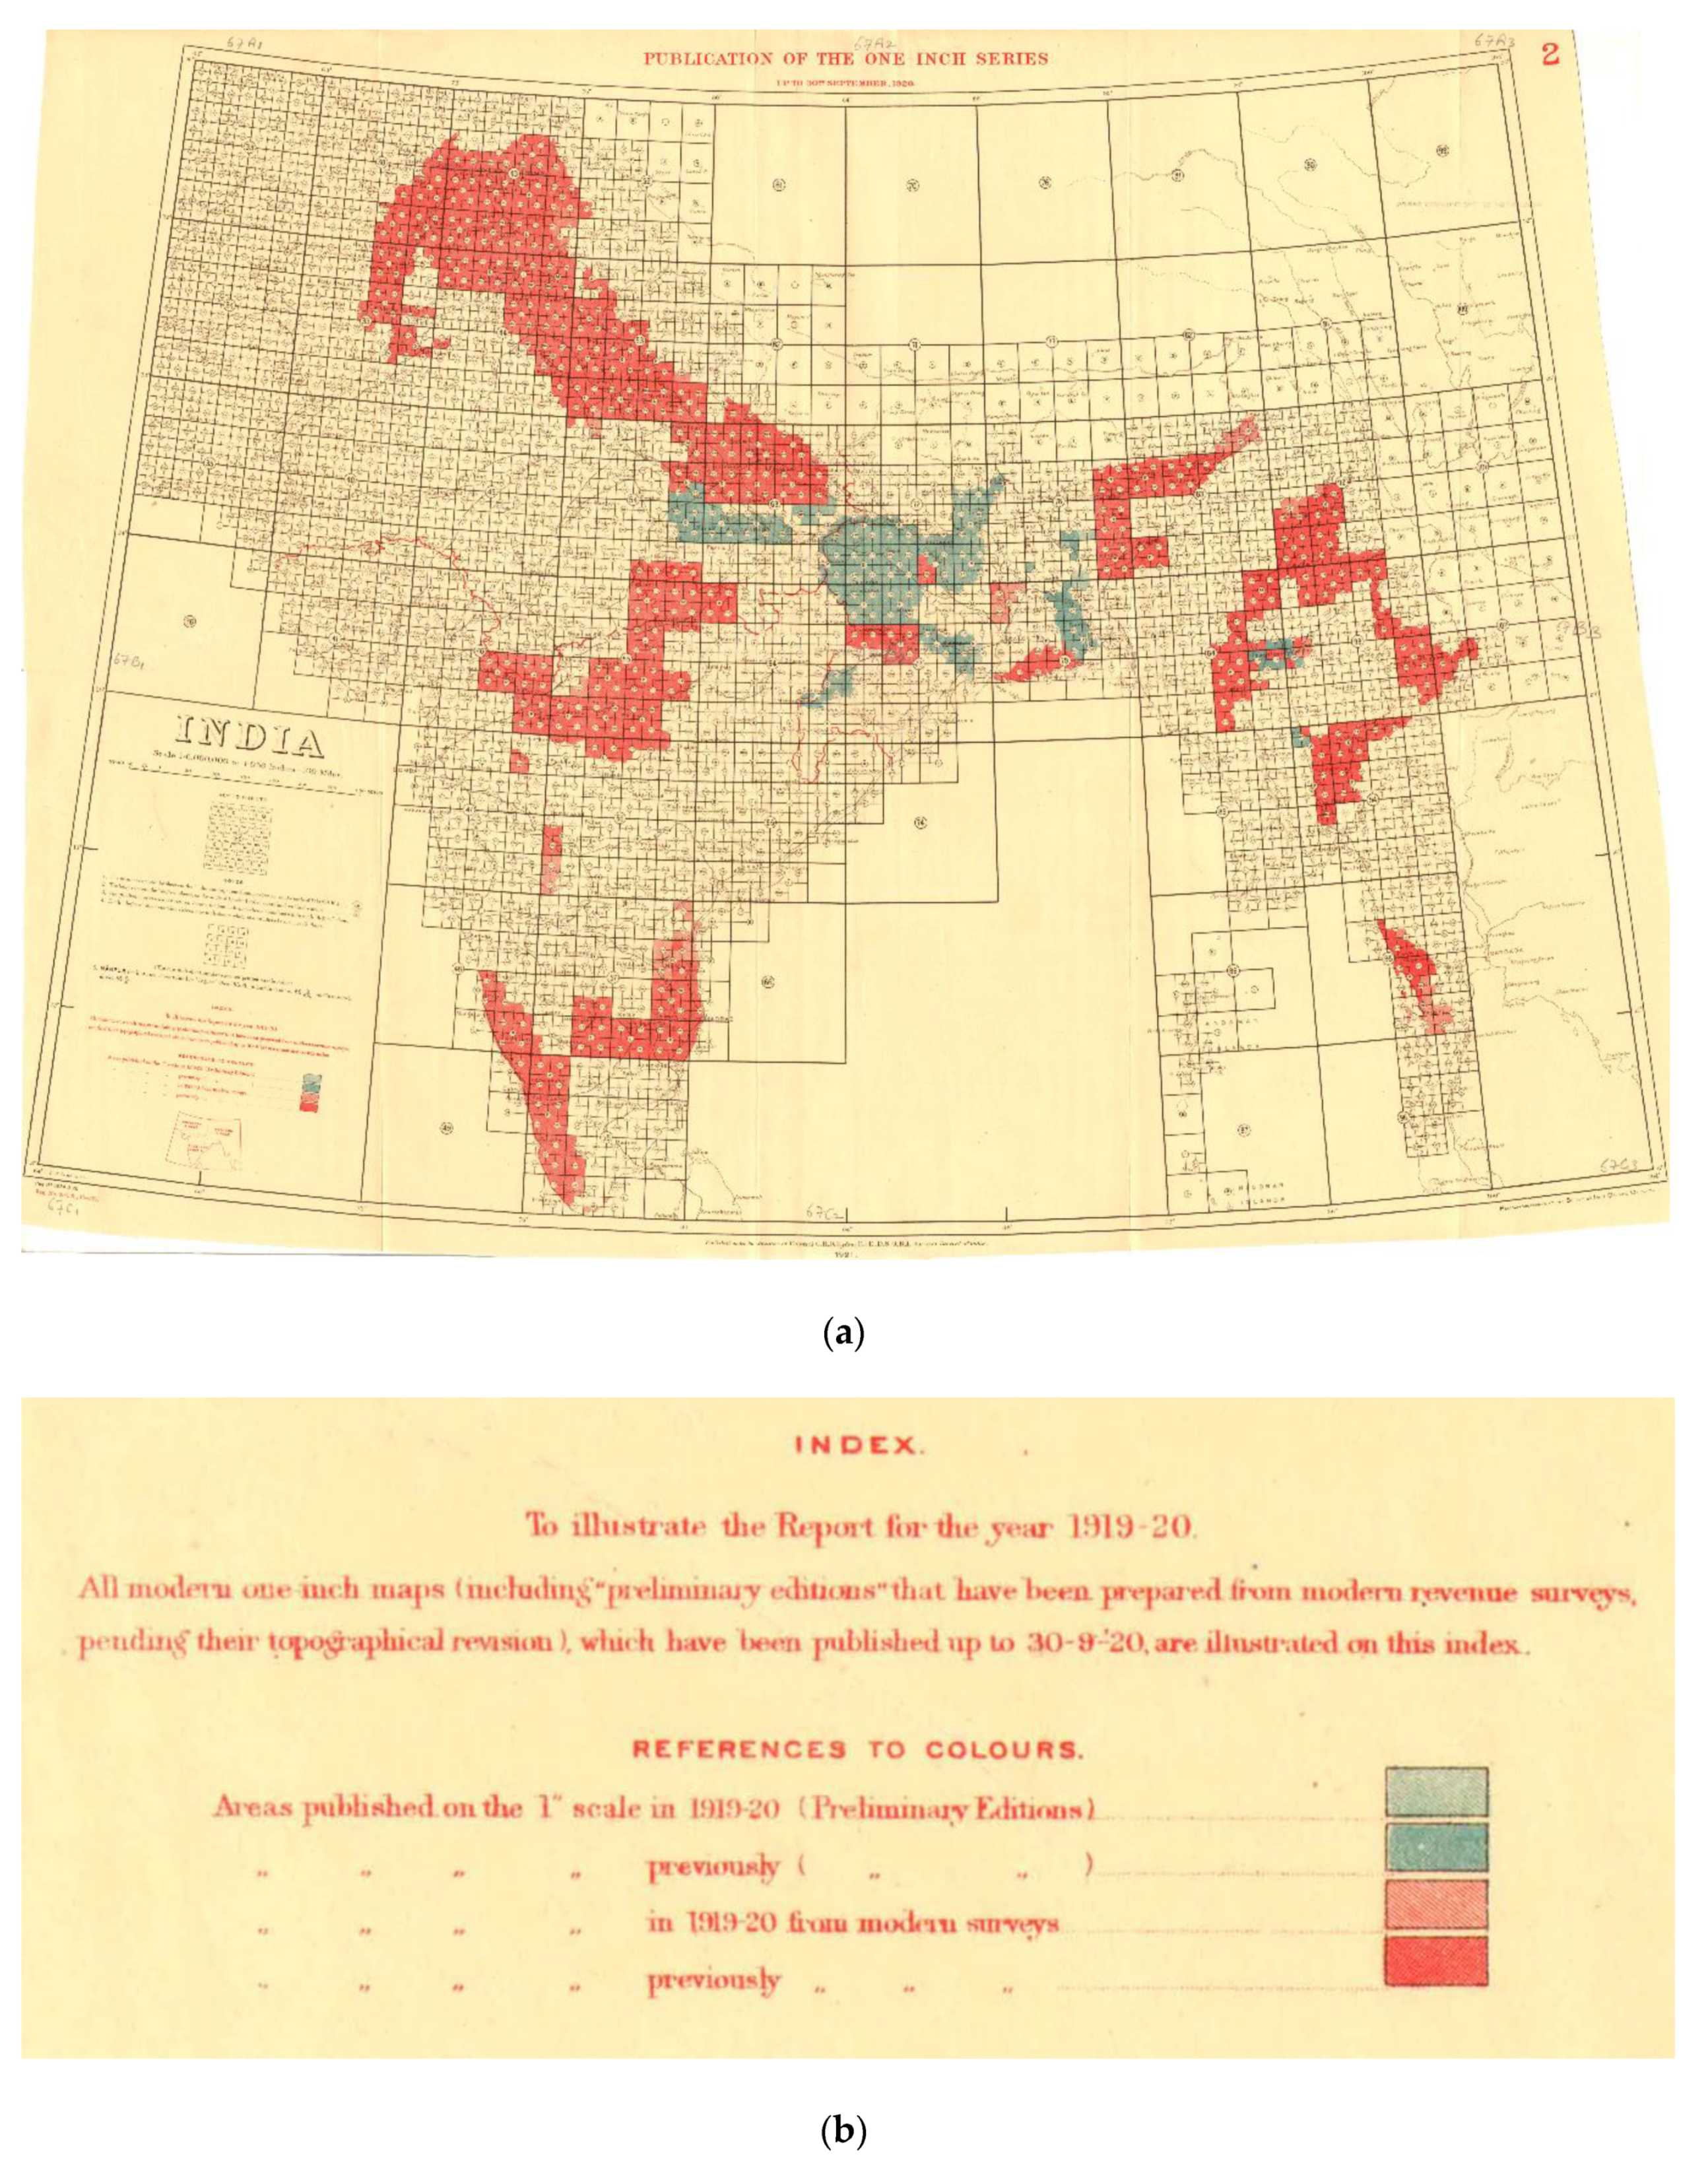
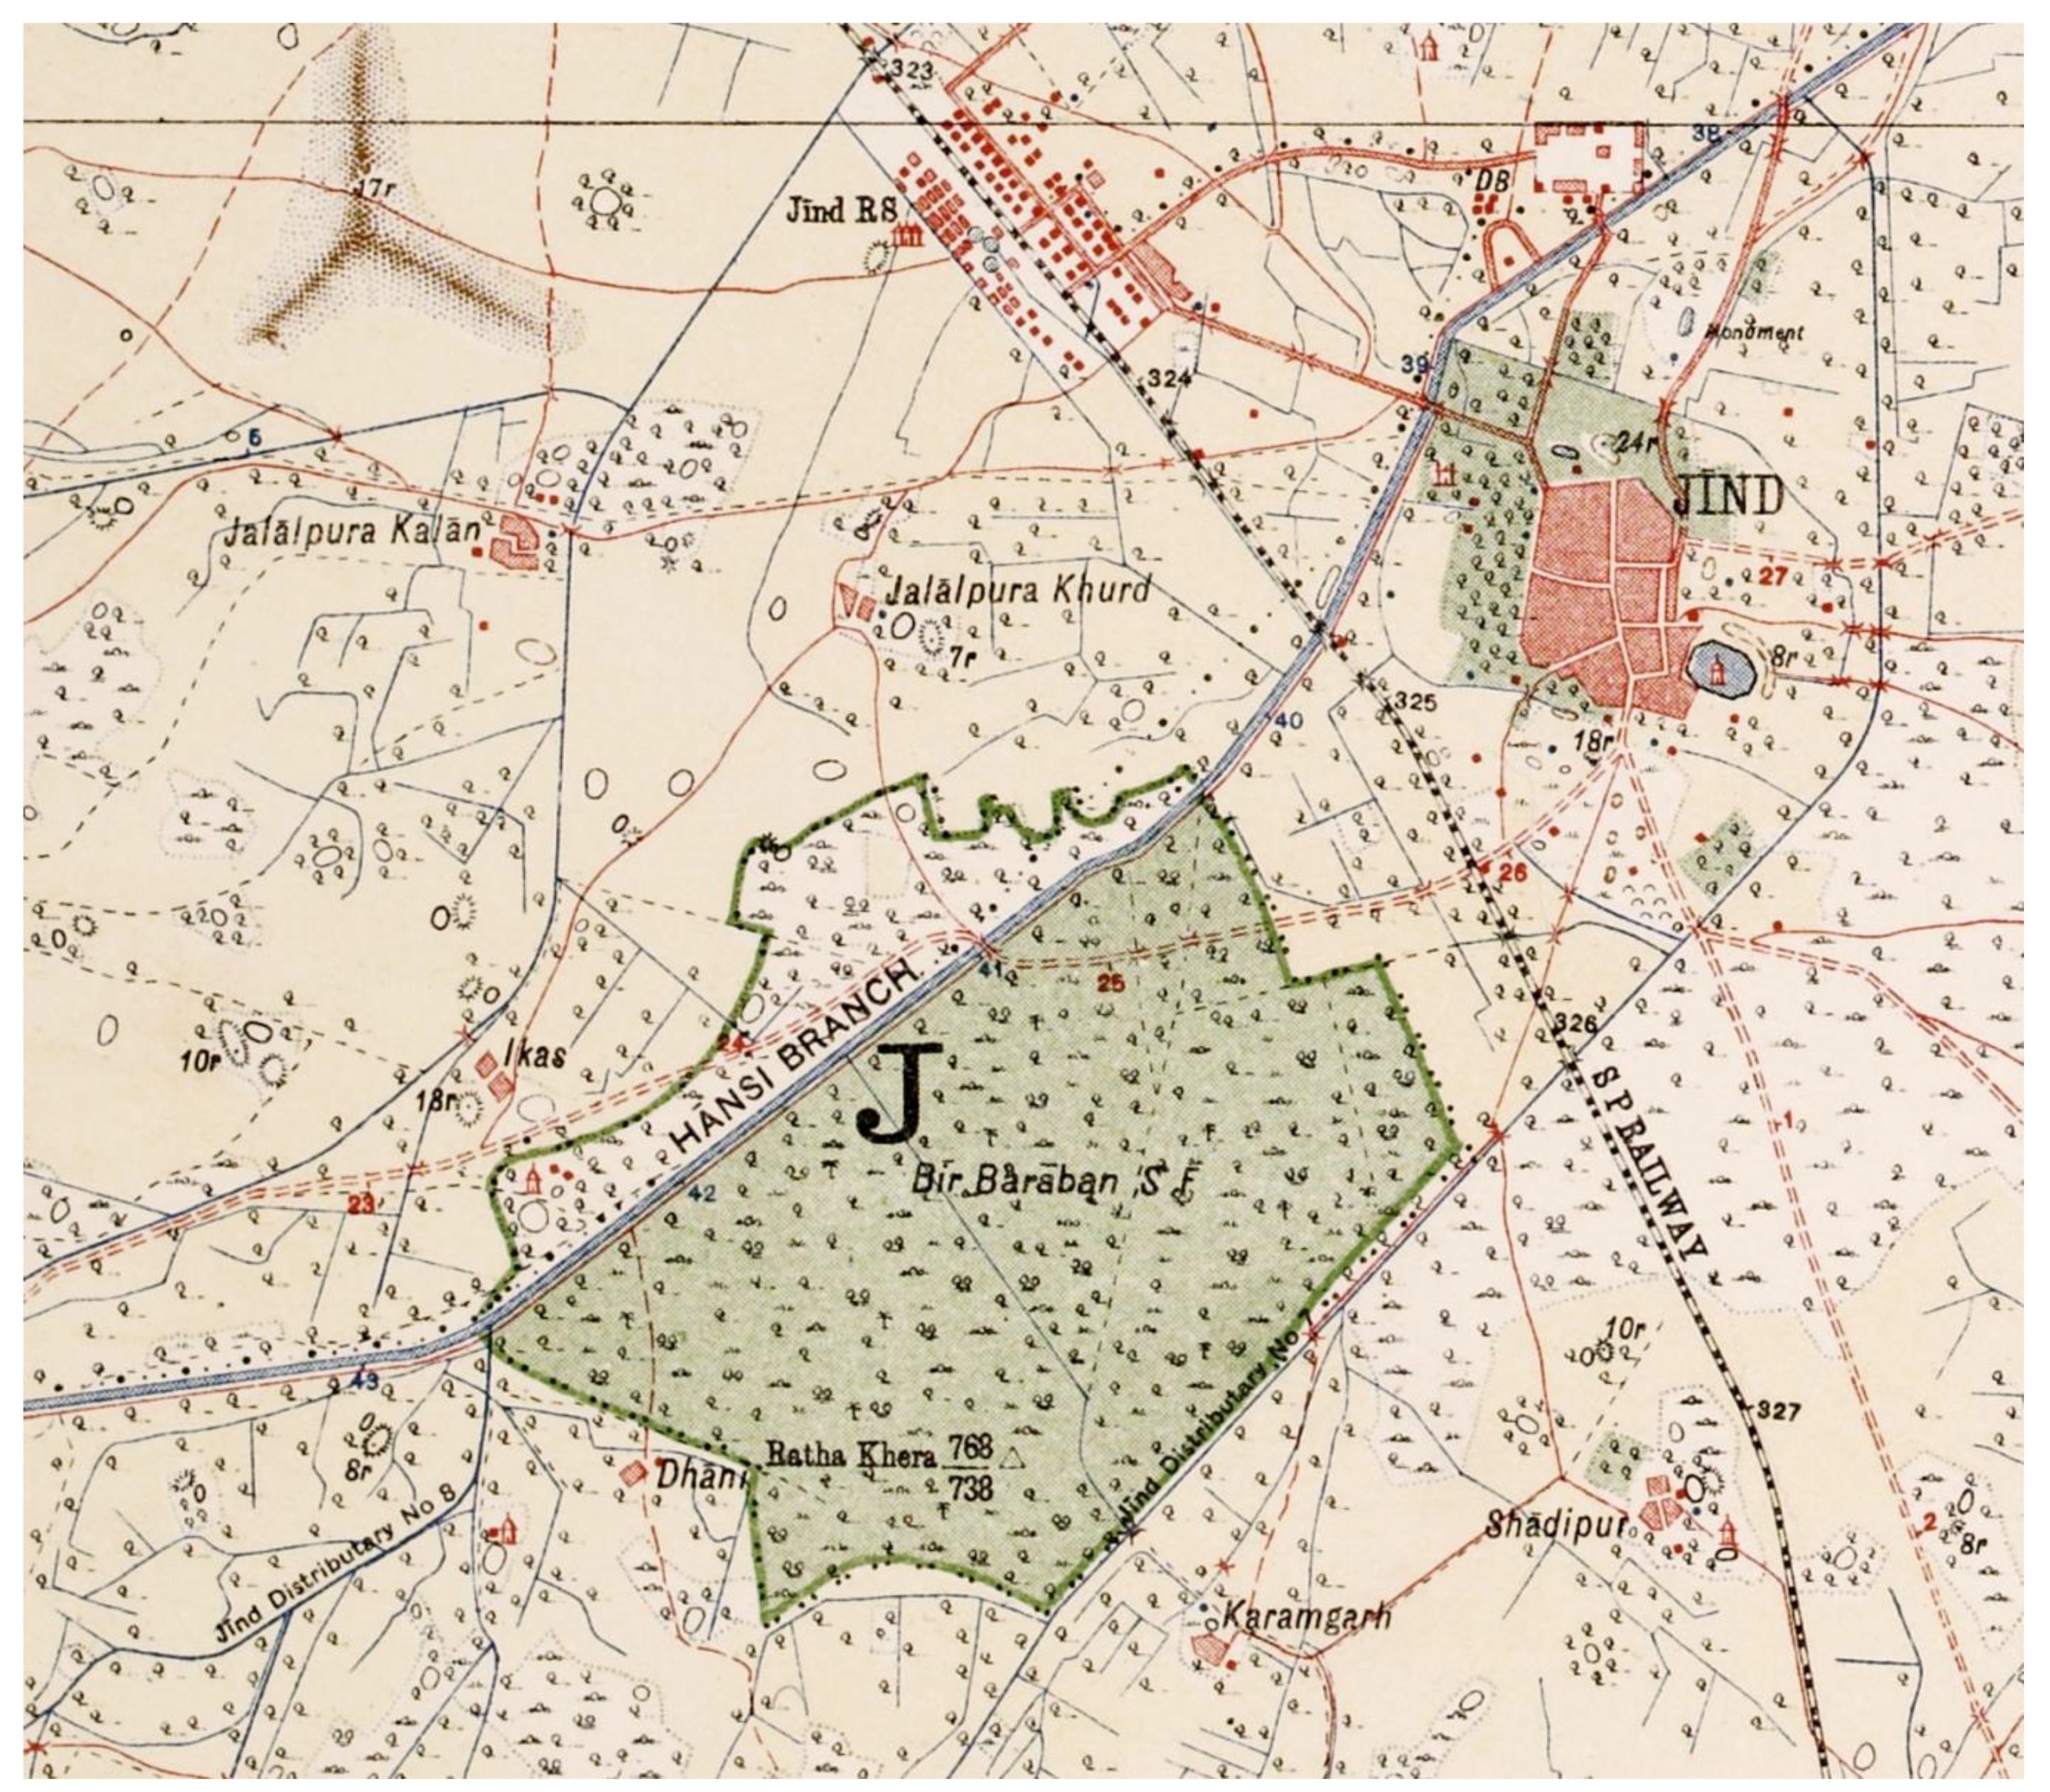
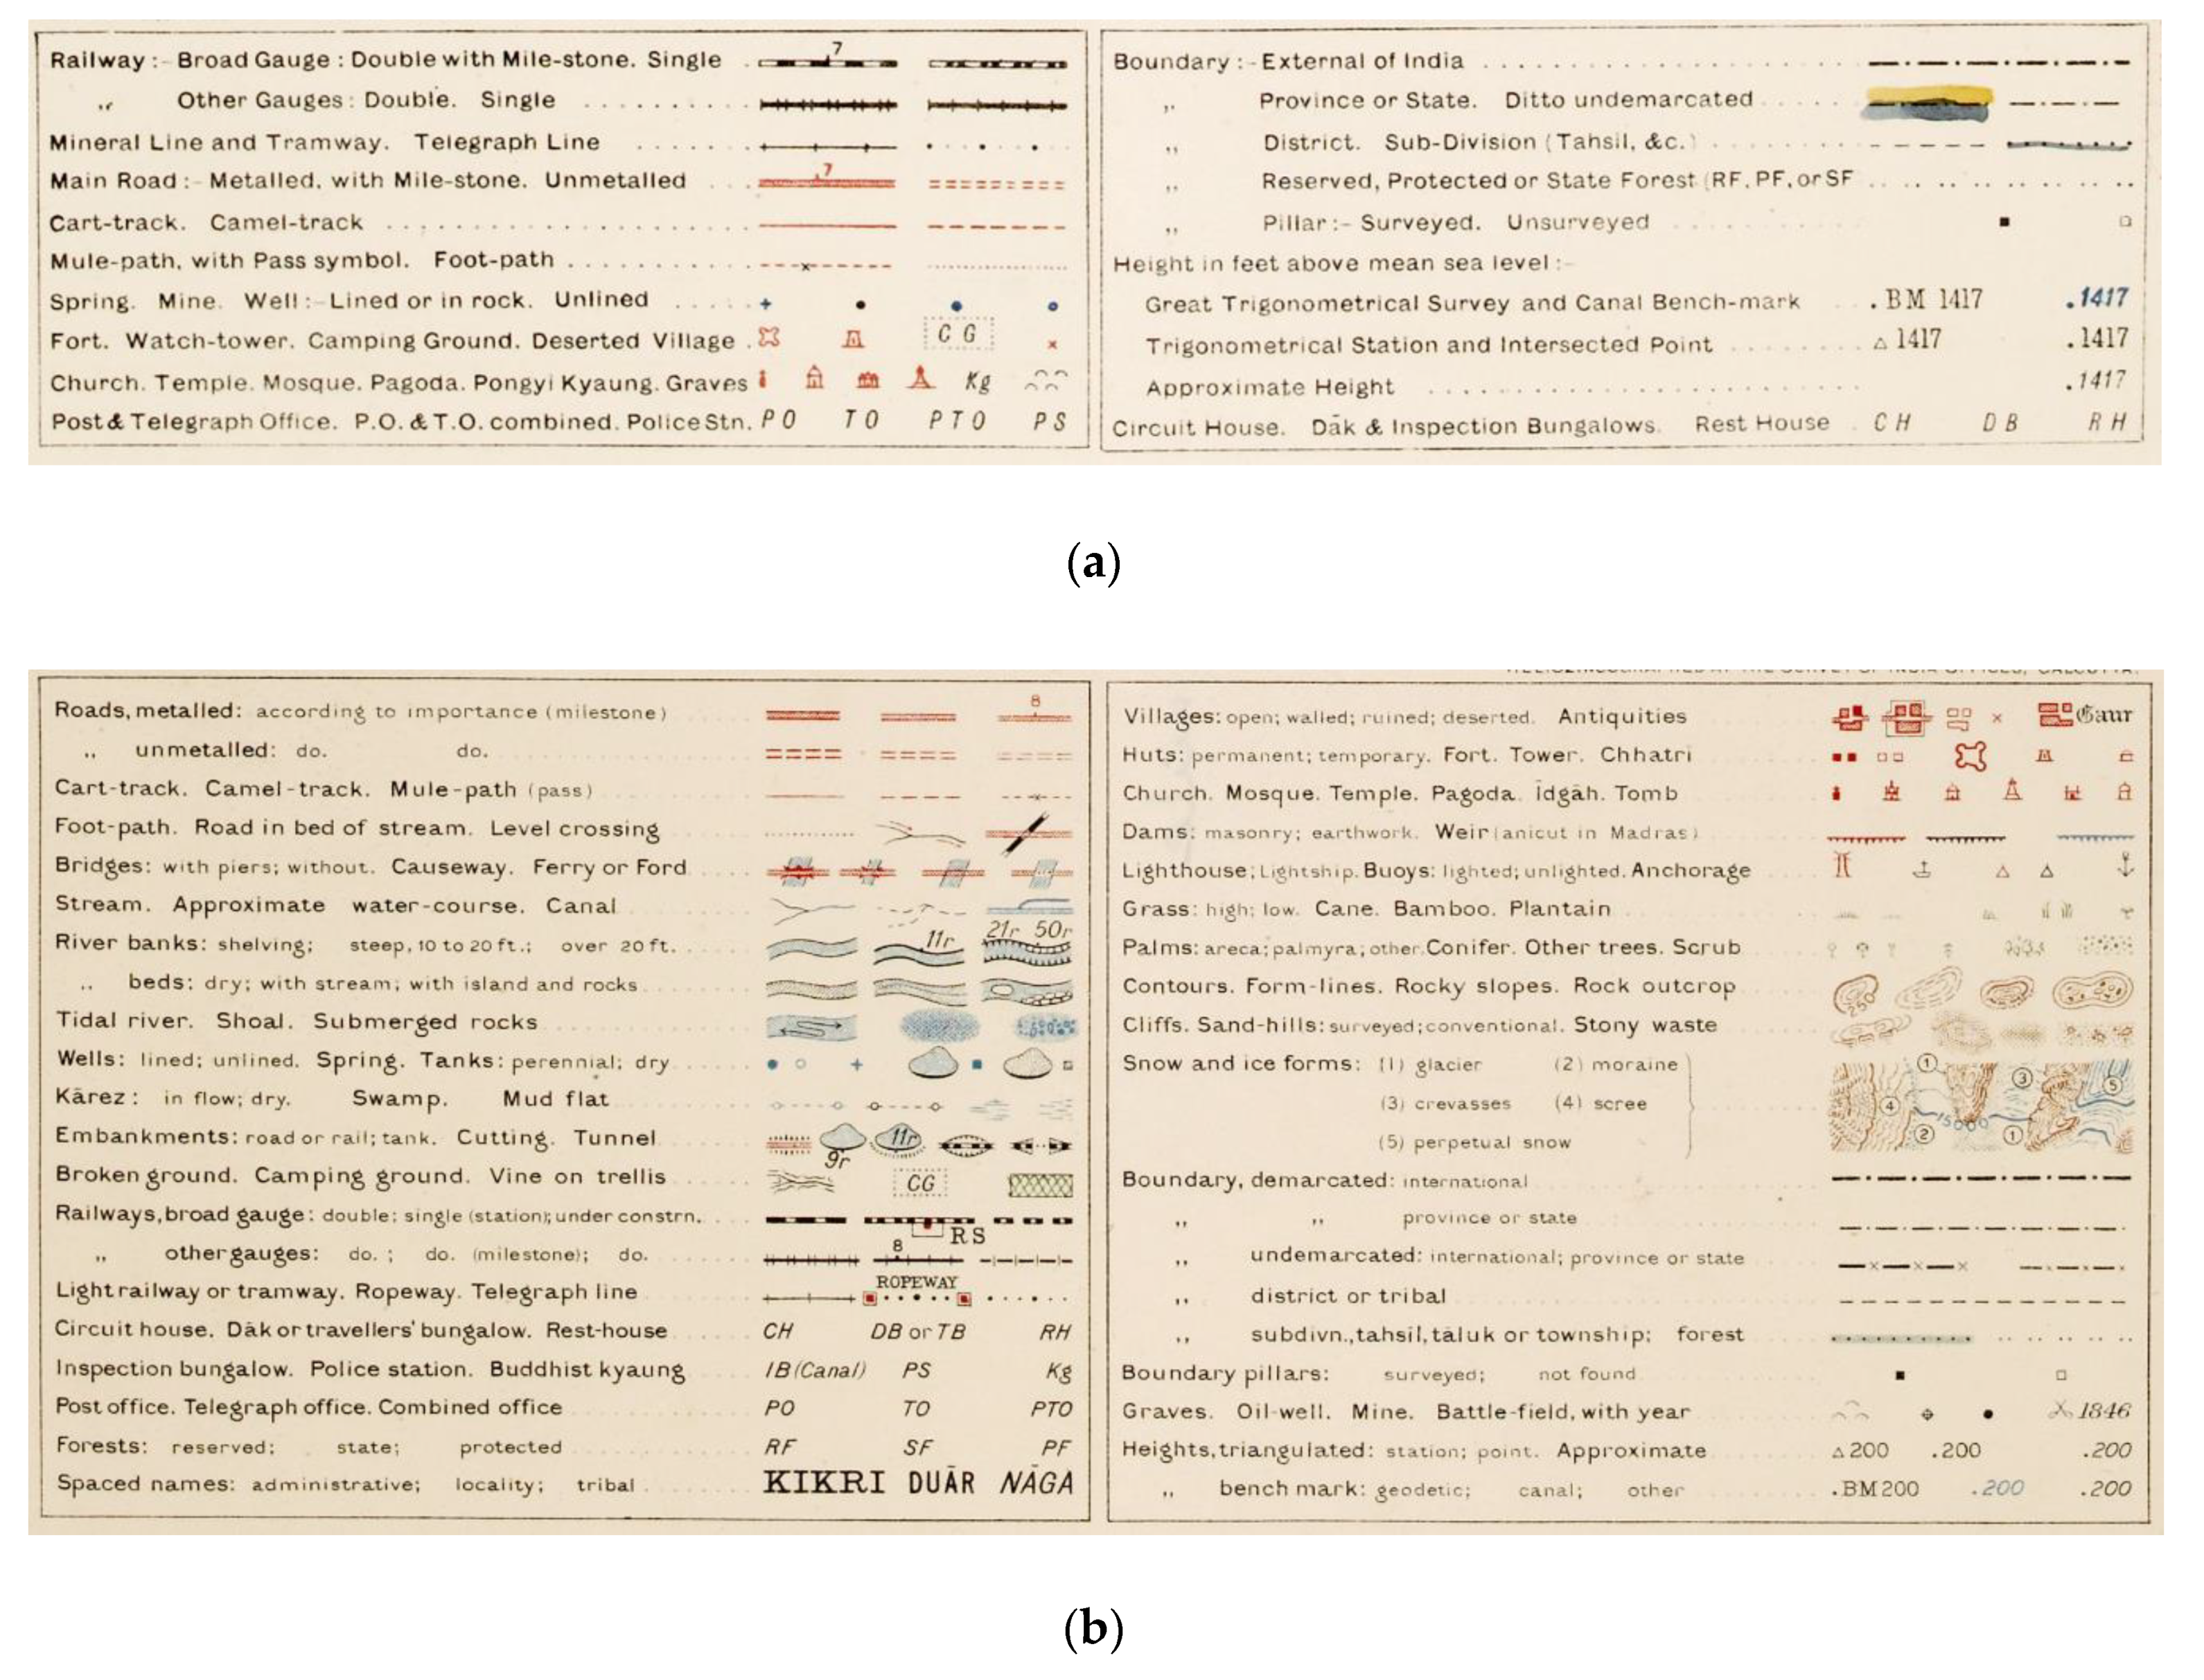
3.3. Incidental Documentation of Archaeology in the Survey of India 1” to 1-Mile Maps
4. Geo-Referencing Survey of India 1” to 1-Mile Maps
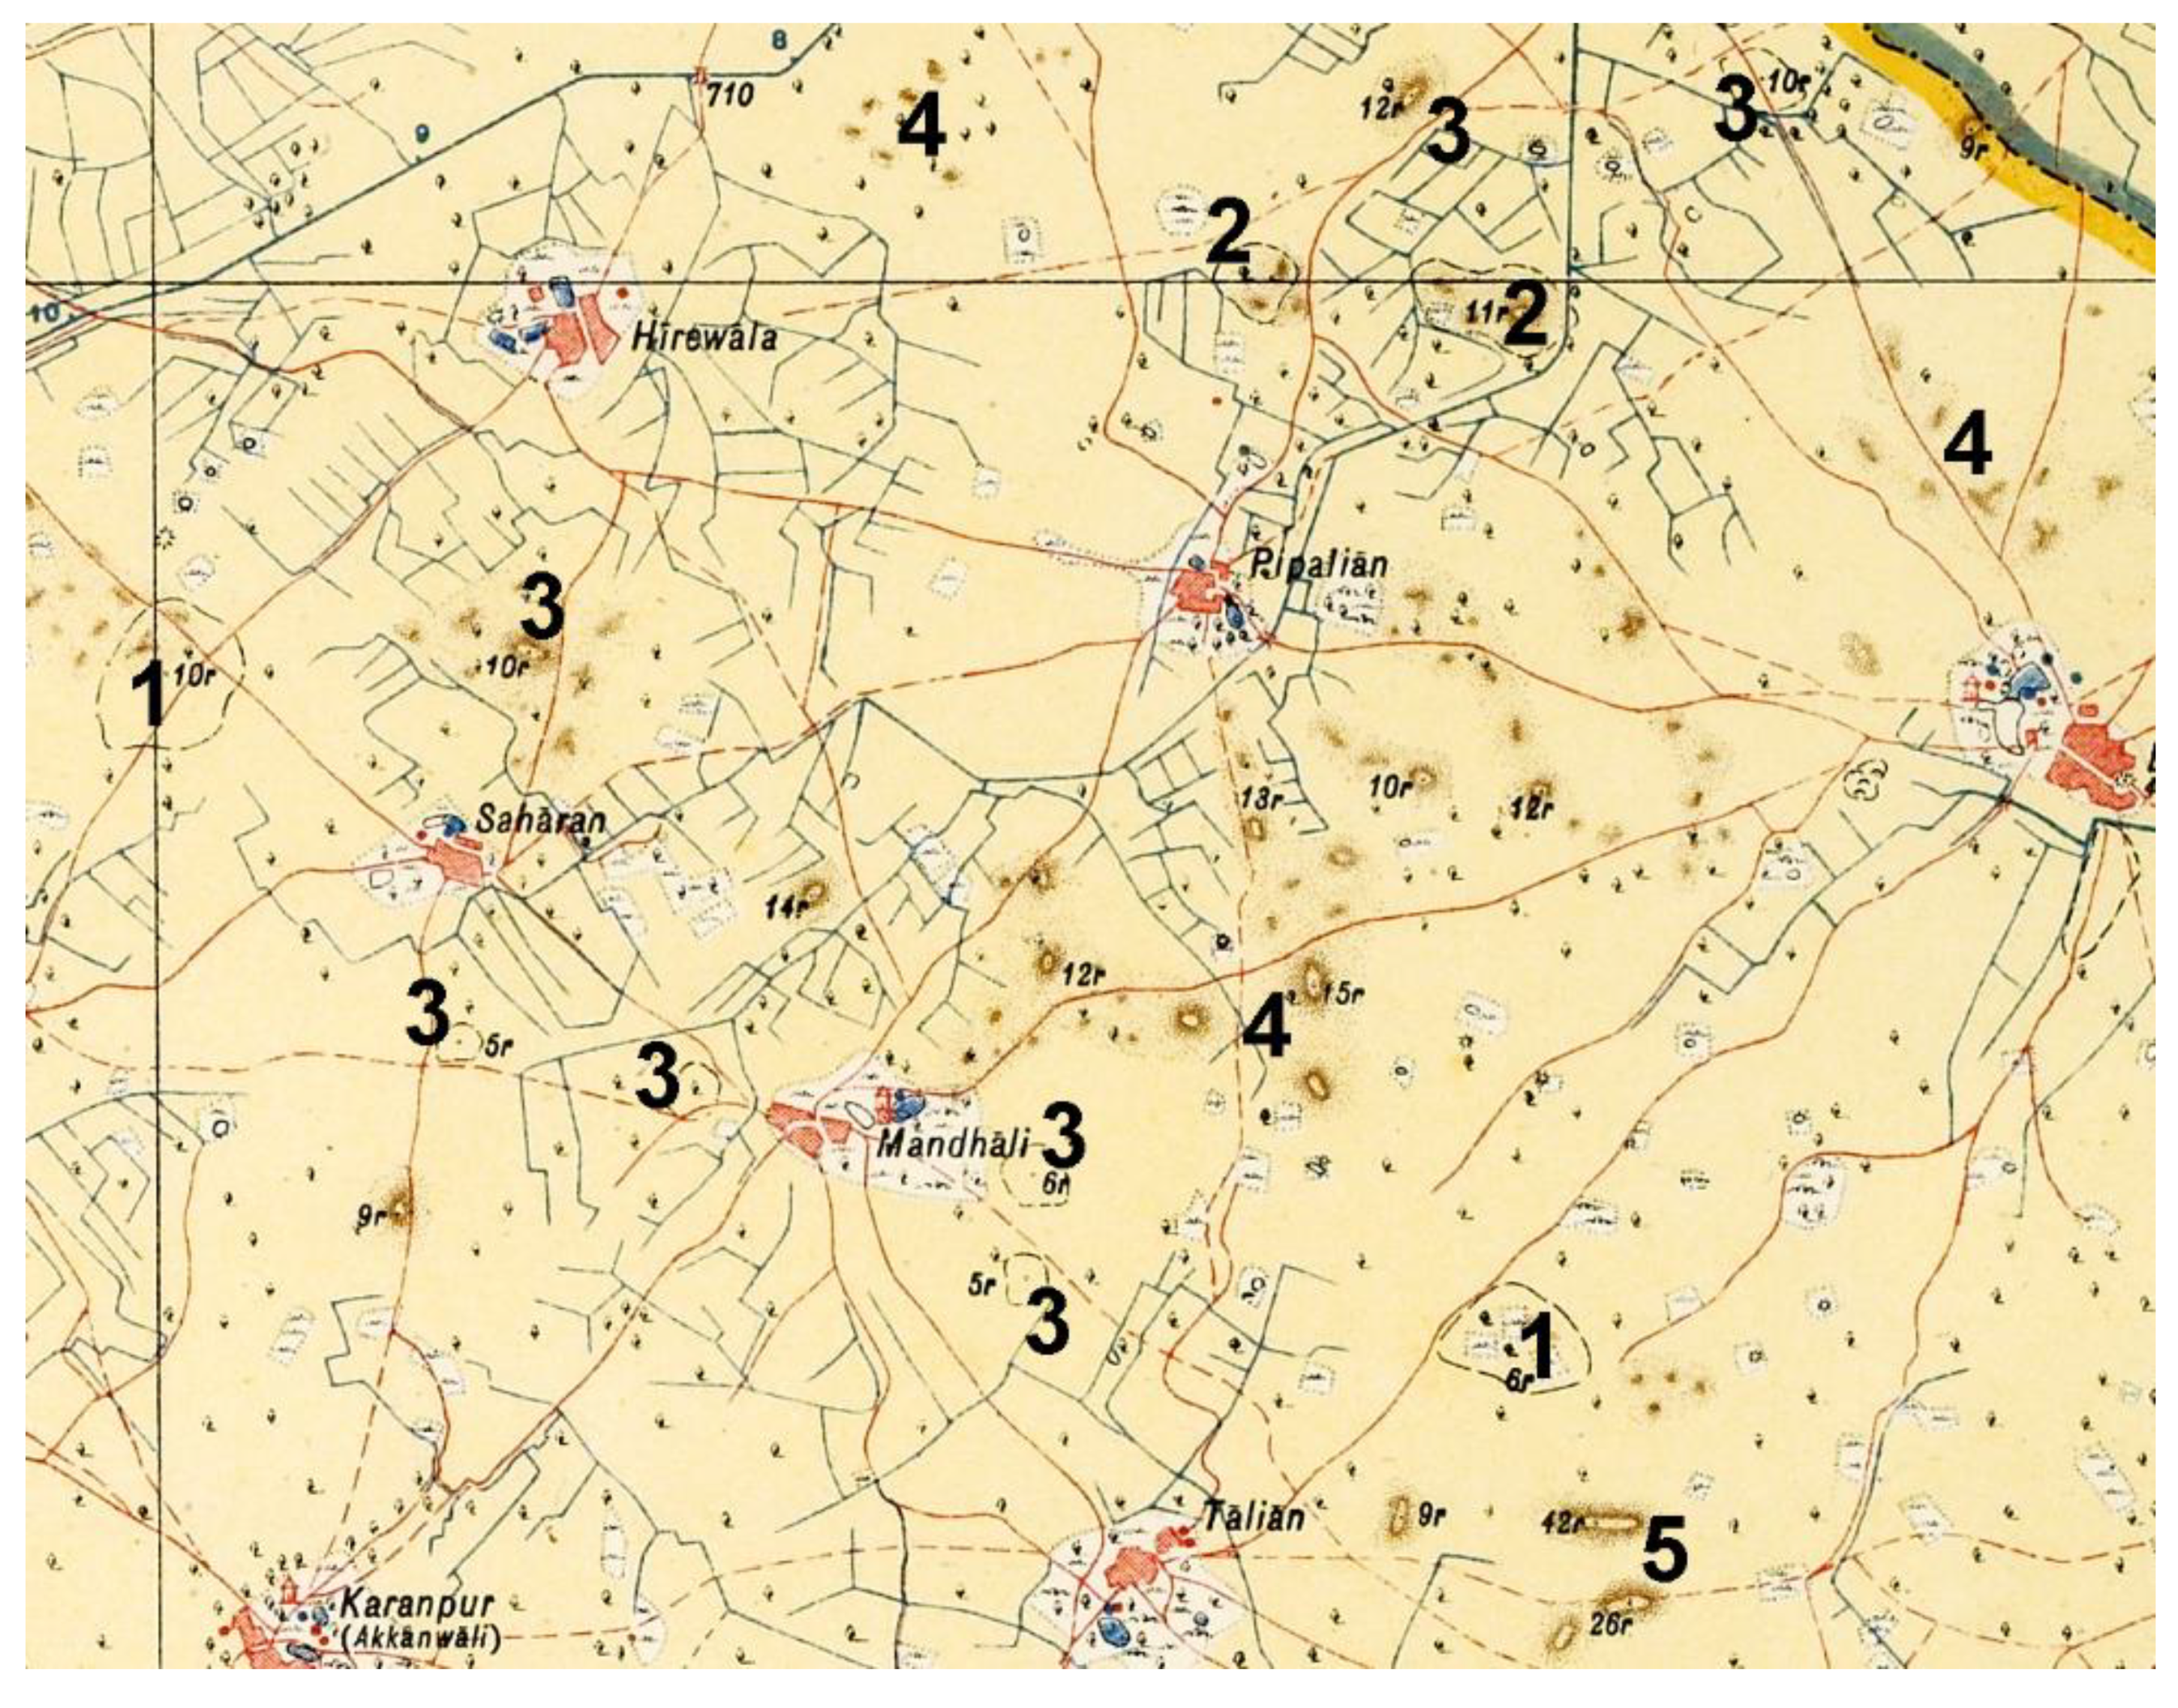
5. Identifying mound features on Survey of India 1” to 1-mile maps
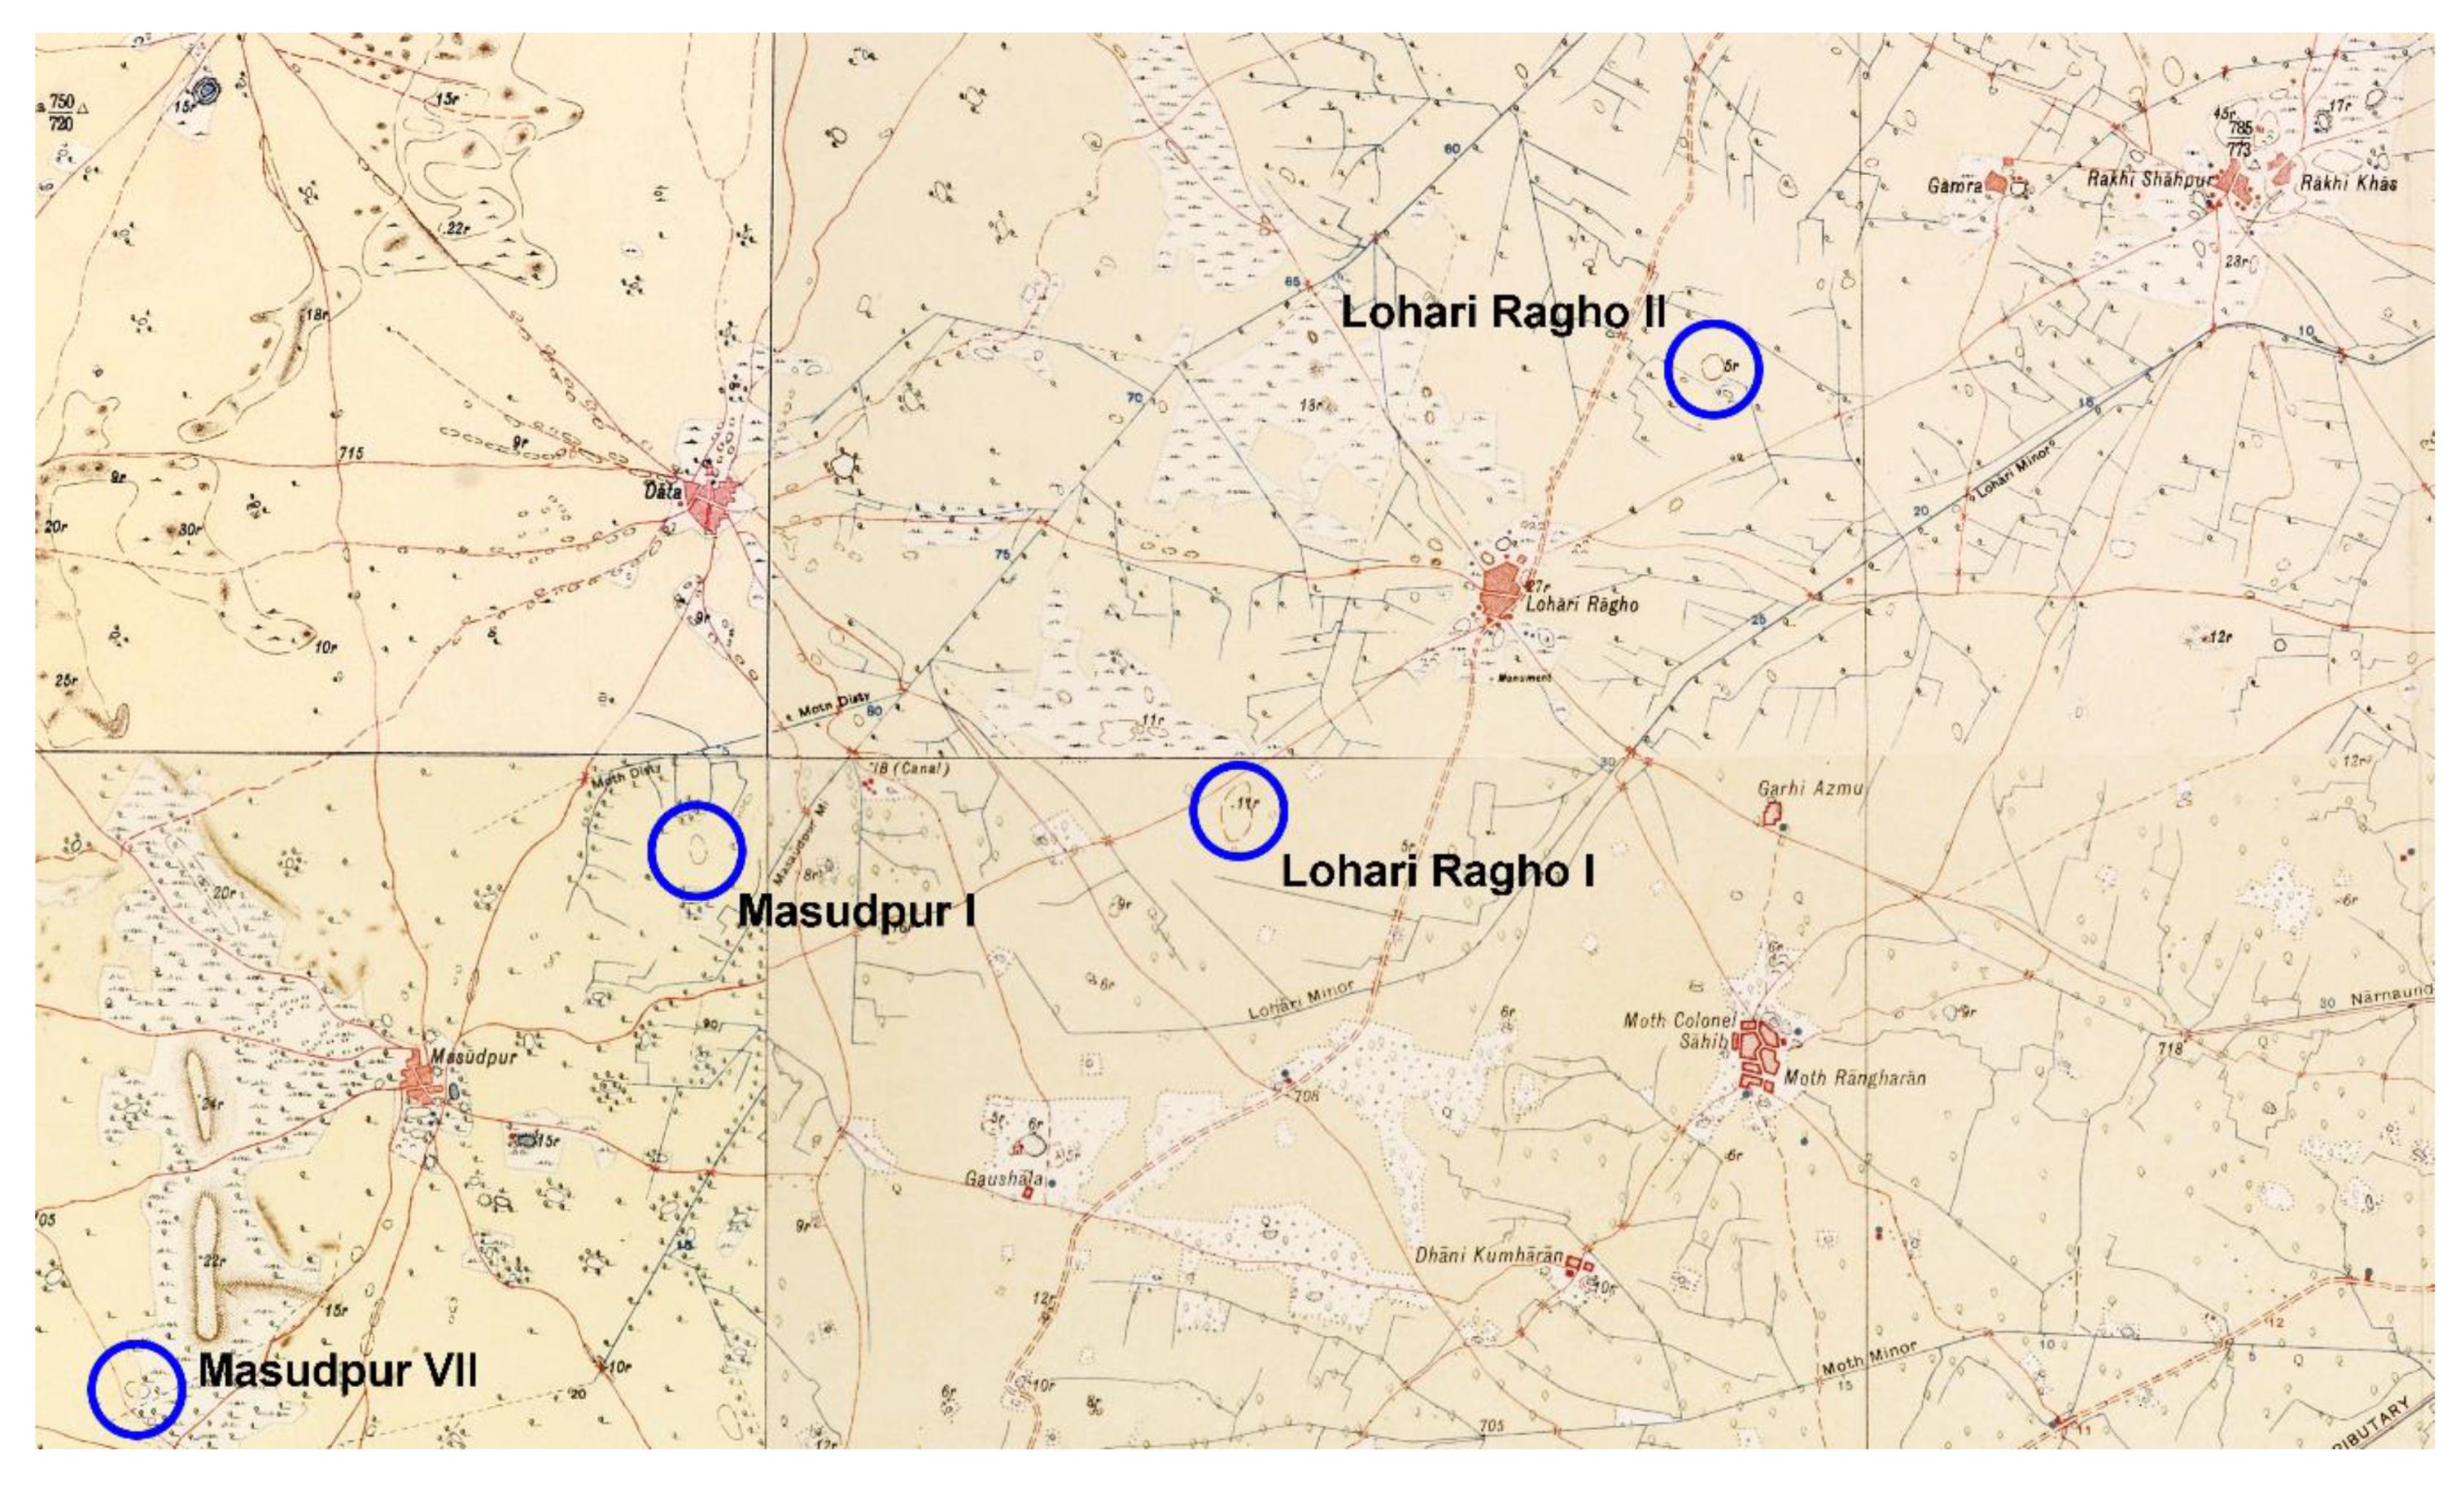
6. Testing the Archaeological Viability of the Identification of Mound Features
7. Discussion and Conclusions
Author Contributions
Funding
Acknowledgments
Conflicts of Interest
References
- Wilkinson, T.J. Archaeological Landscapes of the Near East; University of Arizona Press: Tucson, AZ, USA, 2003. [Google Scholar]
- Petrie, C.A. Remote sensing in inaccessible lands: Plains and preservation along old routes between Pakistan and Afghanistan. ArchAtlas 2007, 3. Available online: http://www.archatlas.org/workshop/Petrie07.php (accessed on 8 November 2018).
- Thomas, D.C.; Kidd, F.J. On the margins: Enduring pre-modern water management strategies in and around the Registan desert, Afghanistan. J. Field Archaeol. 2017, 41, 29–42. [Google Scholar] [CrossRef]
- Hammer, E.; Seifried, R.; Franklin, K.; Lauricellaca, A. Remote assessments of the archaeological heritage situation in Afghanistan. J. Cult. Herit. 2018, 33, 125–144. [Google Scholar] [CrossRef]
- Franklin, K.; Hammer, E. Untangling palimpsest landscapes in conflict zones: A “remote survey” in Spin Boldak, Southeast Afghanistan. J. Field Archaeol. 2018, 43, 58–73. [Google Scholar] [CrossRef]
- Casana, J.; Laugier, E.J. Satellite imagery-based monitoring of archaeological site damage in the Syrian civil war. PLoS ONE 2017, 12, e0188589. [Google Scholar] [CrossRef] [PubMed]
- Orengo, H.A.; Krahtopoulou, A.; Garcia-Molsosa, A.; Palaiochoritis, K.; Stamati, A. Photogrammetric re-discovery of the hidden long-term landscapes of western Thessaly, central Greece. J. Archaeol. Sci. 2015, 64, 100–109. [Google Scholar] [CrossRef]
- Simpson, T. “Clean out of the map”: Knowing and doubting space at India’s high imperial frontiers. Hist. Sci. 2017, 55, 3–36. [Google Scholar] [CrossRef]
- Thuillier, H.L.; Smyth, R. A Manual for Surveying for India Detailing the Mode of Operations on the Trigonometrical, Topographical and Revenue Surveys of India, 3rd ed.; Thacker, Spink and Co.: Calcutta, India, 1875. [Google Scholar]
- Fairservis, W.A. Excavations in the Quetta Valley, West Pakistan; American Museum of Natural History: New York, NY, USA, 1956. [Google Scholar]
- Wiseman, J.R.; El-Baz, F. (Eds.) Remote Sensing in Archaeology; Springer: New York, NY, USA, 2007. [Google Scholar]
- Tapete, D. Remote Sensing and Geosciences for Archaeology. Geosciences 2018, 8, 41. [Google Scholar] [CrossRef]
- Fowler, M.J.F.; Curtis, H. Stonehenge from 230 kilometres. AARGnews 1995, 11, 8–16. [Google Scholar]
- Kennedy, D. Declassified satellite photographs and archaeology in the Middle East: Case studies from Turkey. Antiquity 1998, 72, 553–561. [Google Scholar] [CrossRef]
- Kouchoukos, N. Satellite images and the representation of Near Eastern landscapes. Near East. Archaeol. 2001, 64, 80–91. [Google Scholar] [CrossRef]
- Ogata, N. A study on cities, settlements and archaeological sites in the Silk Road region using satellite photos. Bull. Res. Cent. Silk Roadol. 2003, 17, 39–51. Available online: http://hdl.handle.net/10935/4395 (accessed on 9 November 2018).
- Pournelle, J. Marshland of Cities: Deltaic Landscapes and the Evolution of Early Mesopotamian Civilization. Ph.D. Dissertation, University of California, San Diego, CA, USA, 2003. [Google Scholar]
- Ur, J.A. CORONA satellite photography and ancient road networks: A northern Mesopotamian case study. Antiquity 2003, 77, 102–115. [Google Scholar] [CrossRef]
- Fowler, M.J.F. Declassified CORONA KH-4B satellite photography of remains from Rome’s desert frontier. Int. J. Remote Sens. 2004, 25, 3549–3554. [Google Scholar] [CrossRef]
- Galiatsatos, N. Assessment of the CORONA series of satellite imagery for landscape archaeology: A case study from the Orontes valley, Syria. Unpublished. Ph.D. Dissertation, Durham University, Durham, UK, 2004. [Google Scholar]
- Wilkinson, T.J.; Ur, J.; Casana, J. From nucleation to dispersal: Trends in settlement pattern in the Northern Fertile Crescent. In Side-by-Side Survey: Comparative Regional Studies in the Mediterranean World; Cherry, J., Alcock, S., Eds.; Oxbow Books: Oxford, UK, 2004; pp. 198–205. ISBN 1842170961. [Google Scholar]
- Altaweel, M. The use of ASTER satellite imagery in archaeological contexts. Archaeol. Prospect. 2005, 166, 151–166. [Google Scholar] [CrossRef]
- Hritz, C. The changing archaeoscape of southern Mesopotamia. In GIS and Archaeological Site Location Modelling; Mehrer, M., Wolcott, C., Eds.; Taylor & Francis: Boca Raton, FL, USA, 2005; pp. 413–436. ISBN 9780415315487. [Google Scholar]
- Alizadeh, K.; Ur, J.A. Formation and destruction of pastoral and irrigation landscapes on the Mughan Steppe, north-western Iran. Antiquity 2007, 81, 148–160. [Google Scholar] [CrossRef]
- Beck, A.; Philip, G.; Abdulkarim, M.; Donoghue, D.N. Evaluation of Corona and Ikonos high resolution satellite imagery for archaeological prospection in western Syria. Antiquity 2007, 81, 161–175. [Google Scholar] [CrossRef]
- Casana, J.; Cothren, J. Stereo analysis, DEM extraction and orthorectification of CORONA satellite imagery: Archaeological applications from the Near East. Antiquity 2008, 82, 732–749. [Google Scholar] [CrossRef]
- Mantellini, S.; Rondelli, B.; Stride, S. Analytical approach for representing the water landscape evolution in Samarkand Oasis (Uzbekistan). In On the Road to Reconstructing the Past. Computer Applications and Quantitative Methods in Archaeology (CAA2008); Jerem, E., Redö, F., Szeverényi, V., Eds.; Archaeolingua: Budapest, Hungary, 2011; pp. 387–396. ISBN 9789639911307. [Google Scholar]
- Rondelli, B.; Stride, S.; García-Granero, J.J. Soviet military maps and archaeological survey in the Samarkand region. J. Cult. Herit. 2013, 14, 270–276. [Google Scholar] [CrossRef]
- Ur, J.; de Jong, L.; Giraud, J.; Osborne, J.F.; MacGinnis, J. Ancient cities and landscapes in the Kurdistan region of Iraq: The Erbil Plain Archaeological Survey 2012 season. Iraq 2013, 75, 89–118. [Google Scholar] [CrossRef]
- Wright, R.P.; Hritz, C. Satellite remote sensing imagery: New evidence for site distributions and ecologies in the upper Indus. In South Asian Archaeology 2007; Frenez, D., Tosi, M., Eds.; BAR International Series 2454; Archaeopress: Oxford, UK, 2013; pp. 315–321. ISBN 9781407310626. [Google Scholar]
- Conesa, F.C.; Madella, M.; Galiatsatos, N.; Balbo, A.L.; Rajesh, S.V.; Ajithprasad, P. CORONA photographs in monsoonal semi-arid environments: Addressing archaeological surveys and historic landscape dynamics over North Gujarat, India. Archaeol. Prospect. 2015, 22, 75–90. [Google Scholar] [CrossRef]
- Ogata, N.; Yu, Z.; Ito, T.; Sohma, H.; Ideta, K. A study of settlement remains near the Qiemo Oasis in Northwestern China using Satellite Imagery and DEM. Stud. Geogr. Reg. Environ. Res. 2015, VIII, 9–29. Available online: http://jairo.nii.ac.jp/0059/00005522 (accessed on 9 November 2018).
- Hammer, E. New Research Directions in the CAMEL Lab. News and Notes, The Oriental Institute Members’ Magazine. 2016, Volume 228, pp. 4–9. Available online: https://oi.uchicago.edu/sites/oi.uchicago.edu/files/uploads/shared/docs/Publications/nn228-web.pdf (accessed on 9 November 2018).
- Hammer, E.; Lauricella, A. Historical imagery of desert kites in eastern Jordan. Near East. Archaeol. 2017, 80, 74–83. [Google Scholar] [CrossRef]
- Orengo, H.A.; Petrie, C.A. Large-scale, multi-temporal remote sensing of palaeo-river networks: A case-study from northwest India and its implications for the Indus Civilisation. Remote Sens. 2017, 9, 735. [Google Scholar] [CrossRef]
- Thomas, D.C. The Ebb and Flow of the Ghūrid Empire; Adapa Monographs; University of Sydney Press: Sydney, Australia, 2018; ISBN 9781743325414. [Google Scholar]
- Fuentes, J.; Varga, D.; Pinto, J. The Use of High-Resolution Historical Images to Analyse the Leopard Pattern in the Arid Area of La Alta Guajira, Colombia. Geosciences 2018, 8, 366. [Google Scholar] [CrossRef]
- Scollar, I.; Galiatsatos, N.; Mugnier, C. Mapping from CORONA geometric distortion in KH4 images. Photogramm. Eng. Remote Sens. 2016, 82, 7–13. [Google Scholar] [CrossRef]
- Crawford, O.G.S. A century of air photography. Antiquity 1954, 28, 206–210. [Google Scholar] [CrossRef]
- Kennedy, D.; Bewley, R. Aerial archaeology in Jordan. Antiquity 2009, 83, 69–81. [Google Scholar] [CrossRef]
- Braasch, O. Goodbye Cold War! Goodbye Bureaucracy? Opening the skies to aerial archaeology. In Aerial Archaeology: Developing Future Practice; Bewley, R., Rączkowski, W., Eds.; IOS Press: Amsterdam, The Netherlands, 2002; pp. 19–22. ISBN 1586031848. [Google Scholar]
- Bourgeois, J.; Meganck, M. (Eds.) Aerial Photography and Archaeology 2003: A Century of Information; Archaeological Reports Ghent University; Academia: Ghent, Belgium, 2005; ISBN 9789038207827. [Google Scholar]
- Hanson, W.S.; Oltean, I.A. (Eds.) Archaeology from Historical Aerial and Satellite Archives; Springer: New York, NY, USA, 2013; ISBN 978-1-4614-4505-0. [Google Scholar]
- Orengo, H.A.; Knappett, C. Toward a definition of Minoan agro-pastoral landscapes: Results of the survey of Palaikastro (Crete). Am. J. Archaeol. 2018, 122, 470–507. [Google Scholar] [CrossRef]
- Grady, D. Aerial Reconnaissance: Management of Research Projects in the Historic Environment; MoRPHE Project Planning Notes (PPN) 5; Historic England: London, UK, 2008; Available online: https://historicengland.org.uk/images-books/publications/morphe-project-planning-note-5/heag028-morphe-ppn5/ (accessed on 9 November 2018).
- Verhoeven, G.; Sevara, C.; Karel, W.; Ressl, C.; Doneus, M.; Briese, C. Undistorting the past: New techniques for orthorectification of archaeological aerial frame imagery. In Good Practice in Archaeological Diagnostics: Non-Invasive Survey of Complex Archaeological Sites; Corsi, C., Slapšak, B., Vermeulen, F., Eds.; Natural Science in Archaeology; Springer: Cham, Switzerland, 2013; pp. 31–67. ISBN 978-3-319-01784-6. [Google Scholar]
- Doneus, M.; Geert Verhoeven, G.; Atzberger, C.; Wess, M.; Ruš, M. New ways to extract archaeological information from hyperspectral pixels. J. Archaeol.l Sci. 2014, 52, 84–96. [Google Scholar] [CrossRef]
- McCarthy, J. Multi-image photogrammetry as a practical tool for cultural heritage survey and community engagement. J. Archaeol. Sci. 2014, 43, 175–185. [Google Scholar] [CrossRef]
- Oliver, R. Ordnance Survey Maps: A Concise Guide for Historians; Charles Close Society for the Study of Ordnance Survey Maps: London, UK, 2005; ISBN 978-1-870-598-31-6. [Google Scholar]
- Phillips, C.W. Archaeology in the Ordnance Survey 1791–1965; CBA: London, UK, 1980; ISBN 0900312904. [Google Scholar]
- Edney, M.H. Mapping an Empire: The Geographical Construction of British India, 1765–1843; University of Chicago Press: Chicago, IL, USA, 1997; ISBN 9780226184883. [Google Scholar]
- Barrow, I.J. Making History, Drawing Territory: British Mapping in India, c.1756–1905; Oxford University Press: Oxford, UK, 2003; ISBN 0195665465. [Google Scholar]
- Chester, L.P. Borders and Conflict in South Asia: The Radcliffe Boundary Commission and the Partition of Punjab; Studies in Imperialism; Manchester University Press: Manchester, UK, 2009; ISBN 978-0-7190-9136-0. [Google Scholar]
- Foliard, D. Dislocating the Orient: British Maps and the Making of the Middle East, 1854–1921; University of Chicago Press: Chicago, IL, USA, 2017; ISBN 9780226451336. [Google Scholar]
- Ball, W. Archaeological Gazetteer of Afghanistan/Catalogue des Sites Archéologiques d’Afghanistan; Editions Recherche sur les Civilisations: Paris, France, 1982; ISBN 2-86538-040-8. [Google Scholar]
- Hewitt, R. Map of a Nation—A Biography of the Ordnance Survey; Granta: London, UK, 2010; ISBN 978-1847082541. [Google Scholar]
- Chadha, S.M. Survey of India through the Ages; Royal Institution of Chartered Surveyors and the Royal Geographical Society: London, UK, 1990. [Google Scholar]
- Chadha, S.M. Survey of India through the ages. Himal. J. 1991, 47. Available online: https://www.himalayanclub.org/hj/47/2/survey-of-india-through-the-ages/ (accessed on 9 November 2018).
- Roy, W. An account of the mode proposed to be followed in determining the relative situation of the Royal Observatories of Greenwich and Paris. Philos. Trans. R. Soc. Lond. 1787, 77, 188–226. [Google Scholar] [CrossRef]
- Scholberg, H. The District Gazetteers of British India: A Bibliography; Inter Documentation: Zug, Switzerland, 1970; ISBN 9780800212650. [Google Scholar]
- Hunter, W.W. The Imperial Gazetteer of India; Clarendon Press: Oxford, UK, 1881. [Google Scholar]
- Black, C.E.D. A Memoir on the Indian Surveys, 1875–1890; E.A. Arnold: London, UK, 1891. [Google Scholar]
- Phillimore, R.H. Historical Records of the Survey of India; Survey of India: Dehra Dun, India, 1945–1968; Volumes 1–5. [Google Scholar]
- Kulkarni, M.N. Two centuries of surveying and mapping in India. Surv. Rev. 2006, 38, 452–458. [Google Scholar] [CrossRef]
- Smyth, R.; Thuillier, H.L. A Manual for Surveying for India Detailing the Mode of Operations on the Trigonometrical, Topographical and Revenue Surveys of India, 1st ed.; Thacker and Co.: Calcutta, India, 1851. [Google Scholar]
- Public Website. Available online: https://pahar.in/survey-of-india-report-maps/ (accessed on 8 November 2018).
- Cunningham, A. Four Reports Made During the Years 1862-673-64-65; Archaeological Survey of India Reports; Archaeological Survey of India: Calcutta, India, 1871; Volume I. [Google Scholar]
- Cunningham, A. The Ancient Geography of India; Chuckervertty, Chatterjee and Co.: Calcutta, India, 1871. [Google Scholar]
- Murray, D. Ordnance survey and the depiction of antiquities on maps: Past, present and future: The current and future role of the Royal Commissions as suppliers of heritage data to the Ordnance Survey. In Archaeology in the Age of the Internet. CAA97. Computer Applications and Quantitative Methods in Archaeology; Dingwall, L., Exon, S., Gaffney, V., Laflin, S., van Leusen, M., Eds.; BAR International Series 750; Archaeopress: Oxford, UK, 1999; pp. 235–239. ISBN 0860549453. [Google Scholar]
- Seymour, W.A. A History of the Ordnance Survey; Dawson: Folkestone, UK, 1980; ISBN 9780712909792. [Google Scholar]
- Godwin-Austin, A. The Conference of Empire Surveyors. Geogr. J. 1928, 72, 449–453. Available online: https://www.jstor.org/stable/1783349 (accessed on 9 November 2018).
- Evans, C.J.; Brittain, M.; Cessford, C. Inlands and Hinterlands: The Archaeology of North West Cambridge; CAU New Archaeologies of the Cambridge Region Series; McDonald Institute: Cambridge, UK; Volume IV, in preparation.
- Crawford, O.G.S. Primitive English land-marks and maps. Emp. Surv. Rev. 1931, 1, 3–12. [Google Scholar]
- Survey Review. Empire Conference of Survey Officers 1928. Surv. Rev. 2006, 38, 434–435. [Google Scholar] [CrossRef]
- Joshi, J.P.; Bala, M.; Ram, J. The Indus Civilisation: A reconsideration on the basis of distribution maps. In Frontiers of the Indus Civilisation: Sir Mortimer Wheeler Commemoration Volume; Lal, B.B., Gupta, S.P., Eds.; Books & Books: Delhi, India, 1984; pp. 511–530. ISBN 9780856722318. [Google Scholar]
- Possehl, G.L. Indus Age: The Beginnings; U Penn Museum: Philadelphia, PA, USA, 1999; ISBN 978-0812234176. [Google Scholar]
- Kumar, M. Harappan settlements in the Ghaggar-Yamuna divide. In Linguistics. Archaeology and the Human Past; Indus Project, Research Institute for Humanity and Nature: Kyoto, Japan, 2009; Volume 7, pp. 1–75. ISBN 9784902325423. [Google Scholar]
- Green, A.S.; Petrie, C.A. Landscapes of urbanisation and de-urbanization: Integrating site location datasets from northwest India to investigate changes in the Indus Civilization’s settlement distribution. J. Field Archaeol. 2018, 43, 284–299. [Google Scholar] [CrossRef]
- Possehl, G.L. A short history of archaeological discovery at Harappa. In Harappa Excavations 1986–1990: A Multi-Disciplinary Approach to Third Millennium Urbanism; Meadow, R.H., Ed.; Monographs in World Archaeology No. 3; Prehistory Press: Madison, WI, USA, 1996; pp. 5–11. ISBN 9780962911019. [Google Scholar]
- Cunningham, A. Report for the Year 1872–73; Archaeological Survey of India Reports; Archaeological Survey of India: Calcutta, India, 1875; Volume V. [Google Scholar]
- Gazetteer of Attock District 1930; Punjab District Gazetteers: Lahore, Pakistan, 1932.
- ArcGIS Desktop, Fundamentals of Georeferencing A Raster Dataset. Available online: http://desktop.arcgis.com/en/arcmap/latest/manage-data/raster-and-images/fundamentals-for-georeferencing-a-raster-dataset.htm (accessed on 9 November 2018).
- Petrie, C.A.; Singh, R.N.; Bates, J.; Dixit, Y.; French, C.A.I.; Hodell, D.; Jones, P.J.; Lancelotti, C.; Lynam, F.; Neogi, S.; et al. Adaptation to variable environments, resilience to climate change: Investigating Land, Water and Settlement in northwest India. Curr. Anthropol. 2017, 58, 1–30. Available online: http://www.journals.uchicago.edu/doi/full/10.1086/690112 (accessed on 9 November 2018). [CrossRef]
- Singh, R.N.; Petrie, C.A.; Pawar, V.; Pandey, A.K.; Neogi, S.; Singh, M.; Singh, A.K.; Parikh, D.; Lancelotti, C. Changing patterns of settlement in the rise and fall of Harappan urbanism: Preliminary report on the Rakhigarhi Hinterland Survey 2009. Man Environ. 2010, 35, 37–53. [Google Scholar]
- Singh, R.N.; Petrie, C.A.; Pawar, V.; Pandey, A.K.; Parikh, D. New insights into settlement along the Ghaggar and its hinterland: A preliminary report on the Ghaggar Hinterland Survey 2010. Man Environ. 2011, 36, 89–106. [Google Scholar]
- Singh, R.N.; Green, A.S.; Green, L.M.; Ranjan, A.; Alam, A.; Petrie, C.A. Between the Hinterlands: Preliminary Results from the TwoRains Survey in Northwest India 2017. Man Environ. 2018, in press. [Google Scholar]
- Singh, R.N.; Green, A.S.; Alam, A.; Petrie, C.A. Beyond the Hinterlands: Preliminary Results from the TwoRains Survey in Northwest India 2018. Man Environ. 2019, in press. [Google Scholar]
- Green, A.S.; Singh, R.N.; Alam, A.; Garcia, A.; Green, L.M.; Conesa, F.; Orengo, H.A.; Ranjan, A.; Petrie, C.A. Re-discovering dynamic ancient landscapes: Archaeological survey of features from historical maps in northwest India and their implications for the large-scale distribution of settlements throughout South Asia. Remote Sens. in preparation.
- Walker, J.R. Human-Environment Interactions in the Indus Civilisation: Reassessing the Role of Rivers, Rain and Climate Change in northwest India. Ph.D. Thesis, Department of Archaeology, University of Cambridge, Cambridge, UK. in preparation.
- Garcia, A.; Orengo, H.A.; Conesa, F.C.; Green, A.S.; Petrie, C.A. Remote Sensing and historical morphodynamics of alluvial plains: The 1909 Indus flood and the city of Dera Ghazi Khan (Province of Punjab, Pakistan). Geosciences 2018, 9, in press. [Google Scholar]
- Orengo, H.A.; Petrie, C.A. Multi-Scale Relief Model (MSRM): A new algorithm for the analysis of subtle topographic change in digital elevation models. Earth Surf. Process. Landf. 2018, 43, 1361–1369. [Google Scholar] [CrossRef] [PubMed]
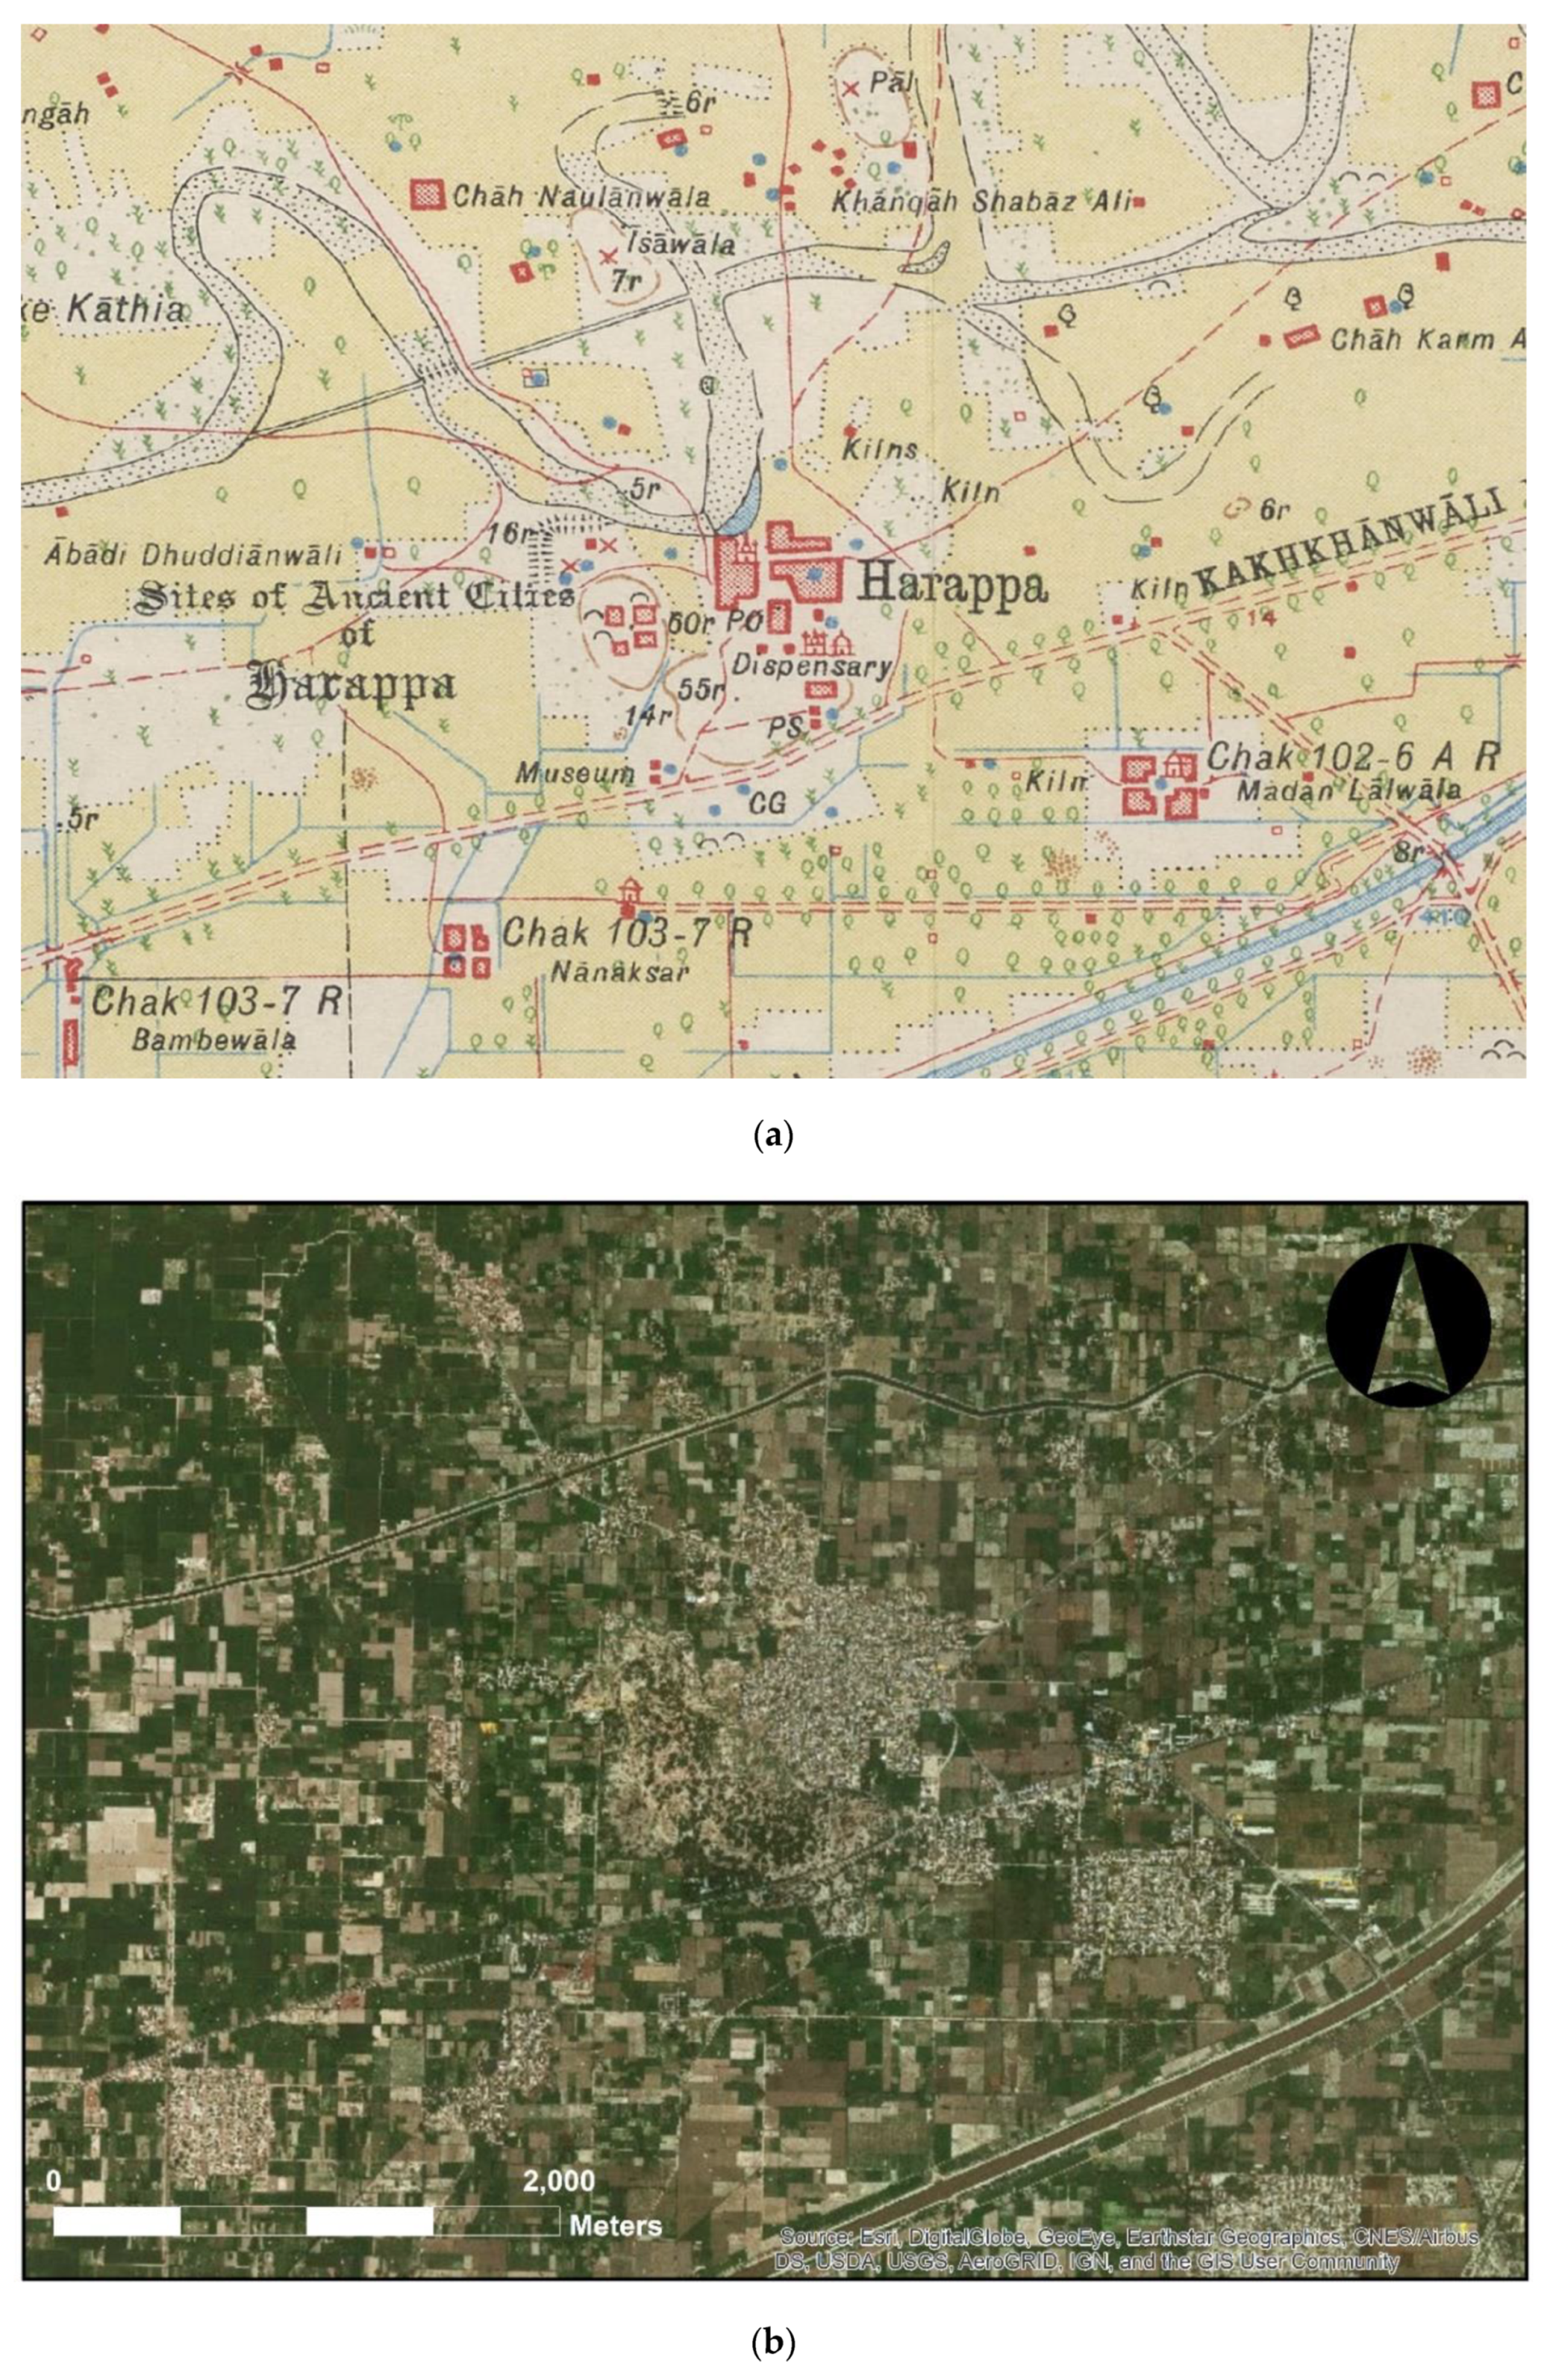
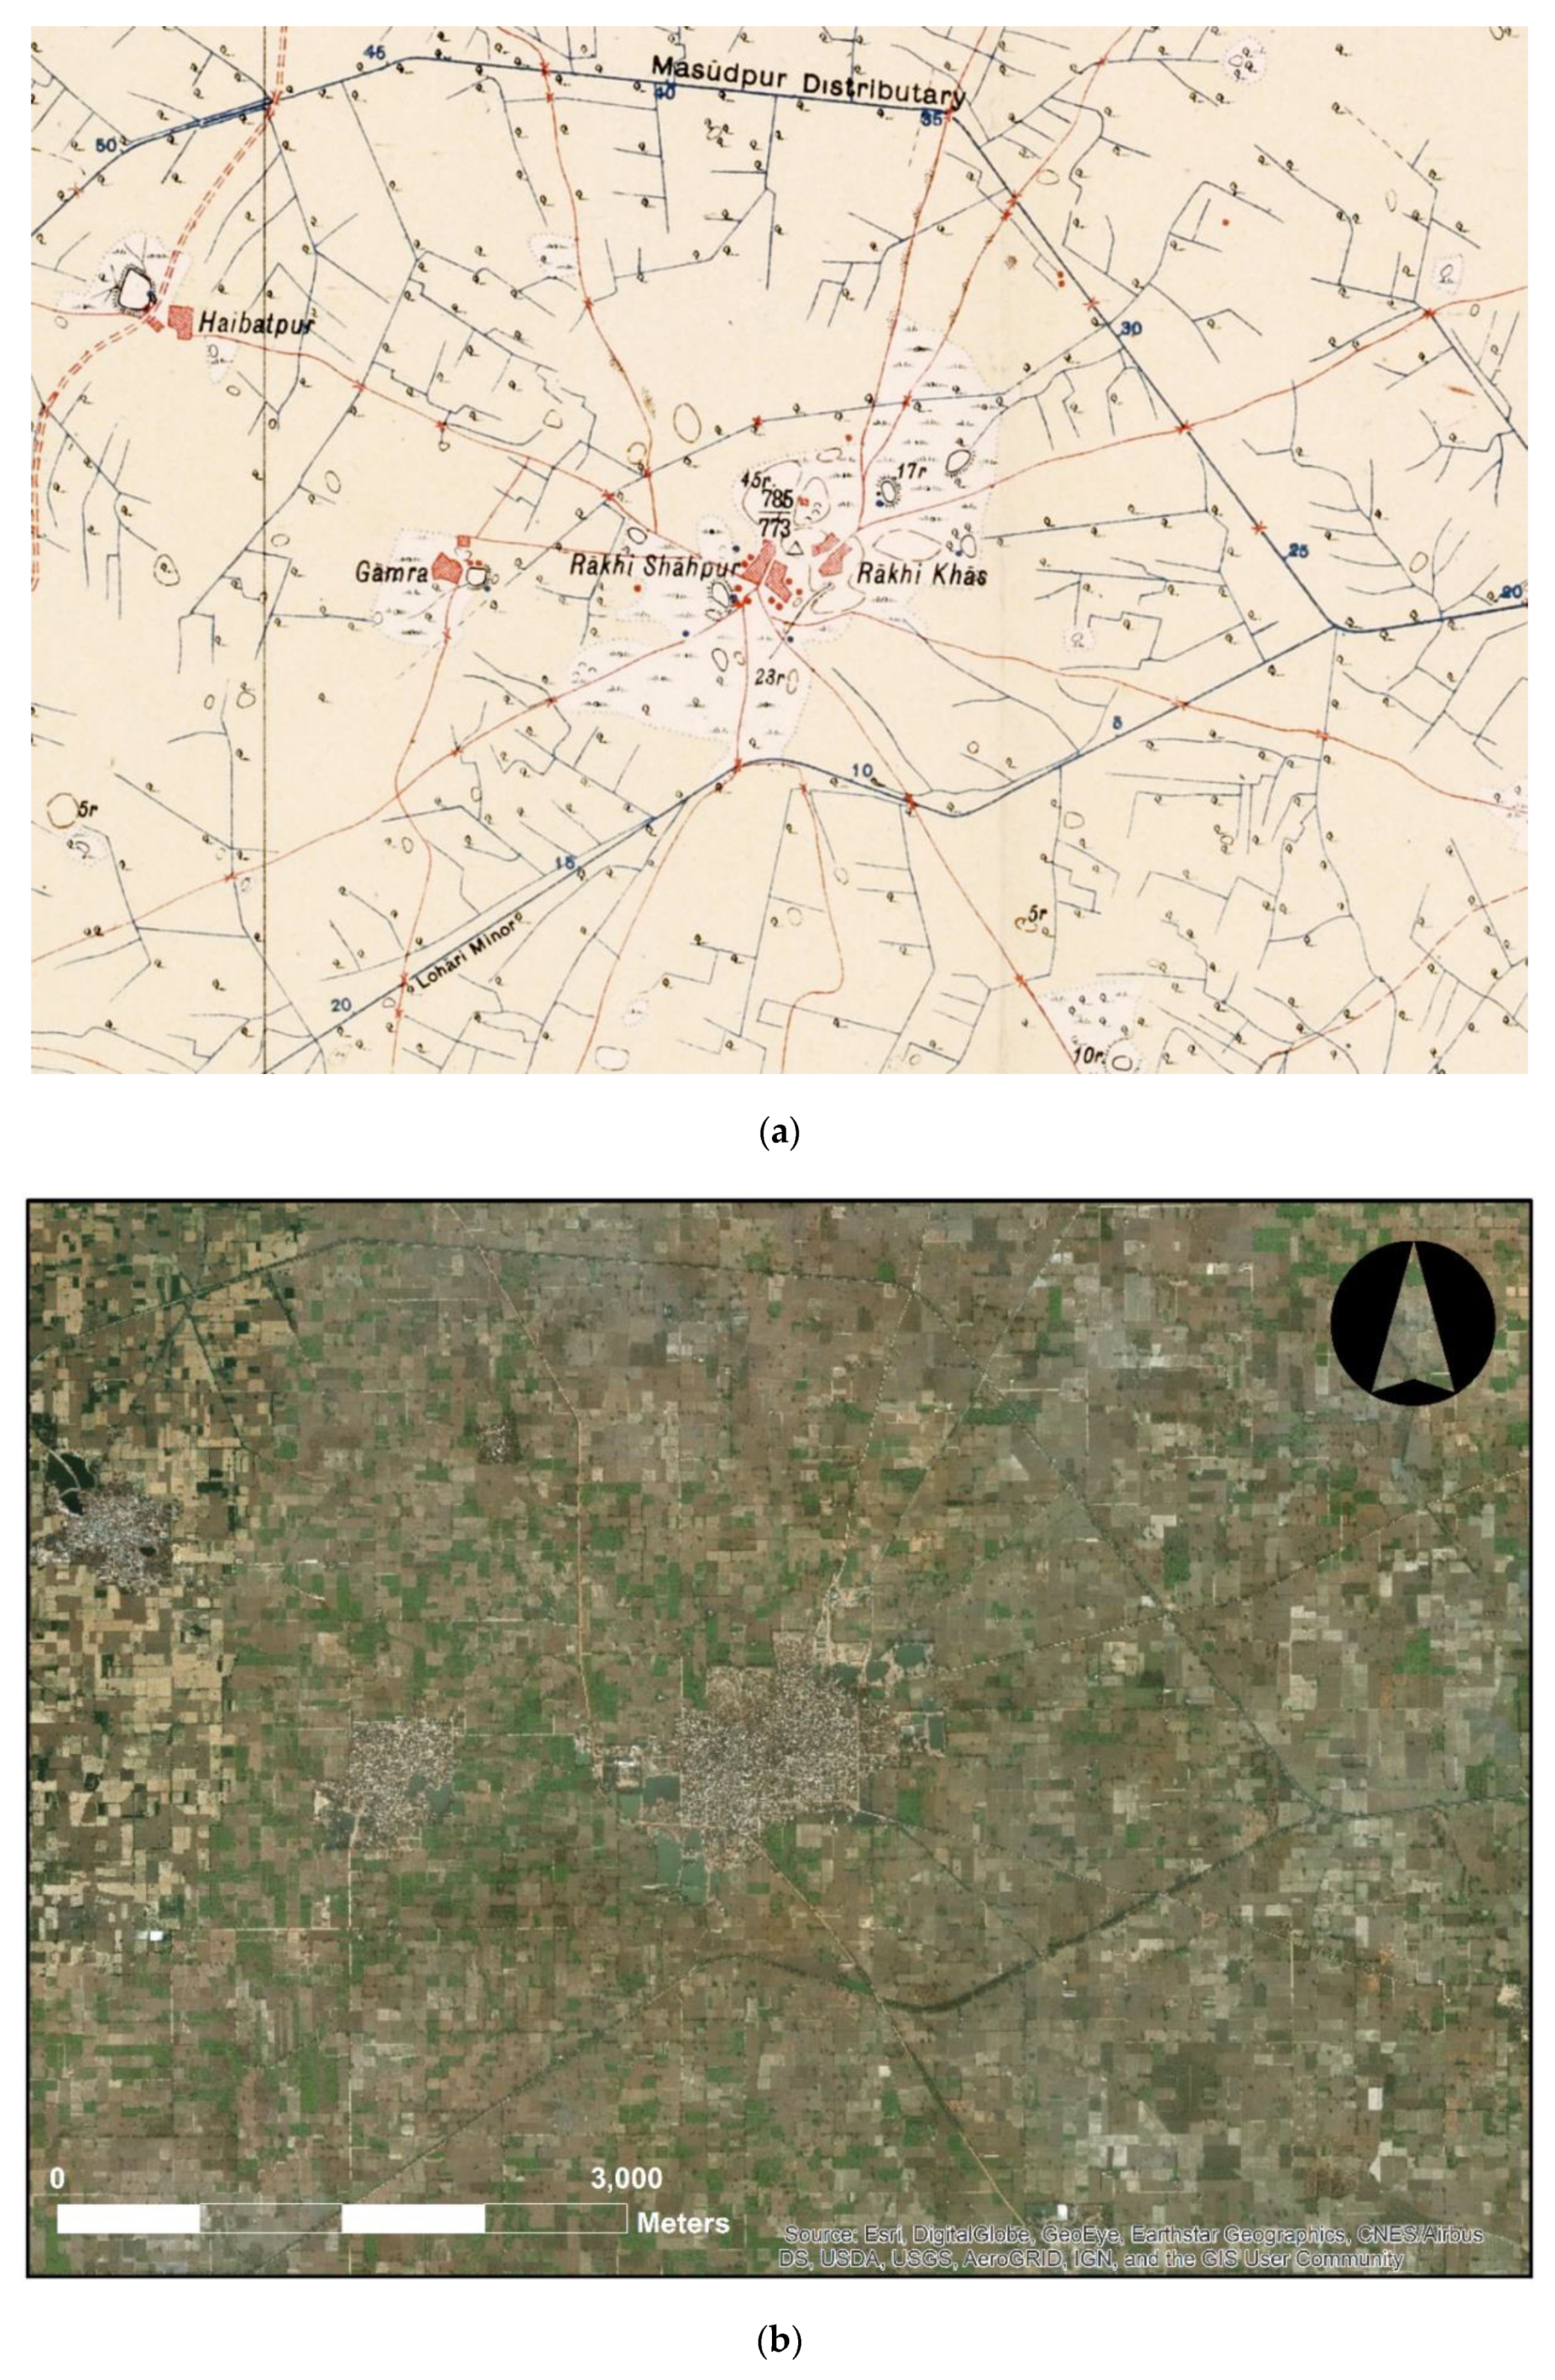
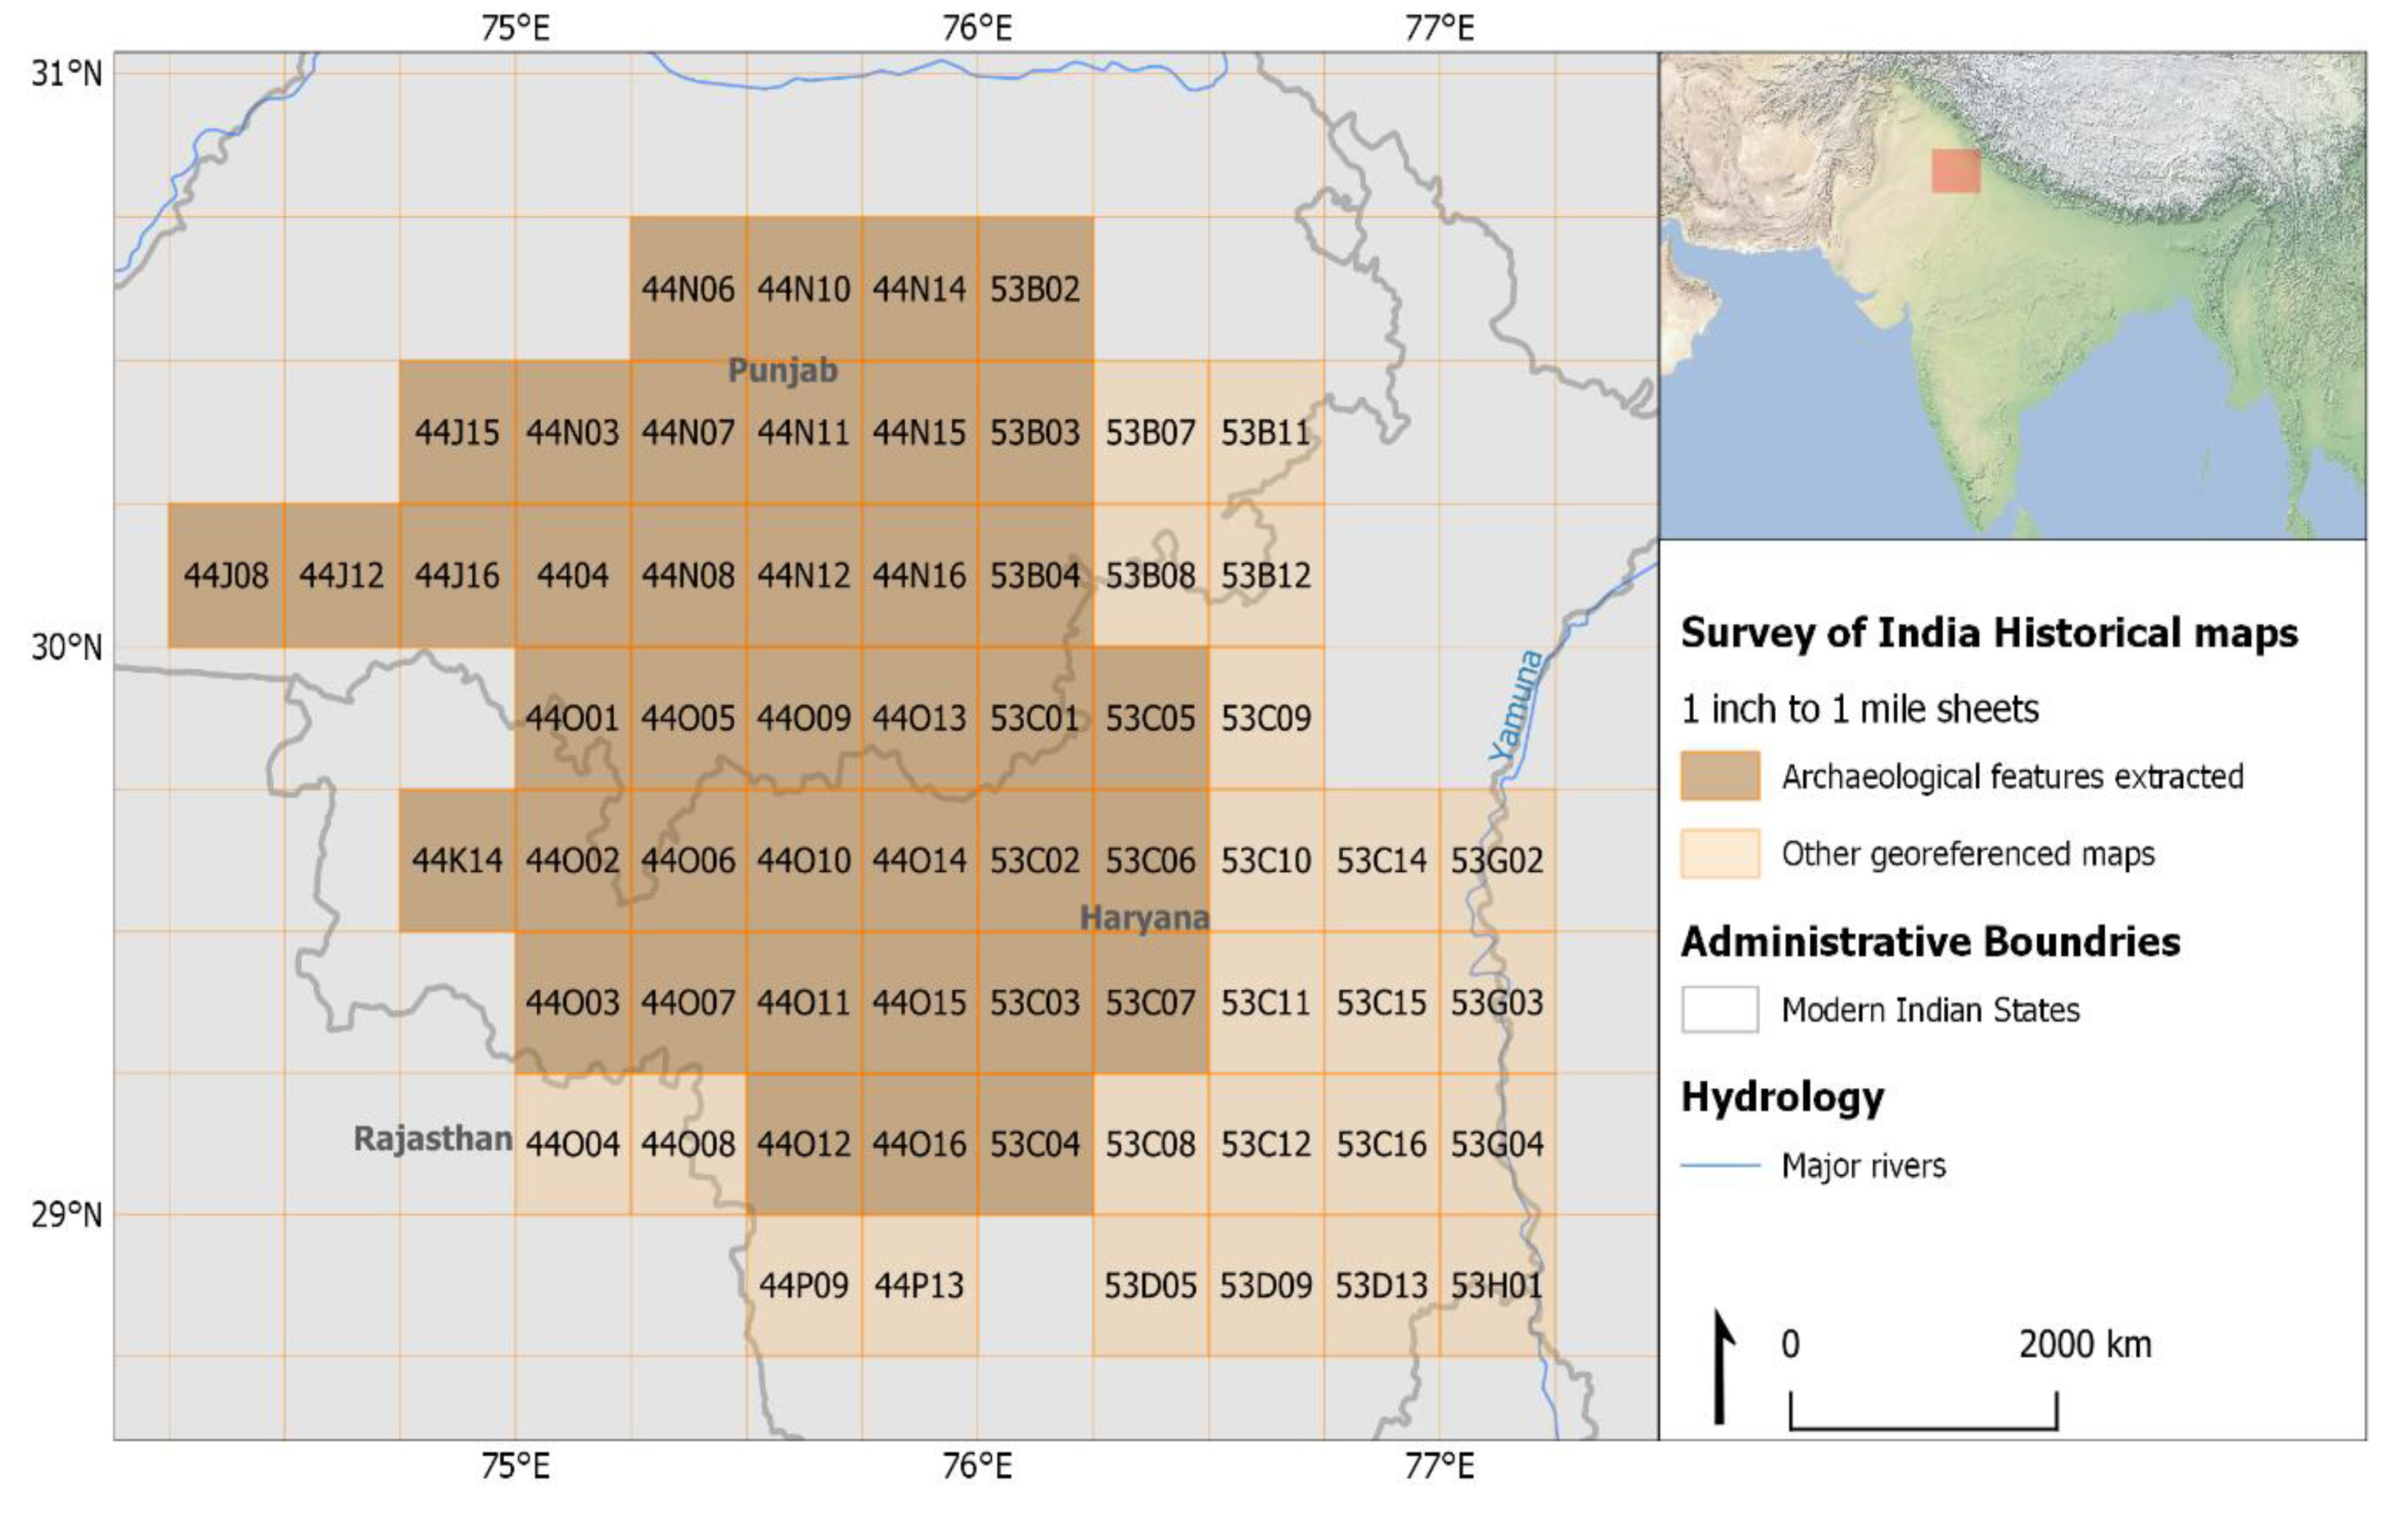
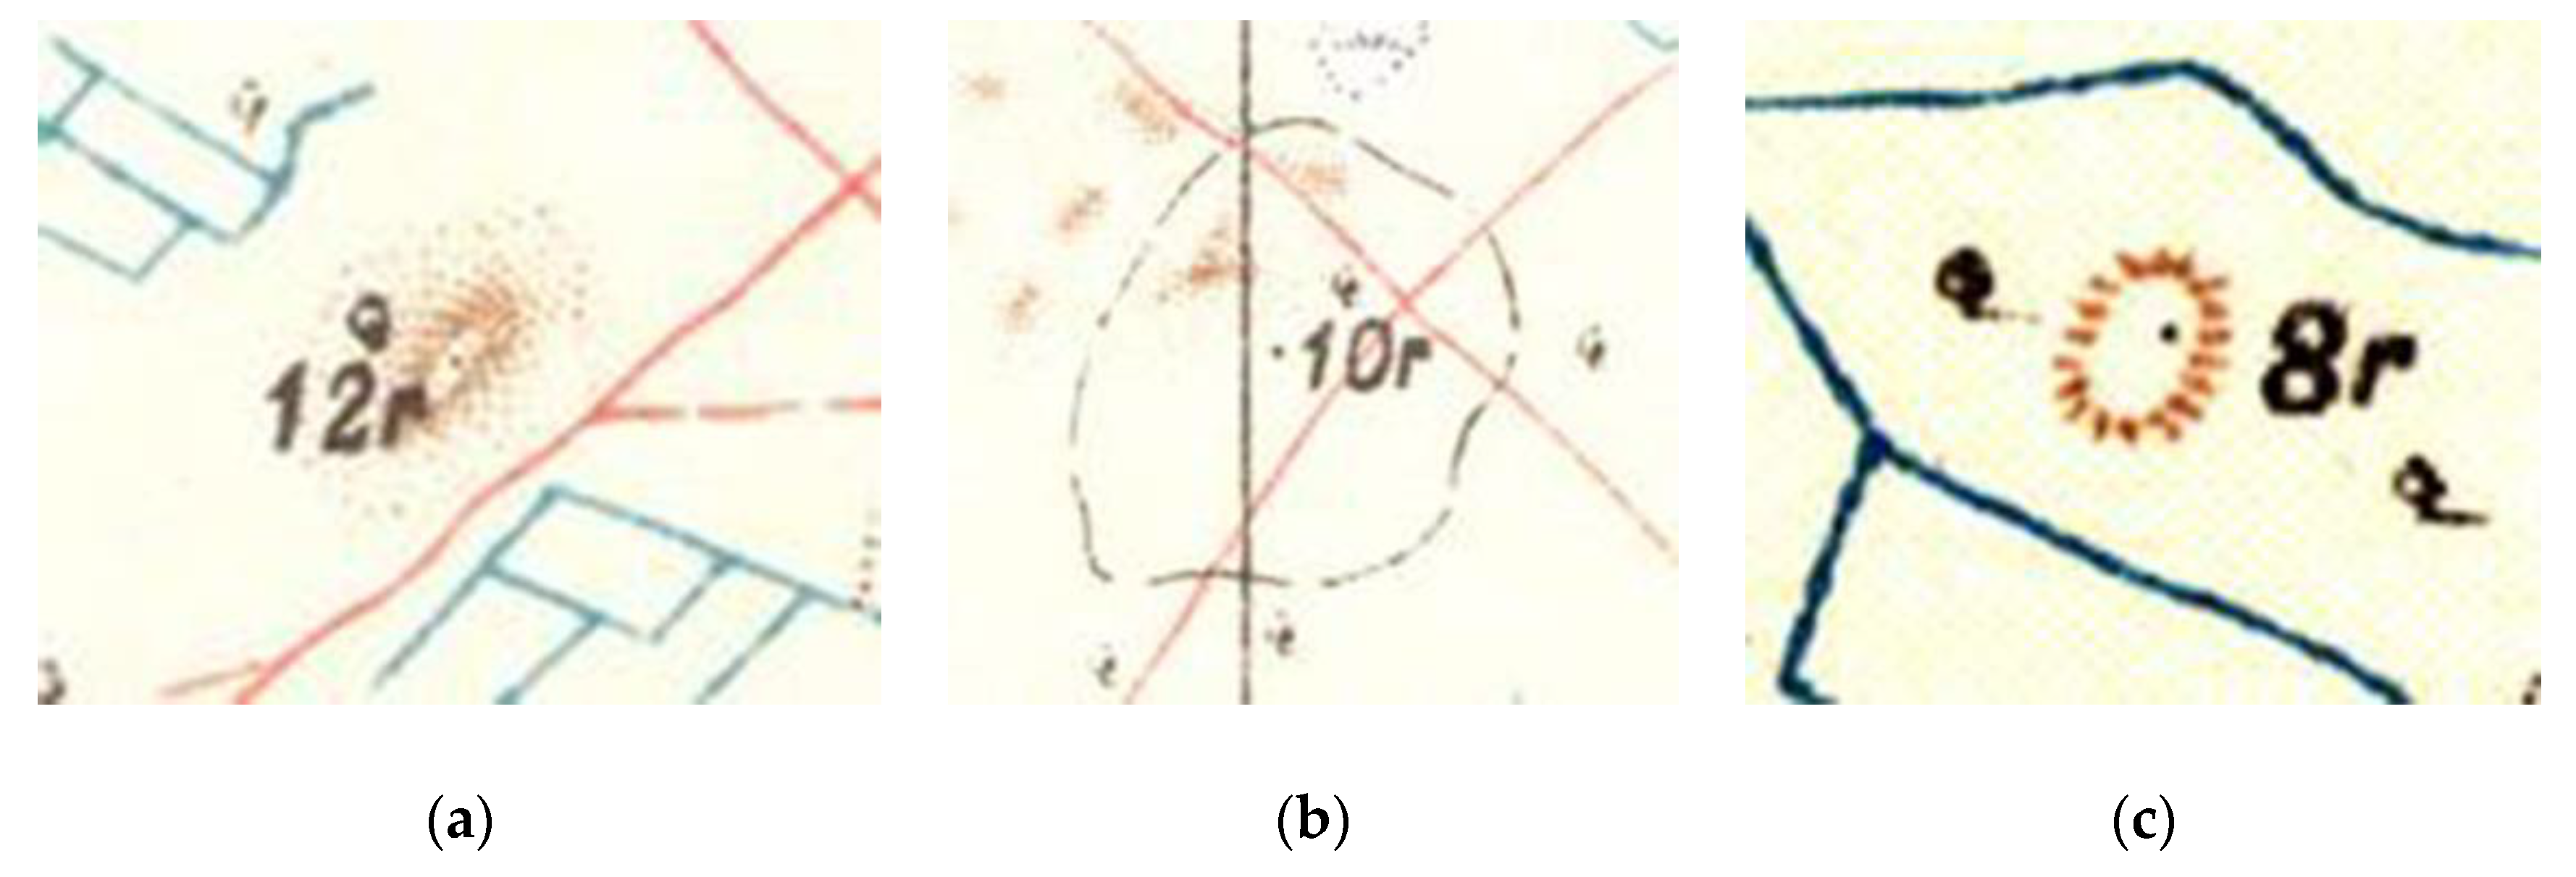


| Map | Number of GCPs | Second Order Polynomial | Adjust Transformation | Mound Features Identified |
|---|---|---|---|---|
| 44J8 (1914) | 26 | 0.000311 | 0.000194 | ✓ |
| 44J12 (1914) | 22 | 0.000498 | 0.000218 | ✓ |
| 44J15 (1914) | 29 | 0.000311 | 0.000109 | ✓ |
| 44J16 (1914) | 28 | 0.000501 | 0.000165 | ✓ |
| 44K14 (1915) | 26 | 0.000463 | 0.000051 | ✓ |
| 44N3 (1913) | 22 | 0.000430 | 0.000215 | ✓ |
| 44N4 (1913) | 22 | 0.000354 | 0.000151 | ✓ |
| 44N6 (1913) | 18 | 0.000469 | 0.0000927 | ✓ |
| 44N7 (1914) | 18 | 0.000616 | 0.000201 | ✓ |
| 44N8 (1913) | 19 | 0.000442 | 0.000244 | ✓ |
| 44N10 (1913) | 21 | 0.000500 | 0.000139 | ✓ |
| 44N11 (1913) | 19 | 0.000503 | 0.000141 | ✓ |
| 44N12 (1913) | 20 | 0.000641 | 0.000175 | ✓ |
| 44N14 (1913) | 17 | 0.00063 | 0.00021 | ✓ |
| 44N15 (1913) | 25 | 0.000375 | 0.00015 | ✓ |
| 44N16(1913) | 20 | 0.000504 | 0.000171 | ✓ |
| 44O1 (1913) | 27 | 0.000299 | 0.000166 | ✓ |
| 44O2 (1915) | 39 | 0.000472 | 0.000148 | ✓ |
| 44O3 (1915) | 34 | 0.000421 | 0.0000401 | ✓ |
| 44O4 (1916) | 31 | 0.000406 | 0.000147 | |
| 44O5 (1915) | 40 | 0.000636 | 0.000181 | ✓ |
| 44O6 (1915) | 38 | 0.000447 | 0.000113 | ✓ |
| 44O7 (1915) | 40 | 0.000354 | 0.000130 | ✓ |
| 44O8 (1916) | 31 | 0.000514 | 0.000151 | |
| 44O9 (1915) | 31 | 0.000514 | 0.000151 | ✓ |
| 44O10 (1913-14) | 30 | 0.000361 | 0.0000978 | ✓ |
| 44O11 (1913-14) | 30 | 0.000393 | 0.00016 | ✓ |
| 44O12 (1915) | 34 | 0.000636 | 0.000219 | ✓ |
| 44O13 (1913-14) | 34 | 0.000565 | 0.000122 | ✓ |
| 44O14 (1913-14) | 34 | 0.000470 | 0.0000497 | ✓ |
| 44O15 (1913-14) | 34 | 0.000503 | 0.0000944 | ✓ |
| 44O16 (1915) | 33 | 0.000537 | 0.000147 | ✓ |
| 44P9 (1917) | 26 | 0.000416 | 0.0000210 | |
| 44P13 (1912) | 28 | 0.000333 | 0.0000886 | |
| 53B2 (1914) | 24 | 0.000325 | 0.000049 | ✓ |
| 53B3 (1914) | 22 | 0.000382 | 0.000115 | ✓ |
| 53B4 (1914) | 19 | 0.000531 | 0.000244 | ✓ |
| 53B7 (1914) | 34 | 0.000485 | 0.000108 | |
| 53B8 (1914) | 20 | 0.00078 | 0.00022 | |
| 53B11 (1914) | 32 | 0.000159 | 0.000382 | |
| 53B12 (1914) | 31 | 0.000425 | 0 | |
| 53C1 (1912-13) | 34 | 0.000532 | 0.000109 | ✓ |
| 53C2 (1912-13) | 36 | 0.000493 | 0.0000907 | ✓ |
| 53C3 (1915) | 36 | 0.000502 | 0.000201 | ✓ |
| 53C4 (1937) | 34 | 0.000349 | 0.000119 | ✓ |
| 53C6 (1914-15) | 33 | 0.000350 | 0.0000607 | ✓ |
| 53C7 (1915) | 36 | 0.00058 | 0.000127 | ✓ |
| 53C8 (1937) | 28 | 0.000302 | 0.0000676 | |
| 53C9 (1914) | 26 | 0.000382 | 0.0000610 | |
| 53C10 (1914) | 40 | 0.000420 | 0 | |
| 53C11 (1914) | 32 | 0.000382 | 0.000159 | |
| 53C11 (1915) | 31 | 0.000559 | 0.000106 | |
| 53C12 (1937) | 29 | 0.000303 | 0 | |
| 53C14 (1914) | 32 | 0.000482 | 0.000180 | |
| 53C15 (1915) | 37 | 0.000500 | 0 | |
| 53C16 (1937) | 37 | 0.000279 | 0 | |
| 53D5 (1937) | 30 | 0.000208 | 0.0000327 | |
| 53D9 (1936) | 35 | 0.000183 | 0.0000260 | |
| 53D13 (1936) | 34 | 0.000141 | 0.0000283 | |
| 53C5 (1914) | 32 | 0.00045 | 0.0000116 | ✓ |
| 53G2 (1915) | 27 | 0.000355 | 0.000111 | |
| 53G3 (1915) | 26 | 0.000421 | 0.000137 | |
| 53G4 (1937) | 34 | 0.000403 | 0.0000776 | |
| 53H1 (1937) | 33 | 0.000299 | 0.000202 |
| Type | Total | Size 1 | Size 2 | Size 3 |
|---|---|---|---|---|
| Shaded | 3143 | 2792 | 291 | 57 |
| Form-line | 2056 | 1545 | 405 | 102 |
| Hachure | 3699 | 3596 | 90 | 1 |
| Combined | 32 | 7 | 17 | 8 |
© 2018 by the authors. Licensee MDPI, Basel, Switzerland. This article is an open access article distributed under the terms and conditions of the Creative Commons Attribution (CC BY) license (http://creativecommons.org/licenses/by/4.0/).
Share and Cite
Petrie, C.A.; Orengo, H.A.; Green, A.S.; Walker, J.R.; Garcia, A.; Conesa, F.; Knox, J.R.; Singh, R.N. Mapping Archaeology While Mapping an Empire: Using Historical Maps to Reconstruct Ancient Settlement Landscapes in Modern India and Pakistan. Geosciences 2019, 9, 11. https://doi.org/10.3390/geosciences9010011
Petrie CA, Orengo HA, Green AS, Walker JR, Garcia A, Conesa F, Knox JR, Singh RN. Mapping Archaeology While Mapping an Empire: Using Historical Maps to Reconstruct Ancient Settlement Landscapes in Modern India and Pakistan. Geosciences. 2019; 9(1):11. https://doi.org/10.3390/geosciences9010011
Chicago/Turabian StylePetrie, Cameron A., Hector A. Orengo, Adam S. Green, Joanna R. Walker, Arnau Garcia, Francesc Conesa, J. Robert Knox, and Ravindra N. Singh. 2019. "Mapping Archaeology While Mapping an Empire: Using Historical Maps to Reconstruct Ancient Settlement Landscapes in Modern India and Pakistan" Geosciences 9, no. 1: 11. https://doi.org/10.3390/geosciences9010011
APA StylePetrie, C. A., Orengo, H. A., Green, A. S., Walker, J. R., Garcia, A., Conesa, F., Knox, J. R., & Singh, R. N. (2019). Mapping Archaeology While Mapping an Empire: Using Historical Maps to Reconstruct Ancient Settlement Landscapes in Modern India and Pakistan. Geosciences, 9(1), 11. https://doi.org/10.3390/geosciences9010011


