Article

The Influence of Crude Oil on Mechanistic Detachment Rate Parameters

by
Manar B. Hasan
1 and
Abdul-Sahib T. Al-Madhhachi
2,*
1
Department of Environmental Engineering, College of Engineering, Mustansiriyah University, Bab Al Muadham, Baghdad 10047, Iraq
2
Department of Water Resources Engineering, College of Engineering, Mustansiriyah University, Bab Al Muadham, Baghdad 10047, Iraq
*
Author to whom correspondence should be addressed.
Geosciences 2018, 8(9), 332; https://doi.org/10.3390/geosciences8090332
Submission received: 18 July 2018 / Revised: 23 August 2018 / Accepted: 25 August 2018 / Published: 4 September 2018
(This article belongs to the Special Issue Soil Hydrology and Erosion)

Abstract

:
Iraqi soil contamination greatly influenced soil detachment. Previous researchers have not been able to predict the influence of crude oil soil contamination on either the mechanistic dimensional detachment parameter b0 or the threshold parameter b1 of the mechanistic detachment model (Wilson model). The aims of this research were (1) to investigate the influence of crude oil on deriving Wilson model parameters, b0 and b1, with two setups at different scales and different soil moisture contents and (2) to predict b0 and b1 in crude oil contaminated dry soils with varying levels of contamination. The “mini” JET apparatus was implemented under laboratory conditions for soil specimens packed at both a small (standard mold) and a large (in-situ soil box) scale. The results showed an inverse correlation between b0 and water content for clean soil. No correlation between b0 and soil moisture content was observed for contaminated soils. There was a huge reduction in the b0 value as the contamination time increased compared to the clean soil. This was related to the role crude oil plays in soil stabilization. Crude oil contamination significantly increased lead contamination level while slightly increasing the pH and total organic carbon. The influence of crude oil on mechanistic soil detachment can be predicted with a priori JET experiments on soils without crude oil based on crude oil parameters.

1. Introduction

Estimating soil erodibility is a major challenge in water resource engineering due to the significant influence erosion has on water resource management. Several techniques have been developed to quantify soil erodibility both in the field and laboratory, highlighting the importance of quantifying soil erodibility [1,2,3,4,5]. The erodibility of polluted soils is a subject that has recently gained popularity with several researchers Abbas et al. [6], Al-Madhhachi and Hasan [7], Mutter et al. [8], Salah and Al-Madhhachi [9], and Shayannejad et al. [10] due to significant influence pollutants have on soil characteristics, the soil environment, and soil erodibility parameters. One of these pollutants is crude oil, recently investigated by Al-Madhhachi and Hasan [7].
The process of refining oil is the chief industry in Iraq, resulting in an incremental increase in environmental pollution by crude oil. Soil in Iraq is contaminated with crude oil because of continued accidental spillages and leakages. On average, 290 traffic accidents per year take place involving oil transport tankers on the Jordan Badia desert highway in Iraq [11]. Crude oil contamination occurs both naturally and accidentally. Accidental leakages or spills originate from storage tanks, transport pipelines, transport tankers, and ships. In Iraq, terror attacks on crude-oil-conveying pipelines and oil fields massively contribute to crude oil contamination [7]. This type of environmental contamination can adversely affect the landscape. Crude oil spillage has also resulted in increased levels of heavy metals in the soils surrounding oil refineries [12,13]. Salah and Al-Madhhachi [9] highlight the correlation between soil contamination by heavy metals and soil detachment. Therefore, investigation into the influence of crude oil spillage on soil erosion would be of great benefit. In addition, continuous reports of crude oil spills in Iraq have led to both soil and riverbank contamination. For example, on 16 April 2014, a bomb exploded under an oil pipeline near the Beiji city, northern Iraq, causing large quantities of crude oil to spill into the Tigris River [14]. This type of contamination could influence streambank erodibility through fluvial erosion.
Khanal et al. [5] and Al-Madhhachi [15] highlight the importance of predicting soil erodibility to quantify sediment loads. A variety of laboratory processes have been used to compute soil erodibility parameters such as flumes [3] and a Jet Erosion Test (JET) [16,17,18,19,20]. Empirical models can be used in the prediction of soil detachment. Such models include excess shear stress model, the bed bulk density model, and the turbulent burst erosion model. Cleaver and Yates [21] and Nearing [22] offered a turbulent burst erosion model to predict the erodibility of aggregates from the bed surface. The turbulent burst erosion model was proposed by Sharif and Atkinson [23] to develop a correlation for the distribution of aggregate size, as a function of the concept of self-similar growth of aggregates and bed-bulk density. The excess shear stress model is widely employed for estimating soil detachment. It is dependent upon two empirical soil parameters: the erodibility coefficient (kd, m3/N-s) and critical shear stress (τc, Pa), as well as the hydraulic shear stress (τ, Pa). Al-Madhhachi and Hasan [7] investigated the influence of crude oil contamination on the erodibility parameters, kd and τc, at three different scales. They found a statistical difference in kd and τc between polluted and unpolluted soil samples under dry soil conditions. However, no mechanistic anticipation can be provided by the excess shear stress model in the prediction of two soil parameters for any particular hydraulic setting, soil property, or additional pollutants such as crude oil. The mechanistic model is beneficial because it is able to mathematically predict soil erodibility due to pollutants (such as crude oil) without re-running JET experiments on polluted soils [24,25]. This study adopted mechanistic detachment parameters to predict contaminated soil erodibility by crude oil to overcome the difficulty in performing JET experiments in the field on soils or riverbanks contaminated with crude oil and affected by fluvial erosion.
Wilson [26,27] developed a non-linear mechanistic detachment model to examine the influence of soil and fluid features on the soil detachment rate. The Wilson model is based on two mechanistic soil parameters, b0, the dimensional detachment parameter of the erosion model, and b1, the dimensional threshold parameter of the erosion model. This mechanistic model can be applied to soil aggregates and is not limited to a single particle. This model can incorporate the effect of several factors, such as the orientation of soil materials, turbulence, seepage forces, roughness, and root effects [17,24,25,28]. The Wilson model can predict the detachment rate for both cohesive and non-cohesive soils, based on two mechanistic soil parameters, b0 and b1 [17,29,30]. Al-Madhhachi et al. [17] developed mathematical analysis techniques for the Wilson model parameters (b0 and b1) for two different cohesive soils using both flume and JET data. The flume experiments and JETs resulted in statistically equivalent derived values of mechanistic detachment parameters. Criswell et al. [29,30] utilized flume experiments to analyse soil detachment using the Wilson model and compare it to excess shear stress model on non-cohesive gravel to derive erodibility parameters. They observed a similar relationship between the Wilson model parameters (b0 and b1) with different amounts of kd and τc. They also found that the fluvial erosion modelling of non-cohesive gravel was applicable to and dependent on the kd-τc correlation. Criswell et al. [29,30] emphasised the need for awareness when calibrating the Wilson model to avoid unrealistic data beyond the range of the functional shear in the experiment.
Al-Madhhachi et al. [24] modified the Wilson model parameters by incorporating the impact of the seepage force on the soil detachment rates of cohesive soil. Al-Madhhachi et al. [24] observed a great, but non-uniform, impact of seepage force has on the derived Wilson parameters derived from both flume experiments and JETs. Al-Madhhachi et al. [25] combined seepage forces into the Wilson model parameters, b0 and b1, to predict the erodibility of cohesive streambanks. They utilized laboratory “mini” JET apparatus and a seepage column to determine b0 and b1 for two different soils. The experimental arrangement was designed to imitate a streambed and a streambank when the JET device was placed vertically and horizontally, respectively. Similar to the study proposed by Al-Madhhachi et al. [24], seepage forces had a great impact on the Wilson model parameters for streambeds and streambanks [25].
Khanal et al. [5] examined the influence of the pressure head setting and time interval on the erodibility parameters of the nonlinear detachment model. They noticed a reduction in the value of b0 at a longer time interval, with a head setting of 46 cm and 190 cm for both clay loam and sandy loam soils, while the value of b1 declined at longer time intervals (at only 190 cm for clay loam soil). They highlighted the correlation between the head settings and time intervals and recommended a minimum initial time interval of 0.5 min at a high-pressure head. Khanal and Fox [28] conducted several JET experiments on bare and root-permeated soil samples to examine the influence of vegetation on soil detachment. They also predicted detachment parameters for both the linear model (kd and τc) and the non-linear model (b0 and b1). They found a significant correlation between the two model parameters. A negative relationship between the erodibility coefficients of the two models and the root diameter was also observed, while no relationship was found between (b1 and τc) and the root diameter.
Salah and Al-Madhhachi [9] and Mutter et al. [8] investigated the impact of soil contamination on soil erodibility. They found that soil contamination increased the soil detachment rate. Salah and Al-Madhhachi [9] observed a reduction in b1 and an increase in b0 as the lead concentration increased. This indicates instability in the contaminated soil compared to the clean soil. Mutter et al. [8] studied the influence of three stabilisers on soil erodibility parameters using “mini” JET. The use of the “mini” JET apparatus can be used to examine soil stability and reduce testing time [8]. Abbas et al. [6] studied the impact of different types of soil contamination by nitrate, phosphate, and phenol on soil erodibility parameters at different contamination times. They observed a reduction in τc values, while the value of kd steadily increased as contamination time and/or contaminant concentration increased. Al-Madhhachi and Hasan [7] investigated the influence of crude oil contamination on erodibility parameters (kd and τc) using three different in-situ scales at three different levels of soil moisture content. They found a statistical difference in kd and τc between polluted and unpolluted soil samples at the dry side of the water content. No statistically significant differences of measured kd and τc were observed across different in-situ scale ratios for polluted and unpolluted soils.
Previous studies have not been able to predict the Wilson model parameters from contaminated soils. In particular, the influence of crude oil contamination on the mechanistic detachment parameters, b0 and b1, is yet to be fully determined. The aims of this research were (1) to investigate the influence of crude oil on deriving Wilson model parameters (b0 and b1) at two different scale setups and at different levels of soil moisture content (dry, optimum, and wet soil moisture contents) and (2) to predict mechanistic detachment parameters, b0 and b1, in crude oil contaminated dry soils with varying levels of contamination, i.e., after 1st, 4th, and 8th day of soil preparations.

2. Materials and Methods

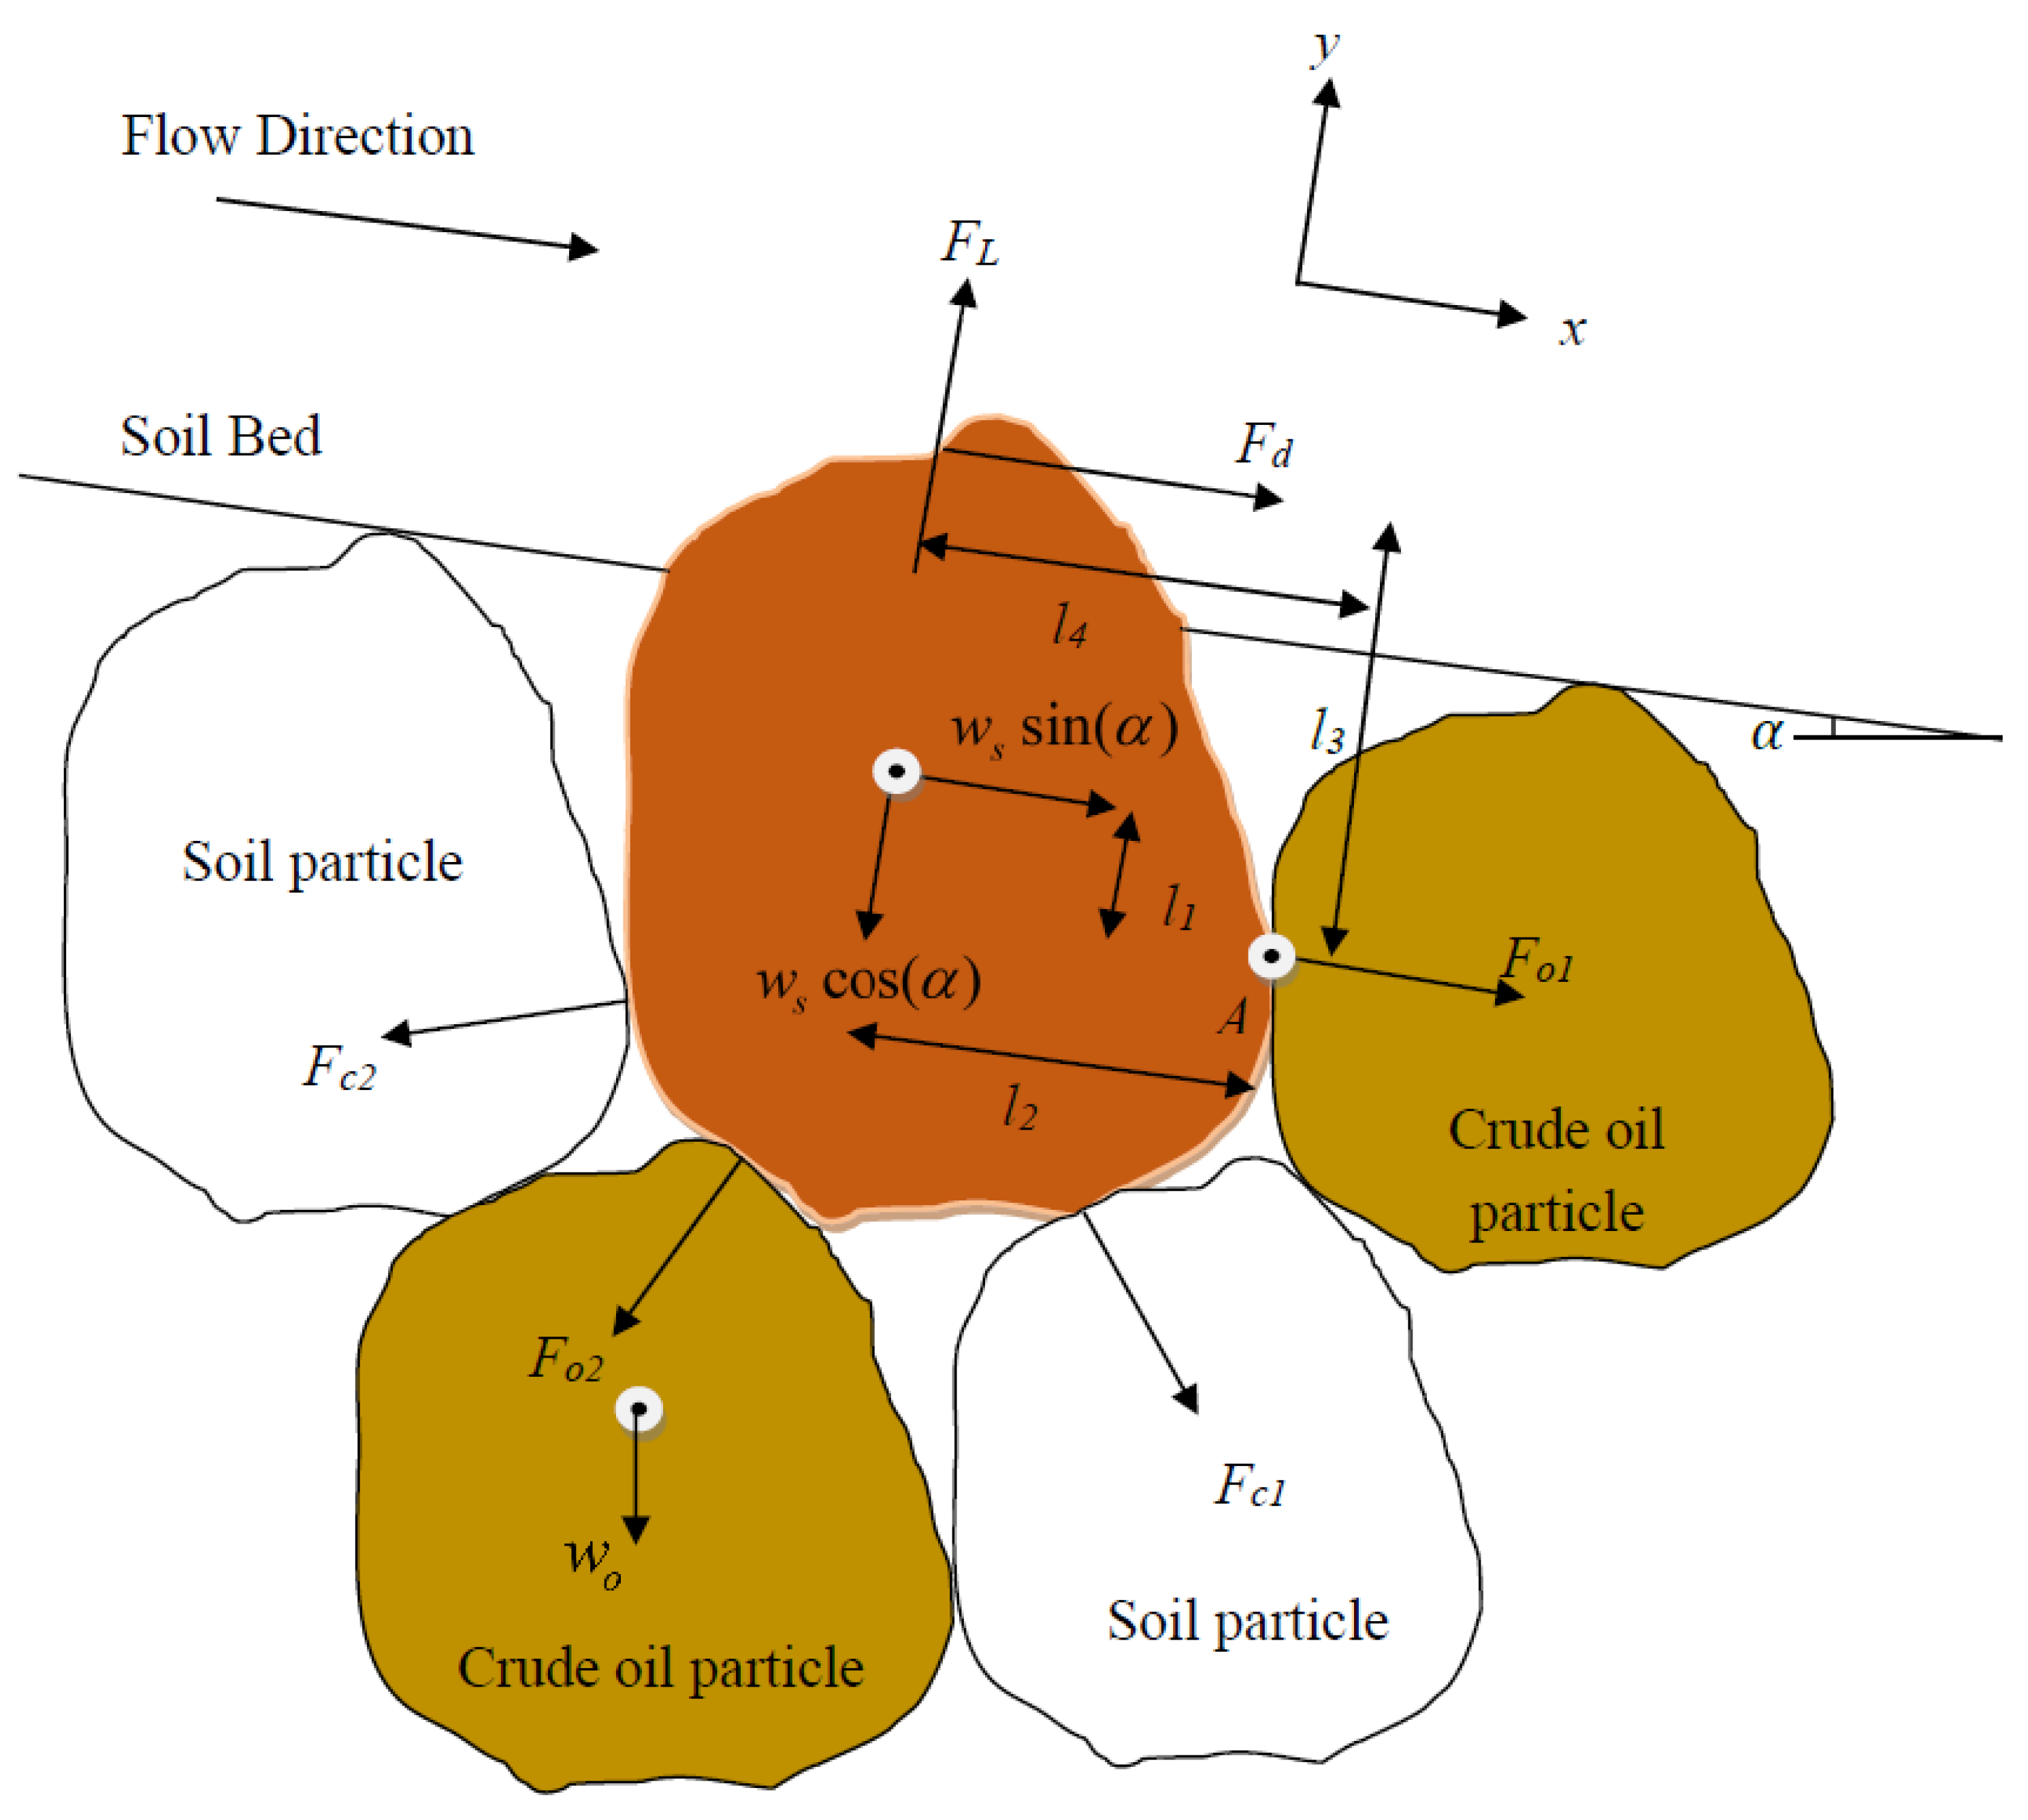
2.1. Mathematical Analysis of Erodibility Parameters in Persence of Crude Oil

Wilson [26] developed a non-linear model to estimate erosion rates, based on stabilizing and removing forces and associated moment lengths for particle displacement. The forces that act to remove soil particles in the presence of crude oil are presented in Figure 1. These forces include the weight of the soil particle ( w s ) , drag force ( F d ) , lift forces ( F L ) , the contact forces between adjacent soil particles ( F c 1 , F c 2 , , F c n ) , and the contact forces between adjacent soil particles and adjacent oil particles ( F o 1 , F o 2 , , F o n ) . Particle detachment takes place if the resisting moment is less than the driving moment [26]. In this study, the Wilson model was modified to include the influence of oil contamination, based on the original framework developed by Wilson [26]. The detachment of soil particles is expected to occur if the drag force is higher than the cohesive force and weight, relative to the moment around point A, and can be defined with the introduction of the terms M c and M c o as the following Equations (1)–(4):
F d ( l 3 ) + F L ( l 4 ) + w s sin ( α ) ( l 1 ) = w s cos ( α ) ( l 2 ) + M c + M c o  
w s = g ( ρ s ρ w ) k v d 3  
M c = i = 1   n c F c i l ¯ i = i = 1 n c σ c i a i l ¯ i
M c o   = i = 1 n c o F c o i l ¯ i = i = 1 n c o σ c o i a i l ¯ i
in which M c refers to the sum of moments of the frictional and cohesive forces, M c o is the sum of moments exerted by the frictional and cohesive forces on oil particles, nc is the number of contact areas for soil particles, nco is the number of contact areas for oil particles, Fci is the contact forces between adjacent soil particles, F c o i is the contact forces between adjacent soil and oil particles, σ c i is the soil particle to particle stress, σ c o i is the oil particle to soil particle stress, a i is the contact area, l ¯ i is the moment length for each contact force, α is the angle slope of channel, k v is the volume constant of a spherical particle, ρ w and ρ s are water and soil particle densities, respectively, and d is the equivalent diameter of a soil particle.
Chepil [31] and Wilson [26] assumed a proportional correlation between ( F d ) and ( F L ) (i.e., K L / K f = F L / F d ), in which Kf is the proportion of the projected area of the F d and F L forces, and KL is the proportion of drag and lift coefficients along with that of the velocities [26]. Consequently, Equation (1) can be modified as the following Equations (5)–(8):
F d = w s ( k l s   + f c + f c o )
K l s   = cos ( α ) ( l 2 l 1 S ) l 3 + l 4 K L K f
f c = M c   w s ( l 3 + l 4 K L K f )
f c o   = M c o w s ( l 3 + l 4 K L K f )
in which Kls is a dimensionless parameter dependent on particle size, its orientation within the slope, and the bed; S   ( = tan α ) is channel slope; fc is a dimensionless parameter based on soil cohesion; and fco is a dimensionless parameter based on soil and oil cohesions. The values of fco were derived and calibrated from tests on contaminated soils.
Adapting the mathematical approach proposed by Wilson [26] and Al-Madhhachi et al. [24,25], the time-averaged net force, Fn, acting in the direction of movement of the oil particles, was modified as the following Equation (9):
F n = K t F ¯ d μ f w s μ o w o  
in which Kt is a factor of the cumulating instantaneous fluid forces, F ¯ d is the time-averaged drag force, μf is the coefficient of friction, μo is the oil coefficient of cohesion between soil and oil particles as proposed in this study, w o = g ( ρ w ρ o ) k v d o 3 is the oil particle submerged weight, do is the oil particle diameter, and ρo is oil density. This study proposed that the oil particle diameter is equivalent to the soil particle diameter (do = d).
Wilson [26] assumed that the particle exchange time, te, was a function of the exit velocity (Ve = Fn te/m), in which m is the particle mass. Incorporating the definition of Ve and Equation (9), the exit velocity in the presence of crude oil can be expressed as the following Equation (10):
V e = [ K t K o k a d 2 τ   ( ρ s ρ w ) k v d 3 μ f g ( ρ s ρ w ) k v d 3 ( ρ s ρ w ) k v d 3 μ o g ( ρ w ρ o ) k v d o 3 ( ρ w ρ o ) k v d o 3 ] t e
in which k a is the area constant of a spherical particle and kr = kv/ka is the geometrical proportion for a spherical particle. Equation (10) can be simplified by introducing the fluid factor Kn = (Kt Ko/kr) and the Shields parameter (τ*) to give as the following Equations (11)–(13):
V e = [ K n τ * μ f μ o ] g t e  
τ * = τ g ( ρ s ρ w ) d  
K o = 5.537 C D K f exp [ 200 ( z d   r ) 2 ] C f c d 2
in which Ko is the velocity JET parameter, as proposed by Al-Madhhachi et al. [17]; CD is the drag coefficient; cd is the diffusion constant of the jet; r is the jet radius; zd is the height that the drag velocity is acting upon in the jet environment; and Cf is the coefficient of friction in the jet environment. In this study, the particle exchange time was predicted by incorporating the oil coefficient as the following Equation (14):
t e = d k d d g d ( K n τ * μ o μ f )   if   [ K n τ * μ o ] > μ f  
A probability framework for turbulent forces was developed by Wilson [26], similar to that developed by Einstein [32] and Partheniades [33]. Therefore, the soil erosion or soil detachment rate ( ε r i ) in presence of oil particles is defined as the following Equations (15)–(17):
ε r i   = Δ F F i P ρ s k r ( d K e t e )
P = 1 exp [ exp ( μ v ) ]  
μ v = ( π e v 6   ) [ k r ( K l s + f c + f c o ) K o τ * ( 1 1.365 e v π ) ]
in which ΔFFi is the fraction finer value for bed materials, P is the exceedance probability of drag force, Ke is the exposure of the lower particle parameter (i.e., additional time to eliminate neighbouring particles), μv is the upper limit of integration of exceedance probability distribution, and ev is the coefficient of variations. Equation (15) could be further derived following the same procedure outlined by Wilson [26,27] and Al-Madhhachi et al. [24] to achieve the total detachment rate parameters of the Wilson model, including the influence of crude oil as the following Equations (18)–(21):
ε r = b 0 τ [ 1 exp { exp ( 3 b 1   τ ) } ]
b 0 = ρ s k r   K e K n μ o r k d d ( ρ s ρ w )
b 1 = ( π e v 6   ) k r ( k l s + f c + f c o ) K o g ( ρ b ρ w ) d
μ o r   = μ o g d ( ρ s ρ w ) τ = μ o τ *
in which b0 is the detachment parameter (g/m-s-N0.5), b1 is the threshold parameter (Pa), and μ o r is the oil coefficient ratio. It should be noted that τ* decreases while μ o increases as the soil erosion occurs.
Wilson [26,27] used a calibration procedure to empirically derive some parameters included in both the cohesive (fc) and the exposure (Ke) parameters. This was due to there being little information available about these parameters at the time. Similarly, in this study, the crude oil parameters (fco and μ o r ) were developed and calibrated using tests on contaminated soils. Both parameters fco and μ o r are functions of soil and oil particle cohesion and contamination time determined by the chemical-physical bonds between soil and oil particles. Based on experimental evidence in this study on soils that JETs were undertaken, the values of fco and μ o r range from 81 to 140 and 18 to 23, respectively.
The definitions of the parameters in the Wilson model (Equations (18)–(21)), with their values, are reported in Table 1. In the absence of crude oil, the oil parameters can be neglected (i.e., μ o r = 0 and fco = 0), and the developed model will match the set of equations suggested by Wilson [26,27]. The parameters b0 and b1 can be derived by employing curve-fitting techniques that reduce the errors of these functions in relation to measured erosion data obtained from JETs. Al-Madhhachi et al. [17] developed an Microsoft Excel spread sheet to derive parameters b0 and b1 using the solver routine in Microsoft Excel, which utilized the generalized reduced gradient method.
The erodibility of cohesive soils, affected by crude oil contamination, can be theoretically predicted based on observed JET data without crude oil. Mini JETs were undertaken with conditions without crude oil to derive b0w and b1w (in which b0w and b1w are the Wilson model parameters without the influence of crude oil). The b1w can be converted to b1 (including the crude oil term), and b0w can be converted to b0 (including the crude oil term) based on the measured crude oil parameters, at any time, without conducting new JETs. The parameters, b0 and b1, are mechanistically defined. Parameter b1, based on Equation (20), can be rewritten as the following Equation (22):
b 1 = b 1 w   + ( π e v 6 ) k r f c o K o g ( ρ b ρ w ) d
in which b 1 w = ( π e v 6 ) k r ( K l s + f c ) K o g ( ρ s ρ w ) d is the Wilson model parameter derived from JET data without crude oil contamination (i.e., fco = 0). The second term in Equation (22) can be mathematically found by using the terms given in Table 1.
In a similar fashion, the Wilson model parameter b0 can also be predicted based on the observed properties of crude oil contaminated soil. The terms in Equation (19) can be mathematically defined using the values given in Table 1, combined the range of 18 to 23 found in this study for the crude oil coefficient ratio, and Ke, which can be predicted from observed JET data for soil without crude oil contamination, using the following Equation (23):
K e = ρ s k r   b 0 w K n k d d ( ρ s ρ w )

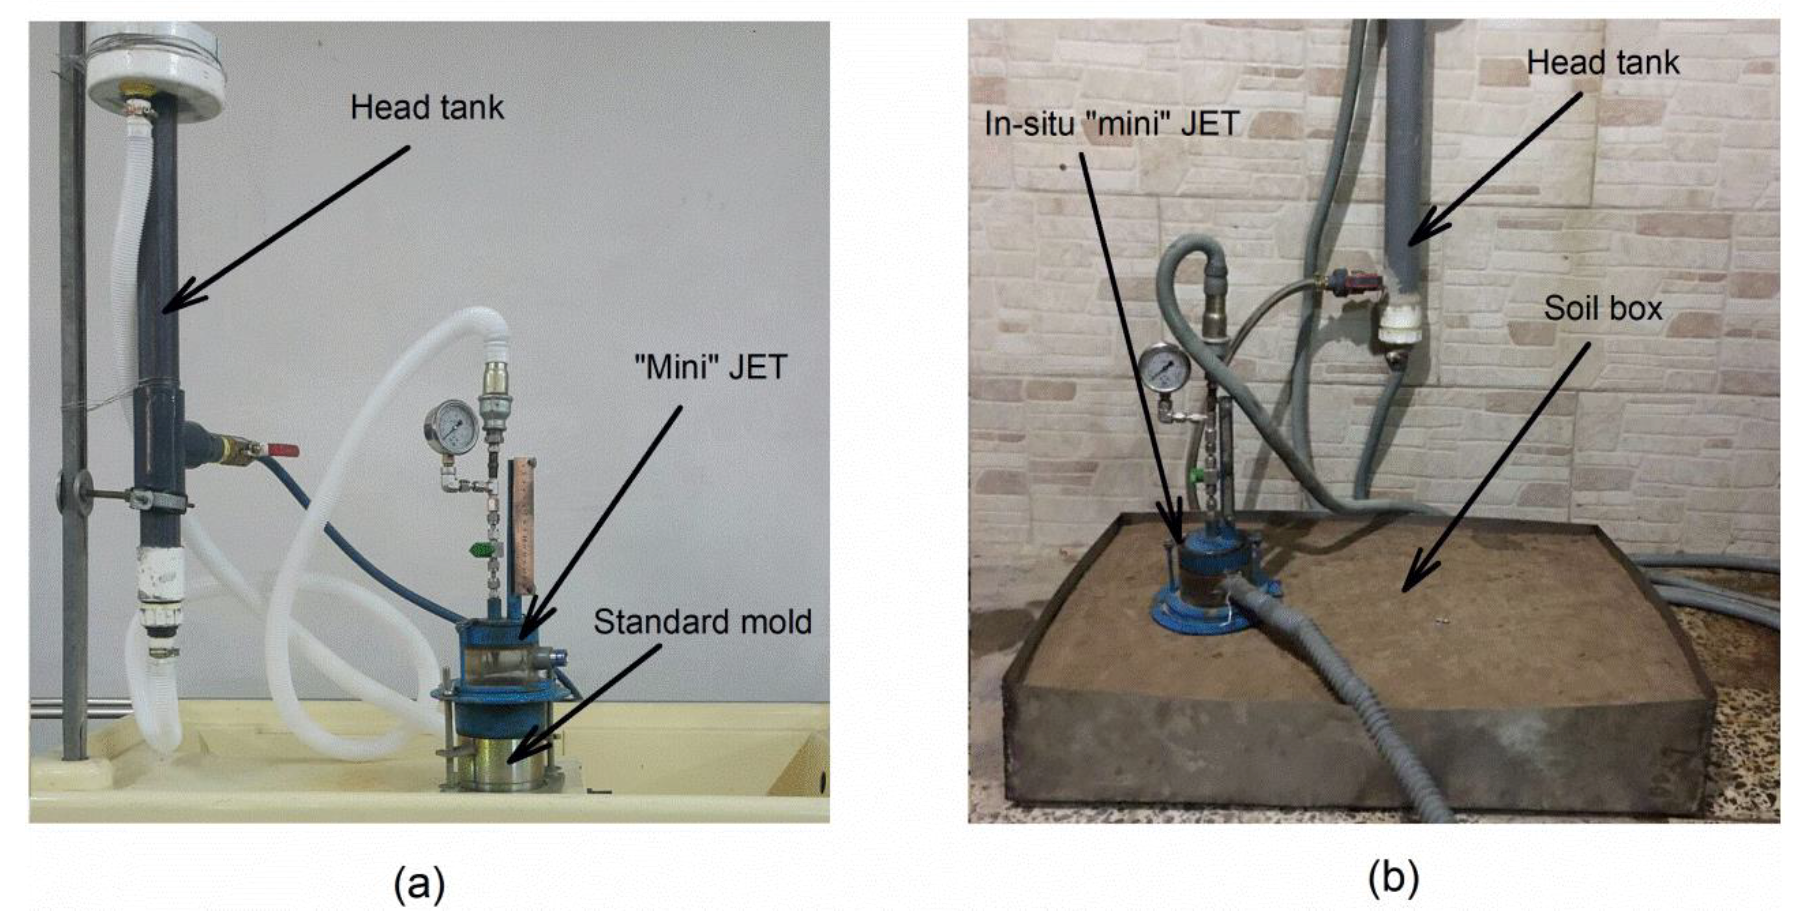
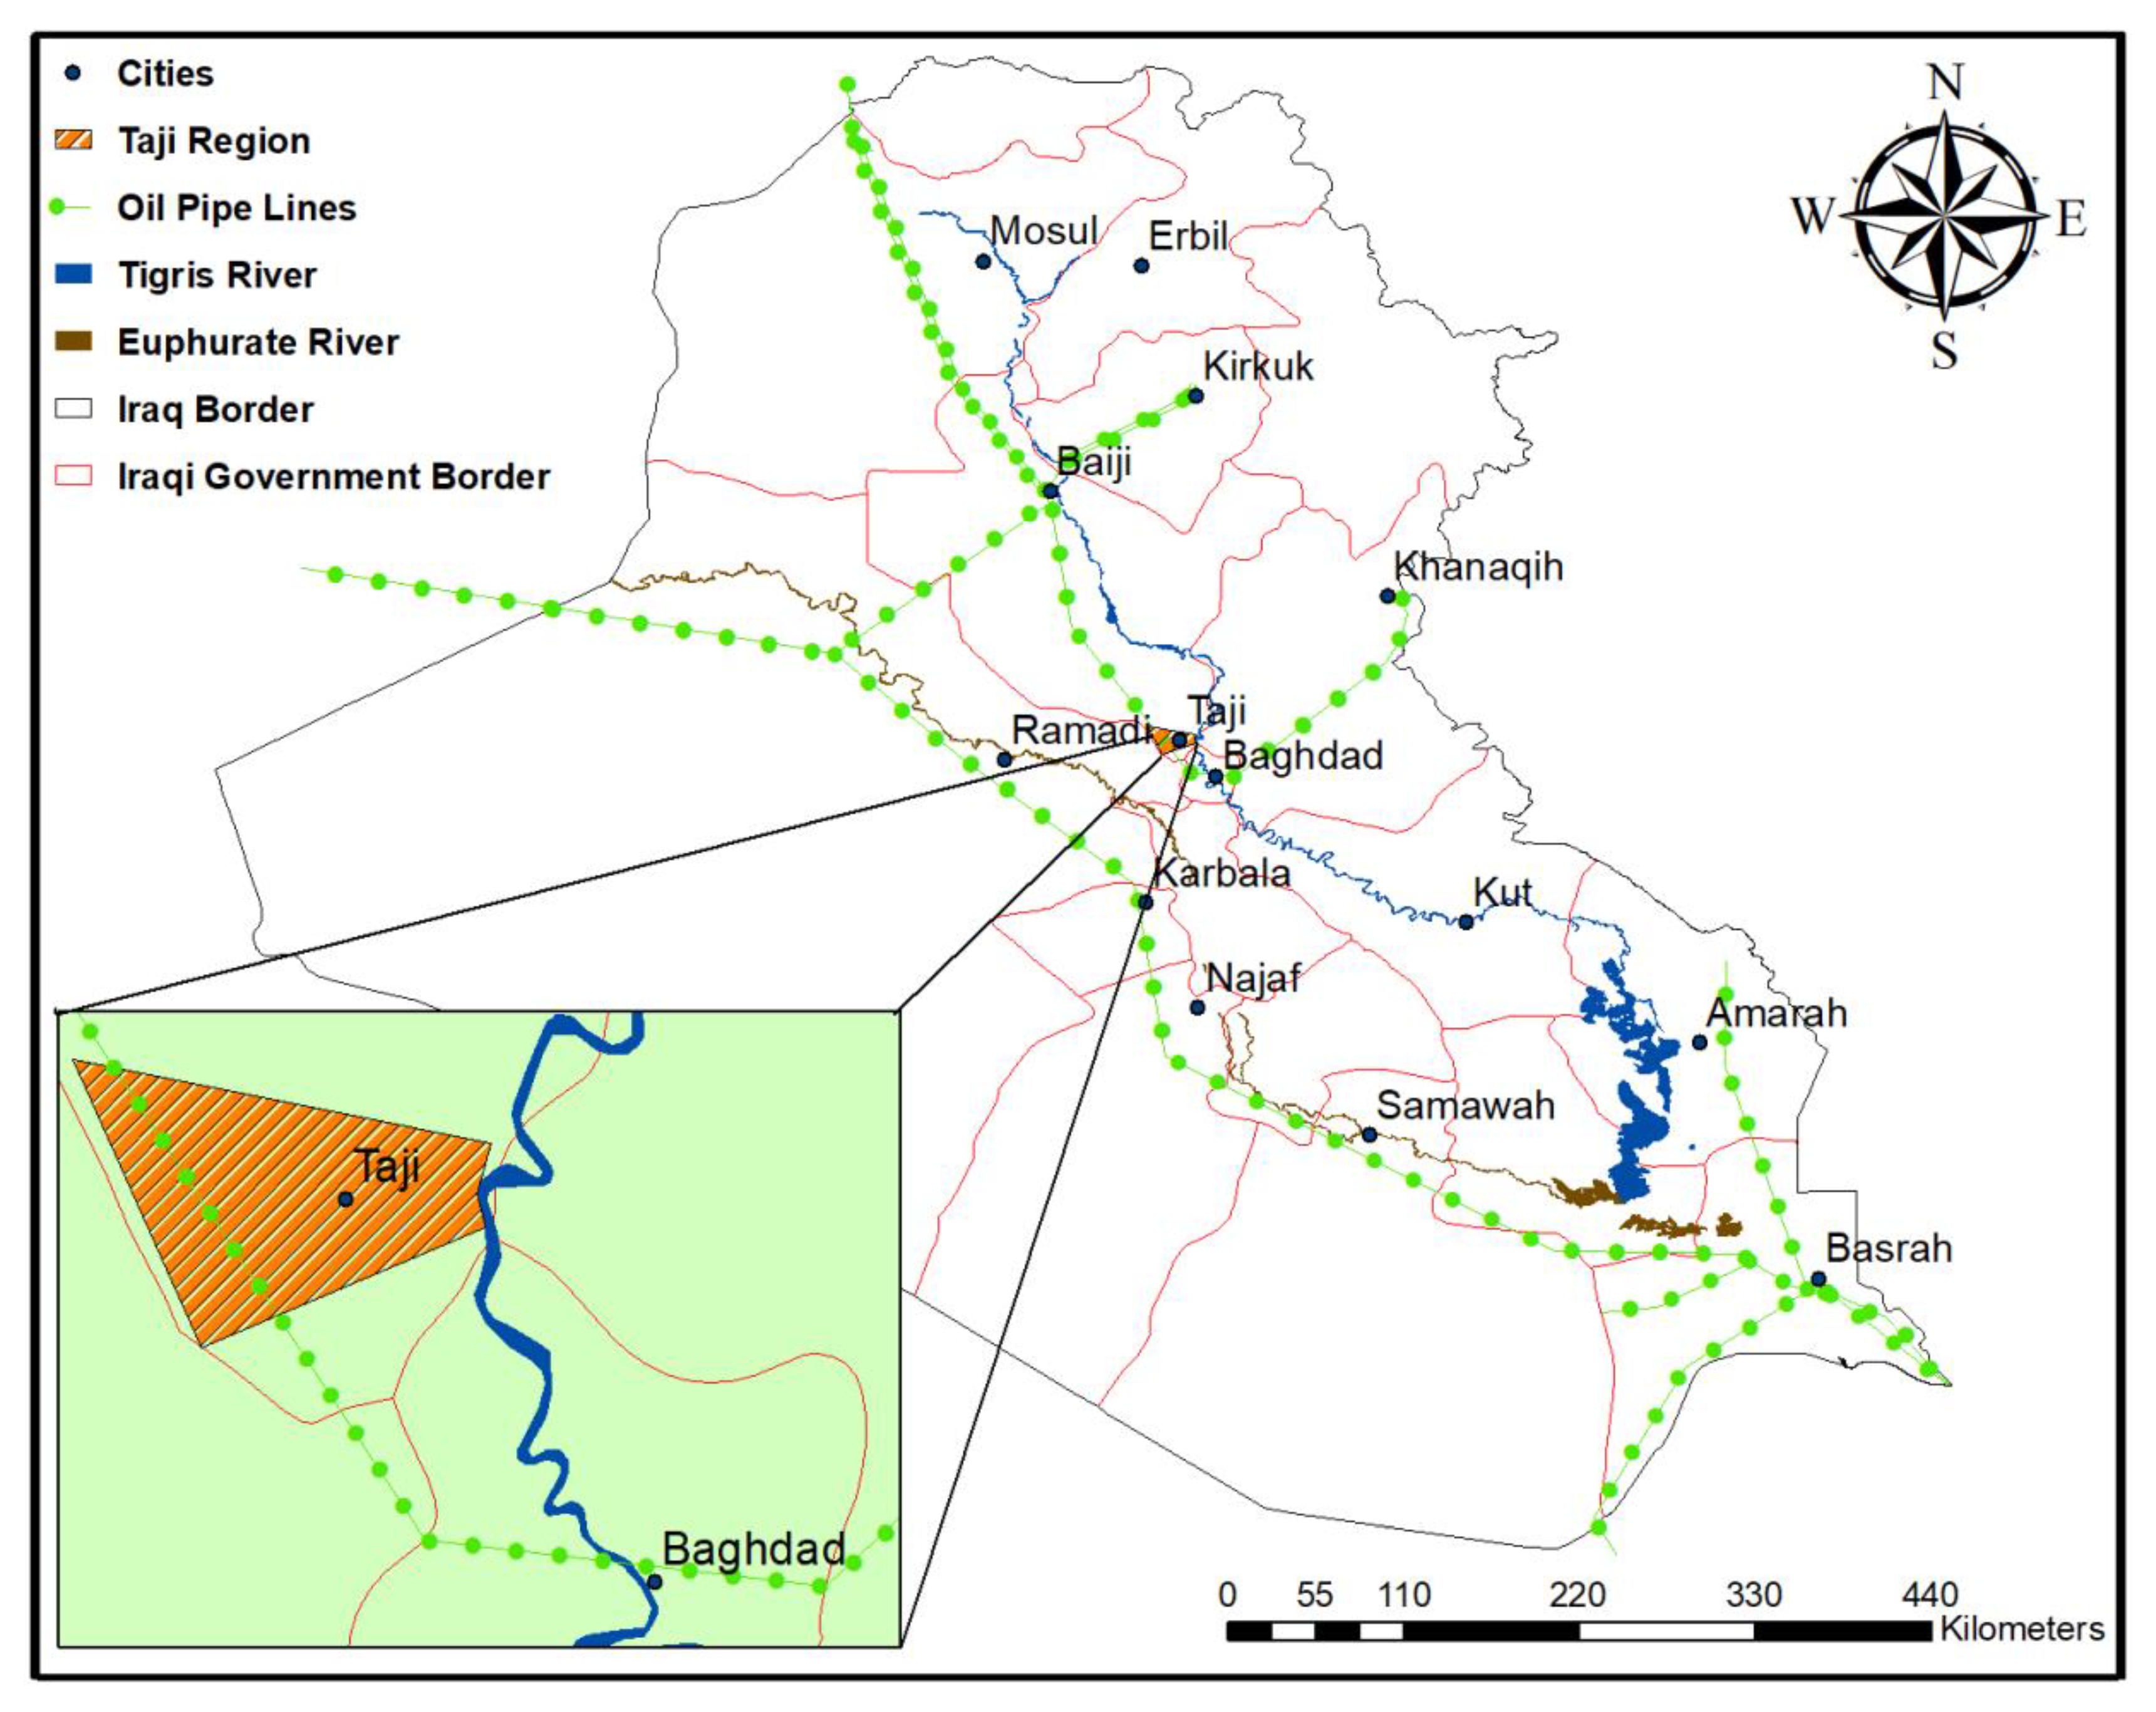
2.2. Materials and Experimental Procedure

The Taji region was selected as a case study for this research. The Taji region is located about 30 km northwest of Baghdad city (Figure 2). The study area was located between (33°35′40″–33°28′42″) N and (44°05′22″–44°18′04″) W. Figure 2 shows the crude oil pipe lines in Iraq, including the study area. The lean clay soil used in this study was acquired from the Taji region. The physical characteristics of the soil samples that were used are listed in Table 2 followed by their characteristics defined using the ASTM standard (ASTM, 2006). The crude oil was obtained from the Iraqi South Oil Company (Basrah, Iraq). Chemical and physical characteristics were found using its laboratory, the results of which are listed in Table 3. Chemical analysis of crude-oil-contaminated soil was performed by the Ministry of Science and Technology, the results of which are listed in Table 4.
The JET settings and operation followed the procedure laid out by Al-Madhhachi et al. [16,37]. Soil samples were first air dried and sieved through sieve number four. Then, the sieved samples were packed into small-scale (standard mold) and large-scale (in-situ soil box) setups at three different soil moisture contents: 10%, 16%, and 20%, respectively. This was to investigate the influence of crude oil contamination on deriving Wilson model parameters at two different scale setups and different soil moisture levels (Figure 3). The small-scale setup was an ASTM standard mold with 960 cm3 in volume (Figure 3a). The large-scale setup was a soil box with 48,000 cm3 in volume (Figure 3b). A standard bulk density was achieved by packing the soil into three layers using a manual rammer packed at three previously mentioned soil moisture levels. A similar technique was accomplished for the crude oil-contaminated soil. The packed contaminated soil was covered with 3 cm of crude oil and left for one day for each scale prior to JET testing. The next day, any excess oil was removed, and the JET experiments were performed.
Al-Madhhachi and Hasan [7] indicted that oil contamination influenced the erodibility of dry soil samples. Therefore, in this study, the influence of contamination time on contaminated soil was examined by implementing the JET device with the small-scale setup at dry soil moisture content (10%) to investigate the second objective of this study. The soil samples were covered with oil and left for 1st, 4th, and 8th days depending on the required contamination time prior to applying the JET. The procedure outlined by Khanal et al. [5] and Al-Madhhachi and Hasan [7] for collecting score depth vs. time was followed. A total of 48 “mini” JETs was performed for the clean and crude-oil-contaminated soils to achieve the objectives of this study. The Wilson model parameters (b0 and b1) were calculated using an Excel spread sheet that was developed by Al-Madhhachi et al. [17].
The Normalised Objective Function (NOF), which is the ratio of the standard deviation (STD) of differences between observed and predicted data to the overall mean (Xav) of the observed data, was calculated to quantify its suitability and to examine how well the Wilson model matched the observed data from the JET. Accordingly, the NOF is expressed as [24,25]
N O F = S T D   X a v = i = 1 N ( O i P i ) 2 N X a v
in which Oi and Pi are the observed and predicted data, respectively, and N is the observation number.
The computed statistical differences in the Wilson model parameters were also investigated using the analysis of variance (ANOVA) technique between clean and crude oil contaminated soil after 1, 4, and 8 days of contamination. The median and the difference between the 25th and 75th percentiles (IQR) were described for b0 and b1. Pairwise comparison tests were undertaken for the mechanistic detachment parameters, which revealed a significant difference compared to ANOVA with a significance level of α = 0.05.

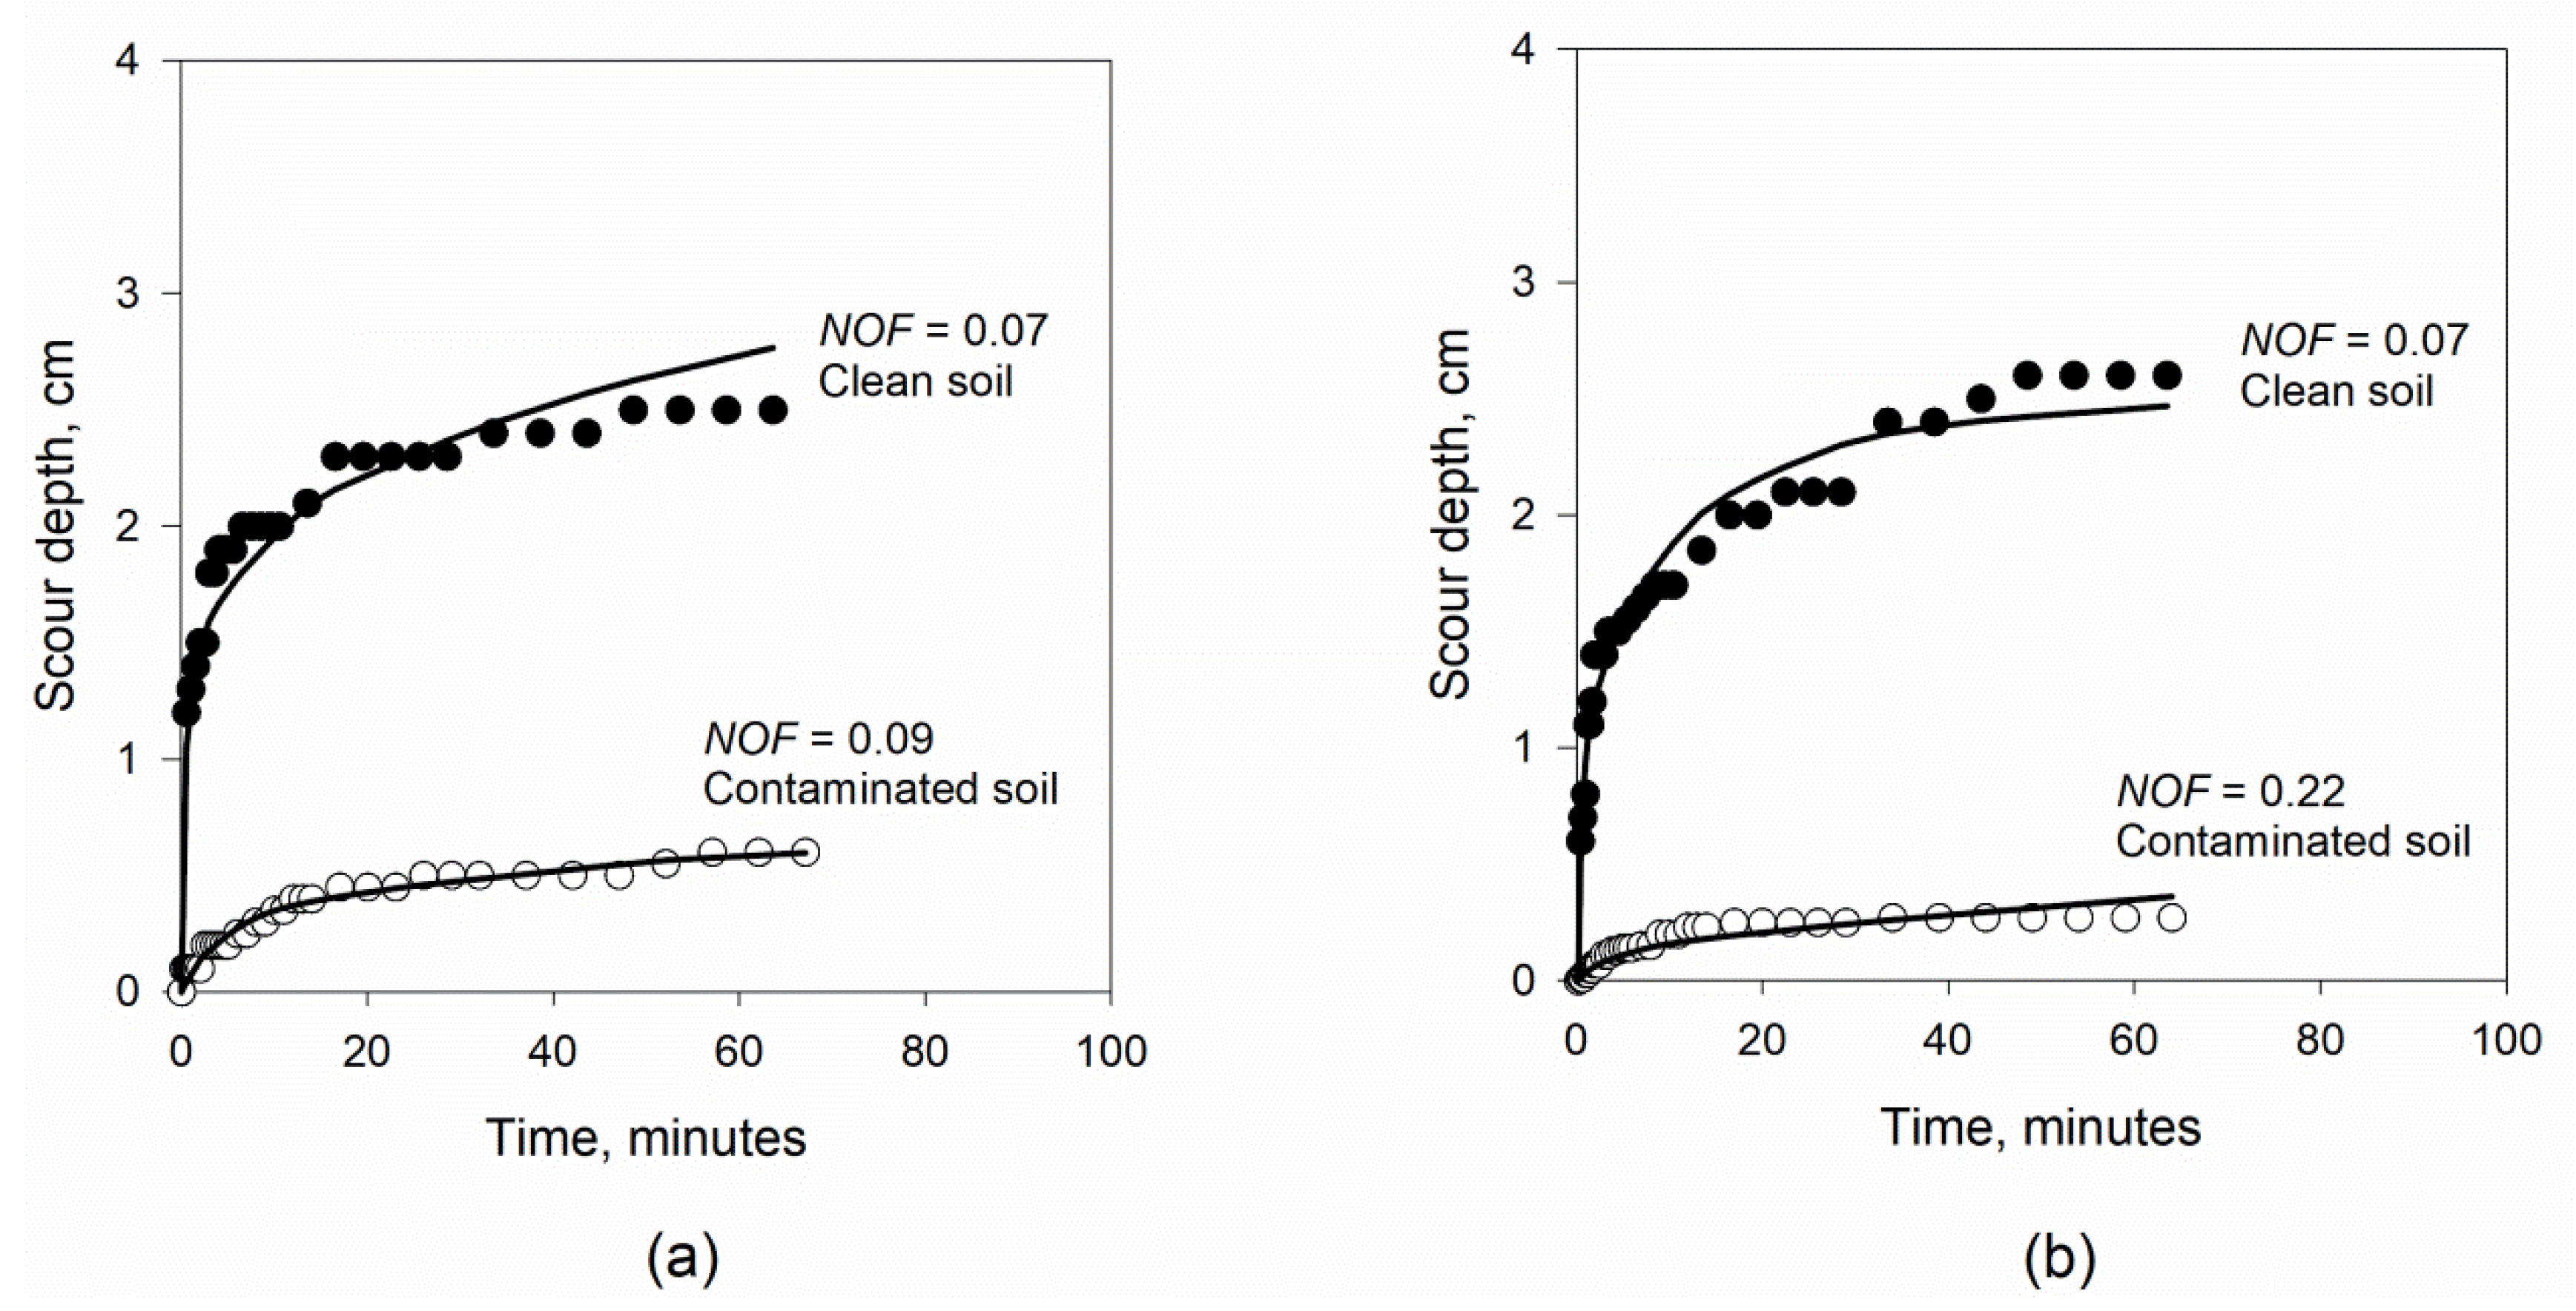
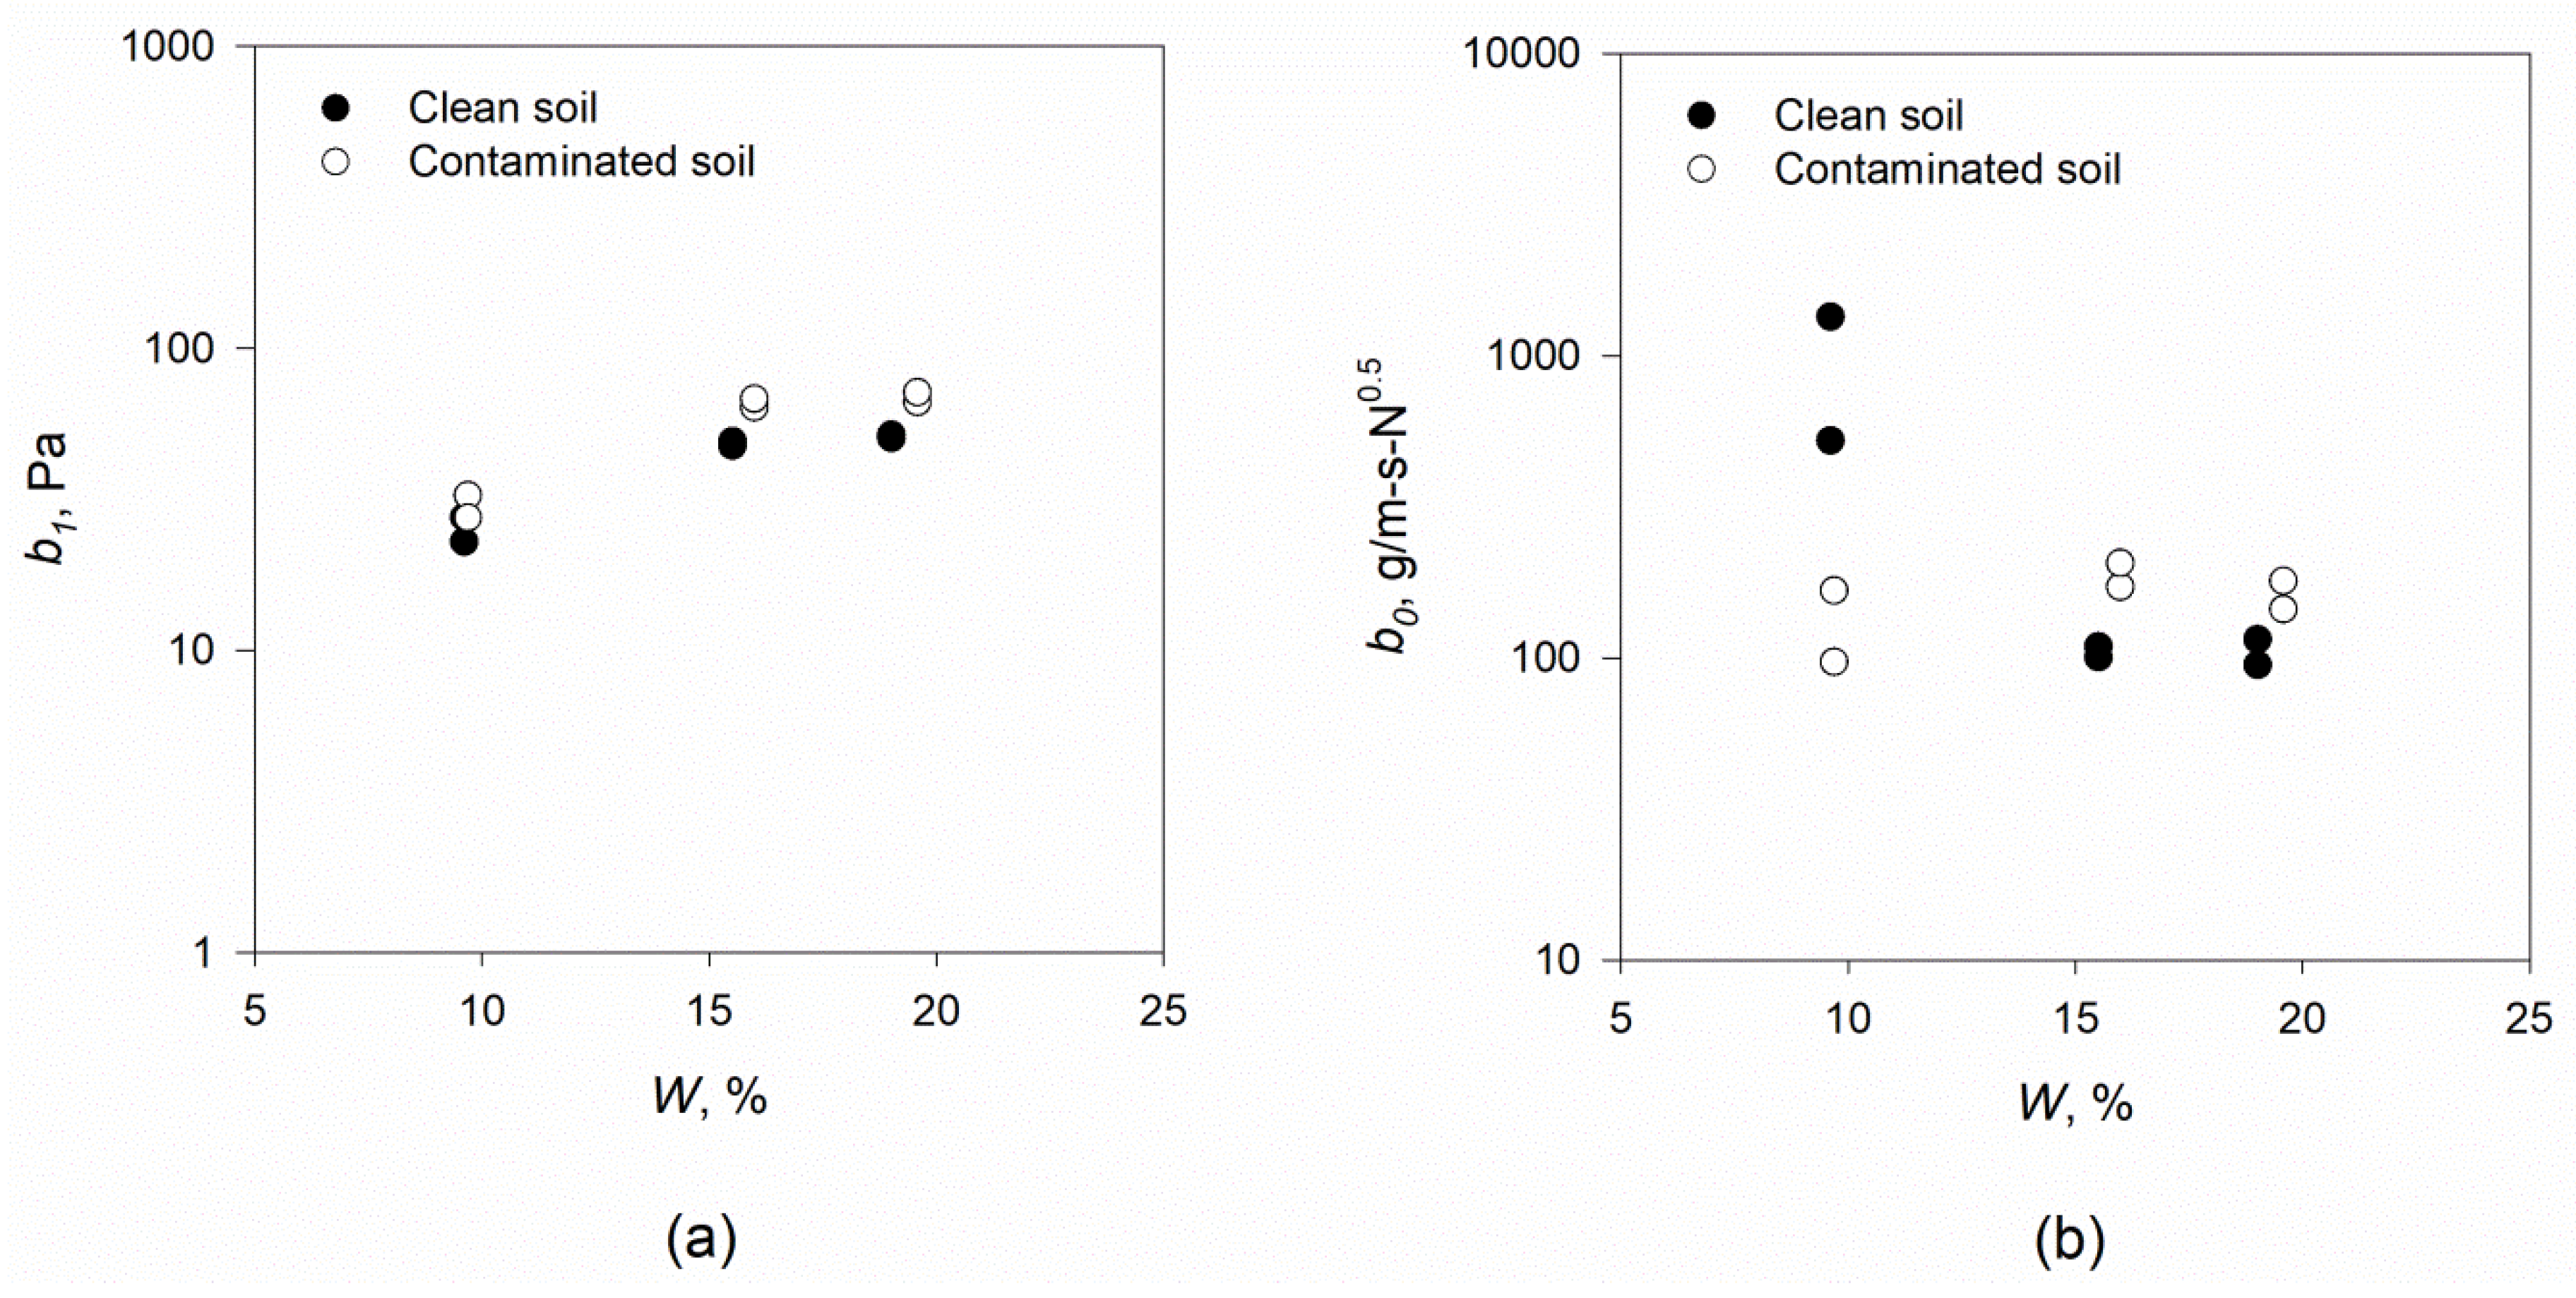
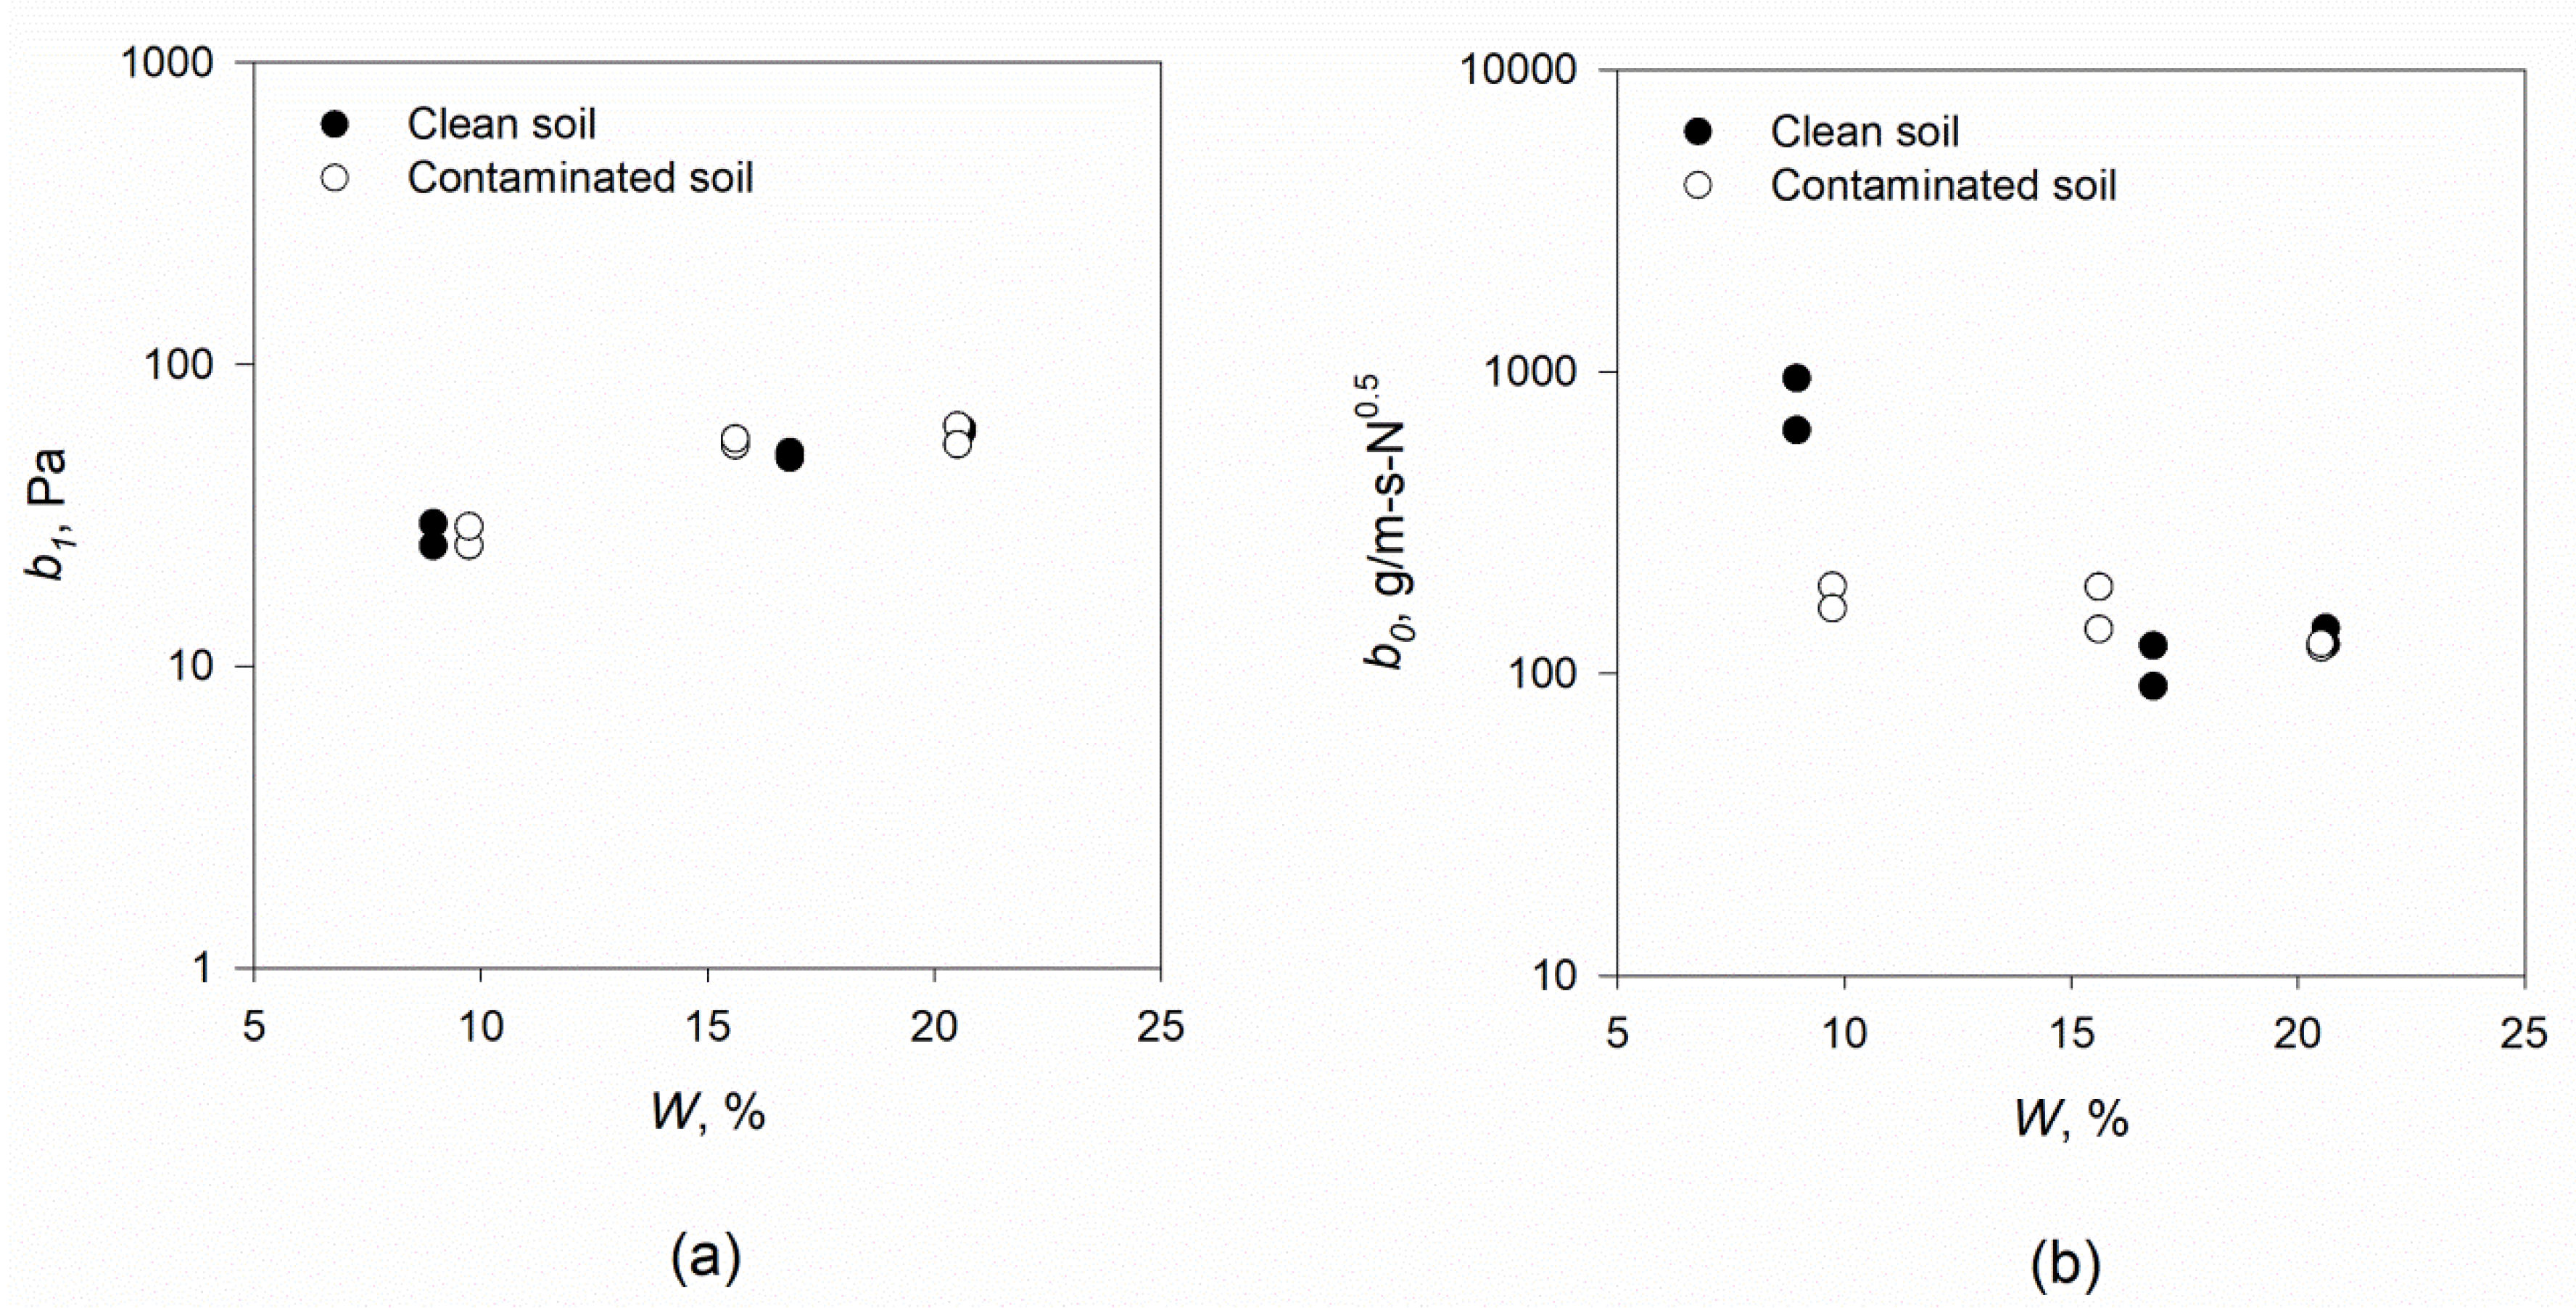
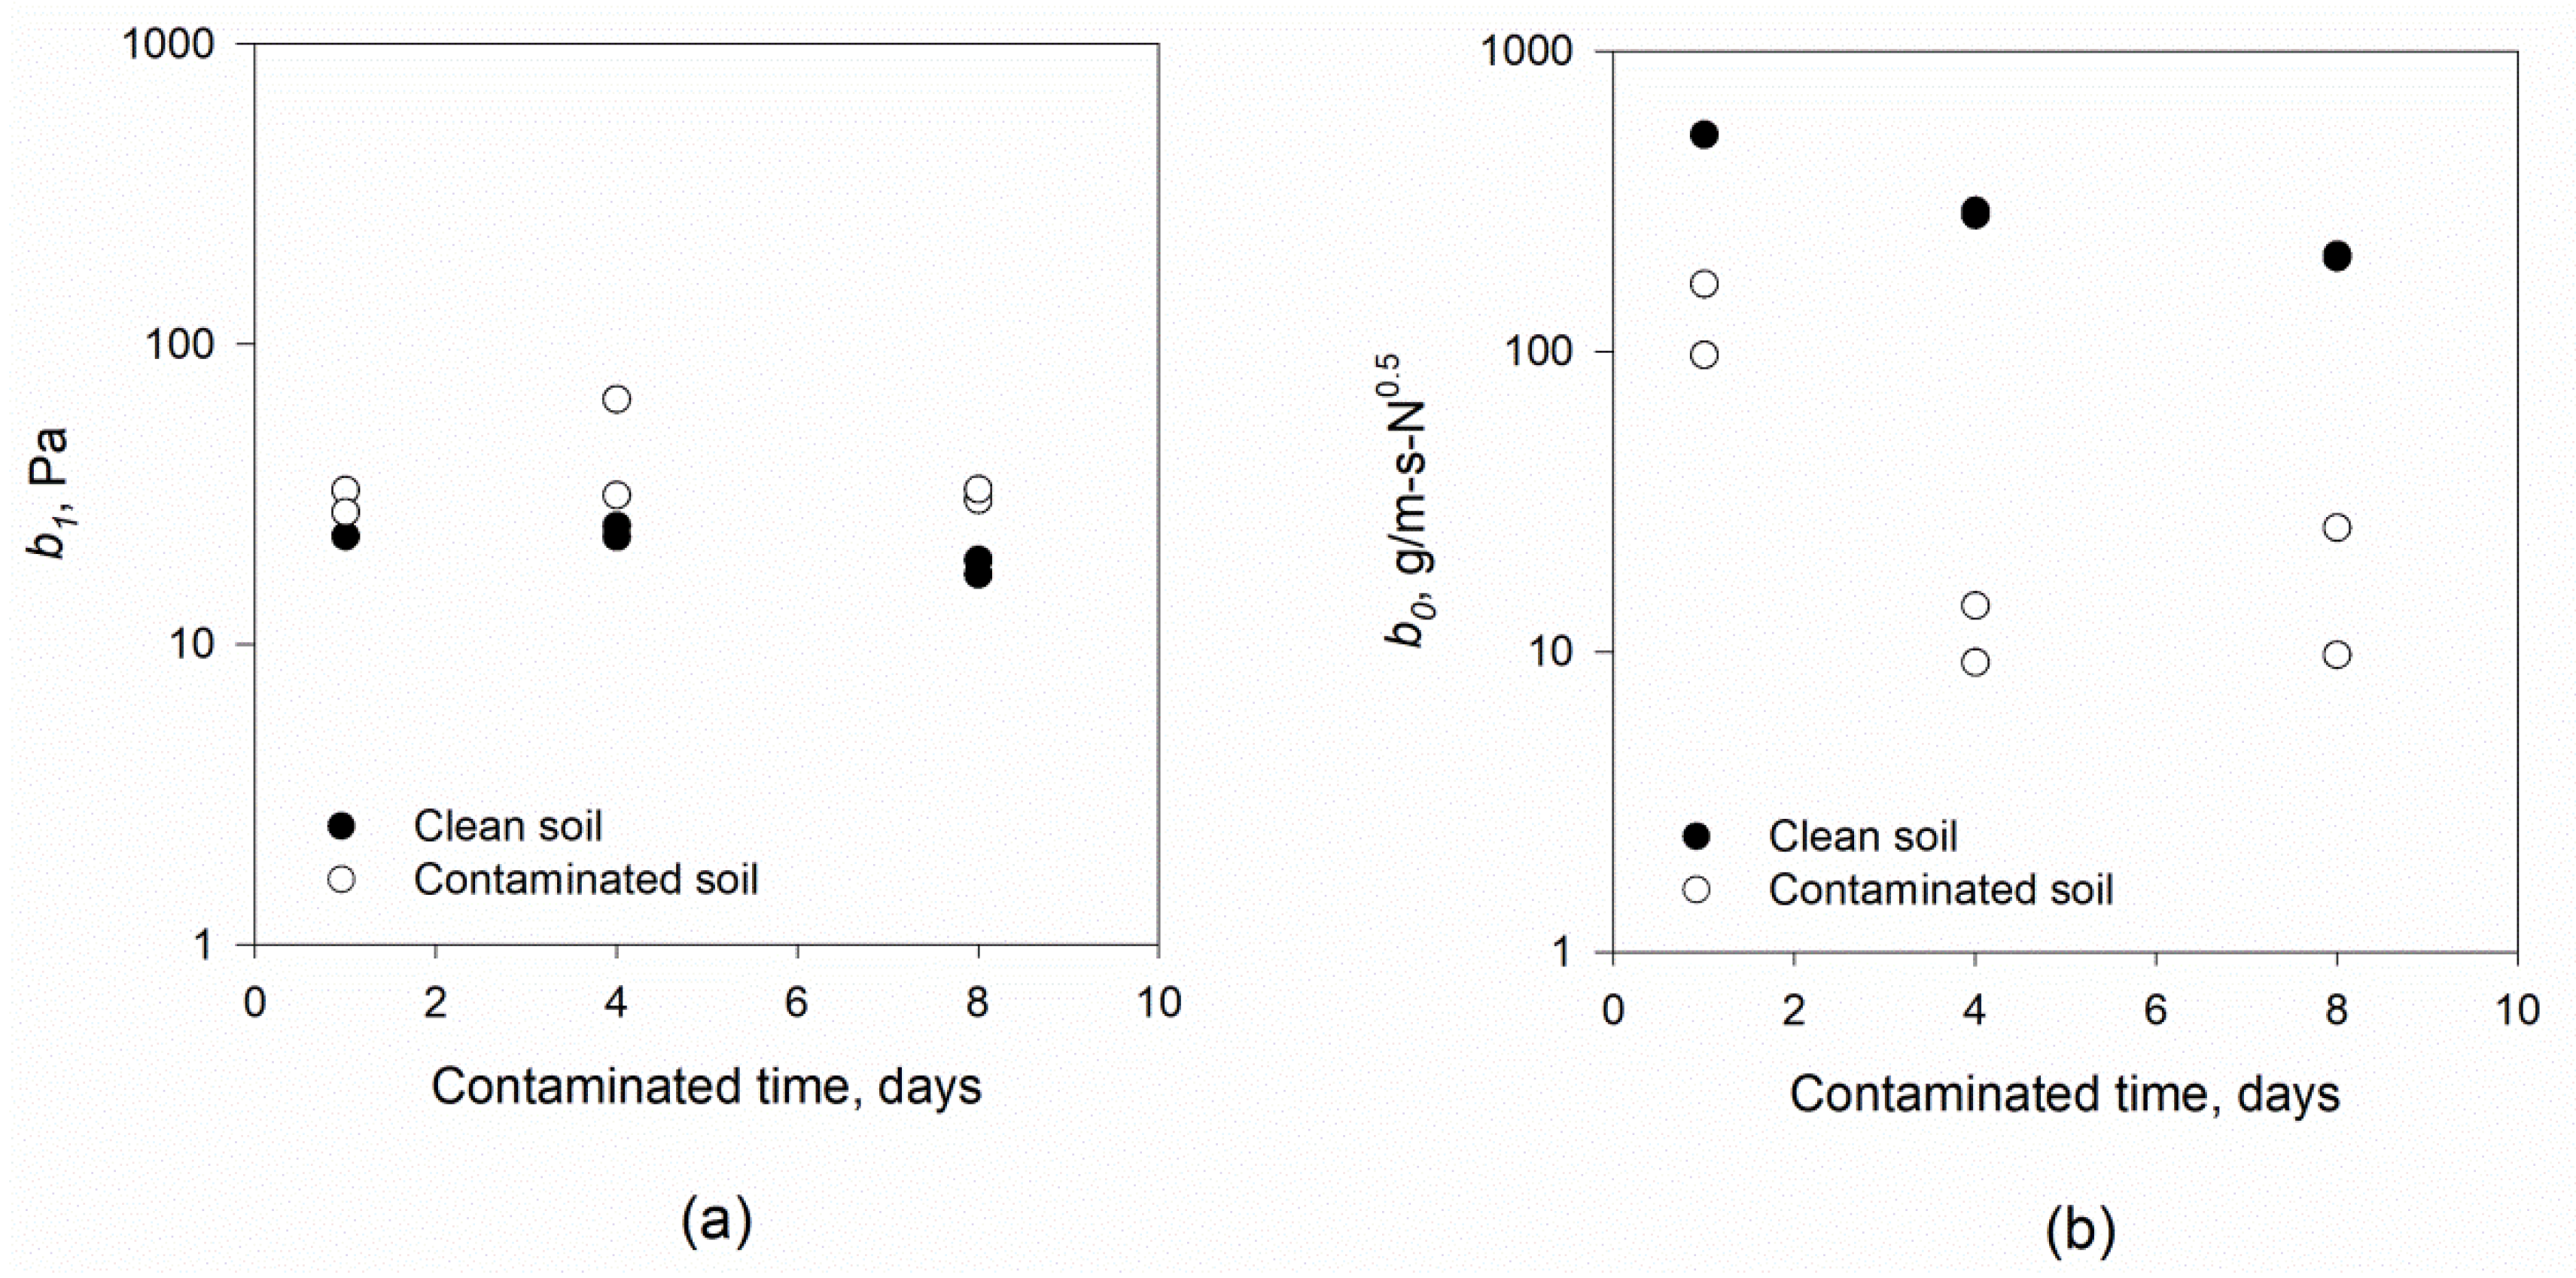
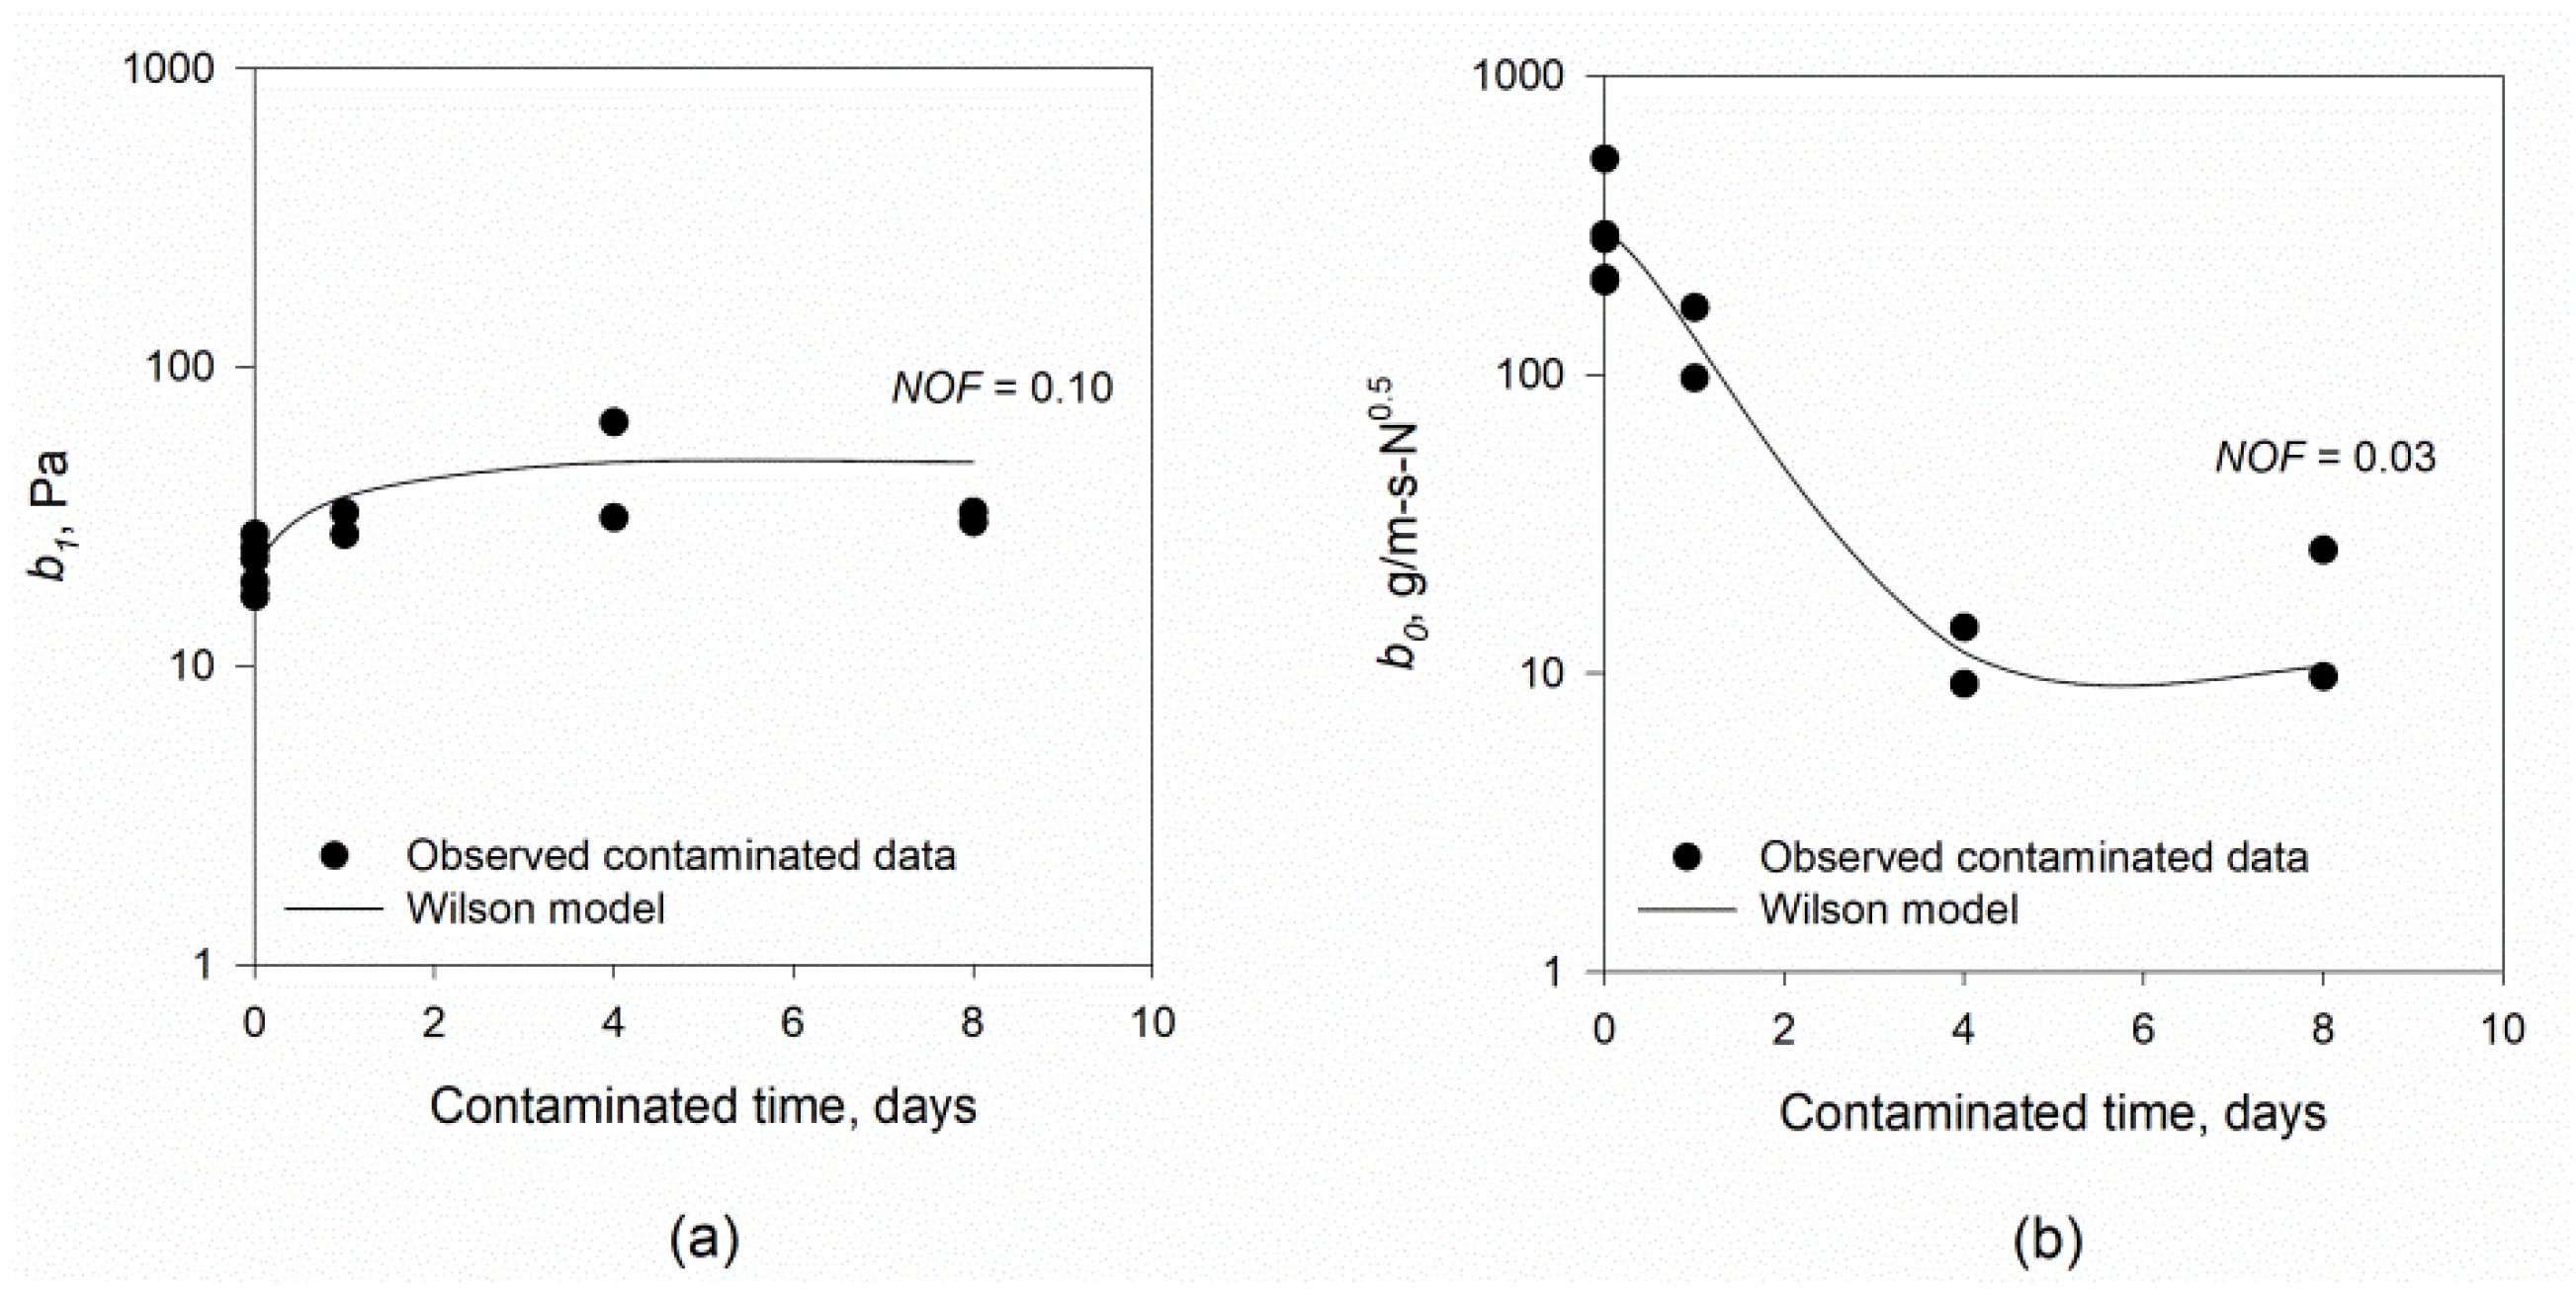
3. Results and Discussion

Crude oil spills on the soil’s surface influence the Wilson model erodibility parameters that can be mathematically predicted from JET data. Such an influence is correlated to several factors that affect b0 and b1. The Wilson parameters are soil parameters, despite being driven by the flow-jet velocity parameter, which itself is driven by hydraulic conditions [17]. In the presence of crude oil, the parameter b0 was influenced by μ o r , which was dependent on soil and oil cohesion (Equations (19) and (21)). It was also influenced by Ke, which depended on soil cohesion [14], while the parameter b1 was influenced by fco, which is the dimensionless parameter based on soil and oil cohesions, and fc, which is the dimensionless parameter based on soil cohesion (Equation (20)).
Crude oil affected the observed scour-depth readings in the “mini” JET experiments. Examples for both the large-scale (in-situ soil box) and small-scale (standard mold) setups of scour depth data versus recording times at the dry side of packed contaminated soils are shown in Figure 4. Lower erosion rates were observed in both scale setups. The model was evaluated based on the Normalised Objective Function (NOF) using JET data for both scales (Figure 4). This was to examine how the Wilson model would fit the observed data. The NOFs were 0.09 and 0.22 for crude-oil-contaminated soil at small and large-scale setups, respectively (Figure 4). The NOF was 0.07 for clean soil at both scale setups. Consequentially, the Wilson model data fitted well the JET observed data.
For the small-scale setup, it can be observed from Figure 5a that the b1 value slightly increased for both the clean and crude-oil-contaminated soil as the water content increased. Note that there was a slight increase for the contaminated soil compared to the clean soil. As expected, the b0 value decreased as the water content increased for clean soil, while soil moisture content had no influence on b0 for the oil-contaminated soil (Figure 5b). The presence of crude oil significantly influenced soil detachment at dry soil moisture content of 10%. Significant differences in b0 values were observed between clean and contaminated soil at dry soil moisture content. The influence of crude oil on soil detachment was related to the water content when the soil was packed. This could be related to the variability of soil pores occupied with crude oil particles, as more pores are available with lower water content.
Figure 6 shows the influence crude oil contamination had on the Wilson parameters in the large-scale (in-situ soil box) setup. Similar to that found with small-scale setup, the b1 value slightly increased for both clean and crude-oil-contaminated soil as the water content increased (Figure 6a). The b0 value decreased as the water content increased for clean soil, while there was no influence of water content on b0 for oil-contaminated soils (Figure 6b). Al-Madhhachi et al. [17] reported an inverse correlation between b0 and water content when the soil was packed, due to the increase in Ke of parameter b0 (Equation (19)). Similar observations were made in this study with clean soil. However, no correlations between b0 and soil moisture content were observed for crude-oil-contaminated soils with either scale setups (Figure 5 and Figure 6).
To investigate the influence of crude oil at dry moisture content in detail, Wilson parameters b0 and b1 were also derived from the JET data for clean and crude-oil-contaminated soils with the small-scale setup as an example at three different contamination times (1st, 4th, and 8th days) (Figure 7). There was no influence of the contamination times on the b1 values for either of the clean or oil-contaminated soils (Figure 7a). ANOVA reported that there was no statistically significant difference between clean and contaminated soil for parameter b1 (with p > 0.05), excluding the observed b1 at 8 days of contamination (Table 5). Figure 7b indicates an inverse relationship between the b0 value and contamination time for contaminated soils. A significant reduction in b0 was found for crude-oil-contaminated dry soil as the contamination time increased in comparison to clean soil. This was due to the low soil moisture content and increased contamination time allowing more crude oil particles to occupy the soil pores. ANOVA confirmed that the results shown in Figure 7b have statistically significant differences between clean and contaminated soil for the observed b0 parameter (with p < 0.05), excluding the observed b0 on the first day of contamination (Table 5).
Soil chemical characteristics were also influenced by the crude oil at different contamination times (Table 4). The soil pH level slightly increased as the contamination times increased. Wang et al. [38] found that crude oil contamination increases the pH level. The lead concentration (Pb2+) significantly increased from 45.5 ppm to 135 ppm after eight days of oil contamination (Table 4). Total organic matter and organic carbon increased slightly from 1.27% to 1.69% and from 0.74% to 0.98%, respectively, as contamination times increased. Richardson et al. [39] investigated the influence of crude oil contamination on physiochemical characteristics of soil. Richardson et al. [39] observed elevated levels of lead and total organic carbon in contaminated soils. High levels of total organic carbons and lead confirmed severe soil hydrocarbon contamination. No significant differences were observed for EC and pH levels between clean and oil-contaminated soils [39]. Future research is needed to develop relationships between the crude oil parameters (fco and μ o r ) and soil chemical characteristics for different soil textures.
The predictive equations for b0 and b1 from the parameters without crude oil appropriately estimated the derived parameter values from JETs with small-scale setup and at different contamination times (see Figure 8). The Wilson parameters at zero contaminated time referred to values of b1 and b0 at clean soils (without contamination by crude oil). The NOF of prediction parameters versus observed data were 0.10 and 0.03 for b1 and b0, respectively. The prediction of b1 was based on the dimensionless parameter, based on soil and oil cohesions fco. The prediction of b0 was based on the crude oil coefficient ratio μ o r and Ke. Table 5 shows that the parameters fco and μ o r increased as contamination time increased until equilibrium was reached. These parameters are a function of soil and oil particle cohesion and contamination time based on the chemical-physical bonds between soil and oil particles. Additional research is needed to verify the values of fco and μ o r for different soil textures at different contamination levels.

4. Summary and Conclusions

The influence of crude oil in relation to fluvial forces was incorporated into a fundamental detachment model (the Wilson model) to calculate the mechanistic detachment parameters, b0 and b1. A laboratory “mini” JET device was utilized to derive b0 and b1 for lean clay soils at different scale setups and packed at different soil moisture levels (10% to 20%) to investigate the influence of crude oil on deriving the Wilson model parameters. Another set of JET experiments was performed to investigate the influence of crude-oil-contaminated dry soil at different contamination times (1st, 4th, and 8th days). Crude oil decreased the observed scour depth measurements compared to the clean soils of the “mini” JET experiments. The parameter b1 value slightly increased for both clean and crude-oil-contaminated soil as the water content increased. Significant differences in b0 values were observed between clean and contaminated soil with dry soil moisture content. This was because the soil pores were occupied by crude oil particles at lower water content. No correlations between b0 and the soil moisture content of contaminated soil were observed for both scale setups. No statistically significant differences were observed between clean and contaminated soil for b1, excluding the observed b1 at a high level of contamination. Statistically significant differences were found between clean and contaminated soil for the observed b0 parameter, excluding the observed b0 on low level of contamination. No significant differences were observed for soil pH levels, EC, organic matter, or carbon between the clean and oil-contaminated soils. The lead concentration significantly increased as the contamination times increased. The influence of crude oil on mechanistic soil erodibility parameters can be predicted with a priori JET experiment on clean soil based on crude oil parameters (fco and μ o r ). The Wilson model is beneficially a fundamentally erosion-based equation and thus benefits from being more mechanistic in comparison to other empirical erosion models.

Author Contributions

The performing experiments, providing required materials, and data/evidence collection have been performed by M.B.H. The data analysis, mathematical development of Wilson model, and methodology have been considered and hypothesized by A.-S.T.A.-M. The ideas, formulation of overarching research aims, and editing of the text have been performed by both authors.

Funding

This research received no external funding.

Acknowledgments

The authors acknowledge the faculty and staff of the Hydraulic Laboratory and Soil Laboratory of the College of Engineering, Mustansiriyah University (www.uomustansiriyah.edu.iq), for their valuable help in fixing and sustaining the apparatus utilized in this research. The authors also acknowledge the faculty and staff of Iraqi South Oil Company laboratories for providing, testing, and analyzing the crude oil used in this study.

Conflicts of Interest

The funders had no role in the design of the study; in the collection, analyses, or interpretation of data; in the writing of the manuscript; or in the decision to publish the results.

References

  1. Briaud, J.L.; Ting, C.K.; Chen, H.C.; Han, S.W.; Kwak, K.W. Erosion function apparatus for scour rate predictions. J. Geotech. Geoenviron. Eng. 2001, 127, 105–113. [Google Scholar] [CrossRef]
  2. Hanson, G.J. Surface erodibility of earthen channels at high stresses part ii-developing an in situ testing device. Trans. ASAE 1990, 33, 132–137. [Google Scholar] [CrossRef]
  3. Hanson, G.J.; Cook, K.R. Apparatus, test procedures, and analytical methods to measure soil erodibility in situ. Appl. Eng. Agric. 2004, 20, 455–462. [Google Scholar] [CrossRef]
  4. Wan, C.F.; Fell, R. Laboratory tests on the rate of piping erosion of soils in embankment dams. Geotech. Test. J. 2004, 27, 295–303. [Google Scholar]
  5. Khanal, A.; Fox, G.A.; Al-Madhhachi, A.T. Variability of erodibility parameters from laboratory mini jet erosion tests. J. Hydrol. Eng. 2016, 21, 04016030. [Google Scholar] [CrossRef]
  6. Abbas, M.N.; Al-Madhhachi, A.T.; Esmael, S.A. Quantifying soil erodibility parameters due to wastewater chemicals. Int. J. Hydrol. Sci. Technol. 2018, in press. [Google Scholar]
  7. Al-Madhhachi, A.T.; Hasan, M.B. Influence of in-situ scaling on variability of polluted soil erodibility parameters. Pollution 2018. [Google Scholar] [CrossRef]
  8. Mutter, G.M.; Al-Madhhachi, A.T.; Rashed, R.R. Influence of soil stabilizing materials on lead polluted soils using jet erosion tests. Int. J. Integr. Eng. 2017, 9, 28–38. [Google Scholar]
  9. Salah, M.M.; Al-Madhhachi, A.T. Influence of lead pollution on cohesive soil erodibility using jet erosion tests. Environ. Nat. Resour. Res. 2016, 6, 88–98. [Google Scholar] [CrossRef]
  10. Shayannejad, M.; Ostad-Ali-Askari, K.; Ramesh, A.; Singh, V.P.; Eslamian, S. Wastewater and magnetized wastewater effects on soil erosion in furrow irrigation. Int. J. Res. Stud. Agric. Sci. 2017, 3, 1–14. [Google Scholar]
  11. Quyum, A.; Achari, G.; Goodman, R.H. Effect of wetting and drying and dilution on moisture migration through oil contaminated hydrophobic soils. Sci. Total Environ. 2002, 296, 77–87. [Google Scholar] [CrossRef]
  12. Tsai, T.T.; Kao, C.M. Treatment of petroleum-hydrocarbon contaminated soils using hydrogen peroxide oxidation catalyzed by waste basic oxygen furnace slag. J. Hazard. Mater. 2009, 170, 466–472. [Google Scholar] [CrossRef] [PubMed]
  13. Anoliefo, G.O.; Vwioko, D.E. Effects of spent lubrication oil on the growth of Capsicum anumL and Hycopersiconesculentum Miller. Environ. Pollut. 1995, 88, 361–364. [Google Scholar] [CrossRef]
  14. Tigris Oil Spill Pollutes Iraq Water Supplyitle of Site. Available online: https://www. oilandgasmiddleeast.com/article-12343-tigris-oil-spill-pollutes-iraq-water-supply (accessed on 24 April 2014).
  15. Al-Madhhachi, A.T. Variability in soil erodibility parameters of tigris riverbanks using linear and non-linear models. Nahrain J. Eng. Sci. 2017, 20, 959–969. [Google Scholar]
  16. Al-Madhhachi, A.T.; Hanson, G.J.; Fox, G.A.; Tyagi, A.K.; Bulut, R. Measuring soil erodibility using a laboratory “mini” jet. Trans. ASABE 2013, 56, 901–910. [Google Scholar]
  17. Al-Madhhachi, A.T.; Hanson, G.J.; Fox, G.A.; Tyagi, A.K.; Bulut, R. Deriving parameters of a fundamental detachment model for cohesive soils from flume and jet erosion tests. Trans. ASABE 2013, 56, 489–504. [Google Scholar] [CrossRef]
  18. Daly, E.R.; Fox, G.A.; Miller, R.B.; Al-Madhhachi, A.T. A scour depth approach for deriving erodibility parameters from jet erosion tests. Trans. ASABE 2013, 56, 1343–1351. [Google Scholar]
  19. Daly, E.R.; Fox, G.A.; Al-Madhhachi, A.T.; Storm, D.E. Variability of fluvial erodibility parameters for streambanks on a watershed scale. Geomorphology 2015, 231, 281–291. [Google Scholar] [CrossRef]
  20. Hanson, G.J.; Hunt, S.L. Lessons learned using laboratory jet method to measure soil erodibility of compacted soils. Trans. ASABE 2007, 23, 305–312. [Google Scholar]
  21. Cleaver, J.W.; Yates, B. Mechanism of detachment of colloidal particles from a flat substrate in a turbulent flow. J. Colloid Interface Sci. 1973, 44, 464–474. [Google Scholar] [CrossRef]
  22. Nearing, M.A. A probabilistic model of soil detachment by shallow turbulent flow. Trans. ASAE 1991, 34, 81–85. [Google Scholar] [CrossRef]
  23. Sharif, A.R.; Atkinson, J.F. Model for surface erosion of cohesive soils. J. Hydraul. Eng. 2012, 138, 581–590. [Google Scholar] [CrossRef]
  24. Al-Madhhachi, A.T.; Hanson, G.; Fox, G.; Tyagi, A.; Bulut, R. Mechanistic detachment rate model to predict soil erodibility due to fluvial and seepage forces. J. Hydraul. Eng. ASCE 2014, 140, 04014010. [Google Scholar] [CrossRef]
  25. Al-Madhhachi, A.T.; Fox, G.A.; Hanson, G.J. Quantifying the erodibility of streambanks and hillslopes due to surface and subsurface forces. Trans. ASABE 2014, 57, 1057–1069. [Google Scholar]
  26. Wilson, B.N. Development of a fundamentally based detachment model. Trans. ASAE 1993, 36, 1105–1114. [Google Scholar] [CrossRef]
  27. Wilson, B.N. Evaluation of a fundamentally based detachment model. Trans. ASAE 1993, 36, 1115–1122. [Google Scholar] [CrossRef]
  28. Khanal, A.; Fox, G.A. Detachment characteristics of root-permeated soils from laboratory jet erosion tests. Ecol. Eng. 2017, 100, 335–343. [Google Scholar] [CrossRef]
  29. Criswell, D.T.; Fox, G.A.; Miller, R.B.; Daly, E.R.; Al-Madhhachi, A.T. Flume experiments to determine the erodibility of gravel streambank soils. In Proceedings of the American Society of Agricultural and Biological Engineers Annual International Meeting 2013, Kansas City, MO, USA, 21–24 July 2013. [Google Scholar]
  30. Criswell, D.T.; Al-Madhhachi, A.T.; Fox, G.A.; Miller, R.B. Deriving erodibility parameters of a mechanistic detachment model for gravels. Trans. ASABE 2016, 59, 145–151. [Google Scholar]
  31. Chepil, W. Equilibrium of soil grains at the threshold of movement by wind 1. Soil Sci. Soc. Am. J. 1959, 23, 422–428. [Google Scholar] [CrossRef]
  32. Einstein, H.A. The Bed-Load Function for Sediment Transportation in Open Channel Flows; USDA Soil Conservation: Washington, DC, USA, 1950; Volume 1026. [Google Scholar]
  33. Partheniades, E. Erosion and deposition of cohesive soils. J. Hydraul. Div. ASCE 1965, 91, 105–139. [Google Scholar]
  34. Einstein, H.A.; El-Samni, E.-S.A. Hydrodynamic forces on a rough wall. Rev. Mod. Phys. 1949, 21, 520–524. [Google Scholar] [CrossRef]
  35. Freeze, R.A.; Cherry, J.A. Groundwater; Prentice Hall: Upper Saddle River, NJ, USA, 1979. [Google Scholar]
  36. Ibrahem, M.M.; Mohammed, A.A.; Jar-Allah, A.T. Kinetics of sulfur, vanadium and nickel removal from basra crude oil hydro treating. Tikrit J. Eng. Sci. 2010, 17, 1–14. [Google Scholar]
  37. Al-Madhhachi, A.T.; Hanson, G.; Fox, G.; Tyagi, A.; Bulut, R. Measuring erodibility of cohesive soils using laboratory jet erosion tests. Presented at the World Environmental and Water Resources Congress 2011: Bearing Knowledge for Sustainability, Palm Springs, CA, USA, 22–26 May 2011; ASCE: Reston, VA, USA, 2011. [Google Scholar]
  38. Wang, Y.; Feng, J.; Lin, Q.; Lyu, X.; Wang, X.; Wang, G. Effects of crude oil contamination on soil physical and chemical properties in momoge wetland of china. Chin. Geogr. Sci. 2013, 23, 708–715. [Google Scholar] [CrossRef]
  39. Richardson, V.; Herath, G.; Kalpage, C.; Jinadasa, K. Physico-chemical characteristic of a petroleum contaminated soil from the spill site of jaffna district. In Proceedings of the 6th International Conference on Structural Engineering and Construction Management, Kandy, Sri Lanka, 11–13 December 2015. [Google Scholar]
Figure 1. Forces and moment lengths in presence of crude oil particles acting on a single soil particle in JET environmental. Variables are defined in the text.
Geosciences 08 00332 g001
Figure 2. The location of the study area (Taji region) and crude oil pipelines in Iraq.
Geosciences 08 00332 g002
Figure 3. Jet Erosion Test (JET) device setup for (a) small-scale and (b) large-scale.
Geosciences 08 00332 g003
Figure 4. Wilson model evaluation using observed date for clean and oil contaminated soils at dry side for (a) small scale and (b) large scale. Note that empty circles represent the observed scour depth of contaminated soil by crude oil, solid circles represent the observed scour depth of clean soil, and solid lines represent predicted scour depth using the Wilson model.
Geosciences 08 00332 g004
Figure 5. Derived b1 and b0 from the “mini” JET device for small scale at three different soil moisture contents for clean and crude oil contaminated soils: (a) parameter b1 and (b) parameter b0.
Geosciences 08 00332 g005
Figure 6. Derived b1 and b0 from the “mini” JET device for large scale at three different soil moisture contents for clean and crude oil contaminated soils: (a) parameter b1 and (b) parameter b0.
Geosciences 08 00332 g006
Figure 7. Comparison between clean soil and crude oil contaminated soil at different contaminated times (1st, 4th, and 8th) days of deriving Wilson model parameters of small scale setup at dry soil moisture content: (a) parameter b1 and (b) parameter b0.
Geosciences 08 00332 g007
Figure 8. Predicting of Wilson model parameters (b1 and b0) of crude oil contaminated soil at different contaminated times (1, 4, and 8) days for small scale at dry soil moisture content: (a) parameter b1 and (b) parameter b0.
Geosciences 08 00332 g008
Table 1. Definition of parameters in the Wilson model obtained from soil contaminated with crude oil.
SymbolsDescriptionValue or EquationReference
CDischarge jet coefficient0.65Mutter et al. [8]
CDDrag coefficient0.2Einstein and El-Samni [34]
cdDiffusion constant6.3Hanson and Cook [3]
CfCoefficient of friction0.00416Hanson and Cook [3]
dEquivalent particle diameter equivalent to d50 0.03 mm Experiments in this study
doOil particle diameter0.03 mmExperiments in this study
e v Coefficient of variation0.35Einstein and El-Samni [34]
fcoDimensionless parameter based on soil and oil cohesionsRanges from 81 to 140Experiments in this study
hPressure head for JET90 cmExperiments in this study
JiJet nozzle height32 mm Experiments in this study
JpPotential core of jet nozzlecd doHanson and Cook [3]
KeExposure of lower particle parameterBased on Wilson model parameter b0 Experiments in this study
KfRatio of projected area drag and lift forces0.92 for equal radii of a spherical particleWilson [27]
KLRatio of drag and lift coefficients along with the ratio of velocities1Wilson [27]
KtFactor of cumulating of instantaneous fluid forces2.5Chepil [31]
kaArea constant of a spherical particleπ/4 for the spherical particleWilson [27]
kddDetachment distance parameter2Einstein [32]
krGeometry ratio for a spherical particlekv/ka = 2/3 for the spherical particleWilson [27]
kvVolume constant of a spherical particleπ/6 for the spherical particleWilson [27]
l1Moment length of gravity downslope0.86 d/2Wilson [27]
l3Moment length of drag force1.18 d/2 Wilson [27]
rJet radius upon maximum jet velocity works0.13 JiAl-Madhhachi et al. [17]
UoVelocity of jet at the orifice C 2 g h Hanson and Cook [3]
wsSubmerged particle weight g ( ρ s ρ w ) k v d 3 Wilson [26,27]
woSubmerged particle weight g ( ρ w ρ o ) k v d o 3 Proposed in this study
ypPivot point a spherical particle d / 2 3 d/2l1 Al-Madhhachi et al. [17]
zdHeight that the drag velocity is acting uponl3 + ypAl-Madhhachi et al. [17]
μ o r Crude oil coefficient ratio Ranges from 18 to 23 Experiments in this study
ρ s Particle density2.65 Mg/m3Freeze and Cherry [35]
ρ o Crude oil density0.88 Mg/m3Al-Madhhachi and Hasan [7], Ibrahem et al. [36]
ρ w Water density1 Mg/m3-
Table 2. Physical characteristics of soils used for the JETs.
Soil TextureAtterberg LimitsStandard Compaction
SourceUSCS classificationSand (%)Silt (%)Clay (%)Liquid limitPlastic limitPlasticity indexMaximum Density, g/cm3Optimum water content (%)
Al-Taji, northwest BaghdadLean Clay1555303826141.8816.00
Table 3. Physical and chemical characteristics of the crude oil used for the JETs.
American Petroleum Institute (API°) Density *Kinematic Viscosity * at 40 °C, mm2/sConradson Carbon Content *, %Sulfur Content *, %Vanadium Content *, ppmNickel Content *, ppmAsh *, %
33.606.904.101.9523.9016.410.01
* Data were taken from Al-Madhhachi and Hasan [7] and Ibrahem et al. [36].
Table 4. Chemical characteristics of clean and crude oil contaminated soil after 1, 4, and 8 days of contamination.
Contamination Time, DayspHElectrical Conductivity (EC), ds/mPb2, ppmTotal Organic Matter, %Organic Carbon, %
0 (Clean soil)7.1423.78461.270.74
17.1817.40891.500.87
47.3119.501021.560.91
87.8119.801351.690.98
Table 5. Crude oil parameters (fco and μ o r ) and the results of the Normality Test (Shapiro-Wilk) between clean and crude oil contaminated soils for the given Wilson model parameters after 1, 4, and 8 days of contamination.
Median Values (IQR) a of Wilson Model Parameters
Clean SoilContaminated Soil
Contamination Time, Daysfco μ o r   b1, Pab0, g/m-s-N0.5b1, Pab0, g/m-s-N0.5p-Value of b1p-Value of b0
181.0018.6725.5 (4.7)942.5 (827.2)30.4 (5.2)133.4 (70.7)0.5050.278
4140.0023.0324.1 (2.0)290.8 (10.0)48.9 (34.3)11.8 (5.1)0.4020.006
8140.0023.0418.3 (2.0)208.8 (4.0)31.9 (2.6)18.0 (16.3)0.0130.021
Note: p-values > 0.05 indicate that there is no statistically significant difference. a IQR = interquartile range, defined as the difference between the 25th and 75th percentiles.

