Article

A Multi-Scale Conceptual Model of Flood-Tide Delta Morphodynamics in Micro-Tidal Estuaries

by
Timothy P Austin
1,*,
Ana Vila-Concejo
2,
Andrew D Short
2 and
Roshanka Ranasinghe
3,4,5
1
Coastal and Regional Oceanography Lab, School of Mathematics and Statistics, University of New South Wales (UNSW), Sydney, NSW 2052, Australia
2
Geocoastal Research Group, School of Geosciences, University of Sydney, Sydney, NSW 2006, Australia
3
Harbour, Coastal and Offshore Engineering, Deltares, 2600 MH Delft, The Netherlands
4
Department of Water Science and Engineering, Institute for Water Education, IHE DelftPO Box 3015, 2601 DA Delft, The Netherlands
5
Water Engineering and Management, Faculty of Engineering Technology, University of Twente, 7500 AE Enschede, The Netherlands
*
Author to whom correspondence should be addressed.
Geosciences 2018, 8(9), 324; https://doi.org/10.3390/geosciences8090324
Submission received: 30 July 2018 / Revised: 16 August 2018 / Accepted: 23 August 2018 / Published: 29 August 2018
(This article belongs to the Special Issue Coastal Geomorphology)

Abstract

:
Wave and tide induced sediment transport pathways and rates govern the morphological evolution of estuarine systems. An understanding of the morphodynamics of these systems is required to maintain their commercial, biological and recreational value. The morphodynamics of Port Stephens estuary, a micro-tidal estuary located on a wave dominated southeast coast of Australia were investigated using bathymetric surveys and current velocity data from several locations over the estuary. This provided detailed insight into the rates and direction of movement for the main sedimentary features of the system, and how these features interact with the processes that drive their evolution. We used these findings to develop a conceptual model for estuarine morphodynamics that accounts for fair weather and storm conditions. Our model explains how sediment eroded from the estuarine beaches is trapped by the adjacent flood-tide delta. The model is applicable to fetch-limited estuaries that do not have offshore sources of sediment, where the tidal currents are weak in relation to the incident ocean waves, and that have a wide, stable entrance through which ocean waves can propagate into the estuary. The model is multi-scale in that it encapsulates both short-term and local process, and large scale evolution of an estuary; therefore, it represents a tool that may be used in developing sustainable estuary management strategies.

1. Introduction

Estuaries occur as part of coastlines worldwide and represent a complex and dynamic interaction of coastal geology with river, wave and tidal processes. They represent environments of biological, sedimentologic and economic significance and have been the focus of numerous studies covering the vast array of river, wave and tidal conditions across a range of geological configurations. One common trait unifying all modern estuaries is their age, having formed as a consequence of sea level rise during the Post-Glacial Marine Transgression which, in south east (SE) Australia, involved the rapid rise of sea level by 150 m from 17,000 years ago [1]. Present sea level occurred approximately 7900 years ago, reaching a peak of +1.5 m above present level 7400 years ago and gradually declining to present level from 2000 years ago [2]. SE Australia coastal environments have been adjusting to these changes in sea level, with estuaries generally experiencing infilling [3]. The present-day morphology is a consequence of the estuary specific characteristics consisting of: (i) geological inheritance which determines the size and shape of the estuary as well as the sediment characteristics and availability; and (ii) morphodynamic factors including tidal currents, ocean waves and river discharge which are responsible for the transport and deposition of sediment into, and out of the estuary.
Tidal deltas are sedimentary deposits that are formed and shaped by tidal currents and waves occurring on the landward and seaward sides of tidal inlets [4,5,6]. A flood-tide delta (FTD) is a sediment deposit occurring on the landward side of tidal inlets and is formed and modified by incoming flooding tidal currents and ocean waves [7]. Sediment sources include fluvial, marine (continental shelf), terrestrial (aeolian), estuary/tidal inlet margins and biological activity within the system [8]. Ebb-tide deltas (ETDs) are similarly formed sediment deposits on the seaward side of tidal inlets. Collectively, FTDs and ETDs represent a significant component of coastal sediment budgets [9,10].
Tidal inlets have been comprehensively studied due to their economic and recreational importance as navigational pathways, dominant features in the coastal sediment budget and their role in biological systems with regard to the transfer of water and biological material into and out of backbarrier/estuarine systems [11,12,13,14,15,16,17]. ETDs have also been relatively well studied for the above reasons in relation with inlet and nearshore stability [18,19]. FTDs are considered less dynamic features due to their exposure to lower energy levels as a result of the tidal inlet restricting tidal and wave processes. The general morphology of FTDs was studied by Hayes [7] and Boothroyd [4] but few studies have considered the influence of FTDs on estuarine morphology and the links with estuarine shorelines, including beaches [20].
Estuarine beaches have been identified under several names in the literature including low energy, sheltered, protected, or fetch-limited beaches with no clear delineation of morphology or hydrodynamics between the different nomenclatures. Estuarine beach morphology is influenced by locally and non-locally (offshore) generated waves in combination with the tidal range [21,22]. Beach profiles are typically characterised by narrow, steep beach faces which are often fronted by low gradient flats. Post-storm recovery is generally limited due to the low levels of energy during non-storm conditions; subsequently, the morphology of estuarine beaches typically incorporates residual storm morphology [22,23,24]. The complex nature of these systems highlights the need for an understanding of not only shoreline processes on the estuarine beaches but also the relationships with adjacent environments such as the FTD [23].
This paper presents hydrodynamic and morphologic measurements over a FTD; it develops a conceptual model which integrates the short-to medium-term FTD morphodynamics with adjacent estuarine beach morphodynamics. Our conceptual model is an integrative approach to two interacting systems that have typically been studied in isolation in the past, taking into account the sources, sinks, and pathways of sediment transport and the forcing mechanisms that drive these relationships. Our model can be applied to designing informed management strategies that incorporate the long-term evolution of the system, and provides a framework that encompasses the entire system within which more detailed and specific studies can be undertaken.

2. Study Area

Port Stephens is a 140 km2 drowned river valley estuary (Ria), located on the mid-north New South Wales (NSW) coast, 230 km north of Sydney, Australia (Figure 1a). Tides within the estuary are mixed semidiurnal and microtidal with a predicted mean spring tidal range of 1.67 m and mean neap tidal range of 0.79 m [25]. The estuary entrance is 1.2 km wide, rock-bounded, southeast-orientated, and varies in depth from less than 10 m to greater than 20 m. The estuary opens into a wide eastern basin, 4 km wide by 10 km long, separated by a narrow 800 m wide channel from a western near circular basin of approximately 5 km diameter (Figure 1a). This paper focuses on the eastern basin (Figure 1b). The dominant features of the eastern basin include Jimmy’s Beach and Winda Woppa Spit, which form the sandy northern shoreline that extends westward from the entrance headland and terminates with the Myall River entrance (Figure 1b). The Myall River behaves as a tidal channel [26] and has little influence on the morphology or hydrodynamics of the eastern basin evident through the ongoing westward growth of Winda Woppa spit and infilling of the river entrance [27]. The southern shoreline of the eastern basin is delineated by Shoal Bay, a 1.9 km long curved embayed beach confined by the southern entrance headland at its eastern extent and Nelson Head at its western extent [28]. The morphology of the eastern basin is dominated by a 22.5 km2 FTD that includes a flood ramp, flood channels and a prominent ebb shield at its western end (Figure 1b). The depth of the eastern basin is typically less than 6 m over the FTD, with some shoals being exposed on low spring waters, and can exceed 20 m at the deepest points over the channels (Figure 1c,d). Sediment across the FTD ranges from fine to coarse sand with carbonate contents as high as 30% [29]. The orientation of the estuary entrance exposes the eastern basin and its shorelines directly to swell propagating from 70° to 180° [23]. The NSW coastline is characterised by a moderate to high energy swell regime with 63% of swell in the range of 1–2 m, and a further 21% in the 2–3 m range occurring mainly in late summer and early-to-mid winter [30]. The wind climate of the region is characterised by summer afternoon sea breezes from the northeast through to the southeast reaching velocities of 12 m/s and winter westerlies to southwesterlies that exceed 12 m/s [29].

3. Methods

This section outlines the methods used in this paper to characterize wind and waves, flood tide delta hydrodynamics, and the morphological change over the FTD. These methods have been applied to assess morphological change over the period 2007–2010 and to identify sediment transport paths and processes.

3.1. Wave and Wind Climate

We used offshore wave data from the Sydney buoy, which is 150 km southeast from Port Stephens, 11 km offshore and in 80 m water depth. It is generally accepted that the Sydney data accurately represents the Port Stephens offshore wave climate [31,32]. We used hourly significant wave height ( H s ) , peak wave period ( T p ) and wave direction. On the NSW coast, a storm event is defined as having H s > 3 m for any duration and greater than one day between occurrences to define separate events [33,34]. We calculated wave power ( P , N/ms) to characterise the offshore wave climate using standard linear wave theory:
P = E C g
where E is wave energy density (N/m2) and C g is the wave group velocity (m/s).
We approximated the erosion potential of storm conditions by calculating the cumulative energy, E c (MJh/m2), as adapted by Harley et al. [35].
E c = 1 16 ρ g Δ t i = 1 N H i 2
where N is the number of data points i ( H i > 3 m), ρ is the water density (kg/m3), g is the gravitational acceleration (m/s2), Δ t is the temporal resolution of the dataset and H is the wave height (m).
We obtained wind data from a station located only 35 km south from Port Stephens; previous studies have shown that there is a good correlation with data obtained in situ indicating a 5° medial directional difference and good correlation of velocities below 15 m/s ([31]). We obtained average and peak wind conditions between January 2007 and March 2010 from the daily 09:00 and 15:00 10 min average wind velocities and directions.
We used the United States Geological Survey (USGS) Fetch- and Depth- Limited Wave Height and Period web based applet [36] to predict the characteristics of locally generated wind waves. This method is based on methods outlined in the USACE Shore protection manual [37].

3.2. Flood Tide Delta Hydrodynamics

We undertook hydrodynamic measurements to characterize the flow patterns over the FTD, specifically with regard to the potential for sediment exchange with the shorelines. We undertook a total of nine non-simultaneous deployments of bottom mounted Acoustic Döppler Current Profiler (ADCP). We also measured the spatial variability using boat mounted ADCP transects. Water velocity measurements from both the bottom mounted and boat mounted transects from similar spring tidal cycles were combined to create snapshots of the water circulation patterns throughout a tidal cycle.

3.2.1. Bottom Mounted Measurements

We deployed a bottom mounted RD Instruments (RDI) 1200 kHz Workhorse Sentinel Acoustic Döppler Current Profiler (ADCP) and a SonTek 1500 kHz Acoustic Döppler Profiler (ADP) over 13 months (November 2007 to December 2008) at nine locations across the FTD (Figure 1b and Table 1). The instruments were installed simultaneously for the first three deployments covering six locations and individually at the remaining three sites for between 20 and 122 days. We chose the location of the deployments to ensure representation of the different morphological units over the FTD. The instruments sampled at their maximum rate (RDI, 2 Hz; and SonTek, 9 Hz) continuously for 10 min every 30 min. Each 10 min period was averaged, resulting in a single profile. Profiles consisted of the current direction and velocity averaged over 0.25 m vertical increments (bins).
Profile data were depth-averaged to calculate an average current speed ( U ¯ ) using the trapezium method of integration as defined by Soulsby [38]:
U ¯ = 0.5 h   [ U 1 z 1 + ( i n ( U i + U i + 1 ) ( z i + 1 z i ) ) + ( U n 1 + U n ) ( z n + z n 1 ) + 2 U n ( h z n ) ]
where U i is the current speed at height z i , assuming that the current speed at the sea bed is zero ( z = 0 ) and the current speed at the highest measured point is equal to the current speed at the water surface ( z = h ).
The depth-averaged current direction was calculated using the vector-averaged velocities and did not integrate over the unmeasured areas as done with the velocity. The depth-averaged current velocities were divided into flood and ebb flows (based on flow direction) and assigned positive and negative values, respectively. We then calculated summary statistics including mean velocity, maximum velocity, maximum duration and mean duration.
The critical velocity for sediment entrainment ( U c r ) at 1 m above the bed under steady flow (i.e., wind induced or tidal currents) was calculated using Equations (4) and (5) where the critical bed shear stress ( τ c r ) is:
τ c r = θ c r g D ( ρ s ρ )
and the critical velocity for sediment entrainment ( U c r ) is:
U c r , = τ c r ρ C d
where θ c r is the critical Shields’ Parameter (Appendix A), g is the gravitational acceleration (9.8 ms−2), ρ is water density (1027 kg/m3), ρ s is the sediment density (2650 kg/m3), and C d is the dimensional fluid drag coefficient which is approximately 0.0061 for a rippled sand bottom [38].
We assumed the percentage of current observations above U c r to be representative of the duration of sediment entrainment at each of the ADCP locations. We then used a modification of Black and co-workers’ [39] residual distance to determine the direction and magnitude of the residual sediment transport at each deployment, which is the difference between the flood and ebb velocities above a threshold value cubed, multiplied by the duration above the threshold.

3.2.2. Vessel-Mounted Transect Measurements

We assessed the spatial variability of currents by surveying two transects using a vessel-mounted 1500 kHz SonTek ADP: one across the FTD (Nelson Head Transect, Figure 1b,c); and another across the entrance to the estuary (Entrance Transect, Figure 1b,d). Transects were surveyed from alternating sides of the estuary every 30 min at the entrance (taking 15 min to complete one transect) and every 60 min across the Nelson Head transect (taking 30 min to complete one transect) for a single tidal cycle (ebb/flood) (Table 2). The entrance transect was surveyed three days after the peak spring tidal range, with an ebb tidal range of 1.54 m and a flood tidal range of 1.34 m. The Nelson Head transect was measured three days prior to the spring/neap cycle maximum with an ebb tidal range of 1.56 m and a flood tidal range of 1.04 m. Wind conditions were mild (<5 m/s) for both transect measurements. Sampling was set at the maximum rate (9 Hz), recording a profile (ensemble) every 5 s with 0.25 m bins covering a maximum depth of 25 m. The standard deviation of the measured horizontal velocities due to instrument noise and thus the expected accuracy of the velocity data were calculated using the instrument sampling parameters following SonTek [40]. The predicted standard deviation was 0.01 m/s; using either a larger cell size and/or longer averaging interval will lower this value, increasing the expected accuracy. Residual distances for the boat-mounted transects were also calculated as for the bottom-mounted ADCP measurements.
We defined morphological zones for each transect based on the morphology obtained from the ACDP bottom track data (Figure 1c,d) and calculated depth-averaged velocities and current directions for each zone. We subsequently analysed the trends along the transects in terms of the depth-averaged velocities and their relationship with either depth or morphology.
  • From south to north, we identified six zones in the Nelson Head transect (Figure 1c). Zone 1 is a 700 m wide, >25 m deep “U” shaped channel. Zone 2 represents the ebb shield and gradually deepens from ~3 m adjacent to the channel to ~7 m. Zone 3 is a narrow (300 m) and shallow (2 m) channel. Zone 4 is a gradual shallowing shoal from 7 m to 5 m. Zone 5 is another small channel of approximately 2 m depth and 200 m width. Zone 6 represents a gradual shallowing to the shoreline over approximately 500 m.
  • From south to north, we identified three zones in the entrance transect (Figure 1d). Zone 1 is a 200 m wide channel, reaching a depth of 12 m. Zone 2 is characterised by a gentle depression that covers approximately 600 m and reaches a depth of approximately 14 m before rising to about 8 m. Zone 3 is a 400 m wide, >20 m deep “V” shaped channel.

3.3. Bathymetric Measurements

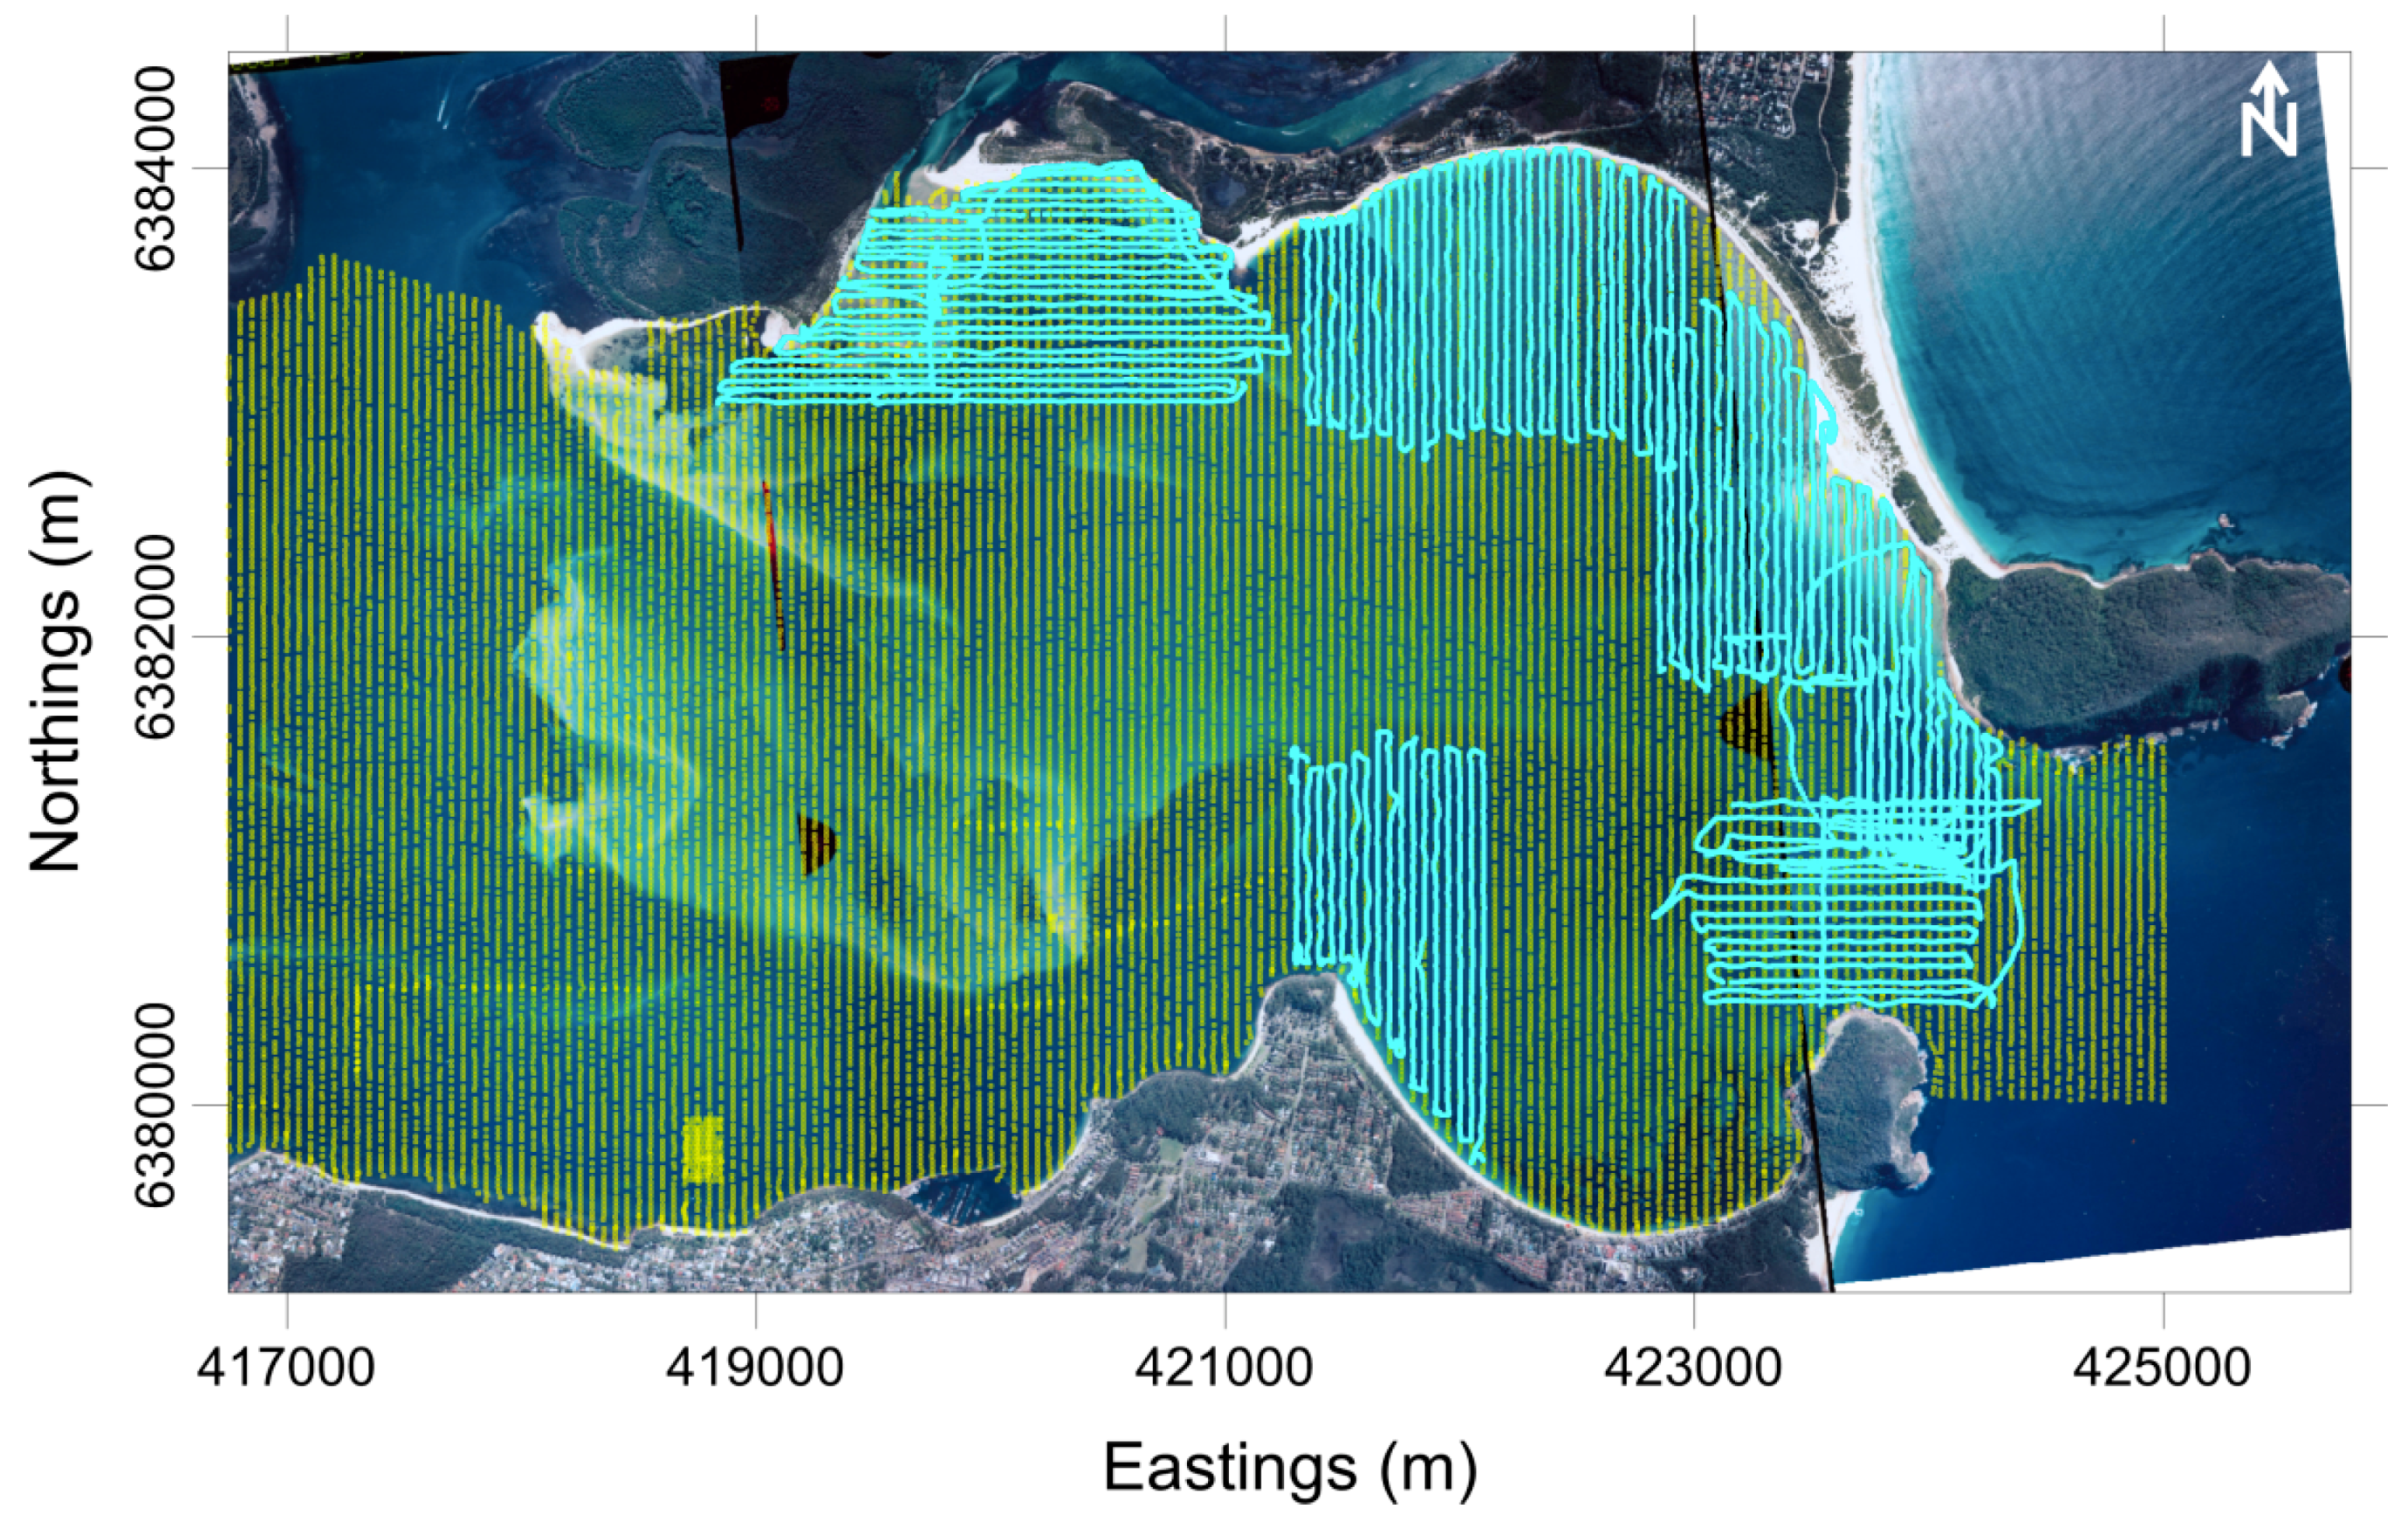
With the objective of quantifying net volumetric changes and the rate of change in the morphology, we measured bathymetry on two occasions in October 2007 and January 2010. The first survey, by the New South Wales Office of Environment and Heritage (OEH) in October 2007 covered the entire eastern basin (Figure 2) and was collected using an Odom Echotrac MKIII single beam echo sounder (8° beam angle) with horizontal positioning using an Omnistar 3200 LRS—differential GPS. A heave sensor was used to correct for vessel motion and tidal corrections were done using local tide gauges. The survey was undertaken along north–south transect lines with 50 m spacing from the entrance to the western extent of the FTD. Survey points were measured every 20 m along the transect lines.
We undertook a second bathymetric survey from 29 January to 2 February 2010, focusing on areas of specific interest. Instrument configuration included a CEESTAR digital single beam echo sounder and a Trimble R8 Real-Time Kinematic-Global Navigation Satellite System (RTK-GNSS) for horizontal and vertical positioning with horizontal and vertical accuracy limits set at 0.03 m and 0.05 m respectively. Survey transects were conducted along either a north–south or east–west axis, depending on the main bedform orientation. The transects followed as accurately as possible the 2007 bathymetric survey. Transects were spaced 50 m apart with data points sampled approximately every 3 m (depth measurements sampled at 6 Hz and averaged every second). Horizontal accuracy for both surveys were estimated to be less than 1 m and vertical accuracy to be ±0.05 m.
All survey data were interpolated to a 25 m × 25 m grid using SURFER v.9.4.5 (Golden software, Golden, CO, USA) and the Kriging method. An ominidirectional linear variogram was set with a 200 m search radius in four sectors with a minimum of four data points required; anisotropy had a ratio of 0 (circle search). An assessment of the gridded versus raw data residuals (a measure of how close the interpolated (gridded) data are to the original survey points), for all surveys have a mean residual of 0 with the exception of the erosion zone and the channel survey areas, which for 2010 had mean residuals of 0.01 and 0.02, respectively. An error margin of ±0.15 m was applied to all interpolated points to account for errors in both the data collection methodology and interpolation procedures [41]. We then calculated volume and area changes using the volume function in SURFER v9.4.5, ignoring any areas where vertical differences between gridded surfaces were less than ±0.15 m.

4. Results

This section outlines the results from the measurements undertaken at Port Stephens between 2007 and 2010. The analysis of the results indicates potential forcing mechanisms prior to the surveys undertaken in 2007 and 2010 and establish the generalized tidal flow patterns across the FTD.

4.1. Wind and Wave Climate

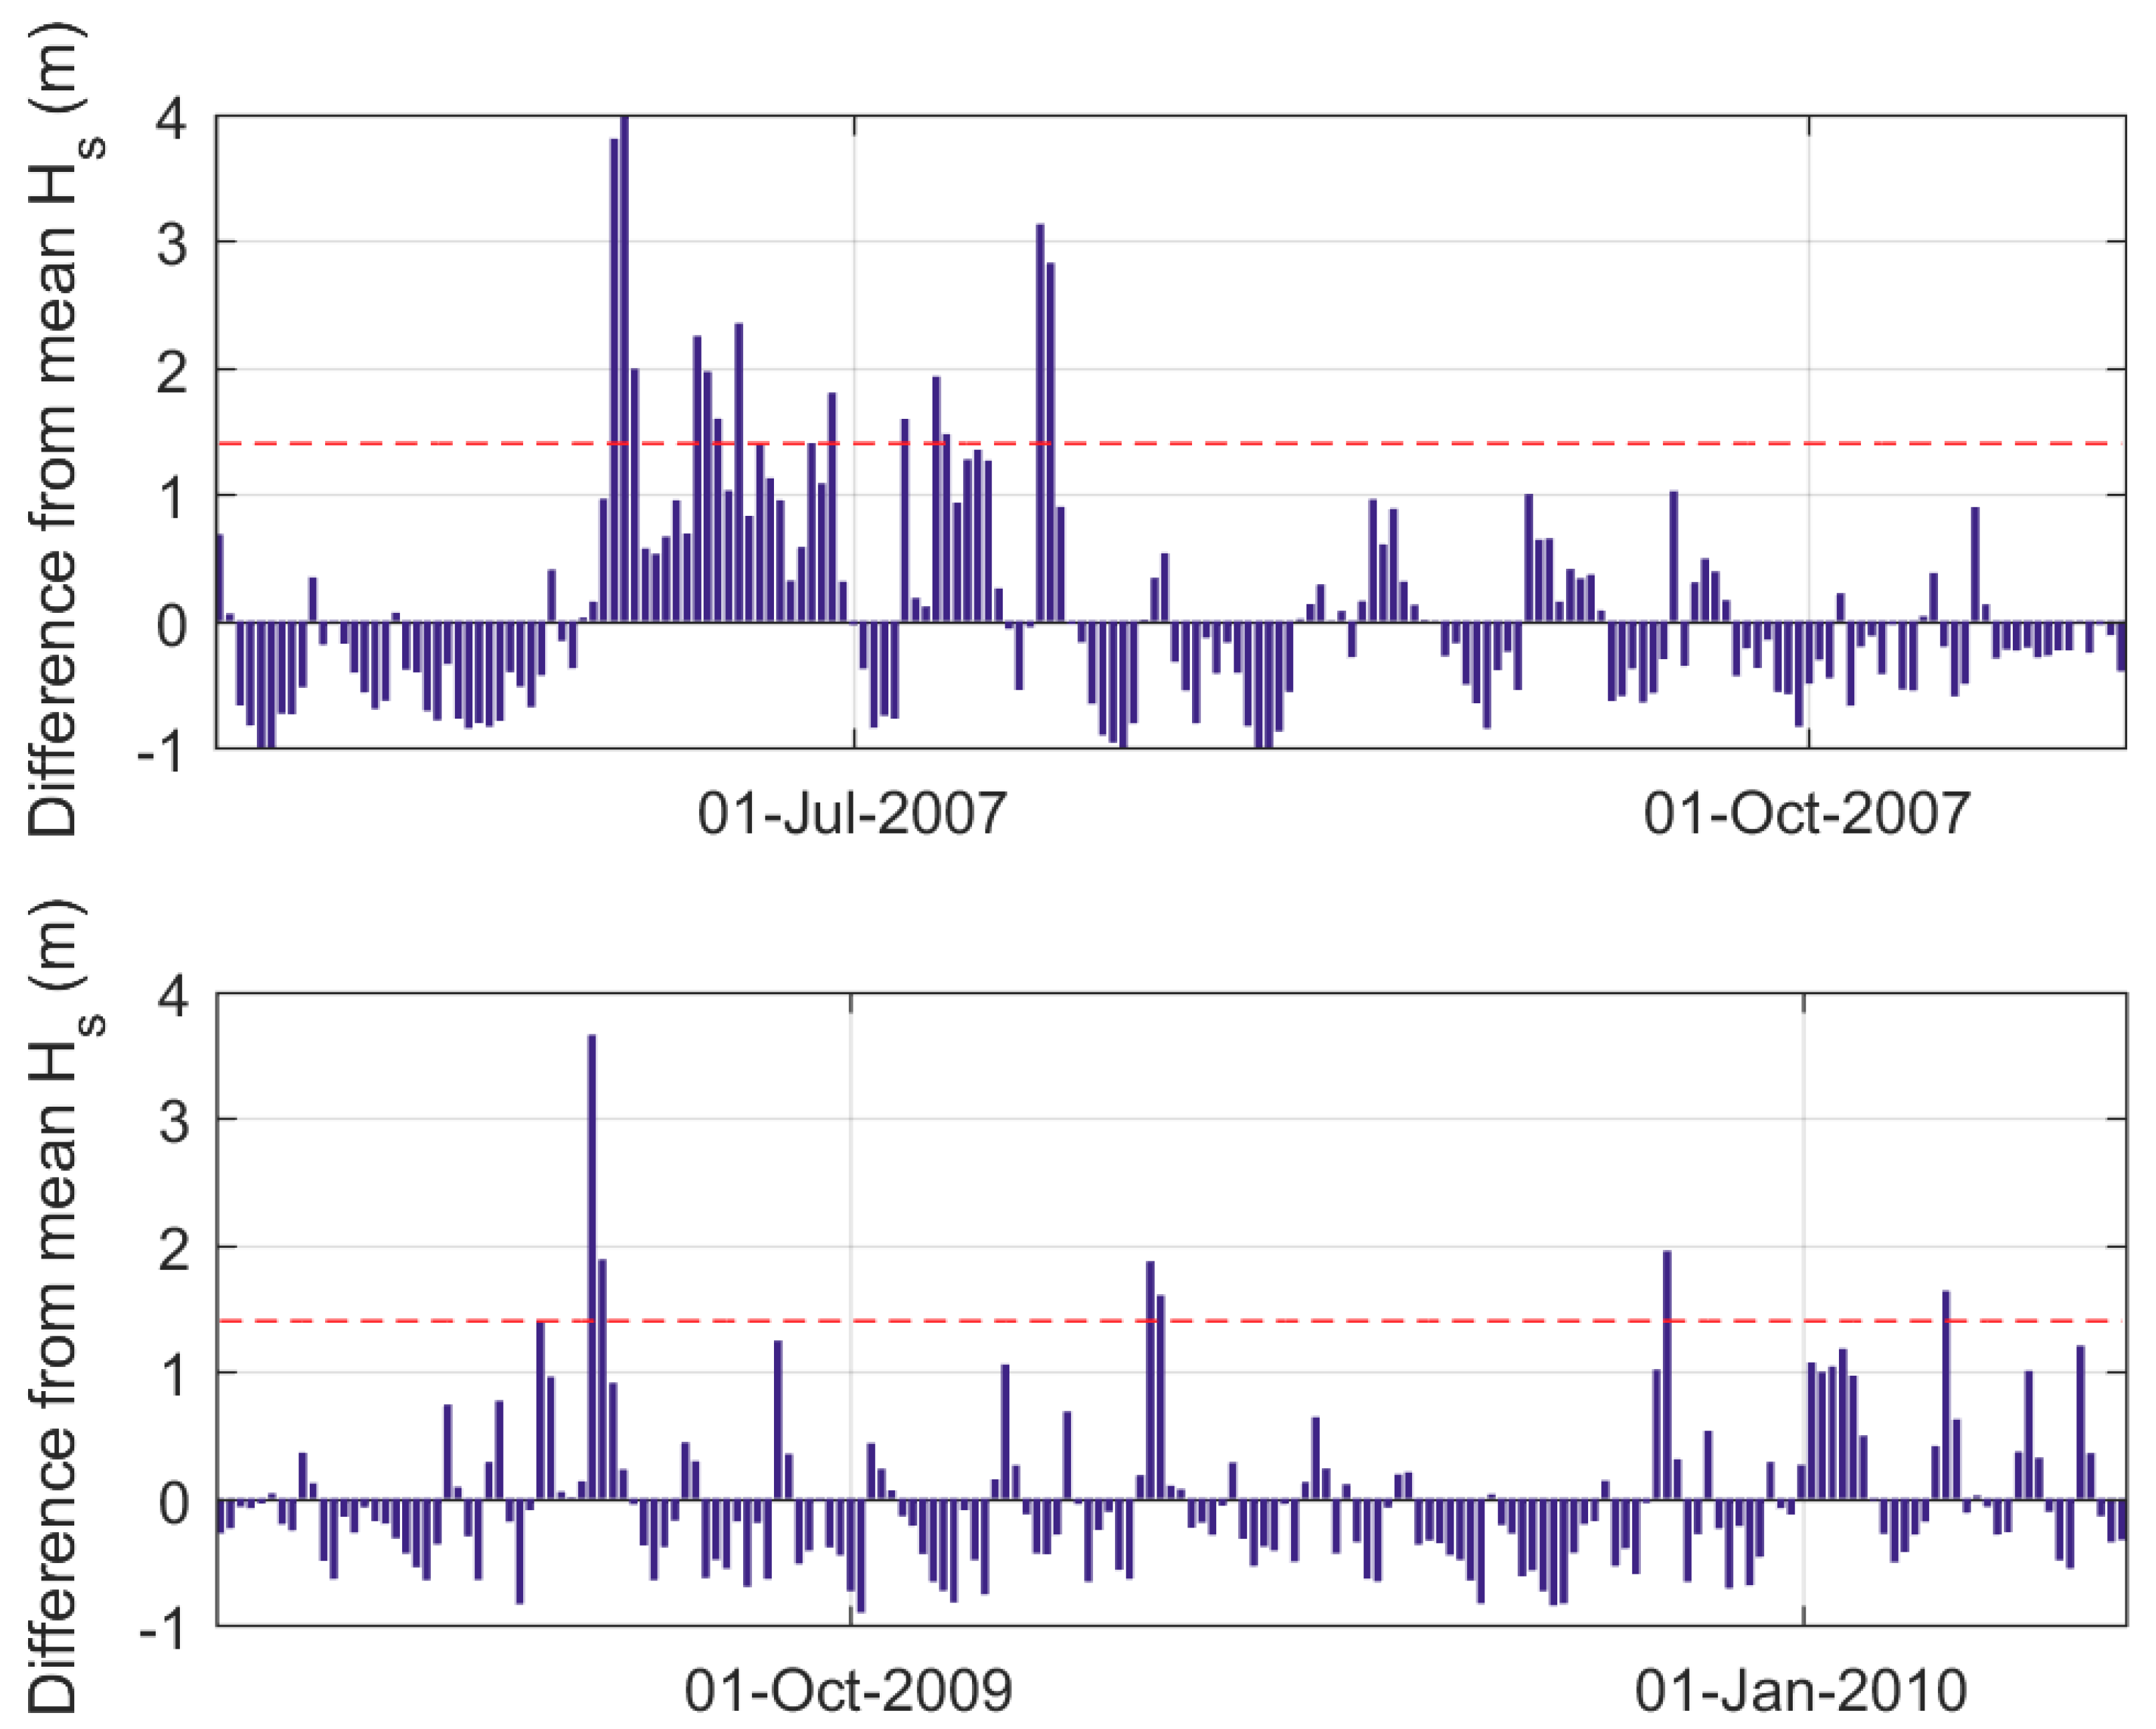
We analysed hourly wave data for the six-month period prior to each of the bathymetric surveys to characterize the frequency and magnitude of storm conditions. Fifteen storms occurred prior to the 2007 survey, compared to just 7 in 2010 (Table 3 and Figure 3). Total cumulative energy of the storms leading up to the 2007 survey was more than three times that prior to the 2010 survey (Table 3). The storm with the largest cumulative energy occurred during the pre-2007 survey period, almost twice that of the largest storm recorded leading up to the 2010 survey. Therefore, the six months before the 2007 survey can be classified as a high-energy period for our study area; on the contrary, the six-month period before the 2010 survey had typical high-frequency low-energy storms and can be considered as a fair-weather period in our study area.
Wind characteristics (average and peak) for the study period January 2007 to March 2010 indicate that the most frequent wind directions were from the northwest (22%) followed by west and southeast equally at 17%. The highest frequencies of conditions >10 m/s were from the west and northwest at 1.5 and 1.4%, respectively. The highest percentage of winds of 5–10 m/s were from the southeast (12%). The average wind velocity across all wind directions was 5.4 m/s, with the peak wind velocity observed from the southeast at 18.1 m/s followed by winds from the west at 17 m/s. The maximum fetch for Jimmy’s Beach (northern shoreline) is 8000 m from the west and 5200 m from the northwest for Shoal Bay [42]. Using peak and average wind velocities for these two directions, the maximum predicted wave height for Jimmy’s Beach during the study period was 0.9 m with a period of 3.1 s compared with a predicted wave height of 0.6 and 2.7 s for Shoal Bay. For average wind conditions, wave height and period drop to 0.3 m at 2.1 s for Jimmy’s Beach and 0.2 m at 1.7 s for Shoal Bay.

4.2. Spring Tidal Cycle Circulation

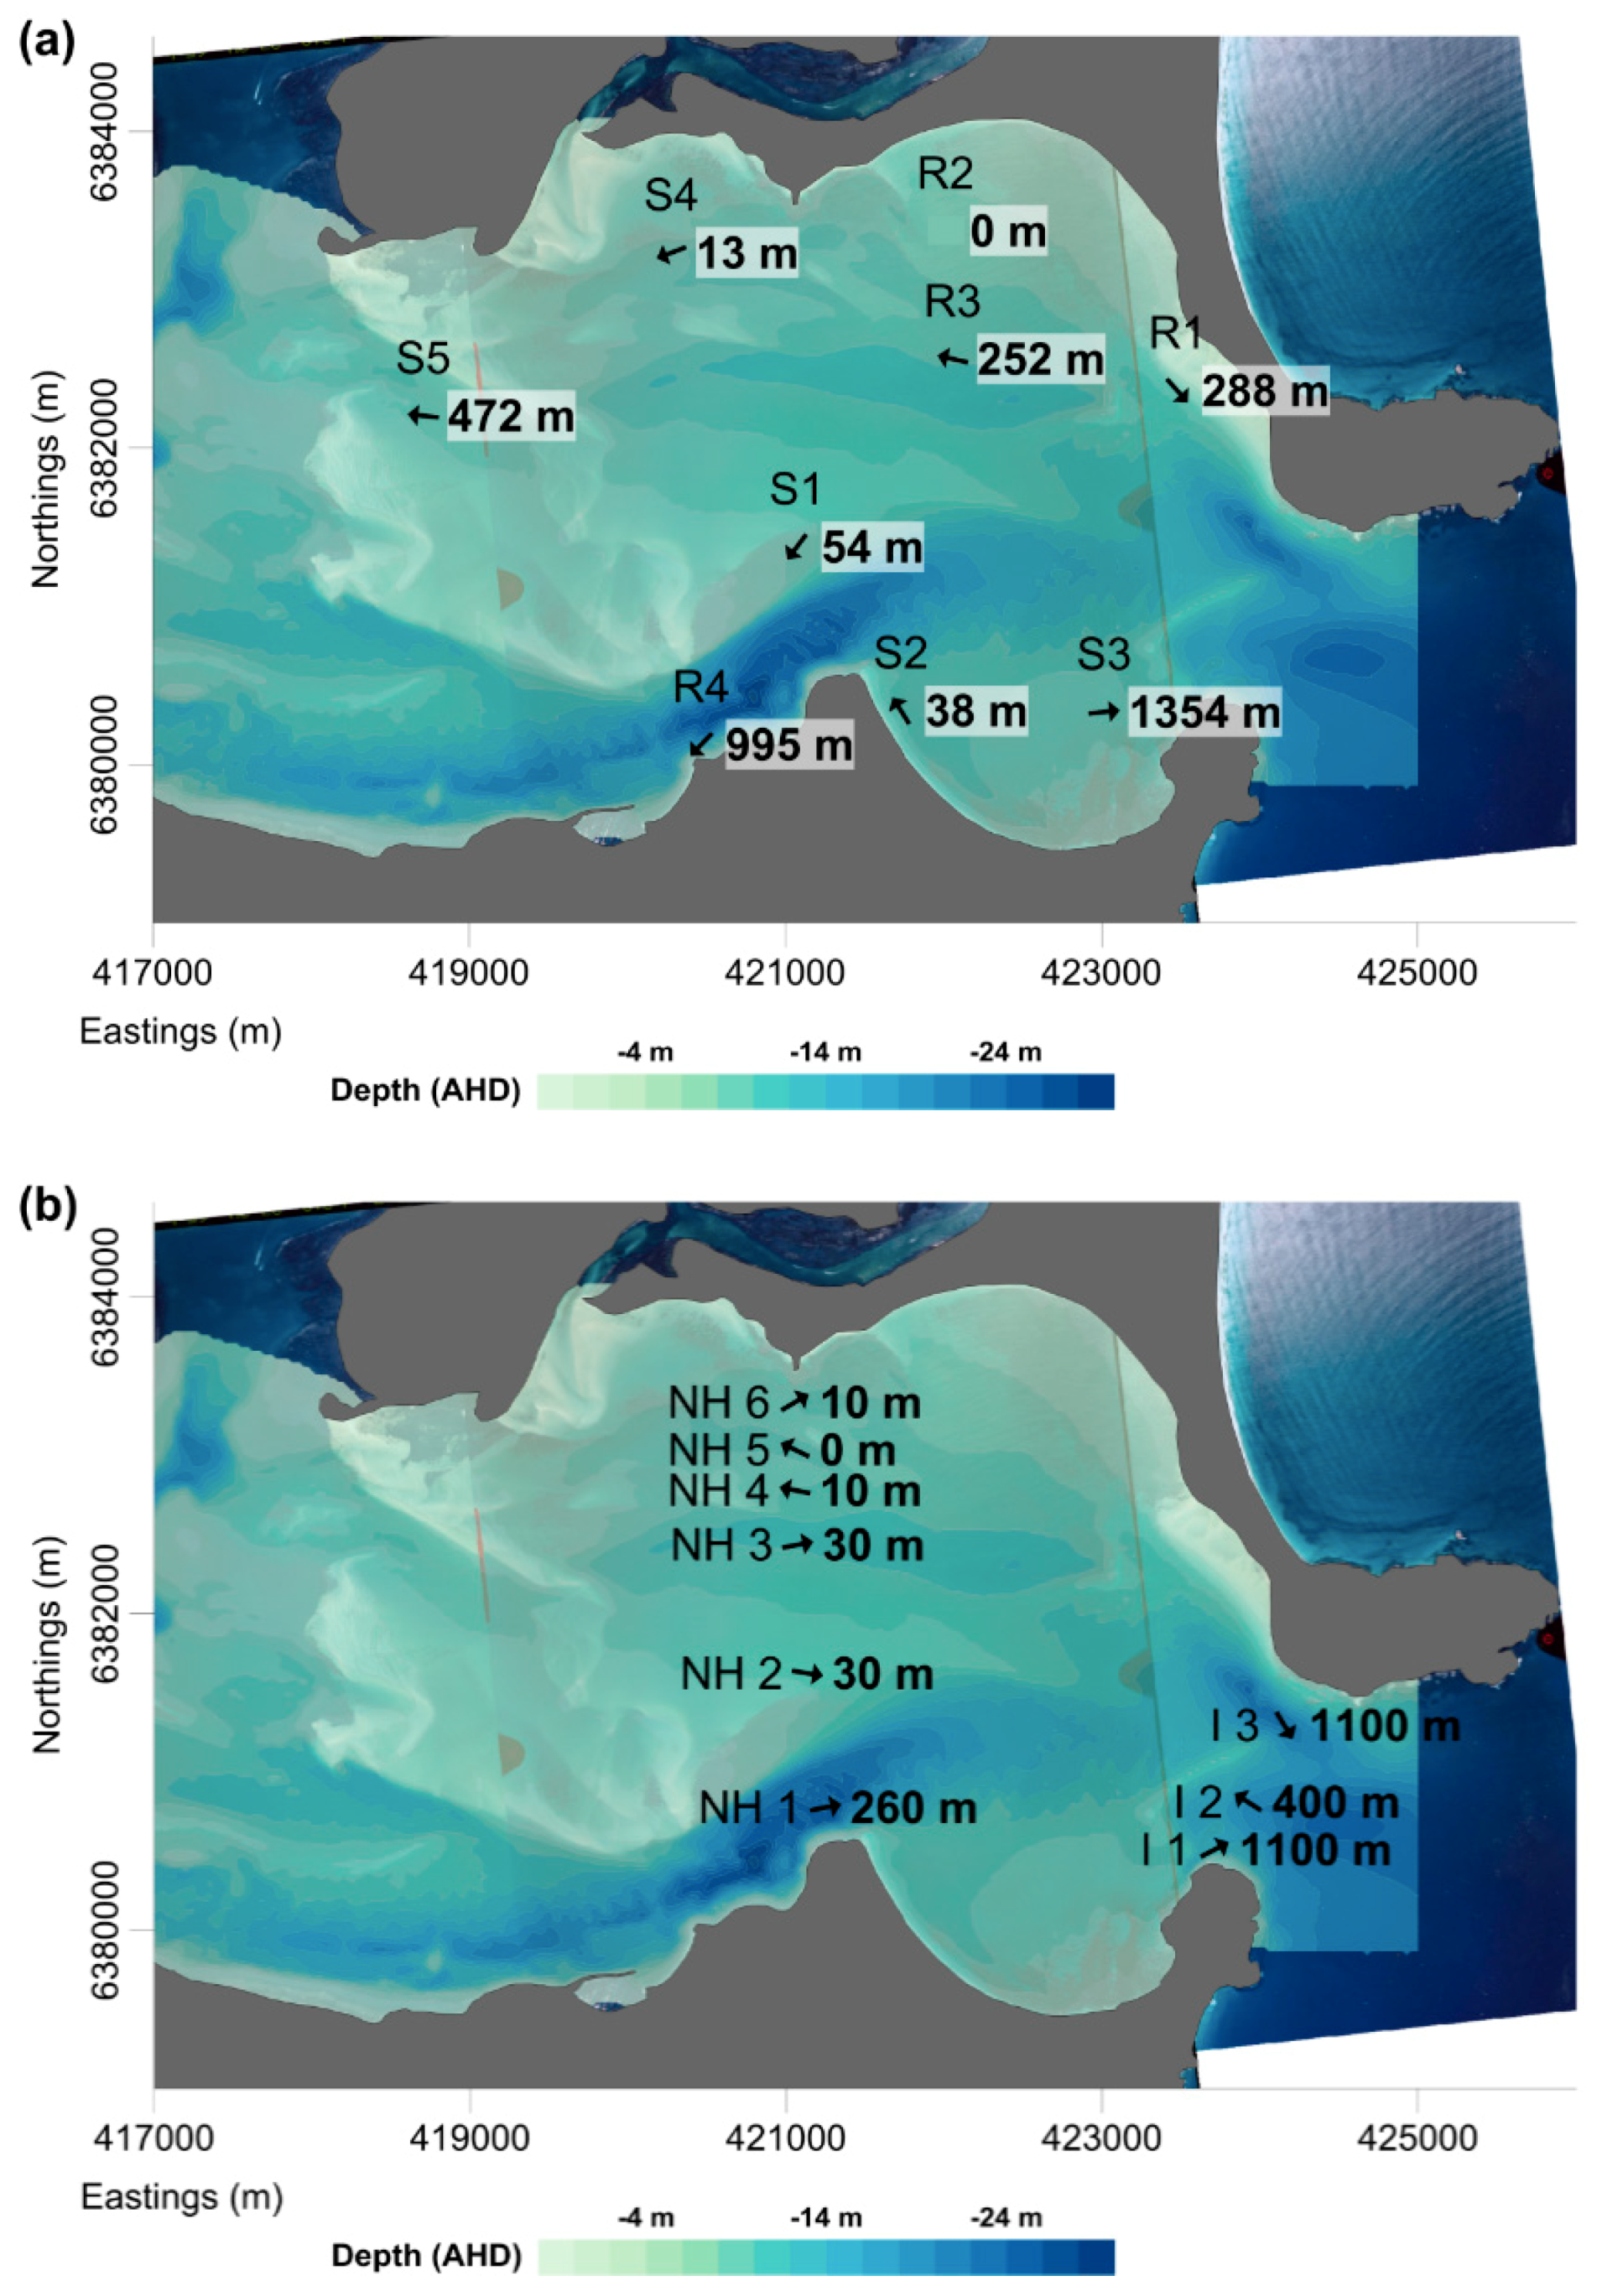
The residual distance provides the net distance (m) a particle would travel from its origin over a spring-neap tidal cycle (or the time period sampled) if it was acted on uniformly by the conditions observed at its origin. The velocity above the threshold velocity is cubed due to the established relationship between velocity cubed and sediment transport and reflects that a small difference in velocity between tidal stages will generally outweigh small differences in duration [43]. The residual distance was calculated over a spring-neap tidal cycle for each of the nine bottom-mounted ADCP deployments.
The residual distances obtained with the bottom-mounted deployments ranged from 0 to 1350 m with all deployments showing flood dominance with the exception of those adjacent to the entrance (R1 and S3) (Figure 4a). This indicates that generally the net movement of sediment under tidal currents alone over a full spring-neap cycle are expected to be ebb directed at the entrance and flood directed over the FTD.
The residual distance values for the entrance transect display equal ebb dominance in the southern and northern channels (Figure 4b, I1 and 3) and are approximately three times the value of the flood dominant value observed in the middle zone (Figure 4b, I2). The Nelson Head transect residual distances are an order of magnitude smaller than those measured at the entrance transect and generally decrease from the southern shoreline to the northern shoreline. The main channel (NH 1) has the largest residual distance of the transect (260 m), with the remaining zones all displaying significantly lower values not exceeding 10% of the main channel value. The secondary channel adjacent to the northern shoreline (Figure 4b, NH 5) shows no net transport potential with a residual distance of 0 m. The next zone south of this (Figure 4b, NH 4), which represents an inter-channel shoal is flood dominant, albeit very weakly with a residual distance of 10 m. All other zones (Figure 4b, NH 2, 3 and 6) display ebb dominance with residuals distances between 3 and 26 m, with the largest values adjacent to the main channel. It is important to note that the transects in this study whilst representing the spatial distribution of tidal flows, only represent a “snapshot” of tidal conditions and are subsequently influenced by diurnal inequalities in the tidal ranges, which for both transects resulted in larger ebb tidal ranges.

4.3. Bathymetric Changes

4.3.1. Entrance Shoal Survey Section

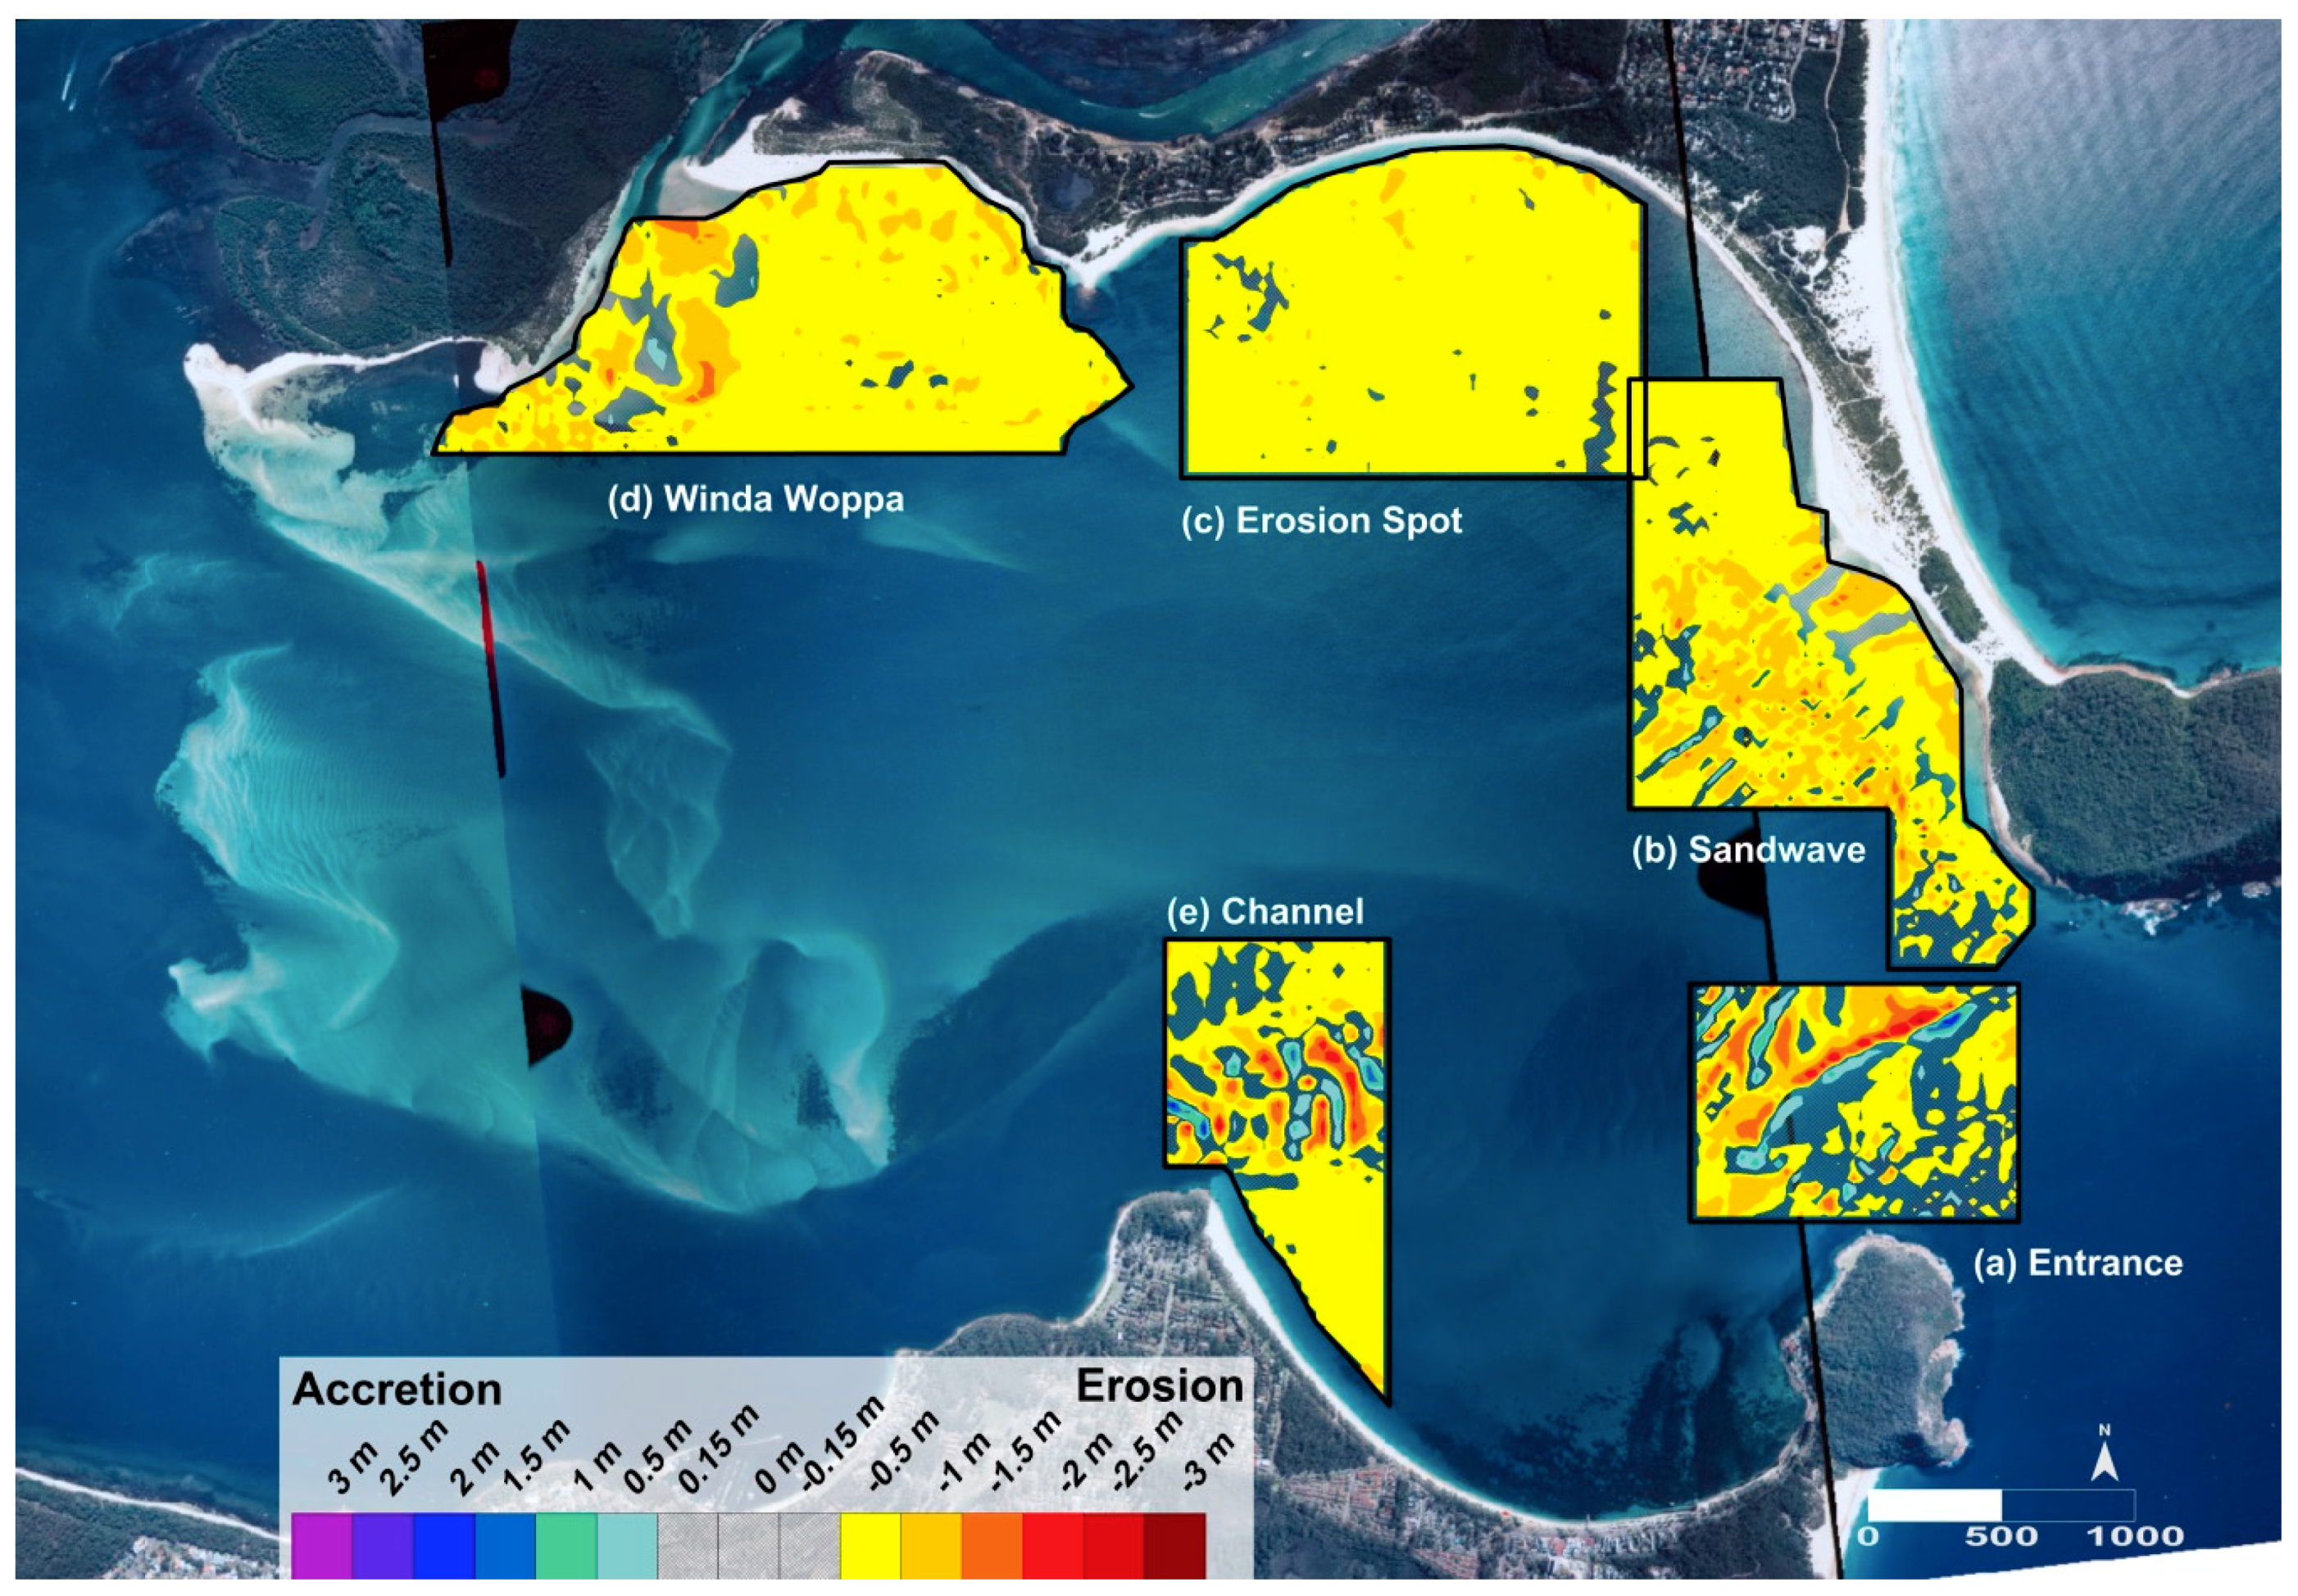
The entrance shoal survey section (Figure 5a) experienced a net loss of 134,000 m3 between 2007 and 2010 which is equivalent to an average vertical change of −0.07 m/year (Figure 5a). The most dynamic regions were the sand waves west of the shoal and the shoal itself. The alternating pattern of erosion and accretion west of the shoal implies easterly migration of the sand waves. The shoal has similarly undergone an eastward migration of approximately 25 m (~10 m/year). The majority of this change has occurred through the lowering of the western face of the shoal and has resulted in the crest of the shoal being eroded by 0.45 m (0.20 m/year).

4.3.2. Sand Wave Survey Section

Net erosion was observed for the period between 2007 and 2010 with 313,000 m3 of sediment lost from the area (Figure 5b) at an average bed elevation change of −0.10 m/year. Erosion was the most prominent in a shore-parallel channel and adjacent to the shoreline, southeast of a shoreline-attached sand wave. West of the channel, a pattern of alternating erosion and accretion indicated sand wave migration. Dredging on the western side of the shoreline-attached sand wave including subtidal, intertidal and supratidal areas occurred in July/August 2009, removing an estimated 50,000 m3 [44]. The dredge hole was excluded from our analyses due to insufficient pre- and post-dredging surveys and uncertainties in data interpolation near boundaries.

4.3.3. Jimmy’s Beach Erosion Survey Section

As the name implies, this area (Figure 5c) is characterized by a 300 m long section of beach which undergoes significant periodic erosion and has been nourished ad-hoc to protect infrastructure and private property [23]. The area immediately offshore is largely bare sand, however either side of this area is predominantly covered by seagrasses. We observed net erosion of 269,000 m3, which is equivalent to an average bed elevation change of −0.08 m/year for the period between 2007 and 2010. Sediment loss in the section is relatively uniform.

4.3.4. Winda Woppa Survey Section

This section (Figure 5d) is characterised by a main channel running parallel to the Corrie Island shoreline, which is approximately 2 m deep and 50 m wide. This area is generally shallow at <−1 m Australian Height Datum (AHD).
The net volume change for the 2007–2010 period is a loss of 127,000 m3 that translates into a calculated rate of annual bed elevation change of −0.20 m/year. Erosion is generally observed across the area with the exception of several shoals adjacent to the river inlet channel undergoing accretion.

4.3.5. Nelson Head Channel/Western Shoal Bay Survey Section

The net volume change for the 2007 to 2010 period was a loss of 126,000 m3 giving an average elevation change of −0.07 m/year. The channel (Figure 5e) shows an alternating pattern of erosion and accretion, which is characteristic of sand wave migration. An along channel cross section shows prominent sand waves with wave lengths of 100–150 m and heights of 2–3 m. The area north of the channel predominantly shows no change, with a small area of accretion at its western end, and erosion at its eastern end. The area offshore of Shoal Bay shows a consistent pattern of erosion which is evident in the cross-shore cross section.

5. Discussion

5.1. Port Stephens Estuary Function

The evolution of an estuary is dependent on the underlying geological boundaries (accommodation space), the supply of sediment and the forcing mechanisms that transport and deposit the sediment. The recent geological evolution of the Port Stephens estuary consists of sediment being initially deposited during the Postglacial Marine Transgression (~6500 years ago) and the subsequent reworking of this sediment by hydrodynamic forces [45]. It is generally accepted that drowned river valleys on the south-eastern Australian coast are undergoing infilling [46], however the rate of infilling differs between estuaries. The Port Stephens estuary was classified as being in a youthful stage of evolution by Roy et al. [3], implying that the combined hydrodynamic conditions and sediment supply (from both fluvial and marine sources) have limited the rate of infilling.
The relationship between morphology and general flow patterns over a FTD was first described by Hayes [7]. We observed flood currents to be dominant up the flood ramp before being directed into flood channels around the shoals at the landward edge of the FTD. An ebb dominant channel generally runs adjacent to the FTD, with flows separated by an ebb shield and ebb spits. The morphology of the FTD subsequently results in the lateral segregation of flow into distinct flood and ebb channels observed by Boothroyd [4] to result in unequal flow durations and or velocities. The residual tidal flow durations and velocities observed during this study generally conform to the observations of Hayes [7] and Boothroyd [4]. Our observations show that the main channel is characterised by dominant ebb flows across both the Nelson Head transect and the inlet transect.
According to the residual distances obtained with our study, sediment transport under tidal currents alone at the entrance are expected to transport sediment out of the estuary or at the very least mitigate against processes that drive sediment into the estuary. Residual distances within the estuary and over the FTD delta are consistently flood biased, supporting the net landward transport of sediment under tidal currents. The main ebb channel acts to divide Shoal Bay from the FTD/flood ramp, however eddy formation caused by ebb flows passing Nelson Head may cause sediment to accumulate within this region. The tidal circulation patterns and inferred sediment transport potentials exhibit spatial and temporal variability that form a complex relationship with the morphology of the system.
The 2007 bathymetric survey was undertaken shortly after a two-month period of high energy storm activity (Figure 3a) during which time there was minimal post-storm recovery owing to the low energy conditions during the ensuing fair-weather. According to Vila-Concejo et al. [23], the 2007 storms and the consequent swell waves propagating through the entrance caused generalised erosion on the estuarine beaches on both sides of the estuary, while causing a significant sediment accumulation on the shoreline-attached sand wave located on the northern shoreline (Figure 1b). The offshore transport of the sediment eroded by the waves would have caused accretion on the adjacent nearshore zones, thus putting the FTD in a post-storm state, i.e., with excess sediment.
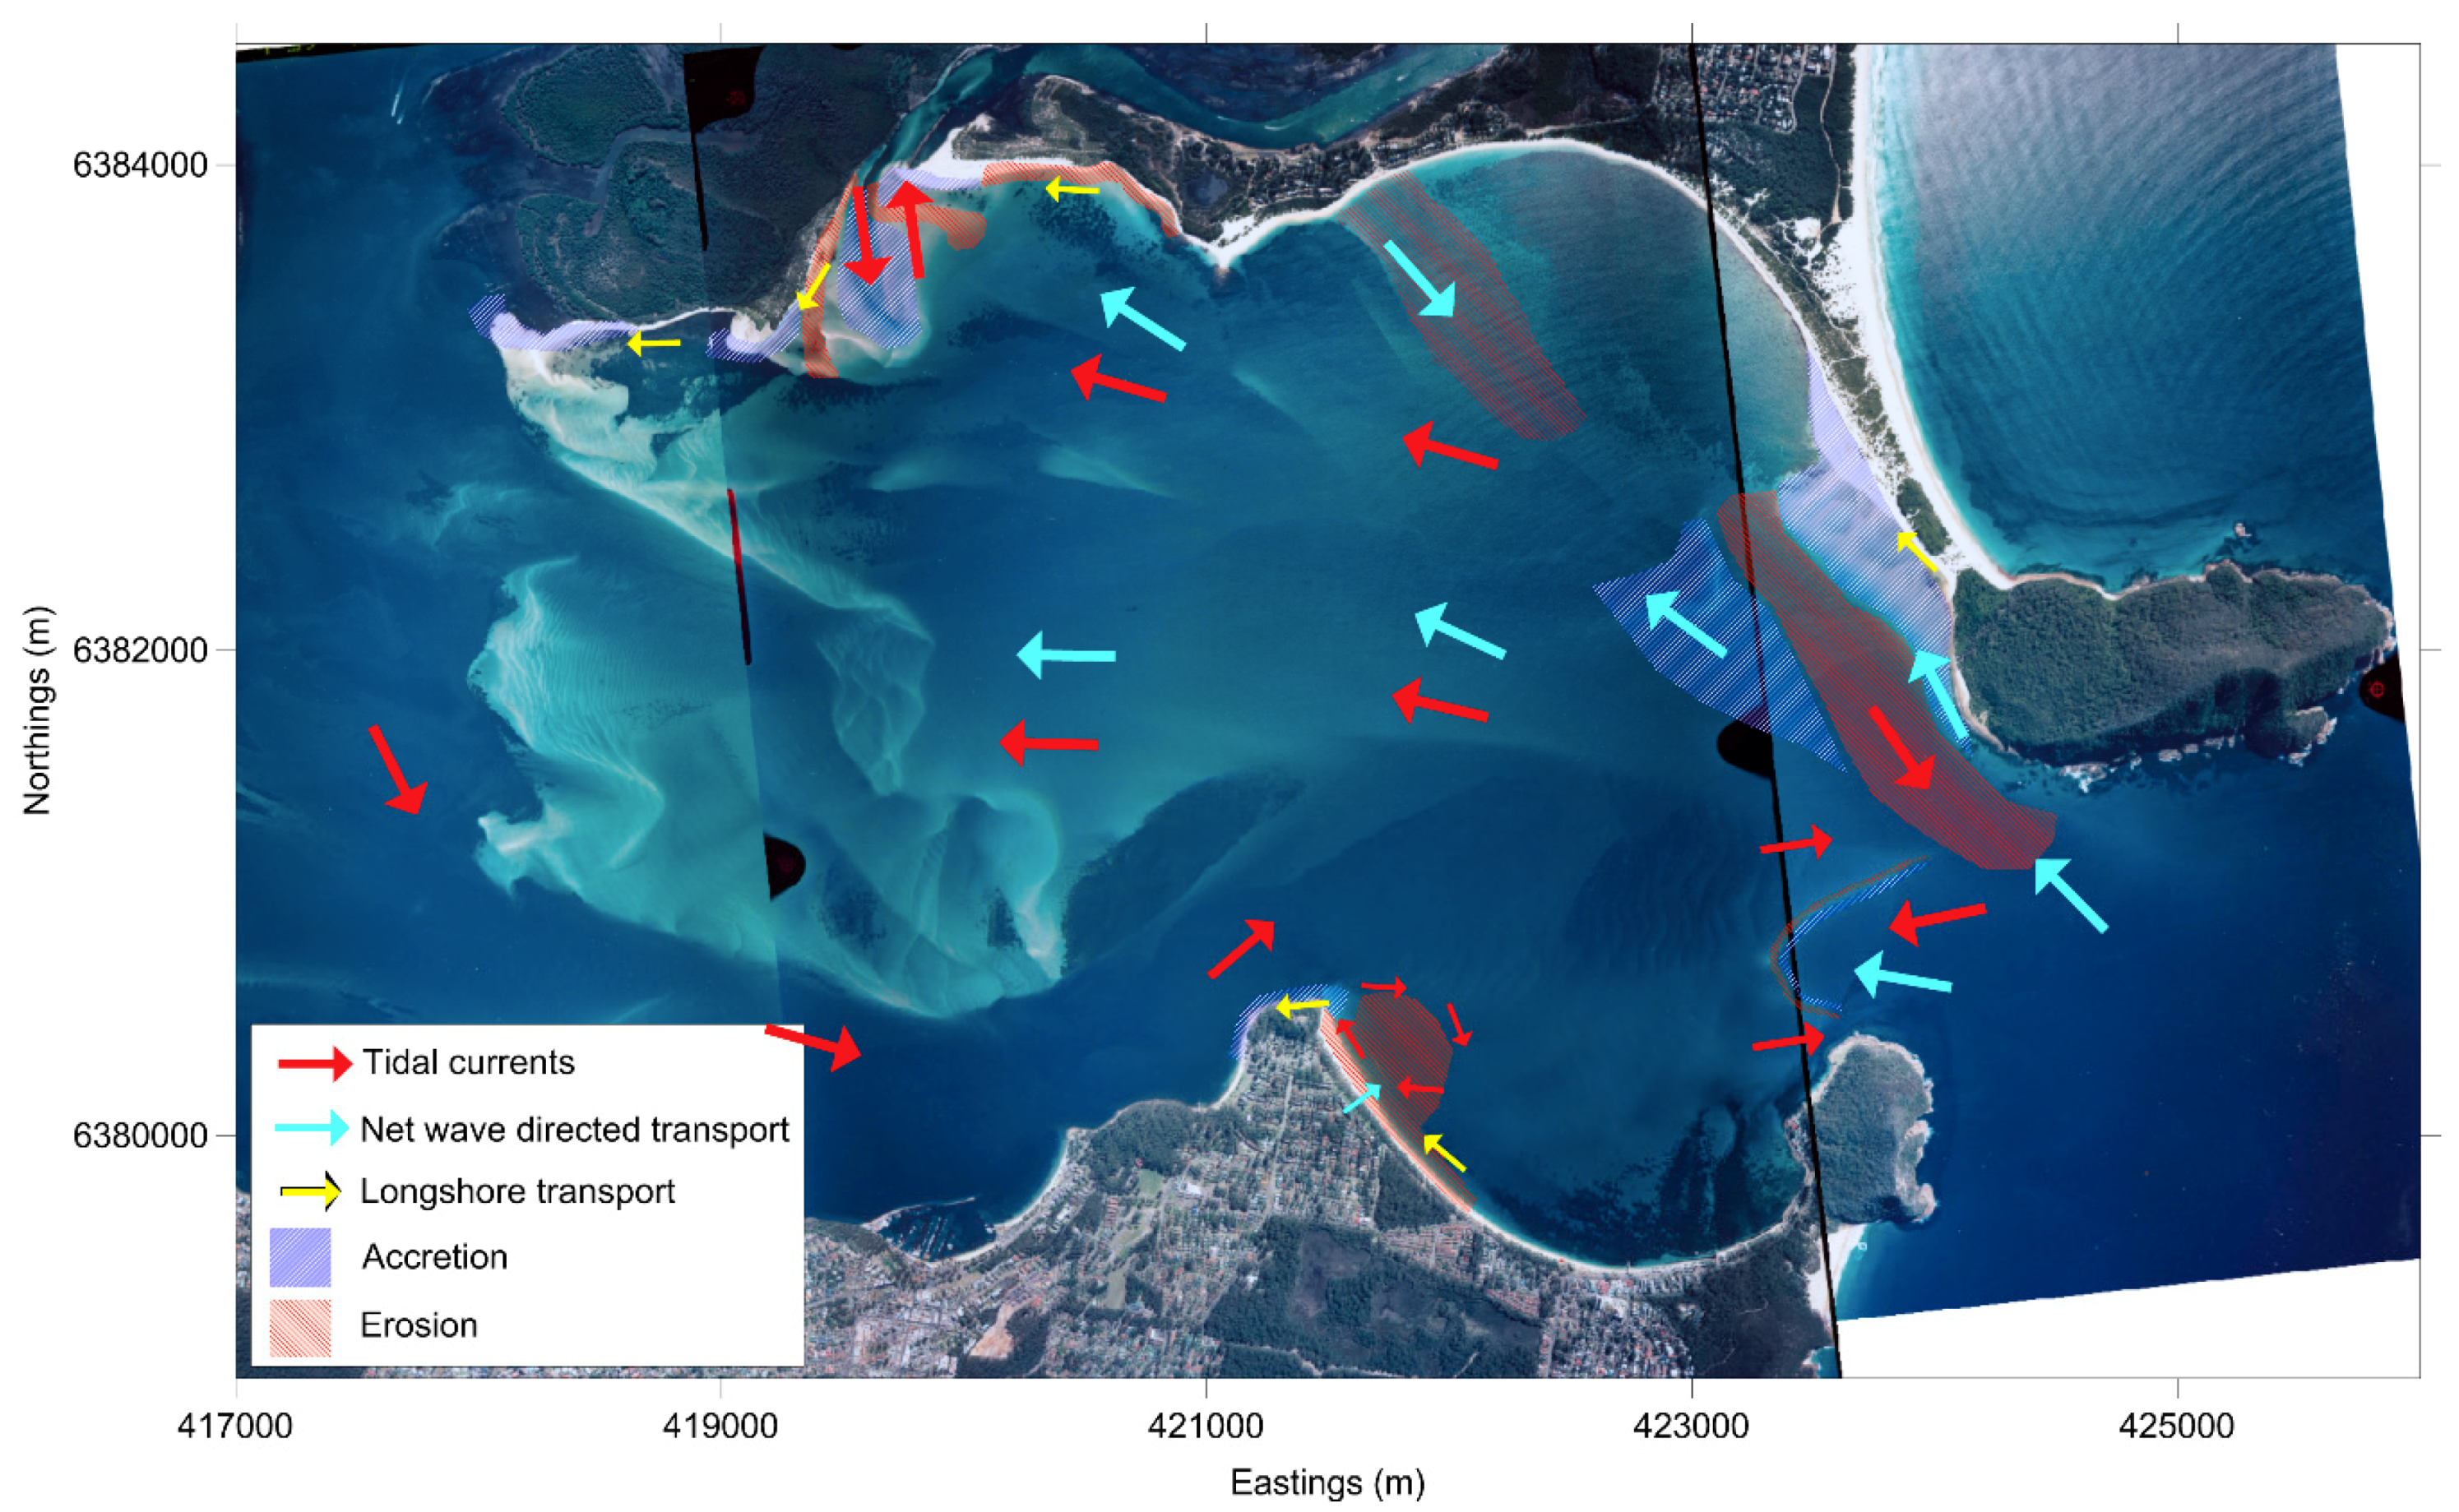
The period before the 2010 survey was characterised by fair weather conditions with only a few storms (Figure 3b), which correspond to the typical fair weather conditions in the study area and therefore the estuarine beaches did not undergo strong erosion during that period [23]. The persistent recession of both the northern and southern shorelines [23] indicates that the sediment had not returned to the estuarine beaches and therefore that the shoreline/nearshore systems are not operating as closed systems. Moreover, our bathymetric surveys show net erosion across the surveyed regions of the FTD (Figure 5). The alongshore westward sediment transport occurring on both the northern and the southern shoreline identified by Vila-Concejo et al. [23] is forced by the swell waves propagating into the estuary; we hypothesise that those same waves also contribute to the westward migration of the FTD predicted by Roy [3,46] and measured by Frolich [47]. A similar system of flood ramp erosion and landward migration was observed by Druery and Hurrel [48] for the Port Hacking estuary (SE Australia). Therefore, the sediment eroded from the estuarine beaches, is first transported towards the FTD and then migrates westward with the FTD. Our studies showed no evidence of sediment returning from the FTD to the estuarine beaches studied by Vila-Concejo et al. [23]. Our results agree with those presented by other authors, where sediment dumped on estuarine beaches was transported to the FTD with no evidence of it ever returning to the beaches [49]. Figure 6 outlines the main directions and pathways of sediment transport that we can infer from our results, identifying some of the sources and sinks in this estuary. Our bathymetric surveys support the idea that this estuary, specifically the FTD and adjacent estuarine beaches, is sediment limited.

5.2. Conceptual Model

Based on our results, below we present a conceptual model that outlines the different interactions between general morphologic features and the key physical processes of a microtidal drowned river valley estuary with a wide, fixed entrance. In the model, we use two contrasting energy regimes in a similar manner to that of previous studies of inlet and estuarine morphodynamics such as Morris et al. [50], Vila-Concejo et al. [13], Morton et al. [51], and O’Connor et al. [52]. “Fair weather conditions” represent the most frequently occurring low energy conditions and “storm conditions” represent low frequency, high energy conditions. The independent conceptualisation of the morphological influence of each of these conditions facilitates understanding the evolution of the FTD system in relation to the estuarine shorelines.
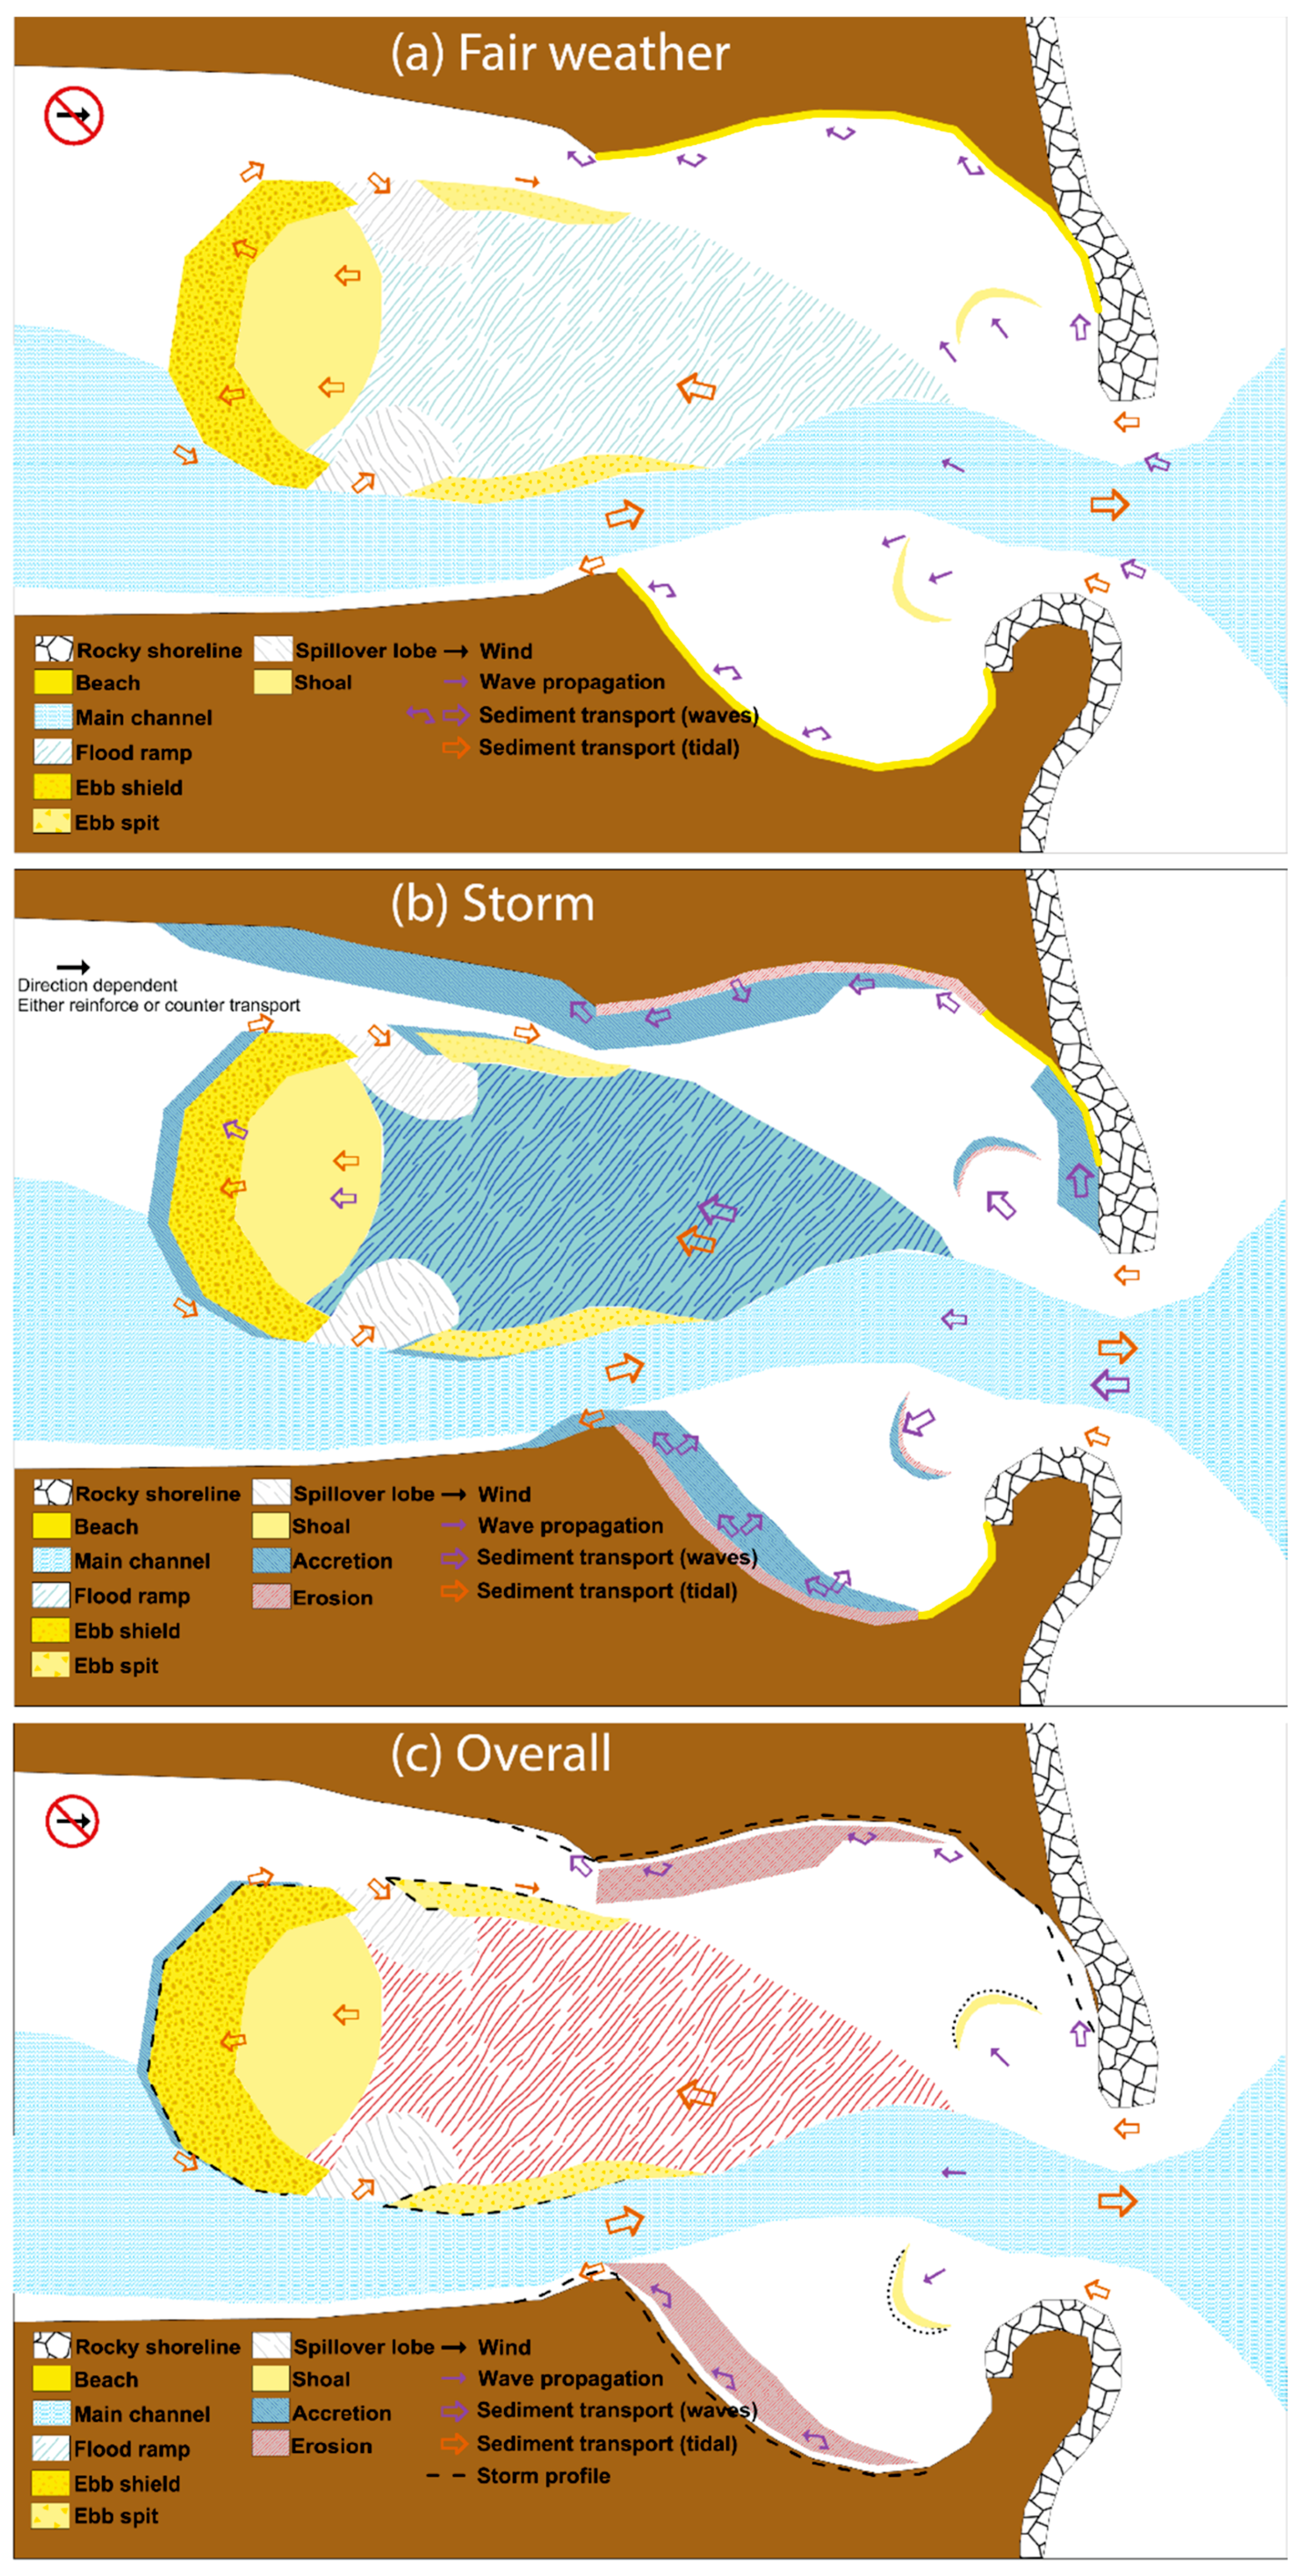
The general morphology that we incorporate in this model includes the following (Figure 7):
(1)
Fetch limited estuary.
(2)
A relatively wide (hundreds of meters) fixed-width entrance.
(3)
Absence of large offshore sediment sources.
(4)
Absence (or underdeveloped) of an ebb-tidal delta.
(5)
Deep entrance channel with adjacent shallow regions.
(6)
Estuarine beaches are present along the estuary shorelines adjacent to the entrance.
(7)
Presence of a FTD of the general form described by Hayes [7].
(8)
Presence of a FTD adjacent main channel that connects with the entrance.
Our concept estuary is fetch-limited, therefore locally generated wind waves and currents are orders of magnitude smaller than tidal currents and ocean swells that can propagate through the wide entrance. There is an absence of large offshore sediment supply that, combined with weak tidal currents relative to incident wave energy, explains the absence of a prominent ebb-tide delta [51]; neither longshore transport nor sediment expelled from the estuary is sufficient to support the ebb-tide delta; and, wave conditions at the entrance prevent its formation [6]. Tidal flow asymmetry, whereby either flow velocity or duration is unequal between ebb and flood phases, exhibits correlation with morphology. Shallow areas (e.g., over the FTD) are typically flood dominated and deeper areas (e.g., channels) are ebb dominated [4,7,52,53]. These flow characteristics do not differ between fair weather and storm conditions; however, the sediment entrained and subsequently transported by these flows significantly differs. Drowned river valley estuaries with similar morphology to that outlined above can be found both locally (Australia, in particular on the south-eastern coastline) and internationally including in Europe (e.g., Portugal, England, Ireland, and Spain), Africa (Kenya and South Africa), Asia (Japan), North America on both eastern and western seaboards, Papua New Guinea and New Zealand [39,49,54,55,56].

5.2.1. Fair Weather Conditions

Fair weather conditions represent the most frequent conditions consisting of winds that are insufficient to generate local waves or surface currents capable of significant sediment transport, and small ocean waves propagating through the entrance that do not cause significant morphological change, but may be capable of entraining sediment. Fair weather conditions include periods with small waves but also periods with high-frequency low-energy storms that do not cause major changes in the system.
Inside the estuary, ocean waves are generally insufficient to result in sediment transport, but can entrain sediment, which is then transported by tidal currents. This entrainment and transport preferentially occurs on the shallow regions near the entrance. Ocean waves control the morphodynamics of the estuarine beaches, with tidal currents and wind induced currents being insufficient to entrain sediment during fair weather conditions [22,23,44,57,58].
The morphological changes and driving processes during fair weather conditions can be summarised as follows (Figure 7a). Sediment exchange at the entrance is negligible with transport into the estuary facilitated by wave entrainment and flood dominated flows in the shallow entrance regions. There is a slight net up-estuary longshore transport along the shorelines driven by incident waves with high angle of approach. Flood-dominated currents combined with small waves result in net up-estuary progradation of the FTD. It is important to note that, whilst the potential for sediment transport during fair weather conditions is low, the prevalence of these conditions over time contributes to the long-term up-estuary progradation of the FTD system, which can result in overall erosion over the FTD as sediment from the ramp is transported towards the ebb shield.

5.2.2. Storm Conditions

Storm conditions represent increased wave energy in the estuary and consequently, increased sediment entrainment and transport; they include periods with low-frequency high-energy storms that cause major morphological change in the system. Our concept estuary is fetch-limited; therefore, wind-induced currents and waves are orders of magnitude smaller than tidal currents and ocean waves, and therefore they only have a minor influence on sediment transport. Consequently, the primary source of the increase in energy is from ocean waves and therefore wave refraction, diffraction and attenuation produce an uneven distribution of energy throughout the system. The increased ocean wave energy increases sediment mobilisation outside the estuary entrance, increasing the potential for sediment transport into the estuary by a combination of wave and flooding tidal currents. Once inside the estuary, sediment transport depends on the interaction of asymmetric currents produced by ocean waves and tidal flows (Figure 7b).
Over the flood ramp and on the shallow regions of the entrance, the combination of flood-dominated tidal currents with the incoming ocean waves results in net transport of sediment into the estuary. The nearshore region adjacent to estuarine beaches represents an area of convergence of sediment transport: (1) storm waves cause up-estuary sediment transport from the outer regions of the FTD; and (2) storm waves erode sediment from the beach transporting it towards the FTD (Figure 7b). While sediment on the beach may also be transported by longshore currents, the overall sediment transport patterns result in net sedimentary accumulation on the FTD, and net sediment transport and migration of morphological features up-estuary. Consequently, there is sediment accumulation on the FTD that arrives from the beaches, and the sediment shoals at the entrance migrate towards the interior of the estuary. Some sediment may return to the entrance via the ebb-dominated channel, which converges with the sediment transported into the system.

5.2.3. Overall Evolution-Linking Timescales

The overall evolution of the FTD combining periods of fair weather and storm conditions represents a dynamic balance between the dominant forcing mechanisms (tidal currents and ocean waves) and the sediment availability. As our model estuary lacks substantial offshore sediment sources, the overall evolution of the estuary is characterised by a net loss of sediment from those areas most directly affected by increased wave energy associated with storm conditions. The areas eroded by storm conditions (e.g., the estuarine beaches) are unable to recover from storm induced morphology due to the limited sediment supply into the estuary and the reduced transport potential under fair weather. The excess sediment deposited on the FTD during storm conditions is transported up-estuary towards the ebb shield, resulting in the erosion of the flood ramp and in the up-estuary migration of the ebb shield. This sediment is trapped by the FTD and is unavailable for transport to the eroded estuarine beaches.
In summary, the overall evolution of our model estuary is characterised by the following:
  • Entrance shoals maintain their approximate location and volume undergoing seaward migration under fair weather conditions (due to tidal current dominance), and up-estuary migration under storm conditions due to wave dominance.
  • Shorelines undergo erosion due to storm conditions transporting sediment both along-shore and to the FTD, which is not returned during fair weather conditions, which have insufficient energy to act on the eroded sediment and/or which is affected by asymmetric tidal currents.
  • Sediment from the flood ramp is transported up-estuary resulting in net lowering of the flood ramp (erosion) and up-estuary migration of the ebb shield.

6. Conclusions

This paper outlines morphodynamic observations of a flood-tide delta in a mixed-energy drowned river valley estuary over short (days) to longer (years) time scales. Tidal circulation and ocean swell waves propagating into such an estuary are identified as the dominant forcing mechanisms driving sediment transport over the flood-tide delta and adjacent estuarine beaches. We used these observations to develop a conceptual model that outlines the dominant morphodynamics under fair weather and storm conditions from which we synthesised the morphological evolution. Our model can be applied to fetch-limited estuaries with wide fixed entrances through which ocean waves can propagate. Tidal currents are weak in relation to the incident ocean waves, there are no substantial offshore sources of sediment, and therefore the estuary lacks a well-developed ebb-tide delta.
Our model explains the overall evolution of the estuary as a combination of fair weather and storm conditions. It illustrates how the FTD receives the sediment transported into the estuary from the adjacent estuarine beaches during high-energy low-frequency storm events. This sediment is then transported up-estuary where it becomes trapped in the ebb shield, thus contributing to the up-estuary migration of the FTD. This sediment becomes unavailable for transport back to the estuarine beaches. Our model explains why, under the above outlined conditions, estuarine beaches do not typically recover after storms, and exist in a persistent eroded state.
The conceptual model of the interactions between FTD morphology and the forcing mechanisms responsible for overall evolution of the system developed in this study represents a significant improvement in the framework within which future management strategies can be designed. The recognition of not only short-term and localised processes, but also how these play a role in estuary wide evolution increases the likely success and longevity of management strategies.

Author Contributions

T.A. and A.V.-C. were responsible for conducting all fieldwork associated with the data used within this paper. They were responsible for compiling the paper. A.S. supervised the project and provided review and revision of the paper. R.R. reviewed and revised of the paper and consulted for the duration of the project.

Funding

This research was funded by the Australian Research Council (ARC) in collaboration with the Office of Environment and Heritage (OEH), a division of the NSW Department of Premier and Cabinet (formerly the Department of Environment, Climate Change and Water (DECCW)), Great Lakes Council, Port Stephens Council and Jimmy’s Beach Restoration Society Inc. through Linkage Grant LP0668979. Roshanka Ranasinghe is supported by the AXA Research Fund and the Deltares Strategic Research Programme “Coastal and Offshore Engineering”.

Acknowledgments

To all those who helped in the collection of field data, Dave Mitchel, Graham Lloyd, Lara Ainley, Hannah Power, Michelle Frolich, Alex Frolich, Halina Kuczma, Rhi McKeon, Mike Kinsela, Jo Whittaker, Amy Haughton, Sam Clarke, Marco Olmos, Arjen Overduin, Javier Benevente, Laura Del Rio, Mitch Harley, Angela Jiang, Gen Pezzimenti, Dan Harris and Brad Morris, We hope that you found it as enjoyable and rewarding as we did. Thanks also go to the crew of Feet First Dive, Nelson Bay for their assistance in deploying and recovering the ADCPs and Michael Bell and colleagues from the Defence Science and Technology Organisation (DSTO) for their time and equipment searching for a missing ADCP. The NSW Department of Finance and Services, Manly Hydraulics Laboratory (MHL) is acknowledged who on behalf of the OEH kindly provided the Sydney and Crowdy Head offshore Waverider buoy data and Tomaree tide gauge data. The Commonwealth of Australia, Bureau of Meteorology (BOM) is acknowledged for the wind gauge data from Nelson Head and Williamtown.

Conflicts of Interest

The authors declare no conflict of interest.

Appendix A

The critical Shields’ Parameter as defined by Soulsby [38]:
θ c r = 0.30 1 + 1.2 D * + 0.055 [ 1 e x p ( 0.02 D * ) ]
where D * is the dimensionless grain size diameter given by
D * = D [ ρ 2 g ( s 1 ) μ 2 ] 1 3
where s is the ratio of sediment density to water density (ρs/ρ), and µ is the dynamic viscosity of fluid (N s m−2).

References

  1. Roy, P.S. New South Wales estuaries—Their origin and evolution. In Coastal Geomorphology in Australia; Academic Press: New York, NY, USA, 1984; pp. 99–121. [Google Scholar]
  2. Sloss, C.R.; Murray-Wallace, C.V.; Jones, G. Holocene Sea-Level Change on the Southeast Coast of Australia: A Review. Holocene 2007, 17, 999–1014. [Google Scholar] [CrossRef]
  3. Roy, P.S.; Williams, R.J.; Jones, A.R.; Yassini, I.; Gibbs, P.J.; Coates, B.; West, R.J.; Scanes, P.R.; Hudson, J.P.; Nichol, S. Structure and function of South-east Australian Estuaries. Estuar. Coast. Shelf Sci. 2001, 53, 351–384. [Google Scholar] [CrossRef]
  4. Boothroyd, J.C. Tidal inlets and tidal deltas. In Coastal Sedimentary Environment; Davis, R.A., Ed.; Springer-Verlag: New York, NY, USA, 1985; pp. 445–532. [Google Scholar]
  5. Coleman, J.M. Deltas: Processes of Deposition and Models for Exploration, 2nd ed.; Prentice Hall: Upper Saddle River, NJ, USA, 1982; p. 124. [Google Scholar]
  6. Hayes, M.O. General morphology and sediment patterns in tidal inlets. Sed. Geol. 1980, 26, 18. [Google Scholar] [CrossRef]
  7. Hayes, M.O. Morphology of sand accumulation in estuaries. In Estuarine Research; Cronin, L.E., Ed.; Academic Press: New York, NY, USA, 1975; p. 24. [Google Scholar]
  8. Nichols, M.M.; Biggs, R.B. Estuaries. In Coastal Sedimentary Environments; Davis, R.A., Ed.; Springer-Verlag: New York, NY, USA, 1985; pp. 77–186. [Google Scholar]
  9. Hayes, M.O. Barrier island morphology as a function of tidal and wave regime. In Barrier Islands from the Gulf of St Lawrence to the Gulf of Mexico; Leatherman, S.P., Ed.; Academic Press: New York, NY, USA, 1979; pp. 1–27. [Google Scholar]
  10. Moslow, T.F.; Heron, S.D. Relict inlets; preservation and occurrence in the Holocene stratigraphy of southern core banks, North Carolina. J. Sed. Res. 1978, 48, 1275–1286. [Google Scholar]
  11. FitzGerald, D.M. Geomorphic variability and morphologic and sedimentologic controls on tidal inlets. J. Coast. Res. 1996, 23, 47–71. [Google Scholar]
  12. Pacheco, A.; Williams, J.J.; Ferreira, Ó.; Dias, J.A. Evaluation of shear stress computation at a tidal inlet using different methods. J. Coast. Res. 2009, 56, 5. [Google Scholar]
  13. Vila-Concejo, A.; Ferreira, Ó.; Matias, A.; Dias, J.M.A. The first two years of an inlet: Sedimentary dynamics. Cont. Shelf Res. 2003, 23, 1425–1445. [Google Scholar] [CrossRef]
  14. Vila-Concejo, A.; Matias, A.; Ferreira, Ó.; Duarte, C.; Dias, J.M.A. Recent evolution of the natural inlets of a barrier island system in Southern Portugal. J. Coast. Res. 2002, 36, 741–752. [Google Scholar] [CrossRef]
  15. Adams, P.N.; Keough, K.M.; Olabarrieta, M. Beach Morphodynamics influenced by an ebb-tidal delta on the north Florida Atlantic coast. Earth Surf. Process. Landf. 2016, 41, 936–950. [Google Scholar] [CrossRef]
  16. Duong, T.M.; Ranasinghe, R.; Luijendijk, A.; Walstra, D.; Roelvink, D. Assessing climate change impacts on the stability of small tidal inlets: Part 1-Data poor environments. Mar. Geol. 2017, 390, 331–346. [Google Scholar] [CrossRef]
  17. Duong, T.M.; Ranasinghe, R.; Thatcher, M.; Mahanama, S.; Zheng, B.W.; Dissanayake, P.K.; Hemer, M.; Luijendijk, A.; Bamunawala, J.; Roelvink, D.; et al. Assessing climate change impacts on the stability of small tidal inlets: Part 2-Data rich environments. Mar. Geol. 2018, 395, 65–81. [Google Scholar] [CrossRef] [PubMed]
  18. FitzGerald, D.M. Interactions between the ebb-tidal delta and landward shoreline: Price Inlet, South Carolina. J. Sediment. Petrol. 1984, 54, 1303–1318. [Google Scholar]
  19. Hubbard, D.K.; Oertel, G.; Nummedal, D. The role of waves and tidal currents in the development of tidal-inlet sedimentary structures and sand body geometry; examples from North Carolina, South Carolina, and Georgia. J. Sediment. Res. 1979, 49, 1073–1091. [Google Scholar]
  20. Austin, T.P.; Short, A.D.; Hughes, M.G.; Vila-Concejo, A.; Ranasinghe, R. Tidal hydrodynamics of a micro-tidal, wave dominated flood-tide delta: Port Stephens, Australia. J. Coast. Res. 2009, 56, 693–697. [Google Scholar]
  21. Jackson, N.L. Wind and waves: Influence if local and non-local waves on mesoscale beach behaviour in estuarine environments. Annal. Assoc. Am. Geogr. 1995, 85, 21–37. [Google Scholar]
  22. Nordstrom, K.F. Estuarine Beaches; Elsevier Science Publishers Ltd.: Essex, UK, 1992; p. 225. [Google Scholar]
  23. Vila-Concejo, A.; Hughes, M.G.; Short, A.D.; Ranasinghe, R. Estuarine shoreline processes in a dynamic low-energy system. Ocean Dyn. 2010, 60, 285–298. [Google Scholar] [CrossRef]
  24. Costas, S.; Alejo, I.; Vila-Concejo, A.; Nombela, M.A. Persistence of storm-induced morphology on a modal low-energy beach: A case study from NW-Iberian Peninsula. Mar. Geol. 2005, 224, 43–56. [Google Scholar] [CrossRef]
  25. Easton, A.K. The Tides of the Continent of Australia, in Horace Lamb Centre for Oceanographical Research; Flinders University of South Australia: Bedford Park, Australia, 1970; p. 326. [Google Scholar]
  26. Jiang, A.W.; Ranasinghe, R.; Cowell, P. Hydrodynamic variability along a low-energy estuarine beach located in an open estuary. Aust. J. Civ. Eng. 2011, 9, 113–128. [Google Scholar] [CrossRef]
  27. Vila-Concejo, A.; Short, A.D.; Hughes, M.G.; Ranasinghe, R. Flood-tide delta morphodynamics and management implications, Port Stephens, Australia. J. Coast. Res. 2007, 50, 705–709. [Google Scholar]
  28. Benavente, J.; Harris, D.L.; Austin, T.P.; Vila-Concejo, A. Medium term behaviour and evolution of a beach cusps system in a low energy beach, Port Stephens, NSW, Australia. J. Coast. Res. 2011, 64, 170–174. [Google Scholar]
  29. DPWS, MHL. Port Stephens/Myall Lakes Estuary Processes Study; Report for Manly Hydraulics Laboratory: Manly Vale, NSW, Australia, 1999; pp. 110–115. [Google Scholar]
  30. Short, A.D.; Trenaman, N.L. Wave Climate of the Sydney Region, an Energetic and Highly Variable Ocean Wave Regime. Aust. J. Mar. Freshw. Res. 1992, 43, 26. [Google Scholar] [CrossRef]
  31. Malone, J.D.; Eagle, R.J. Jimmys Beach Erosion Study; Public Works Coastal Branch: Sydney, Australia, 1987; p. 340. [Google Scholar]
  32. Dewar, R. Stage 1: Analysis and review of existing information. In Port Stephens Flood Study; Report for Manly Hydraulics Laboratory: Manly Vale, NSW, Australia, 1993; p. 35. [Google Scholar]
  33. Anonymous, A. Coastline Management Manual. Report for Hydraulic Engineering Reports; NSW Government: Sydney, Australia, 1990. [Google Scholar]
  34. Shand, T.D.; Goodwin, I.D.; Mole, M.A.; Carley, J.T.; Browning, S.; Coghlan, I.G.; Harley, M.D.; Peirson, W.L.; You, Z.-J.; Kulmar, M.A. NSW Coastal Storms and Extreme Waves; Technical Report for Water Research Laborator; University of New South Wales: Sydney, Australia, 2010. [Google Scholar]
  35. Harley, M.D.; Turner, I.L.; Short, A.D.; Ranasinghe, R. Interannual variability and controls of the Sydney wave climate. Int. J. Climatol. 2010, 30, 1322–1335. [Google Scholar] [CrossRef]
  36. Woods Hole Coastal and Marine Science Center. Fetch- and depth-limited wave calculations. In Shore Protection Manual; Army Corps of Engineers; Waterways Experiment Station: Vicksburg, MS, USA, 1984. [Google Scholar]
  37. USACE. Shore Protection Maunal; USACE: Washington, DC, USA, 1984. [Google Scholar]
  38. Soulsby, R.L. Dynamics of Marine Sands; Thomas Telford Ltd.: Sotland, UK, 1997; p. 249. [Google Scholar]
  39. Black, K.P.; Healy, T.R.; Hunter, M.G. Sediment dynamics in the lower section of a mixed sand and shell-lagged Tidal Estuary, New Zealand. J. Coast. Res. 1989, 5, 503–521. [Google Scholar]
  40. Acoustic Doppler Profiler (ADP) Principles of Operation, version 6.24; SonTek: San Diego, CA, USA, 1997; p. 12.
  41. Burningham, H. Contrasting geomorphic response to structural control: The Loughros estuaries, northwest Ireland. Geomorphology 2008, 97, 300–320. [Google Scholar] [CrossRef]
  42. Dewar, R. Stage 2: Design water levels and wave climate. In Port Stephens Flood Study; Port Stephens Council: Port Stephens, Australia, 1996; p. 55. [Google Scholar]
  43. Fenster, M.S.; FitzGerald, D.M. Morphodynamics, stratigraphy, and sediment transport patterns of the Kennebec River estuary, Maine, USA. Sediment. Geol. 1996, 107, 99–120. [Google Scholar] [CrossRef]
  44. Vila-Concejo, A.; Austin, T.; Harris, D.; Hughes, M.G.; Short, A.D.; Ranasinghe, R. Estuarine beach evolution in relation to a flood-tide delta. J. Coast. Res. 2011, 64, 190–194. [Google Scholar]
  45. Thom, B.G. Coastal Geomorphology and Quaternary Geology of the Port Stephens-Myall Lakes Area; The Department of Biogeography and Geomorphology, The Australian National University: Canberra, Australia, 1939; pp. 375–391. [Google Scholar]
  46. Roy, P.S. Wave dominated coasts. In Coastal Evolution: Late Quaternary Shoreline Morphodynamics; Carter, R.W.G., Woodroffe, C.D., Eds.; Cambridge University Press: Cambridge, UK, 1994; pp. 121–186. [Google Scholar]
  47. Frolich, M. Recent Morphological Evolution of the Port Stephens Llood-Tide Delta; School of Geosciences, University of Sydney: Sydney, Australia, 2007; p. 110. [Google Scholar]
  48. Druery, B.M.; Hurrel, G.L. Port Hacking Marine Delta: Management options; Public Works Department: Sydney, Australia, 1986. [Google Scholar]
  49. Flor-Blanco, G.; Flor, G.; Morales, J.A.; Flor, G.; Morales, J.A.; Pando, L. Hydrodynamic controls of morpho-sedimentary evolution in a rock-bounded mesotidal estuary. Tina Menor (N Spain). J. Iberian Geol. 2015, 41, 315–332. [Google Scholar]
  50. Morris, B.D.; Davidson, M.A.; Huntley, D.A. Measurements of the response of a coastal inlet using video monitoring techniques. Mar. Geol. 2001, 175, 251–272. [Google Scholar] [CrossRef]
  51. Ranasinghe, R.; Duong, T.M.; Uhlenbrook, S.; Roelvink, D.; Stive, M. Climate-change impact assessment for inlet-interrupted coastlines. Nat. Clim. Chang. 2012, 3, 83–87. [Google Scholar] [CrossRef]
  52. Boon, J.D.I.; Byrne, R.J. On basin hyposmetry and the morphodynamic response of coastal inlet systems. Mar. Geol. 1981, 40, 27–48. [Google Scholar] [CrossRef]
  53. FitzGerald, D.M.; Nummedal, D. Response characteristics of an ebb-dominated tidal inlet channel. J. Sediment. Petrol. 1983, 53, 833–845. [Google Scholar]
  54. Bird, E.C.F. Coastal Geomorphology: An Introduction; Chichester: New York, NY, USA, 2000; p. 322. [Google Scholar]
  55. Cooper, J.A.G. Geomorphological variability among microtidal estuaries from the wave-dominated South African coast. Geomorphology 2001, 40, 99–122. [Google Scholar] [CrossRef]
  56. Green, M.O.; MacDonald, I.T. Processes driving estuary infilling by marine sands on an embayed coast. Mar. Geol. 2001, 178, 11–37. [Google Scholar] [CrossRef]
  57. Jackson, N.L.; Nordstrom, K.F.; Saini, S.; Smith, D.R. Effects of nourishment on the form and function of an estuarine beach. Ecol. Eng. 2010, 36, 1709–1718. [Google Scholar] [CrossRef]
  58. Vila-Concejo, A.; Short, A.D.; Hughes, M.G.; Ranasinghe, R. Formation and evolution of a sandwave on an estuarine beach. J. Coast. Res. 2009, 56, 153–157. [Google Scholar]
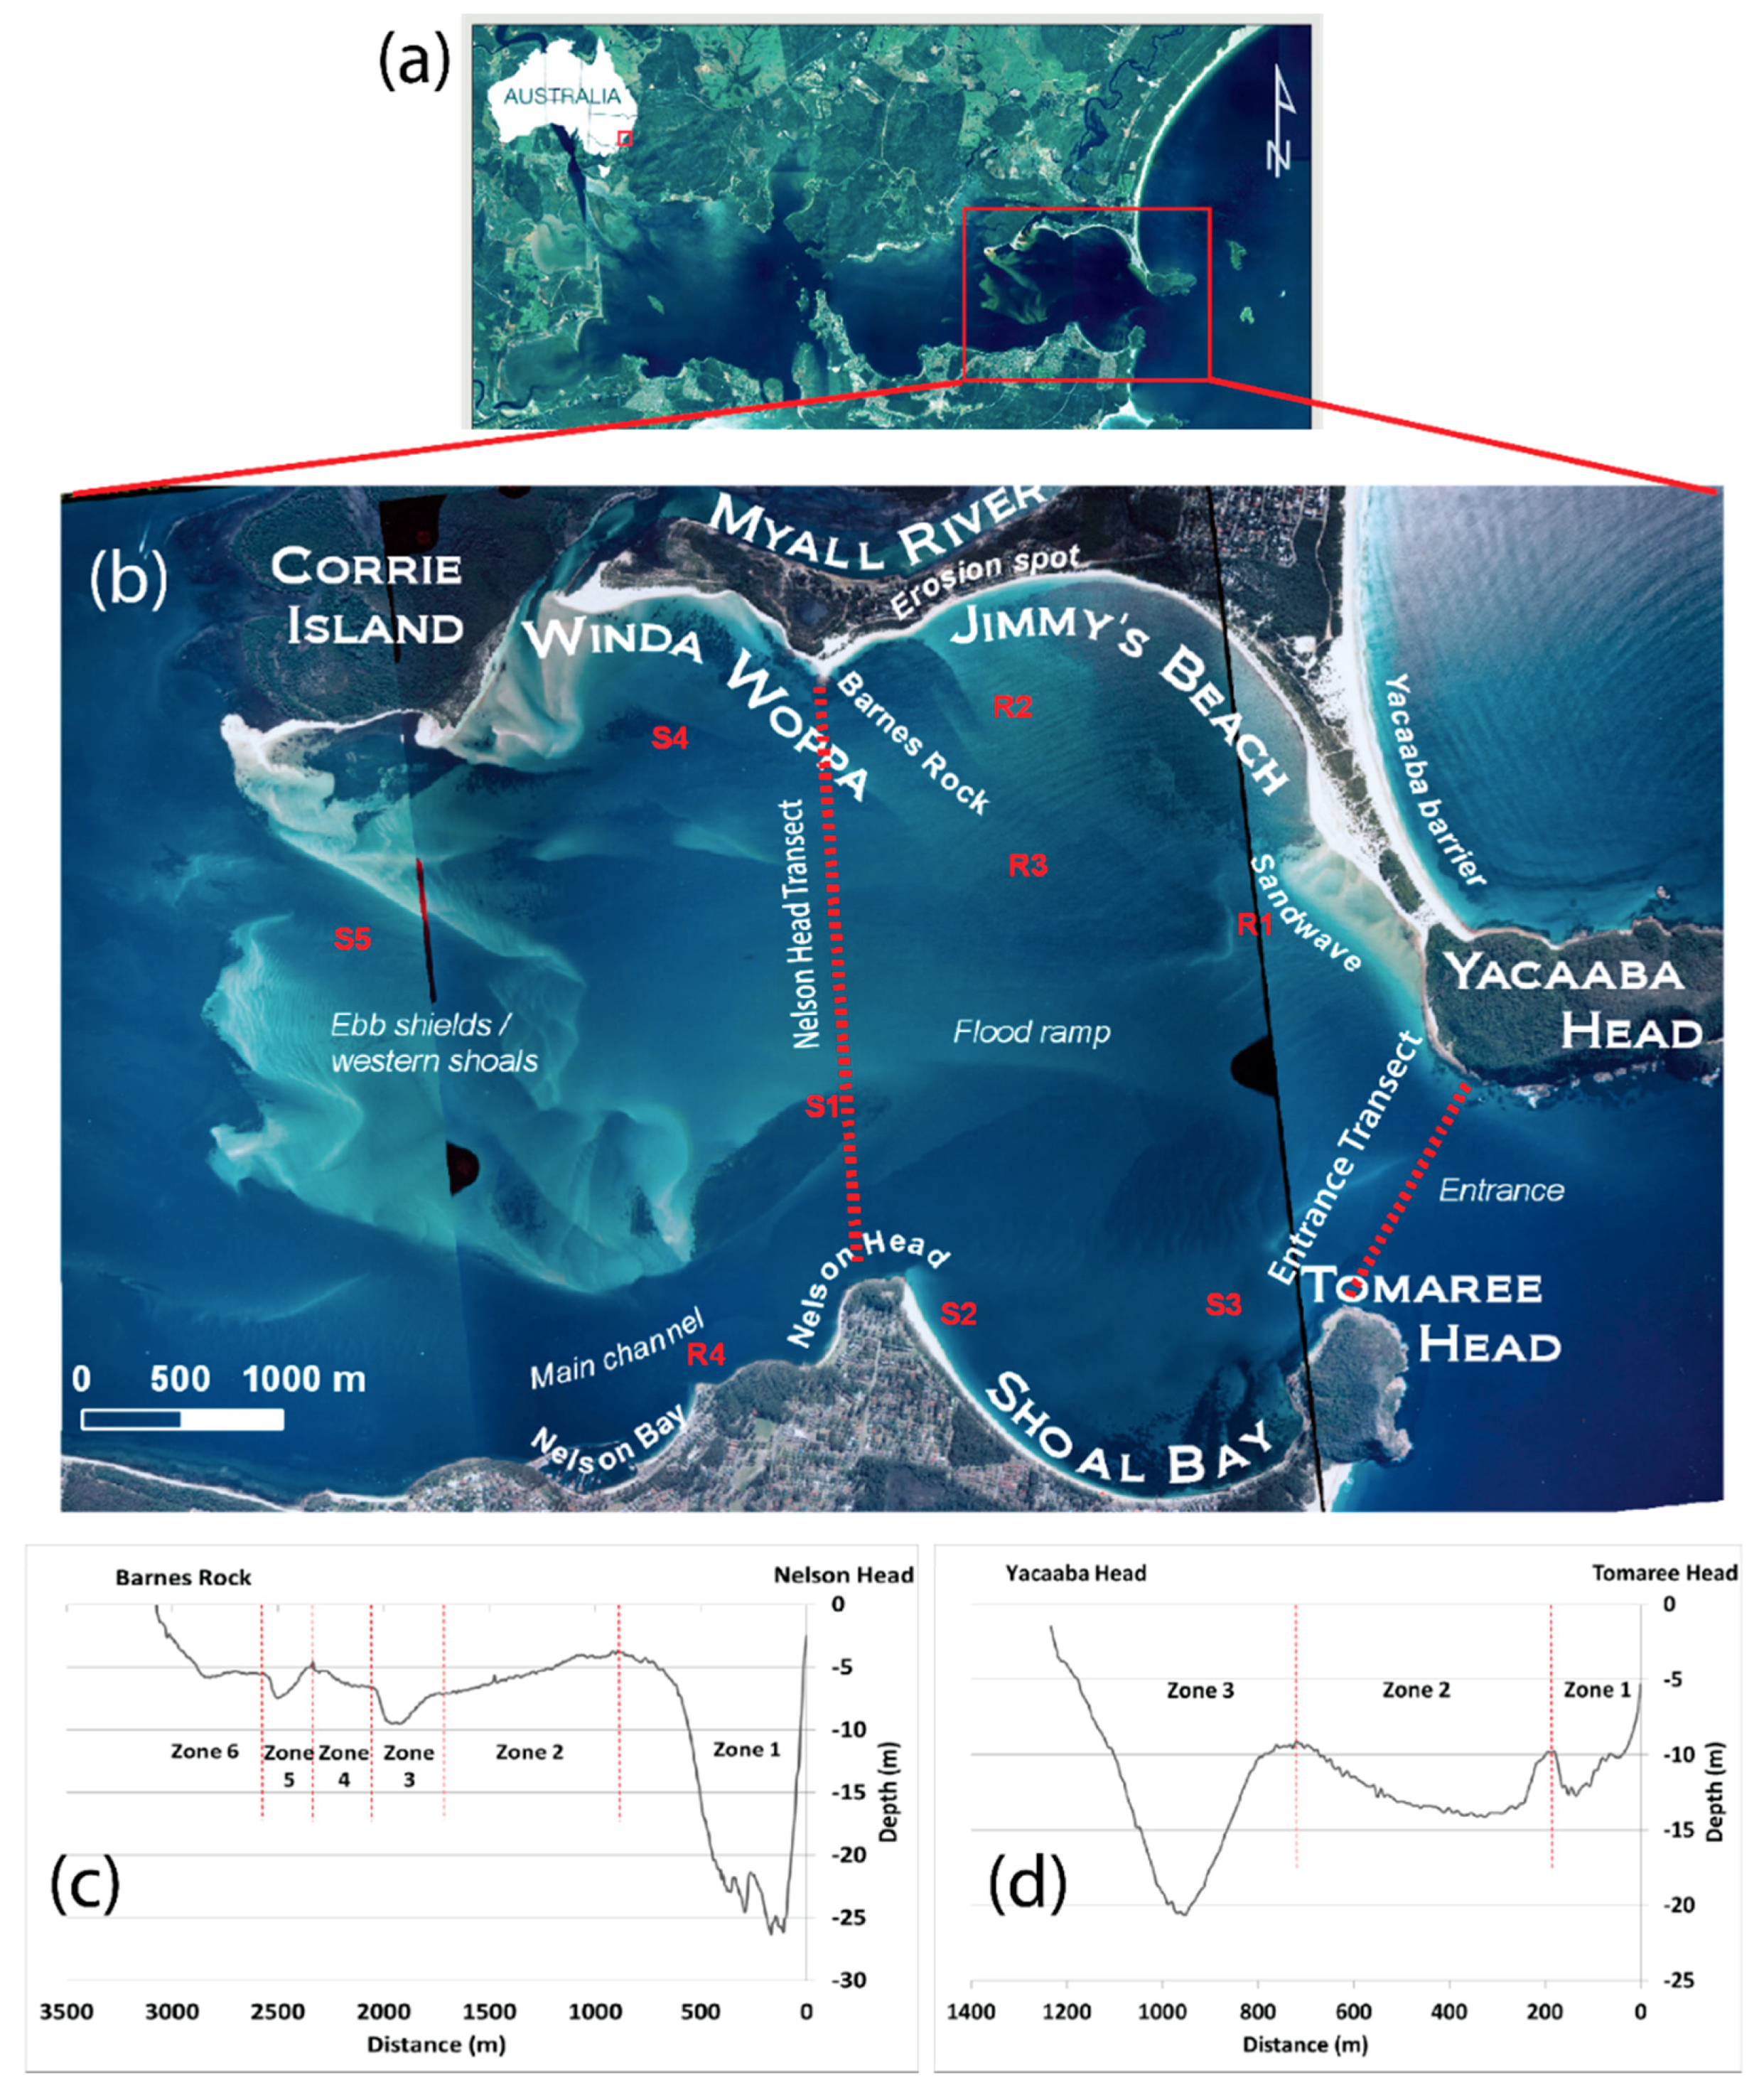
Figure 1. Location of Port Stephens: (a) Port Stephens is located in the mid-north coast of New South Wales on the east coast of Australia and has two basins separated by a narrow constriction; (b) detail on the outer (eastern) basin showing the geomorphic units mentioned in this paper, the locations of the Acoustic Döppler Current Profiler (ADCP) deployments (R1–R4 and S1 to S5) and the two transects used to the boat-mounted ADCP transects, the Nelson Head Transect, over the FTD, and the entrance transect; (c) bathymetry of the Nelson Head transect over the flood-tide delta; and (d) cross-shore bathymetric profile at the entrance.
Geosciences 08 00324 g001
Figure 2. Bathymetric surveys. The 2007 survey is in yellow and the 2010 survey is in blue. (Grid coordinates are in MGA Zone 56).
Geosciences 08 00324 g002
Figure 3. Daily Hs difference to mean Hs (1.6 m) for the six months prior to each of the bathymetric surveys. The dashed line represents the threshold for storm conditions at the study site (Hs = 3 m).
Geosciences 08 00324 g003
Figure 4. (a) Residual distance for each of the nine bottom mounted ADCP deployments over similar spring-neap tidal cycles; and (b) transect residual distances with arrows representing the direction at the inlet (I) and the Nelson Head (NH) transects. Values for residual distances are given next to each arrow. Please note that entrance residual distances are a magnitude larger than the NH values. (Grid coordinates are in MGA Zone 56).
Geosciences 08 00324 g004
Figure 5. Comparison of 2007 and 2010 bathymetric surveys at selected sites showing dynamic characteristics of the (a) entrance and (b) sand wave, and observed at the (c) erosion spot, (d) Winda Woppa, and (e) channel relative to the more uniform changes.
Geosciences 08 00324 g005
Figure 6. Sediment sinks and sources including the interaction forces of tidal currents and ocean waves that drive the sediment transport pathways. Arrows are scaled to the relative contribution to sediment transport. (Grid coordinates are in MGA Zone 56).
Geosciences 08 00324 g006
Figure 7. Conceptual model of FTD Morphology. Arrows are scaled for relative contribution to transport potential.
Geosciences 08 00324 g007
Table 1. Summary of ADCP deployment depths, periods and duration. Deployment sites beginning with R represent the RDI 1200 Hz Workhorse Sentinel ADCP and S the SonTek 1500 Hz ADCP.
DeploymentDeployment SiteDepth (Avg. Water Level Above Instrument (m))Deployment PeriodDuration (days)
1R1 S14.42/3.7328 November 2007–19 December 200720
2R2/S23.72/5.7320 December 2007–14 February 200856
3R3/S36.82/3.8914 February 2008–28 March 200832
4R415.3410 April 2008–04 May 200824
5S45.6818 May 2008–18 September 2008122
6S55.0610 October 2008–15 December 200866
Table 2. Summary of ADCP transect conditions.
TransectDateLength (m)No. TransectsFrequency of Transect (h:mm)Transect Duration (h:mm)Avg. Boat Speed (m/s)Average Ensemble Length (m)
Entrance transect17 December 20081250270:300:151.36.5
Nelson Head transect28 January 20103080121:000:301.68
Table 3. Storm characteristics for the six months prior to each bathymetric survey calculated from hourly wave data.
20072010
No. Storms157
Avg. Duration (hrs)23.319
Avg. Hs (m)3.63.47
Hmax (m)14.112.2
Avg. Tp (s)10.410.6
Dir (°N)161163
Avg. Mean Power (kW/m)7063
Avg. Peak Power (kW/m)10995
Cumulative energy of largest storm (MJh/m2)952,000528,000
Total cumulative energy (MJh/m2)3,281,0001,086,000