Forensic Investigations of Geohazards: The Norcia 2016 Earthquake


Abstract
1. Introduction
2. Materials and Methods
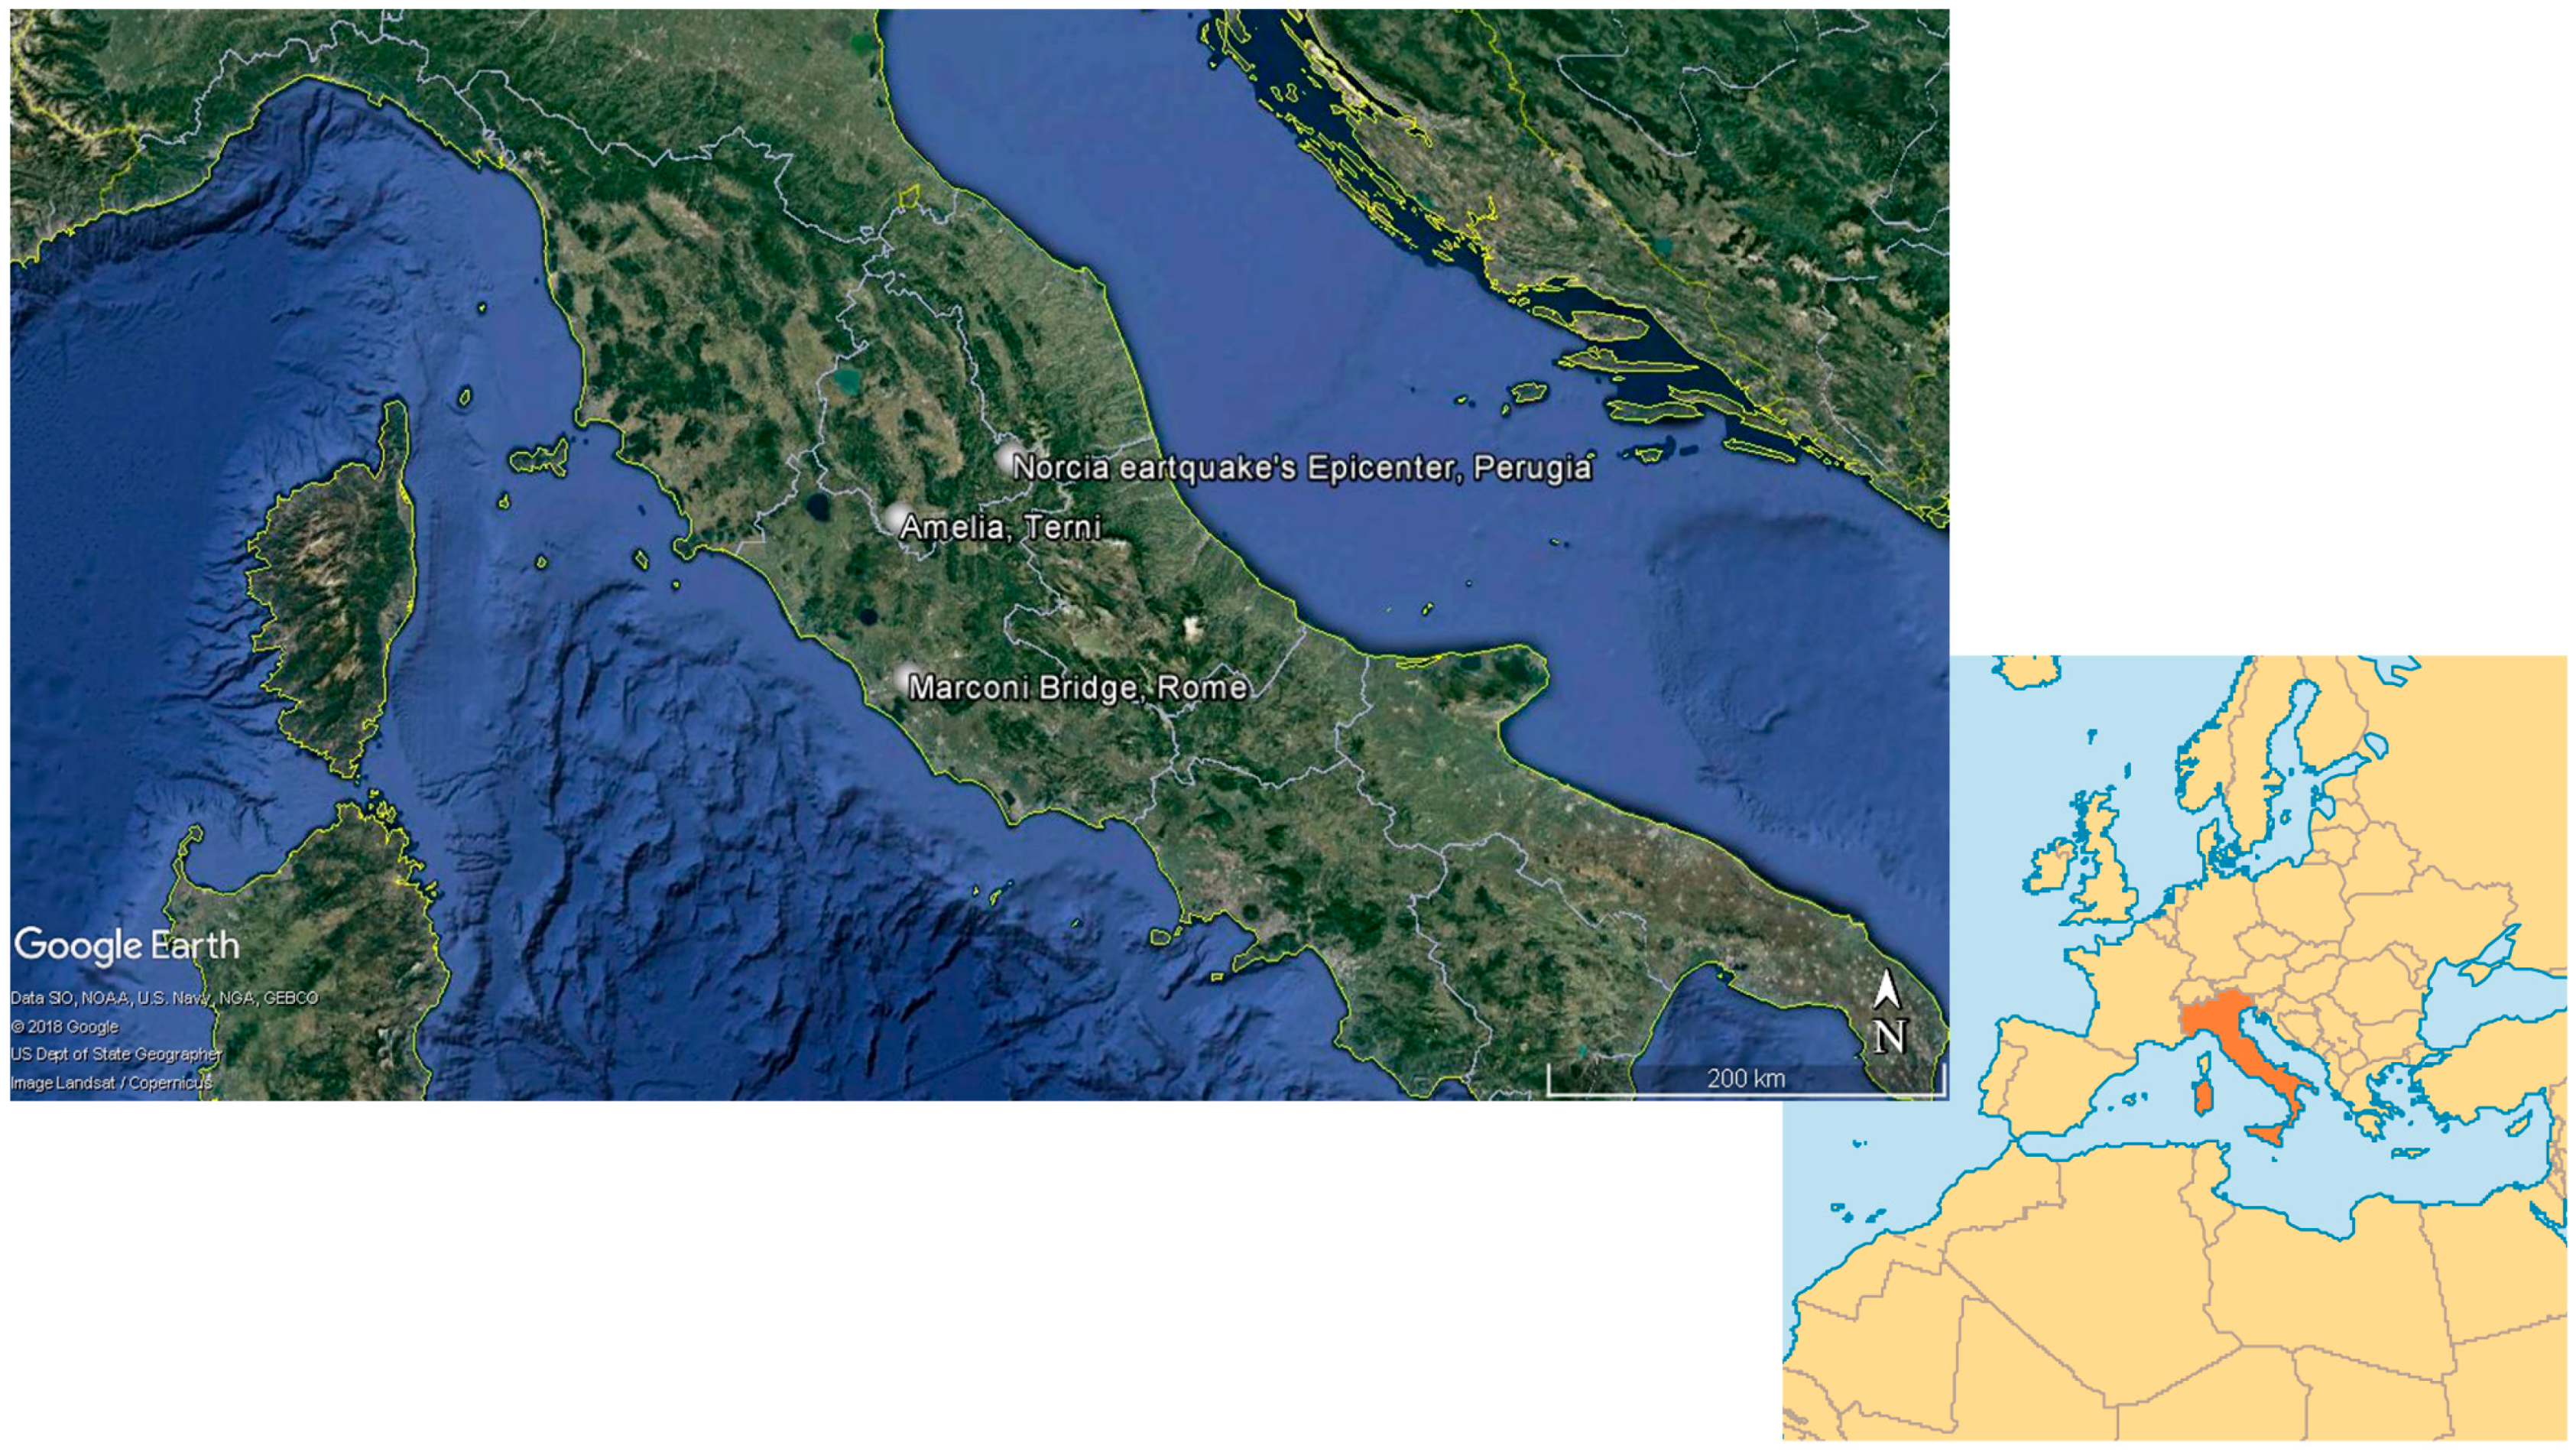
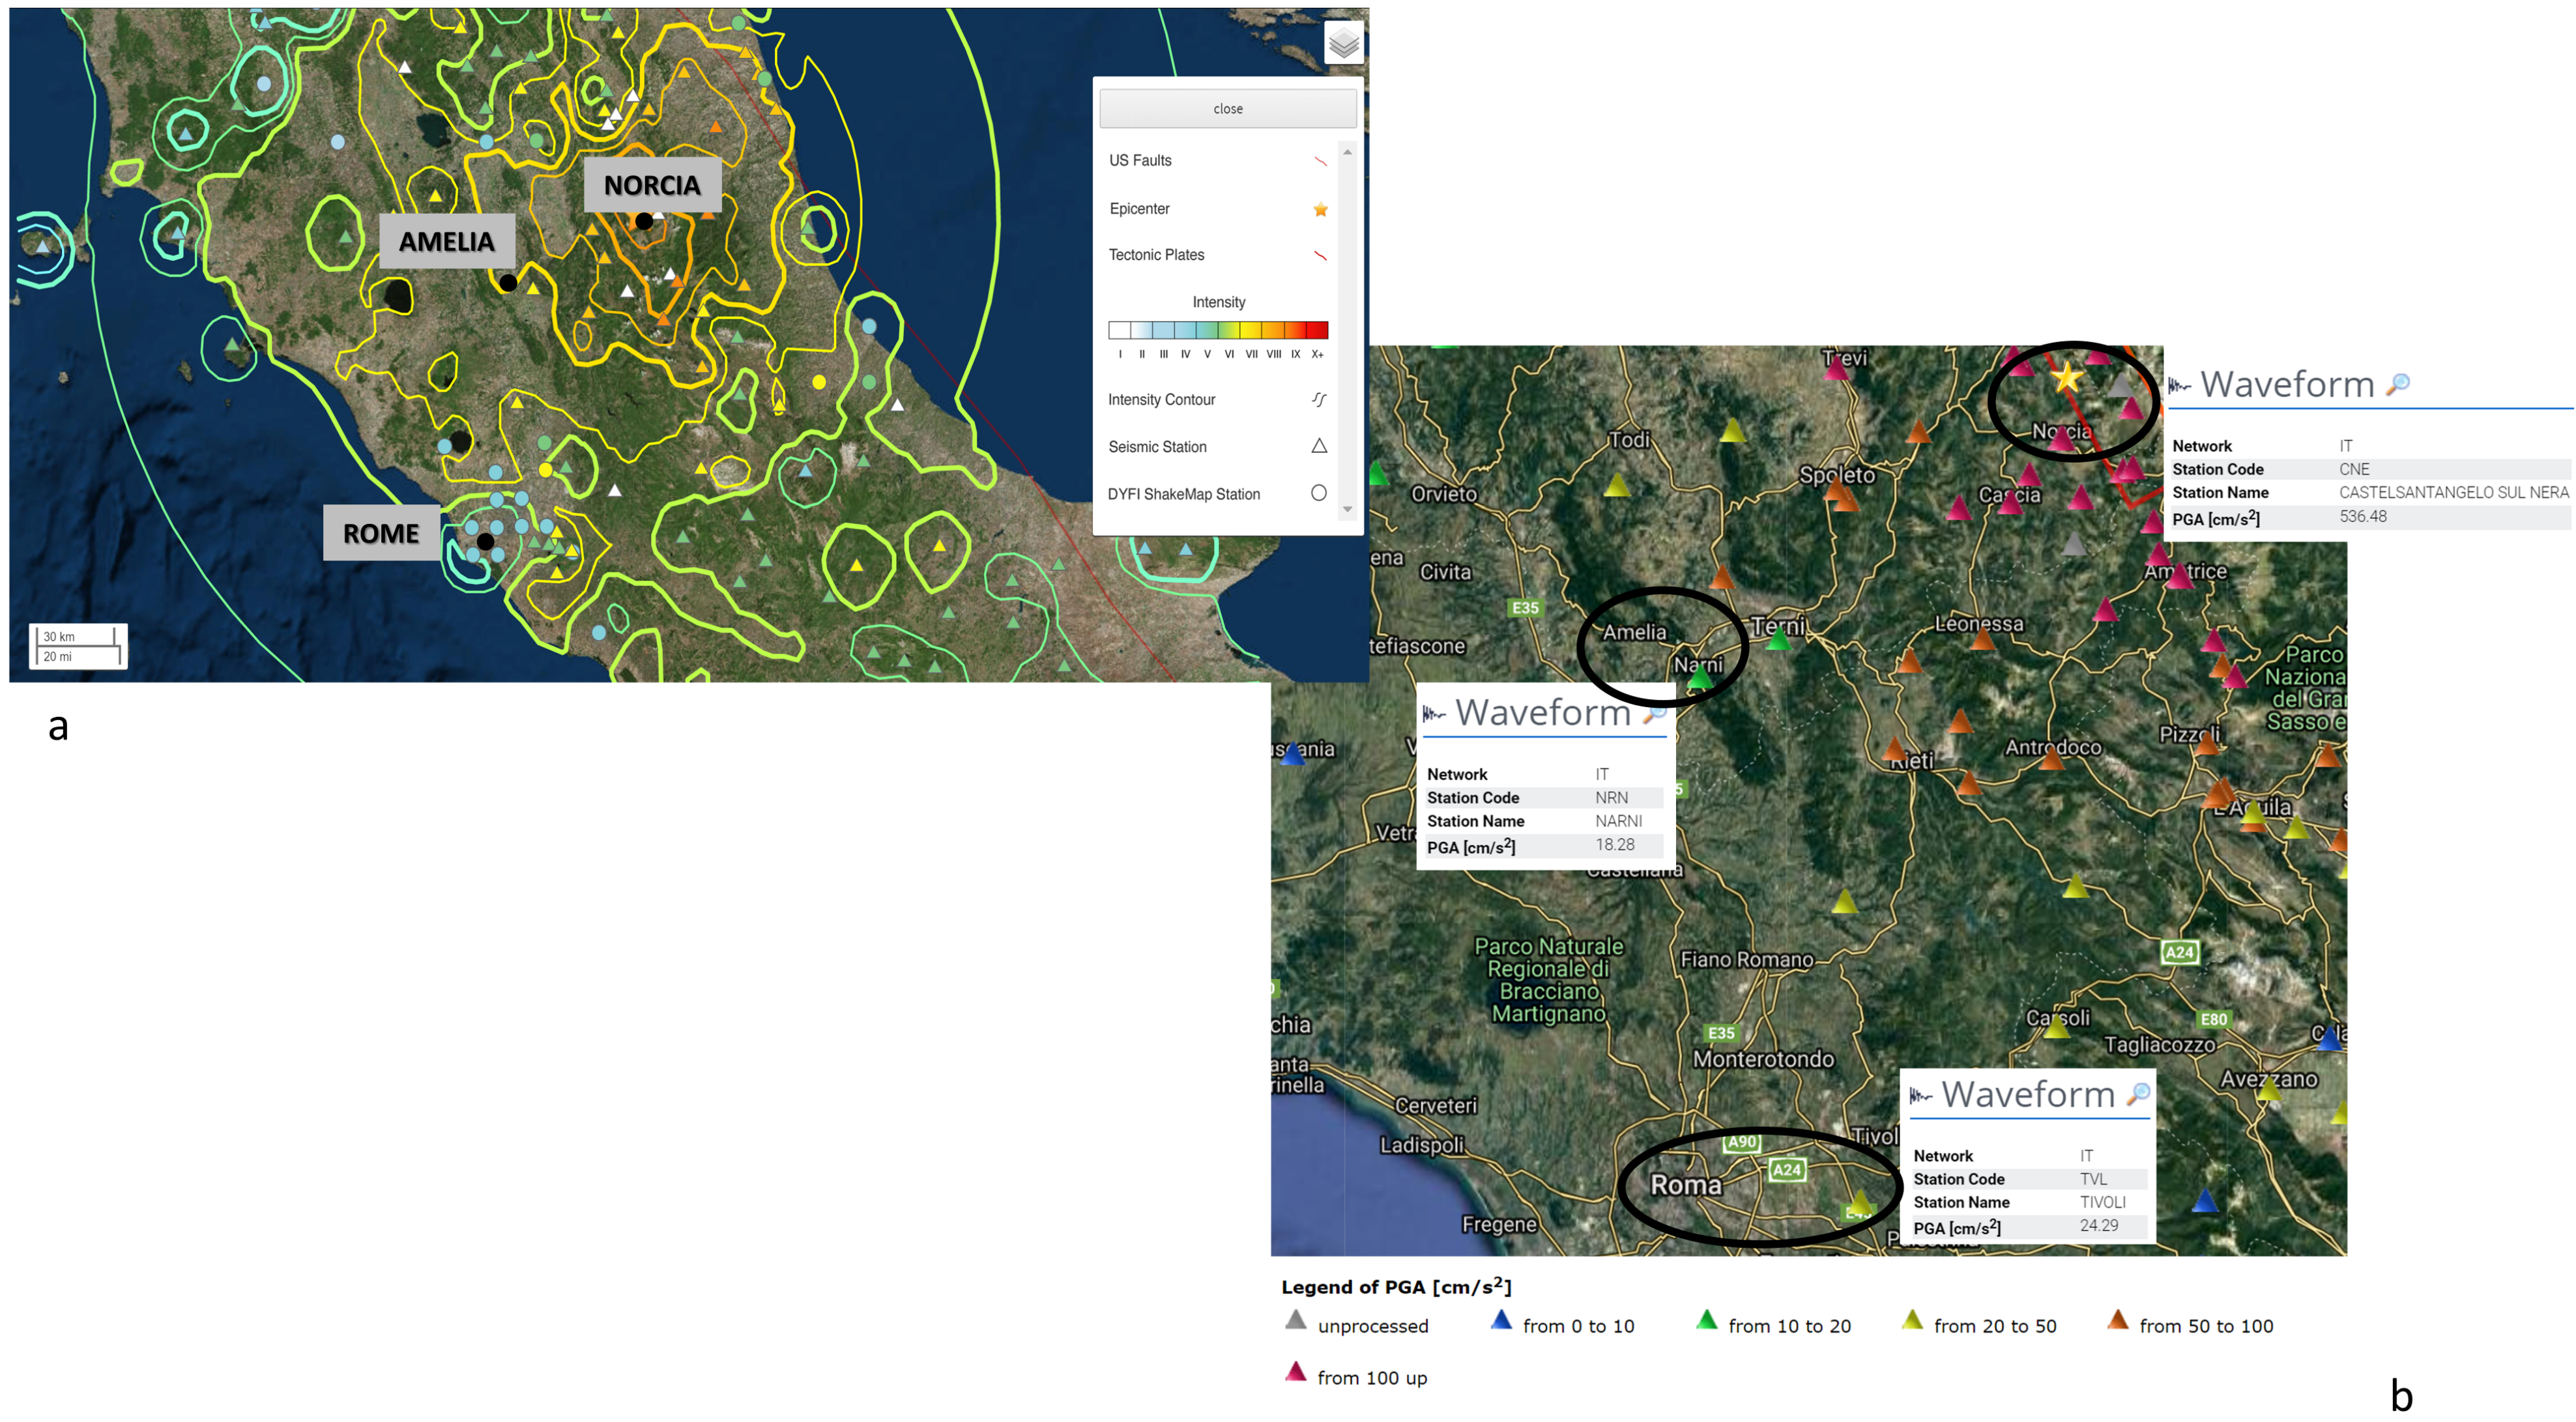
2.1. The Norcia 2016 Earthquake
2.2. The GPR Measurements
3. Results and Discussion
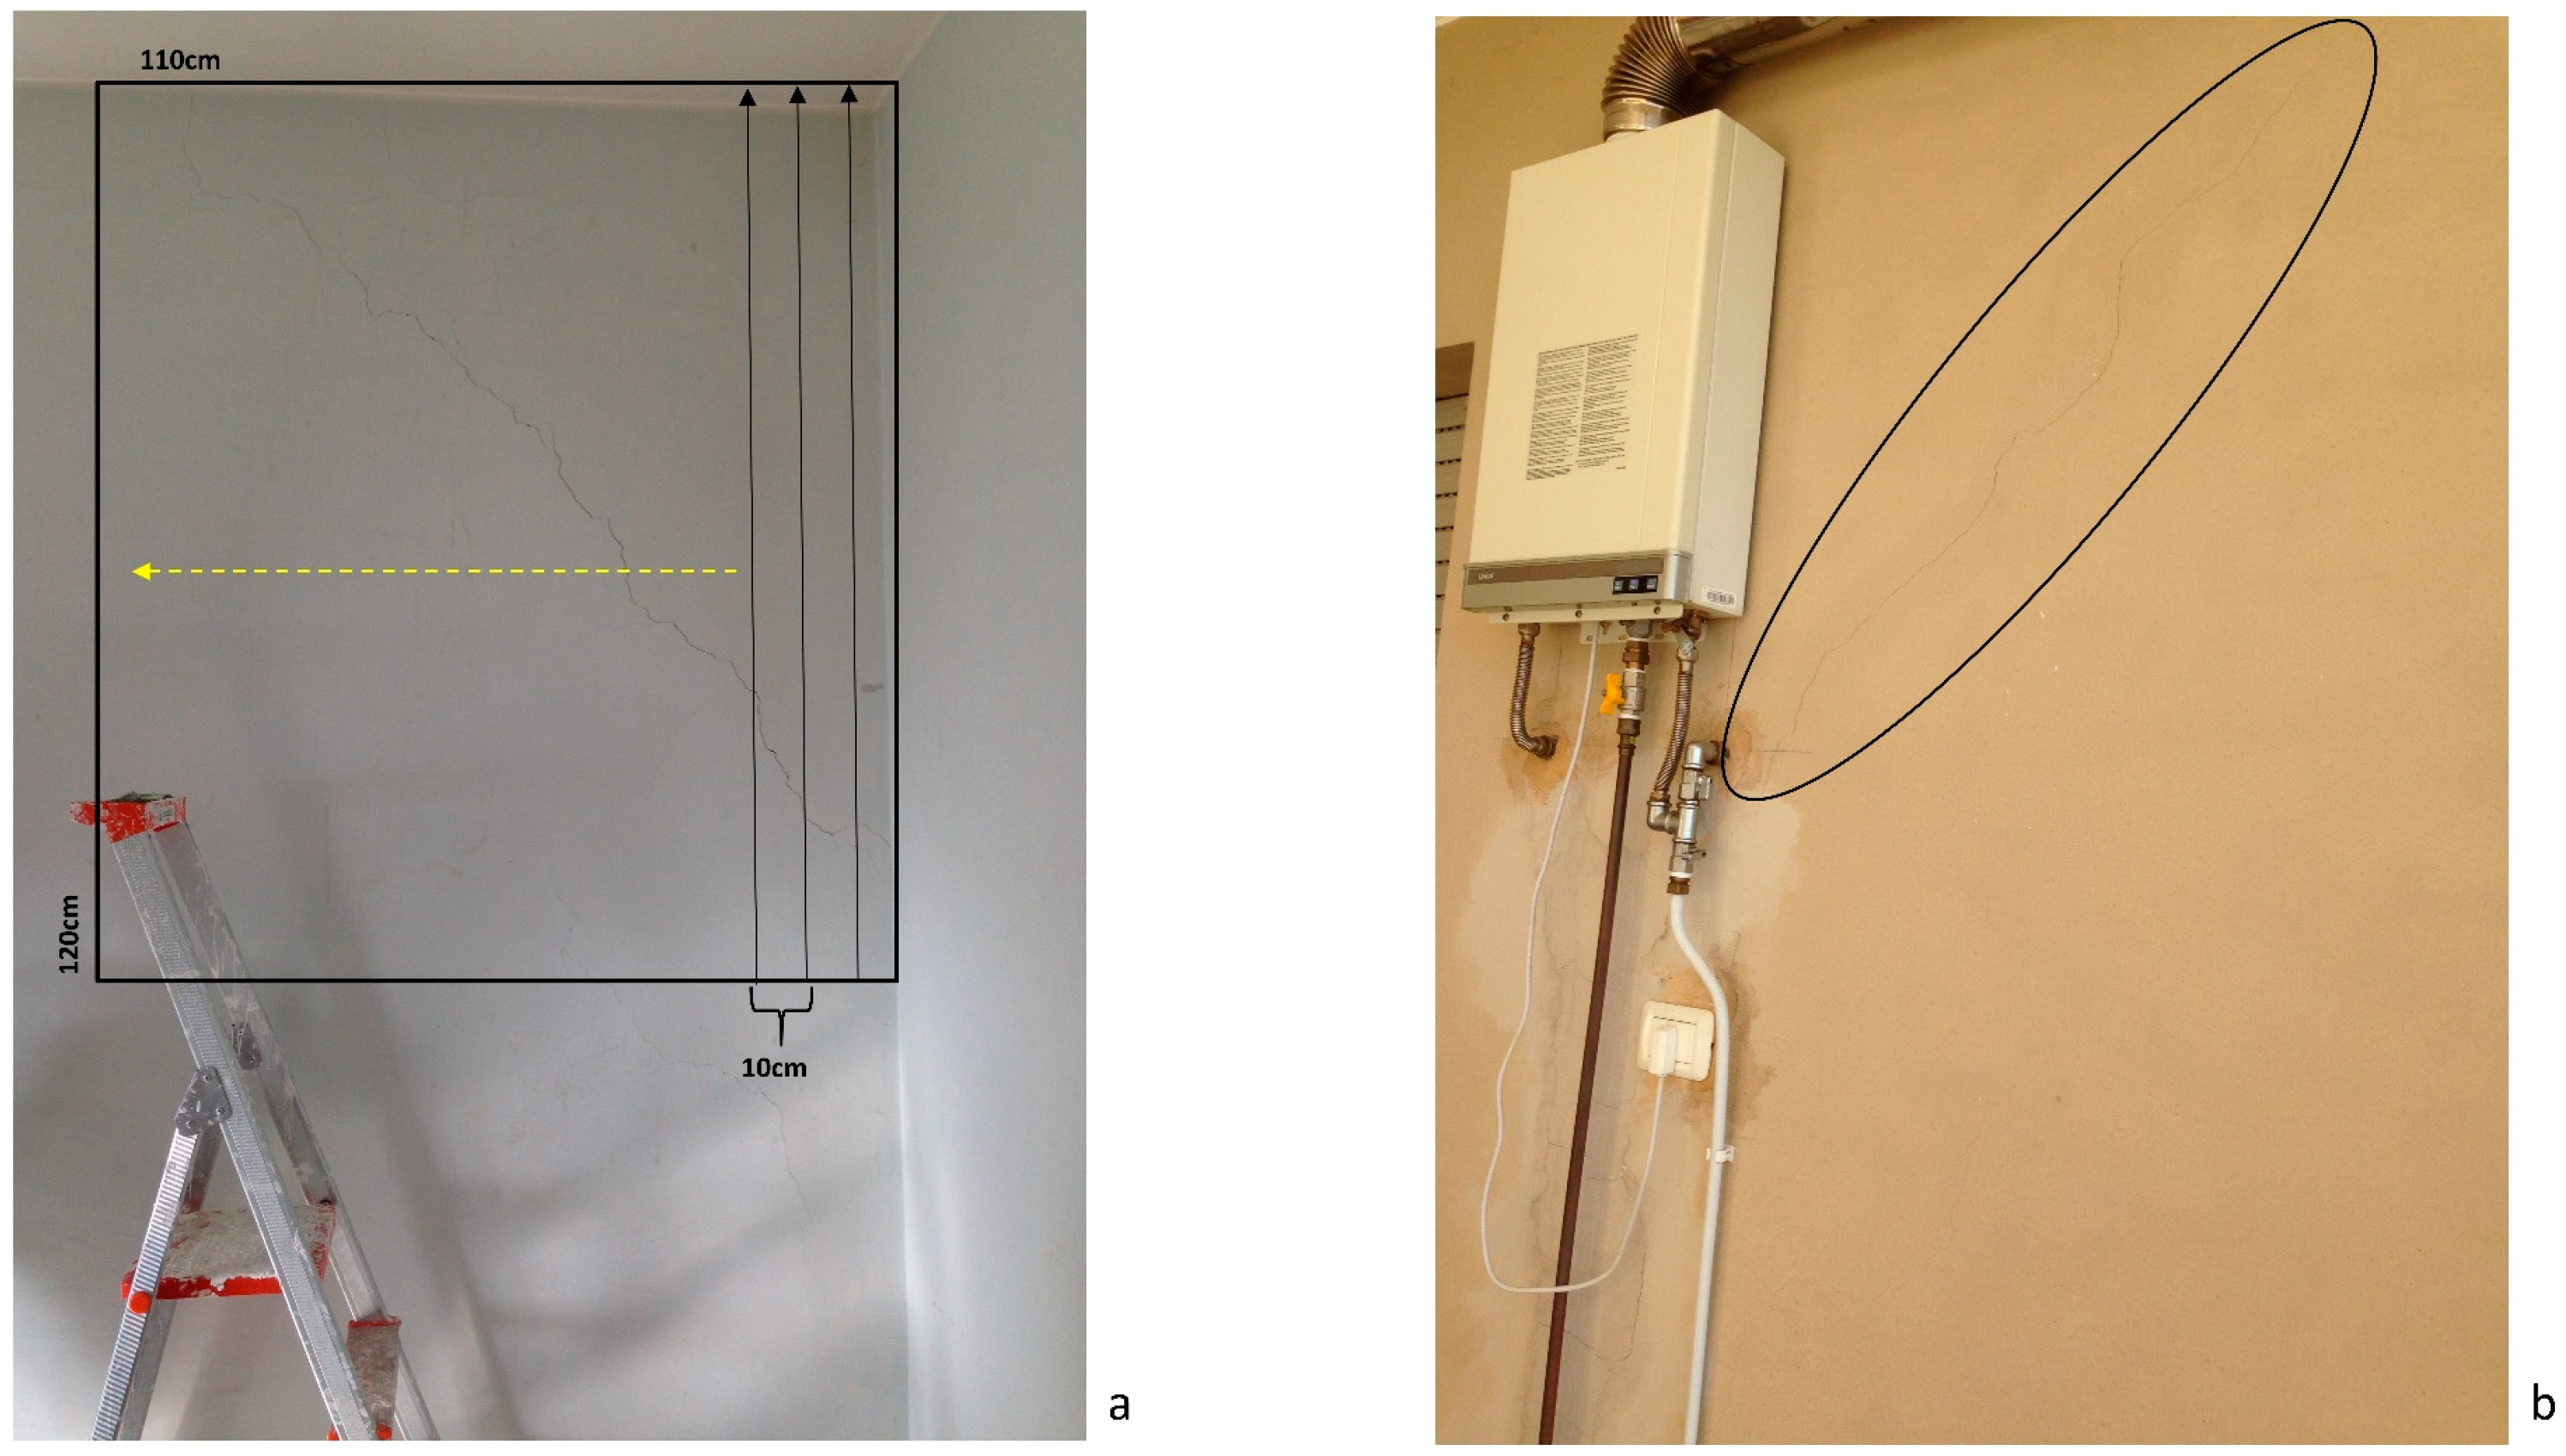
3.1. Amelia
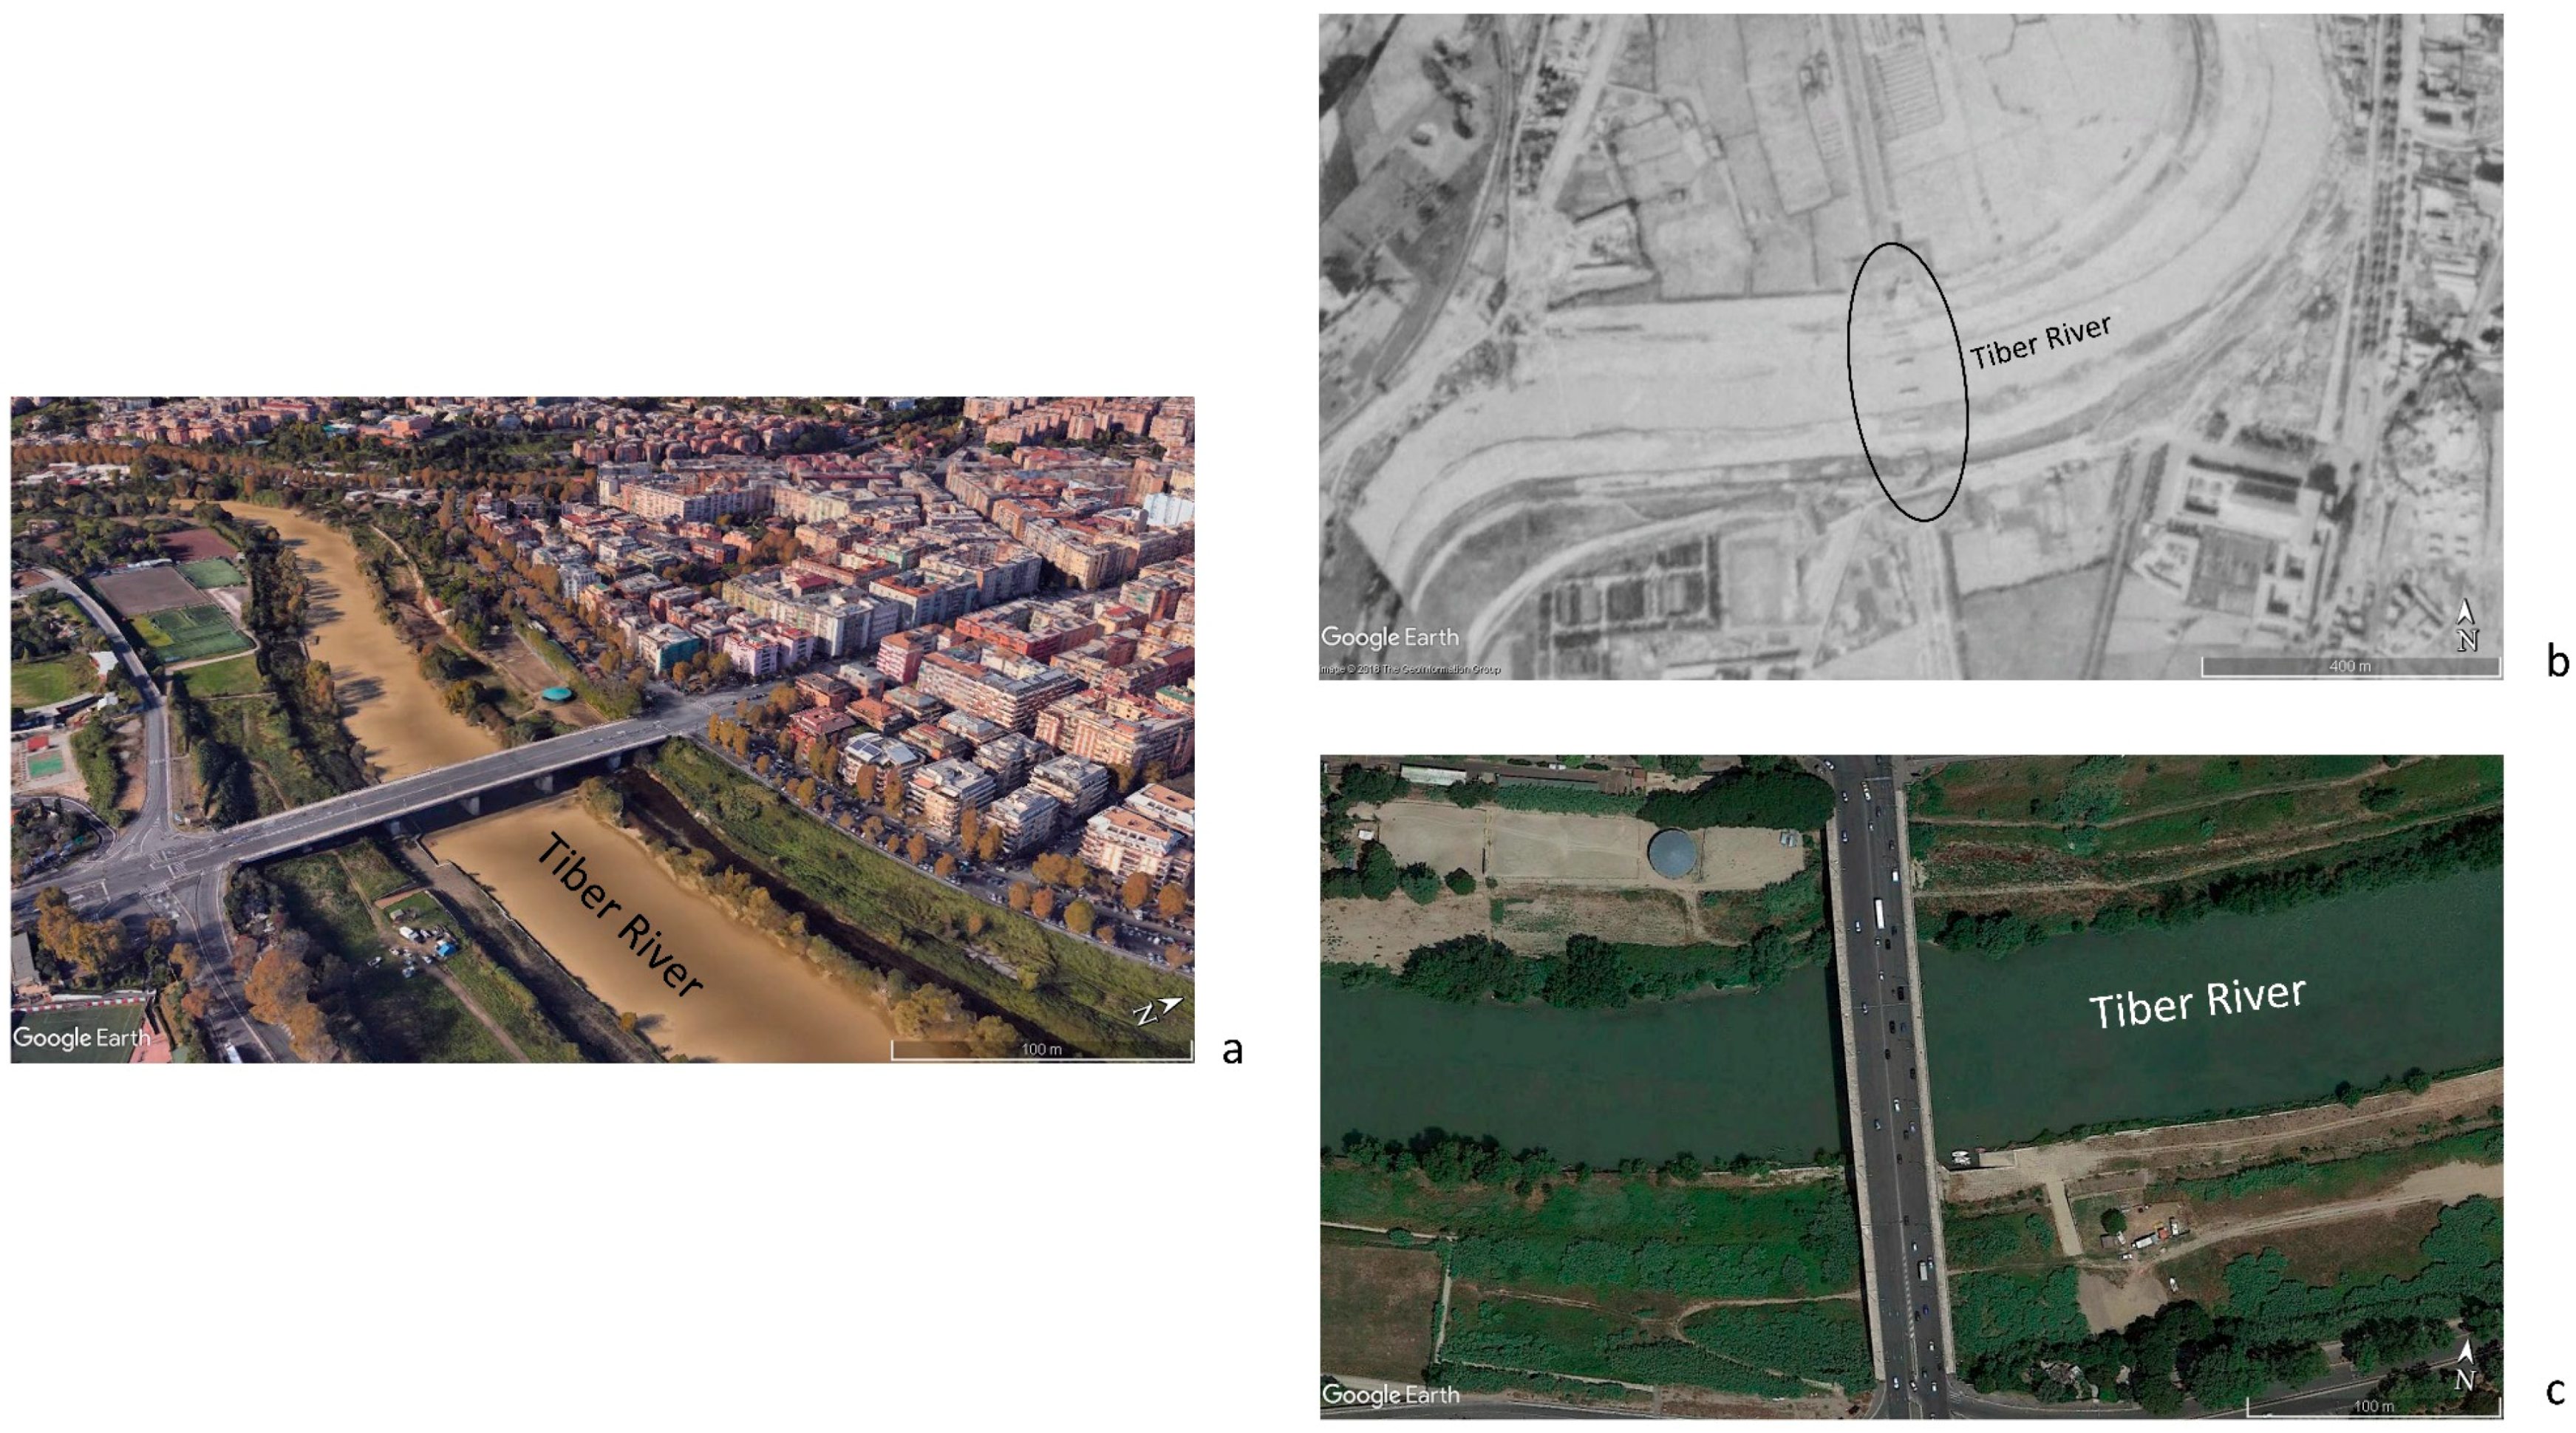
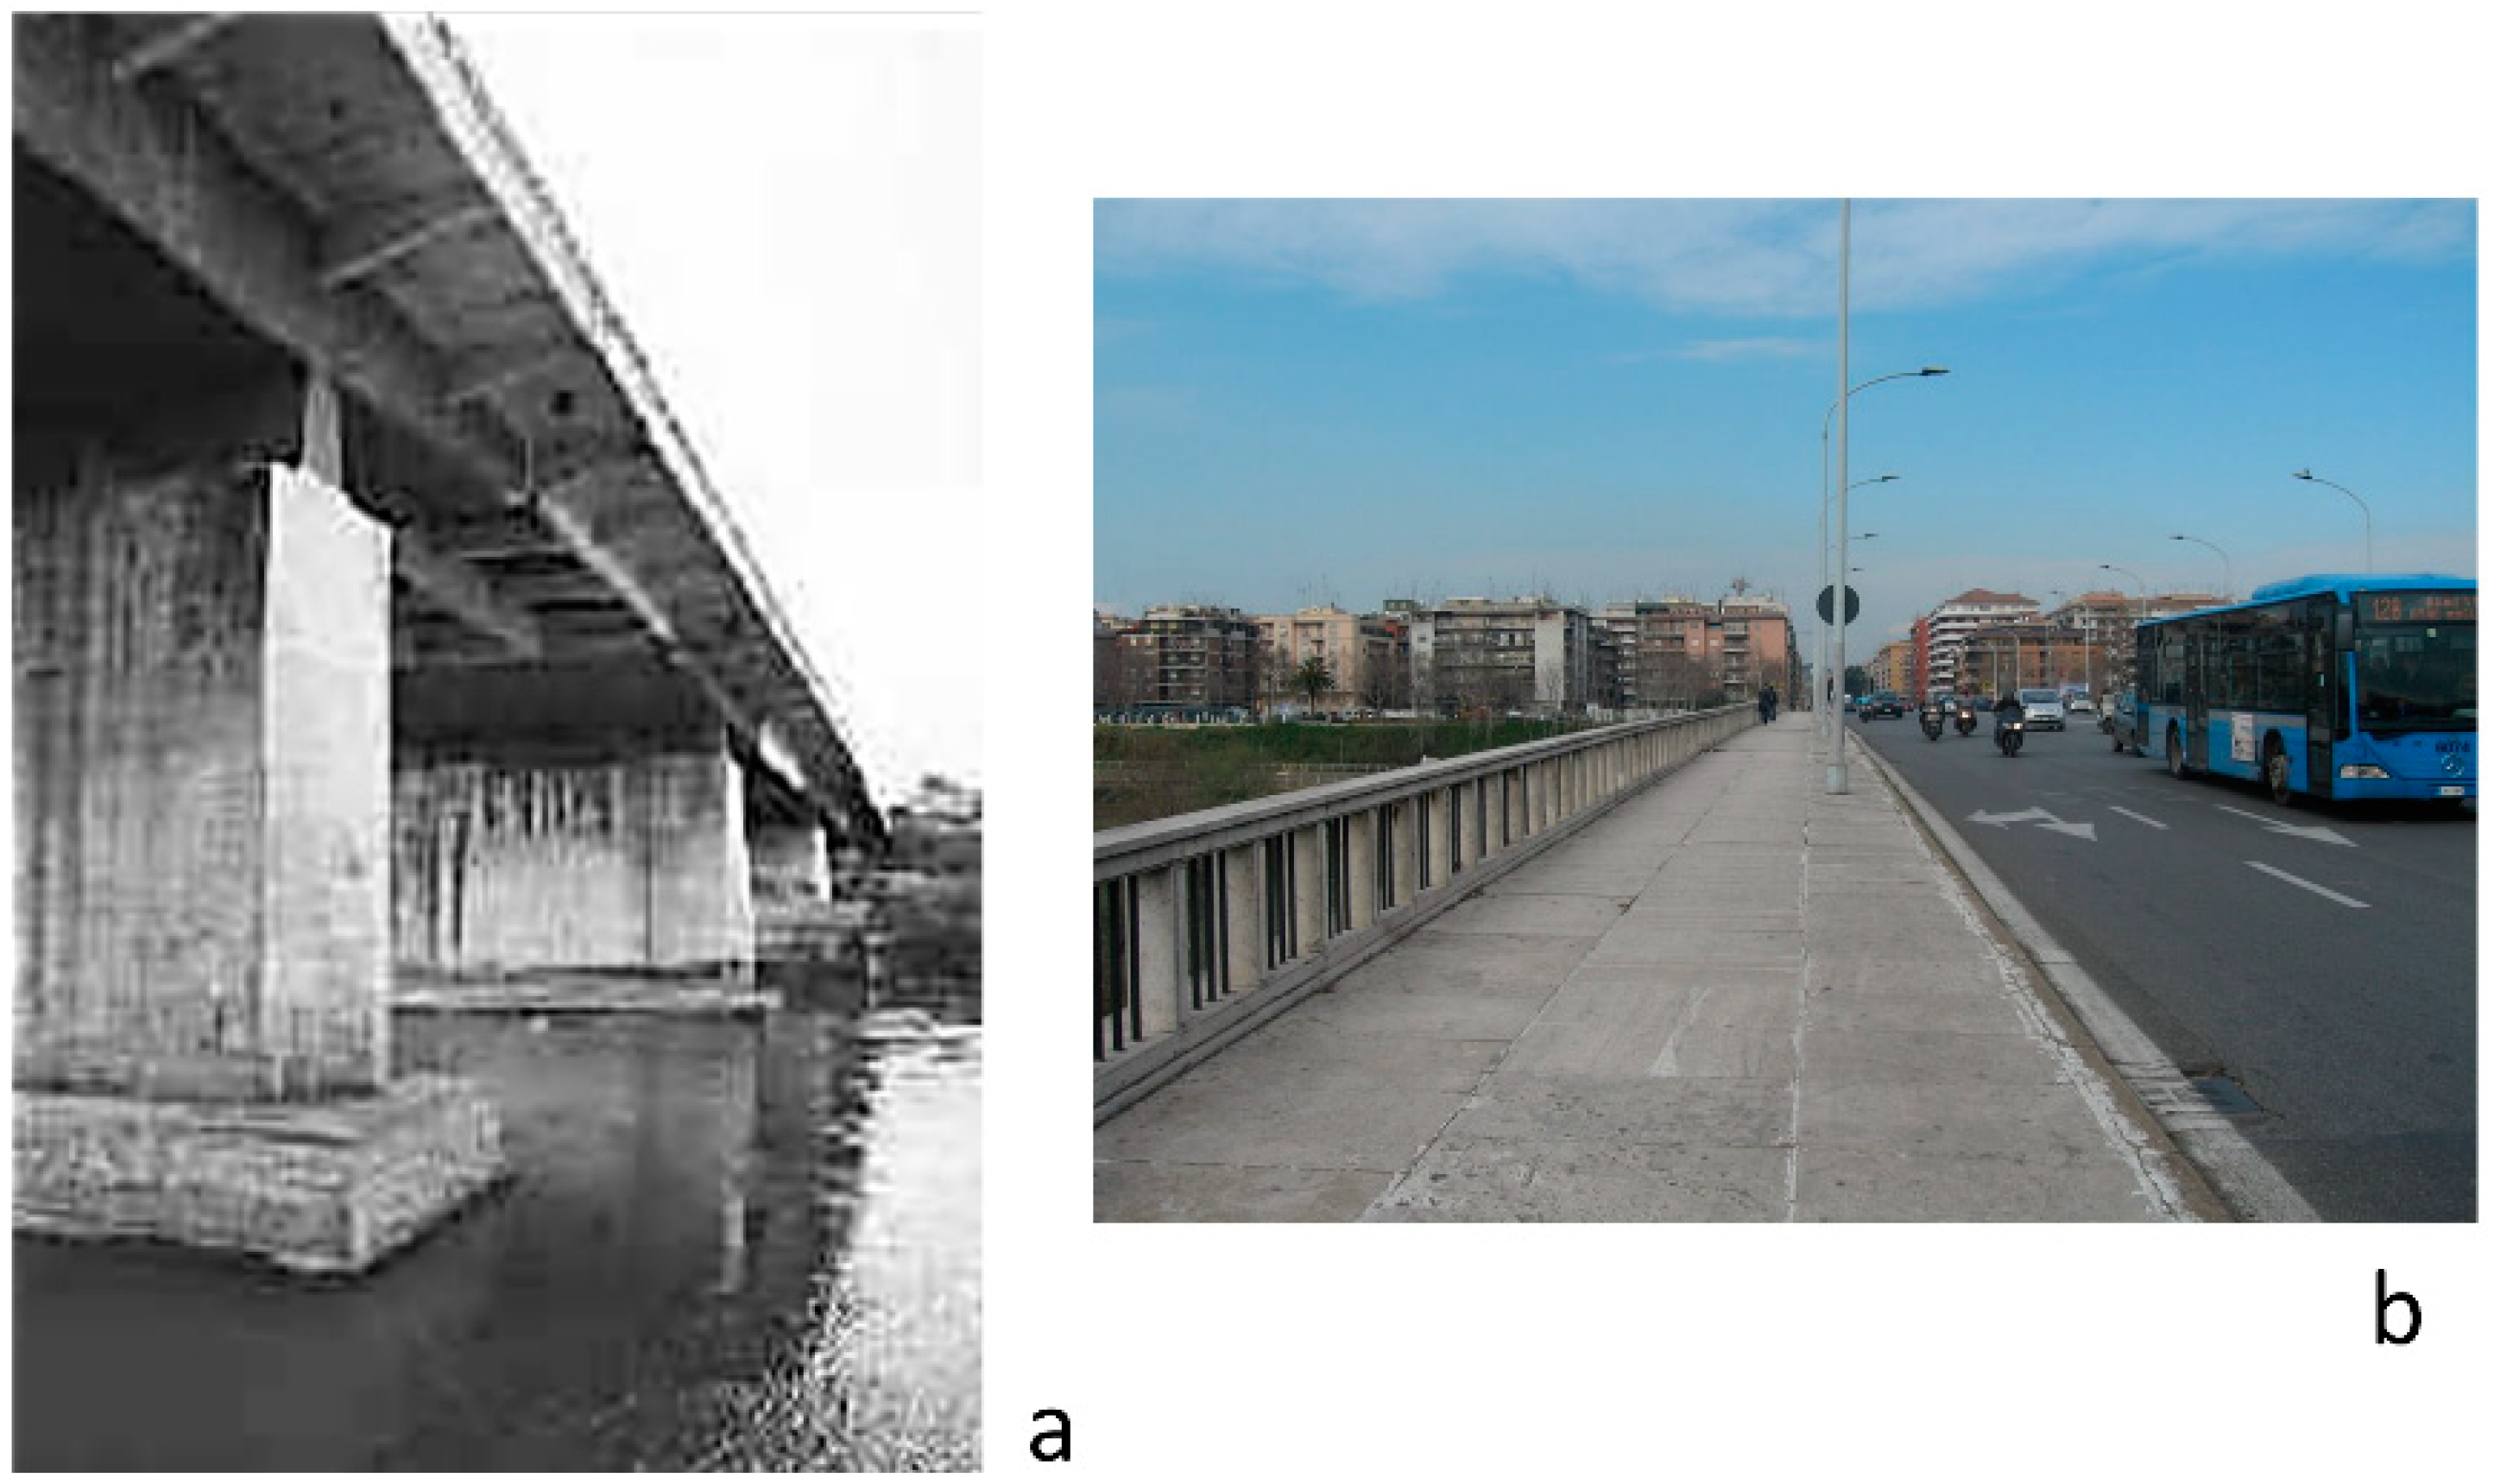
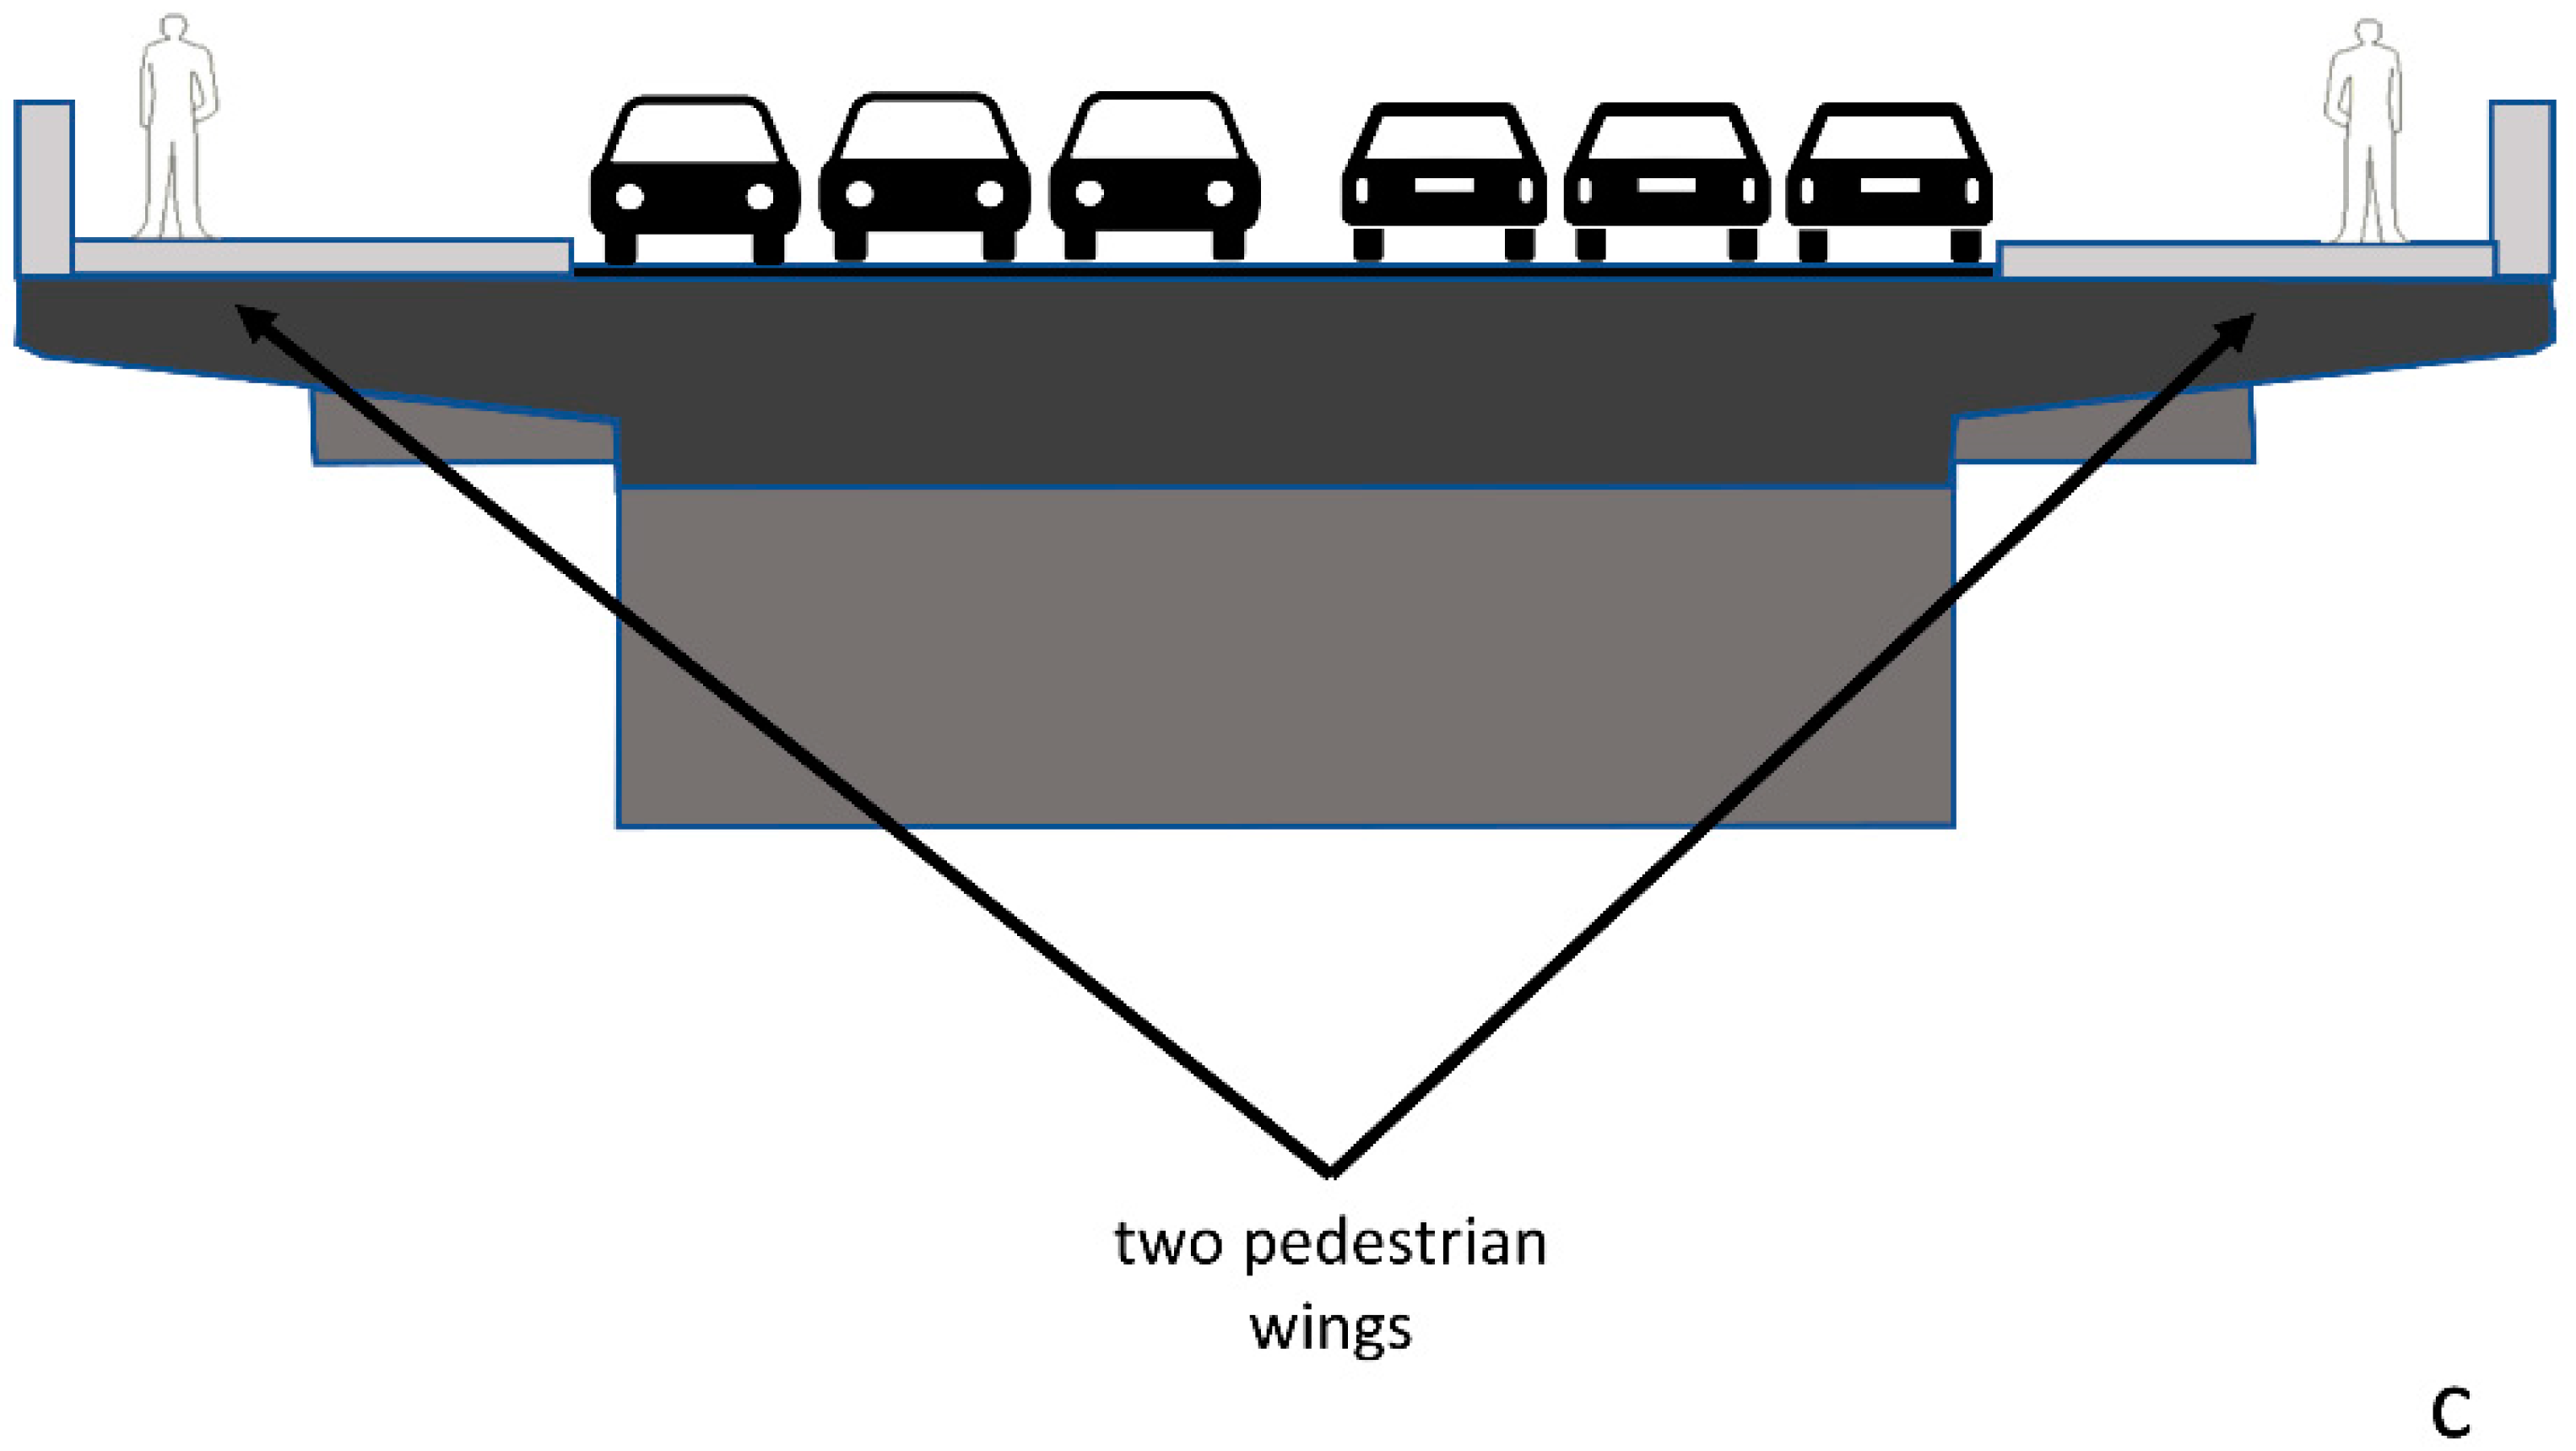
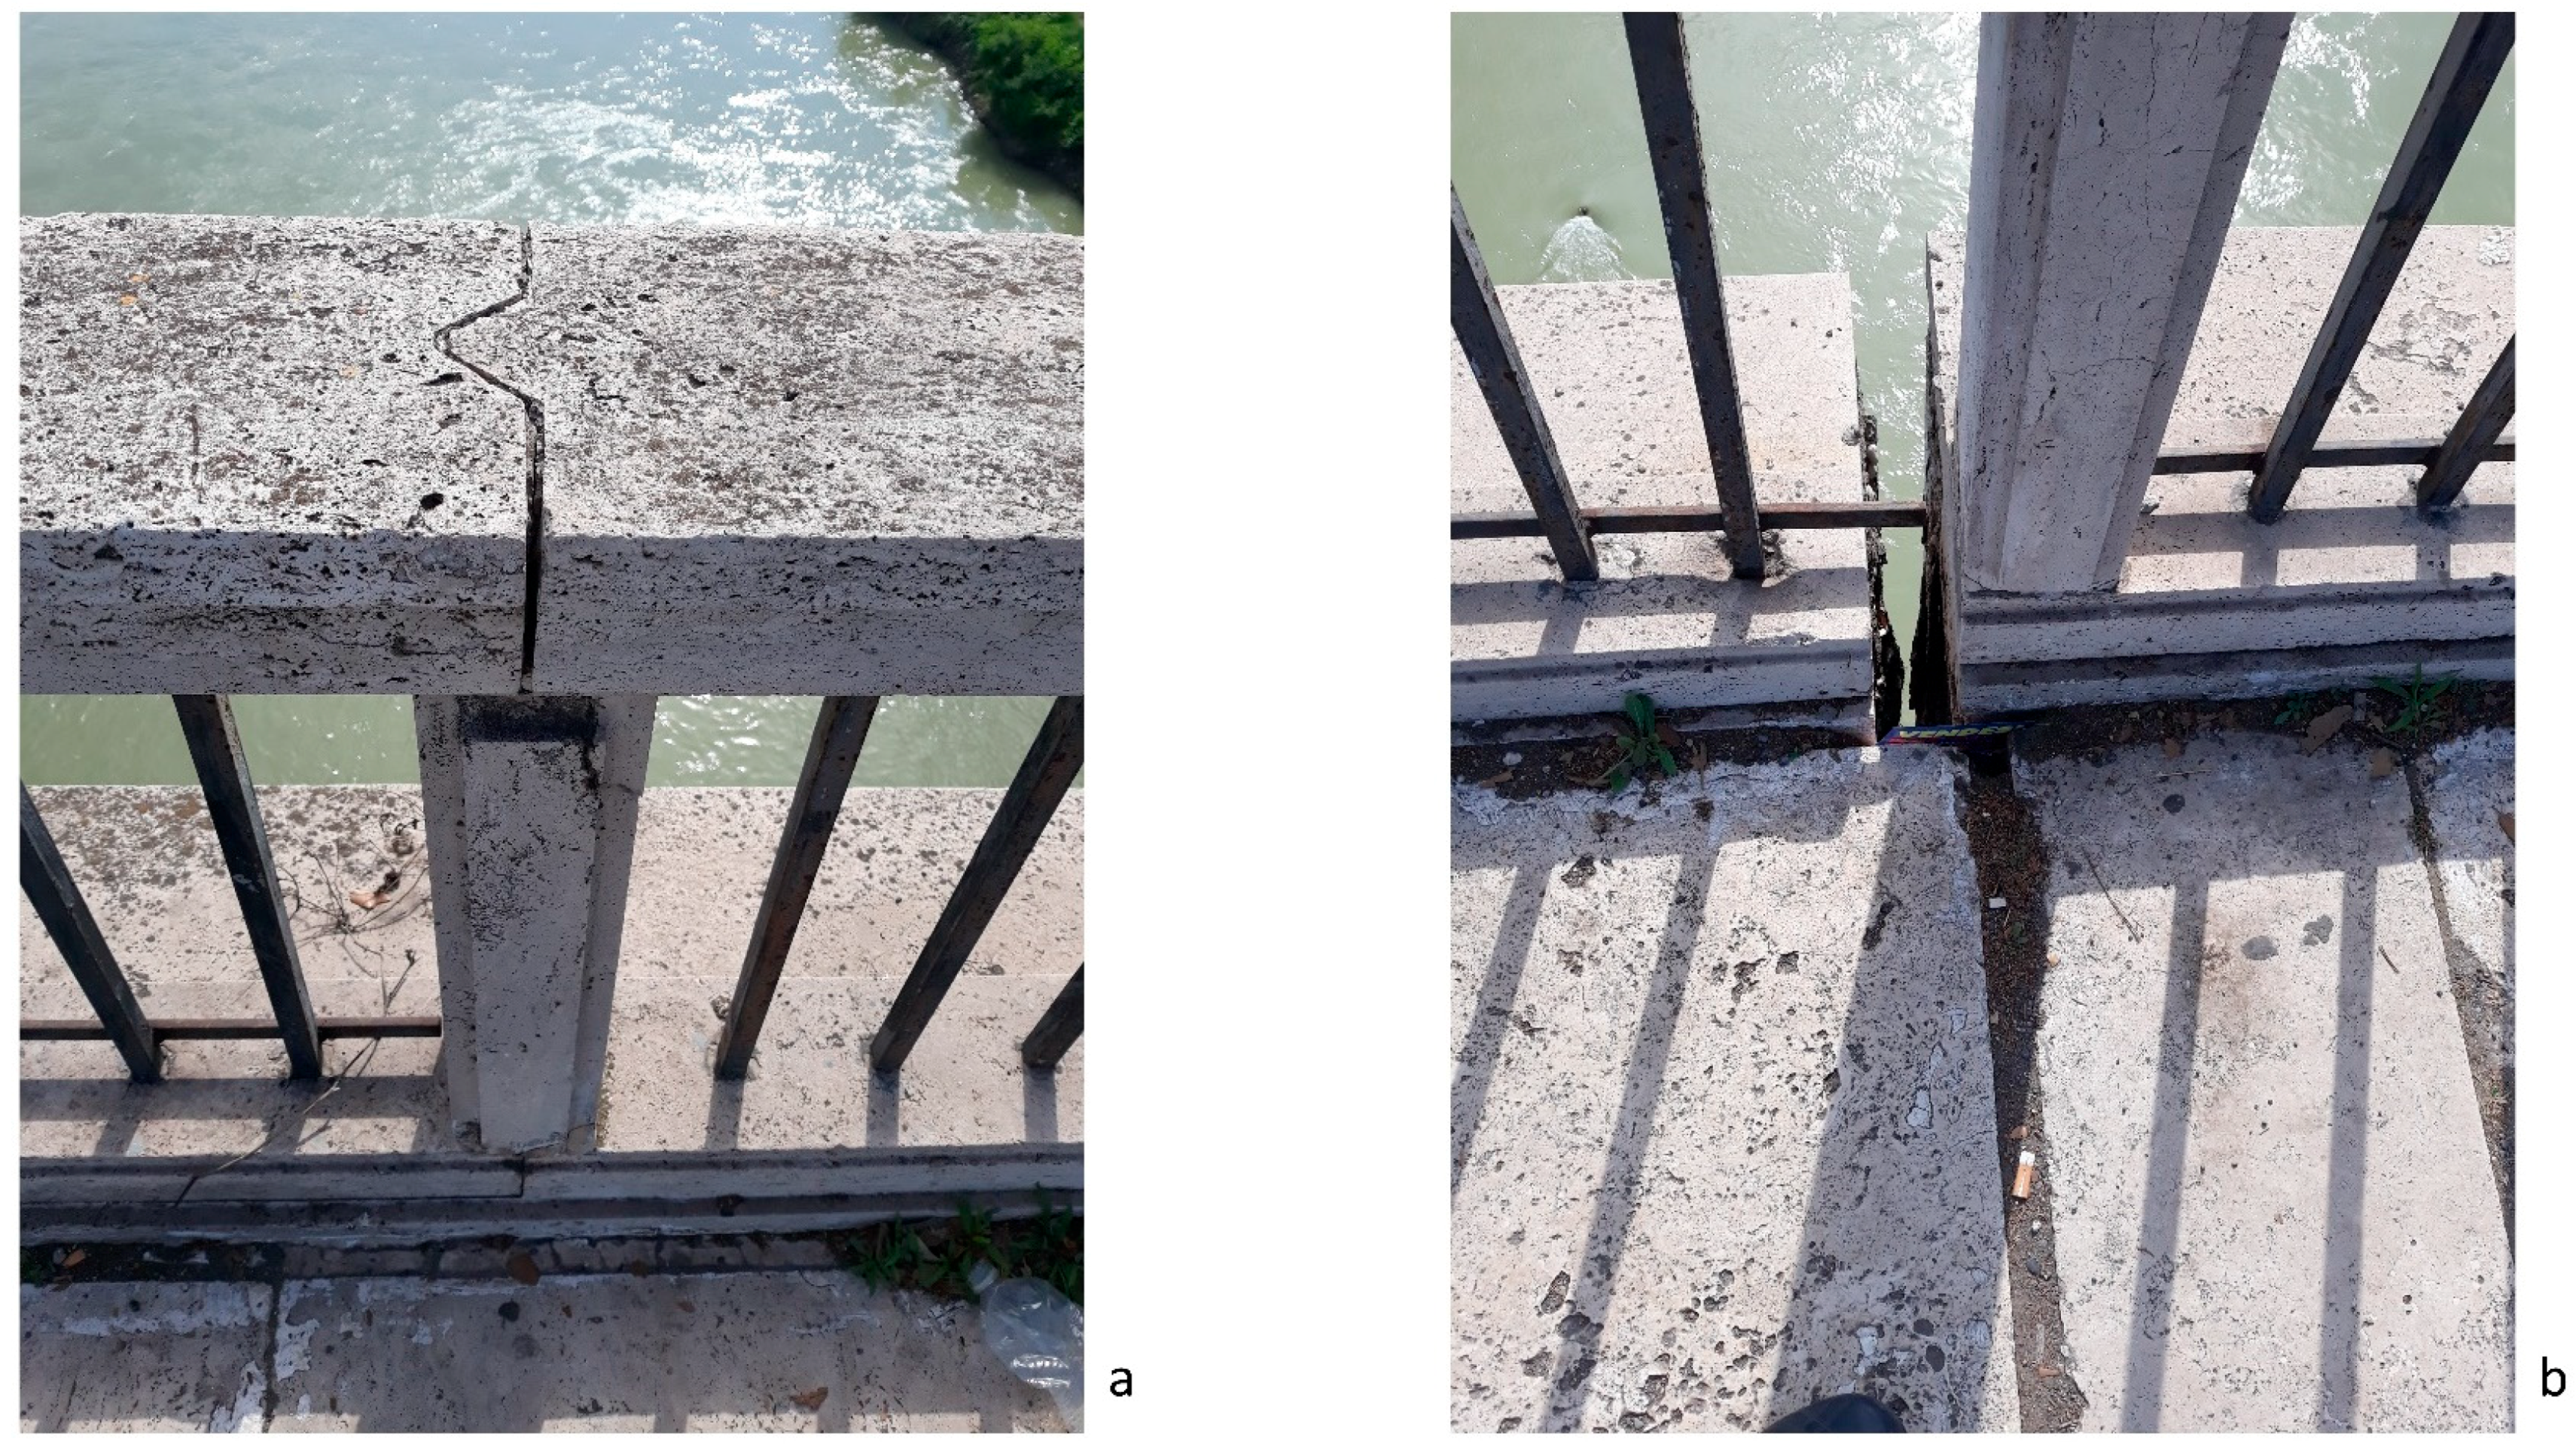
3.2. Rome
4. Conclusions
Author Contributions
Funding
Conflicts of Interest
References
- Di Maggio, R.M.; Barone, P.M. (Eds.) Geoscientists at Crime Scenes. A Companion to Forensic Geoscience; Springer International Publishing: Heidelberg, Germany, 2017. [Google Scholar] [CrossRef]
- Rivard, L.A. Geohazard-Associated Geounits: Atlas and Glossary; Springer Science & Business Media: Berlin, Germany, 2009. [Google Scholar] [CrossRef]
- Busby, J.P.; Cuss, R.J.; Raines, M.G.; Beamish, D. Application of Ground Penetrating Radar to Geological Investigations; IR/04/21; British Geological Survey: Keyworth, UK, 2004; Available online: http://nora.nerc.ac.uk/11336/1/IR04021.pdf (accessed on 28 June 2018).
- Gutiérrez, F.; Parise, M.; DeWaele, J.; Jourde, H. A review on natural and human-induced geohazards and impacts in karst. Earth-Sci. Rev. 2014, 138, 61–88. [Google Scholar] [CrossRef]
- Borecka, A.; Herzig, J.; Durjasz-Rybacka, M. Ground penetrating radar investigations of landslides: A case study in a landslide in Radziszów. Stud. Geotech. Mech. 2015, 37, 11–18. [Google Scholar] [CrossRef]
- Burton, I. Forensic disaster investigations in depth: A new case study model. Environ. Mag. 2010, 52, 36–41. [Google Scholar] [CrossRef]
- International Strategy for Disaster Reduction (IRDR). The FORIN Project; IRDR: Bejing, China, 2011. [Google Scholar]
- Anbazhagan, P.; Murali Krishna, A. Forensic investigation of earthquake induced failures during Sikkim 2011 earthquake, India. In Proceedings of the 15th Asian Regional Conference on Soil Mechanics and Geotechnical Engineering, Fukuoka, Japan, 9–13 November 2014; Japanese Geotechnical Society Special Publication: Tokyo, Japan, 2014. [Google Scholar] [CrossRef]
- Takahashi, K.; Iitsuka, Y.; Koyama, C.N.; Sato, M. Application of GPR CMP Measurements to Earthquake Diagnosis of Wooden Buildings; International Symposium Non-Destructive Testing in Civil Engineering (NDT-CE): Berlin, Germany, 2015. [Google Scholar]
- Nakasu, T.; Ono, Y.; Pothisiri, W. Forensic investigation of the 2011 Great East Japan Earthquake and Tsunami disaster: A case study of Rikuzentakata. Disaster Prev. Manag. Int. J. 2017, 26, 298–313. [Google Scholar] [CrossRef]
- Woodward, J.; Stewart, I. Imaging near-surface tectonic structures using GPR: Western Eliki Fault, Gulf of Corinth, Greece. In Proceedings of the 12th International Conference on Ground Penetrating Radar, Birmingham, UK, 15–19 June 2008. [Google Scholar]
- Rescue Radar. Available online: https://www.sensoft.ca/wp-content/uploads/2016/01/Forensic-Law-Enforcement_Search-Rescue_Buried-Victim-Search-Rescue.pdf (accessed on 28 June 2018).
- Mitchell, J.K. Megacities and Natural Disasters: A Comparative Analysis. GeoJournal 1999, 49, 137–142. [Google Scholar] [CrossRef]
- Yön, B.; Sayın, E.; Onat, O. Earthquakes and Structural Damages; InTech Open: Rijeka, Croatia, 2017. [Google Scholar] [CrossRef]
- Jia, J.; Yan, J. Analysis about factors affecting the degree of damage of buildings in earthquake. J. Phys. Conf. Ser. 2015, 628. [Google Scholar] [CrossRef]
- Smith, T.O.; Hoffman, S. (Eds.) The Angry Earth: Disaster in Anthropological Perspective; Routledge: New York, NY, USA, 1999. [Google Scholar] [CrossRef]
- White, G.F.; Kates, R.W.; Burton, I. Knowing Better and Losing Even More: The Use of Knowledge in Hazards Management. Glob. Environ. Chang. Part B Environ. Hazards 2001, 3, 81–92. [Google Scholar] [CrossRef]
- Mvududu, N.H.; Sink, C.A. Factor Analysis in Counseling Research and Practice. CORE Counsel. Outcome Res. Eval. 2013, 4, 75–98. [Google Scholar] [CrossRef]
- Oliveira, C.S.; Ferreira, M.A.; Mota de Sá, F.; Bonacho, J. New Tools for the Analysis of the Generalized Impact of Earthquake Events. In Earthquake Engineering and Structural Dynamics in Memory of Ragnar Sigbjörnsson; Rupakhety, R., Ólafsson, S., Eds.; ICESD 2017; Geotechnical, Geological and Earthquake Engineering, 44; Springer: Cham, Switzerland, 2018. [Google Scholar] [CrossRef]
- Villani, F.; Civico, R.; Pucci, S.; Pizzimenti, L.; Nappi, R.; De Martini, P.M.; Open EMERGEO Working Group. Data Descriptor: A database of the coseismic effects following the 30 October 2016 Norcia earthquake in Central Italy. Sci. Data 2018, 5, 180049. [Google Scholar] [CrossRef] [PubMed]
- Chiaraluce, L.; Di Stefano, R.; Tinti, E.; Scognamiglio, L.; Michele, M.; Casarotti, E.; Cattaneo, M.; De Gori, P.; Chiarabba, C.; Monachesi, G.; et al. The 2016 Central Italy Seismic Sequence: A First Look at the Mainshocks, Aftershocks, and Source Models. Seismol. Res. Lett. 2017, 88, 1–15. [Google Scholar] [CrossRef]
- Moretti, M.; Pondrelli, S.; Margheriti, L.; Mazza, S. SISMIKO: Emergency network deployment and data sharing for the 2016 central Italy seismic sequence. Ann. Geophys. 2016, 59, 8. [Google Scholar] [CrossRef]
- Gruppo di Lavoro INGV sul Terremoto in Centro Italia. Summary Report on the October 30, 2016 Earthquake in central Italy Mw 6.5; INGV: Roma, Italy, 2016. [Google Scholar] [CrossRef]
- ReLUIS-INGV Workgroug. Preliminary Study on Strong Motion Data of the 2016 Central Italy Seismic Sequence V6. 2016. Available online: http://www.reluis.it (accessed on 19 July 2018).
- Pacor, F.; Paolucci, R.; Ameri, G.; Massa, M.; Puglia, R. Italian strong motion records in ITACA: Overview and record processing. Bull. Earthq. Eng. 2011, 9, 1741–1759. [Google Scholar] [CrossRef]
- Liu, C.; Zheng, Y.; Xie, Z.; Xiong, X. Rupture features of the 2016 Mw 6.2 Norcia earthquake and its possible relationship with strong seismic hazards. Geophys. Res. Lett. 2017, 44, 1320–1328. [Google Scholar] [CrossRef]
- Smeraglia, L.; Billi, A.; Carminati, E.; Cavallo, A.; Doglioni, C. Field- to nano-scale evidence for weakening mechanisms along the fault of the 2016 Amatrice and Norcia earthquakes, Italy. Tectonophysics 2017. [Google Scholar] [CrossRef]
- Everett, M. Near-Surface Applied Geophysics; Cambridge University Press: Cambridge, UK, 2014; ISBN 978-107018778. [Google Scholar]
- Butler, D.K. (Ed.) Near Surface Geophysics, Investigations in Geophysics 13; Pristine Condition Like New edition; Society of Exploration Geophysicists: Tulsa, OK, USA, 2005; ISBN 978-1560801306. [Google Scholar]
- Annan, A.P. Ground Penetrating Radar: Principles, Procedures & Applications; Sensors & Software, Inc.: Mississauga, ON, Canada, 2004. [Google Scholar]
- Barone, P.M. Understanding Buried Anomalies: A Practical Guide to GPR; LAP-Lambert Academic Publishing: Saarbrucken, Germany, 2016; ISBN 978-3659935794. [Google Scholar]
- Persico, R. Introduction to Ground Penetrating Radar: Inverse Scattering and Data Processing; Wiley-Blackwell: Oxford, UK, 2014; ISBN 9781118305003. [Google Scholar]
- Jol, H.M. (Ed.) Ground Penetrating Radar: Theory and Applications; Elsevier: Amsterdam, The Netherlands, 2009. [Google Scholar]
- Wai-Lok Lai, W.; Dérobert, X.; Annan, A.P. Review of Ground Penetrating Radar application in civil engineering: A 30-year journey from Locating and Testing to Imaging and Diagnosis. NDT & E Int. 2017, 96, 58–78. [Google Scholar] [CrossRef]
- Binda, L.; Lualdi, M.; Saisi, A.; Zanzi, L. Radar investigation as a complementary tool for the diagnosis of historic masonry buildings. Int. J. Mater. Struct. Integr. 2011, 5, 1–25. [Google Scholar] [CrossRef]
- Goodman, D.; Piro, S. GPR Imaging on Historical Buildings and Structures. In GPR Remote Sensing in Archaeology; Goodman, D., Piro, S., Eds.; Geotechnologies and the Environment; Springer: New York, NY, USA, 2013; Volume 9, pp. 143–157. [Google Scholar] [CrossRef]
- Barone, P.M.; Di Matteo, A.; Graziano, F.; Mattei, E.; Pettinelli, E. GPR application to the structural control of historical buildings: Two case studies in Rome, Italy. Near Surf. Geophys. EAGE 2010, 8, 407–413. [Google Scholar] [CrossRef]
- Pettinelli, E.; Barone, P.M.; Mattei, E.; Di Matteo, A. GPR application to historical buildings structural control. Geophys. Res. Abstr. 2009, 11, EGU2009-10382-1. [Google Scholar]
- Barone, P.M.; Mattei, E.; Lauro, S.E.; Pettinelli, E. Non-destructive technique to investigate an archaeological structure: A GPR survey in the Domus Aurea (Rome, Italy). In Proceedings of the IEEE XIII International Conference on Ground Penetrating Radar (GPR 2010), Lecce, Italy, 21–25 June 2010. [Google Scholar] [CrossRef]
- Kadioglu, S.; Kadioglu, Y.K. Picturing internal fractures of historical statues using ground penetrating radar method. Adv. Geosci. 2010, 24, 23–34. [Google Scholar] [CrossRef]
- Ravaglioli, A. Roma anno 2750 ab Urbe Condita. Storia, Monumenti, Personaggi, Prospettive, Roma; Tascabili 1997; Newton Compton: Rome, Italy, 1997; ISBN 88-8183-670-X. [Google Scholar]
- Diamanti, N.; Annan, A.P.; Redman, J.D. Concrete Bridge Deck Deterioration Assessment Using Ground Penetrating Radar (GPR). J. Environ. Eng. Geophys. 2017, 22, 121–132. [Google Scholar] [CrossRef]
- Hugenschmidt, J. Concrete bridge inspection with a mobile GPR system. Constr. Build. Mater. 2002, 16, 147–154. [Google Scholar] [CrossRef]
- Annan, A.P.; Redman, J.D. High speed ground-coupled GPR for road & bridge inspection. In Proceedings of the 11th International Conference on Structural Faults and Repair, Edinburgh, UK, 13–15 June 2006; p. 10. [Google Scholar]
- Solla, M.; Lorenzo, H.; Rial, F.I.; Novo, A.; Riveiro, B. Masonry arch bridges evaluation by means of GPR. In Proceedings of the IEEE XIII International Conference on Ground Penetrating Radar (GPR 2010), Lecce, Italy, 21–25 June 2010. [Google Scholar] [CrossRef]
- From Amatrice to Norcia to Rome, the Artistic Heritage Brought to Its Knees by the Earthquake. La Repubblica. 30 October 2016. (Italian Newspaper). Available online: http://www.repubblica.it/cronaca/2016/10/30/news/ferita_al_patrimonio_artistico_italiano-150904613/ (accessed on 2 July 2018).
- Italy Earthquake Causes Cracks to Appear in St Paul’s Basilica and Other Vatican landmarks. The Independent. 30 October 2016. (UK Newspaper). Available online: https://www.independent.co.uk/news/world/europe/italy-earthquake-today-rome-vatican-tourism-safety-pope-francis-st-paul-basilica-a7387861.html (accessed on 2 July 2018).
- Italy Fears for Colosseum as ‘Cracks Get Bigger’ after Each Quake. The Telegraph. 31 October 2016. (UK Newspaper). Available online: https://www.telegraph.co.uk/news/2016/10/31/italy-fears-for-colosseum-as-cracks-get-bigger-after-each-quake/ (accessed on 2 July 2018).
- Minghini, M.; Sarretta, A.; Lupia, F.; Napolitano, M.; Palmas, A.; Delucchi, L. Collaborative mapping response to disasters through OpenStreetMap: The case of the 2016 Italian earthquake. Geoing. Ambient. Miner. 2017, 2, 21–26. [Google Scholar]


© 2018 by the authors. Licensee MDPI, Basel, Switzerland. This article is an open access article distributed under the terms and conditions of the Creative Commons Attribution (CC BY) license (http://creativecommons.org/licenses/by/4.0/).
Share and Cite
Barone, P.M.; Di Maggio, R.M. Forensic Investigations of Geohazards: The Norcia 2016 Earthquake. Geosciences 2018, 8, 316. https://doi.org/10.3390/geosciences8090316
Barone PM, Di Maggio RM. Forensic Investigations of Geohazards: The Norcia 2016 Earthquake. Geosciences. 2018; 8(9):316. https://doi.org/10.3390/geosciences8090316
Chicago/Turabian StyleBarone, Pier Matteo, and Rosa Maria Di Maggio. 2018. "Forensic Investigations of Geohazards: The Norcia 2016 Earthquake" Geosciences 8, no. 9: 316. https://doi.org/10.3390/geosciences8090316
APA StyleBarone, P. M., & Di Maggio, R. M. (2018). Forensic Investigations of Geohazards: The Norcia 2016 Earthquake. Geosciences, 8(9), 316. https://doi.org/10.3390/geosciences8090316