Article

Monitoring Thermal Activity of the Beppu Geothermal Area in Japan Using Multisource Satellite Thermal Infrared Data

by
Md. Bodruddoza Mia
1,2,*,
Yasuhiro Fujimitsu
1 and
Jun Nishijima
1
1
Department of Earth Resources Engineering, Faculty of Engineering, Kyushu University, Fukuoka 819-0395, Japan
2
Department of Geology, Faculty of Earth and Environmental Sciences, University of Dhaka, Dhaka 1000, Bangladesh
*
Author to whom correspondence should be addressed.
Geosciences 2018, 8(8), 306; https://doi.org/10.3390/geosciences8080306
Submission received: 11 July 2018 / Revised: 29 July 2018 / Accepted: 12 August 2018 / Published: 17 August 2018

Abstract

:
The Beppu geothermal area, one of the largest spa resorts on the northeast Kyushu Island of Japan, is fed by hydrothermal fluids beneath the volcanic center of Mt. Garan and Mt. Tsurumi in the west. We explored the thermal status of the Beppu geothermal area using nighttime multisource satellite thermal infrared data (TIR) from the Advanced Spaceborne Thermal Emission and Reflection Radiometer (ASTER) and Landsat 8 thermal infrared scanner (TIRS) to monitor heat loss from 2009 to 2017. We also assessed heat loss from Mt. Garan fumaroles to investigate a relationship between them. The normalized differential vegetation index (NDVI) threshold method of spectral emissivity, the split-window algorithm for land surface temperature (LST), and the Stefan–Boltzmann equation for radiative heat flux (RHF) were used to estimate heat loss in this study. Total heat loss increased by about a 35% trend overall from 2009 to 2015 and then declined about 33–42% in 2017 in both the Beppu geothermal area and Mt. Garan fumaroles overall. The higher thermal anomalies were found in 2015 mostly in the southeastern coastal area of the Beppu geothermal region. The highest thermal anomaly was obtained in 2011 and the lowest in 2017 within the Mt. Garan fumaroles. The areas with a higher range of RHF values were recorded in 2015 in both study areas. Finally, the results show similar patterns of heat loss and thermal anomalies in both the Beppu geothermal area and Mt. Garan fumaroles, indicating a closely connected geothermal system overall. This suggests that nighttime TIR data are effective for monitoring the thermal status of the Beppu geothermal area.

1. Introduction

The Beppu geothermal area is situated at the eastern edge of the Beppu–Shimabara graben that crosses from northeast to southwest on Kyushu Island in Japan (Figure 1) [1]. Geologically, Beppu is one of the largest water-dominated geothermal systems in Japan, and it extends up from the Mt. Tsurumi–Mt. Garan volcanic center to the east coast of Beppu city, which is fed by geothermal fluid beneath the volcanic center of Mt. Tsurumi and Mt. Garan [2,3,4,5]. Beppu city is recognized historically as one of the largest spa resort areas on Kyushu Island, famous mostly for its onsen (hot spring bathing) and fumaroles [3,6]. The Beppu geothermal system is bounded by two striking faults at the north and south borders, almost along the east–west direction, and forms an alluvial fan in the center, made up by debris avalanches of andesite or dacite between the faults from the volcanoes behind [2,5]. Hydrothermal fluid flows along the two fault systems to the fan of the Beppu thermal area from the volcanic center, in southern and northern outflows known as the Beppu thermal zone and the Kamegawa thermal zone, respectively [7]. Beppu city is built up around the two thermal zones. Thermal activity consists of mud pools, fumaroles, and steam-heated ground in the thermal zones of the Beppu region and near the summits of Mt. Garan and Mt. Tsurumi [8]. Otherwise, there are two types of fumarolic activity near the summits of Mt. Garan and Mt. Tsurumi. Almost all hot springs disappeared due to intense drilling for water wells and the development of the town of Beppu during the early 1900s, except one natural hot spring exists today, Chinoike Jigoku (“blood pond hell”), on the northern side of the Kamegawa thermal area [5,9,10]. So far, the number of wells drilled for heated water is about 3000, and the flow rate of hot spring water is about 50,000 tons per day, including fumaroles of this area [2]. Thermal water is mostly extracted through 50–700 m deep boreholes below the surface of the Beppu thermal area [11]. A recent study of airborne thermal infrared data estimated about 20 and 1 MW heat discharge rate from Garandake and Tsurumi, respectively [12]. Hence, it is essential to explore and monitor the thermal status of the Beppu region to assess the sustainability of long-term use of hydrothermal fluids for many small-scale geothermal plants and direct use for tourist entertainment. Typically, there are some ground-based geothermal exploration and monitoring systems in this region, but such monitoring is expensive, time-consuming, and sometimes difficult to carry out due to high thermal ground or unstable areas and a natural park around the Beppu geothermal system. So far, there has been no research on heat loss from the Beppu thermal area and Mt. Garan fumaroles using nighttime satellite-borne thermal infrared data, although there are multispectral thermal infrared data from both day and night for this region that are freely available and can be used within a short time to monitor the spatial thermal heat loss of this region.
Satellite multispectral thermal infrared data of Advanced Spaceborne Thermal Emission and Reflection Radiometer (ASTER) and Landsat thematic mapper (TM)/enhanced thematic mapper plus (ETM+)/thermal infrared scanner (TIRS) sensors are used nowadays to explore and map hydrothermal alterations and thermal anomalies in volcanic areas and efficiently measure radiative heat loss and heat discharge [13,14,15,16,17]. The Landsat 8 optical land imager (OLI)/TIRS sensor launched on 11 February 2013. This sensor provides 16 days of temporal coverage of the global landmass at spatial resolutions of 30 m (eight bands of visible, near-infrared, and shortwave infrared), 100 m (two bands of thermal infrared), and 15 m (one band of panchromatic) multispectral bands of data during both the day and night [18]. The ASTER sensor launched onboard NASA’s Terra spacecraft on 18 December 1999, has 16 days of temporal and spatial resolution of 15 m (four bands of visible and near-infrared), 30 m (six bands of shortwave infrared), and 90 m (five thermal infrared) multispectral bands of both day and night images [19]. Both OLI/TIRS and ASTER sensors have the capability to detect thermal anomalies, hydrothermal alteration mapping, and eruption activities [13,20,21,22].
In this research, our prime objective was to explore and monitor the thermal status of the Beppu geothermal area using nighttime multisensor satellite images from 2009 to 2017. The second objective was to assess heat loss from Mt. Garan fumaroles and investigate the correlation of heat loss between Mr. Garan fumaroles and the Beppu thermal area. Mt. Tsurumi fumarole is not exposed or quite small or covered by vegetation, which is not suitable for study using medium-resolution (ASTER, 90 m; Landsat TIRS, 100 m) multispectral satellite thermal infrared data. The introduction addresses the study area, previous studies, materials, and the idea, motivation, and objectives of the study. Geological settings are briefly described in the second section. The third section explains in detail the materials and methodology of this study. In the fourth section, results and major findings are explained and discussed. Finally, a conclusion is drawn in the fifth section about the results and discussion.

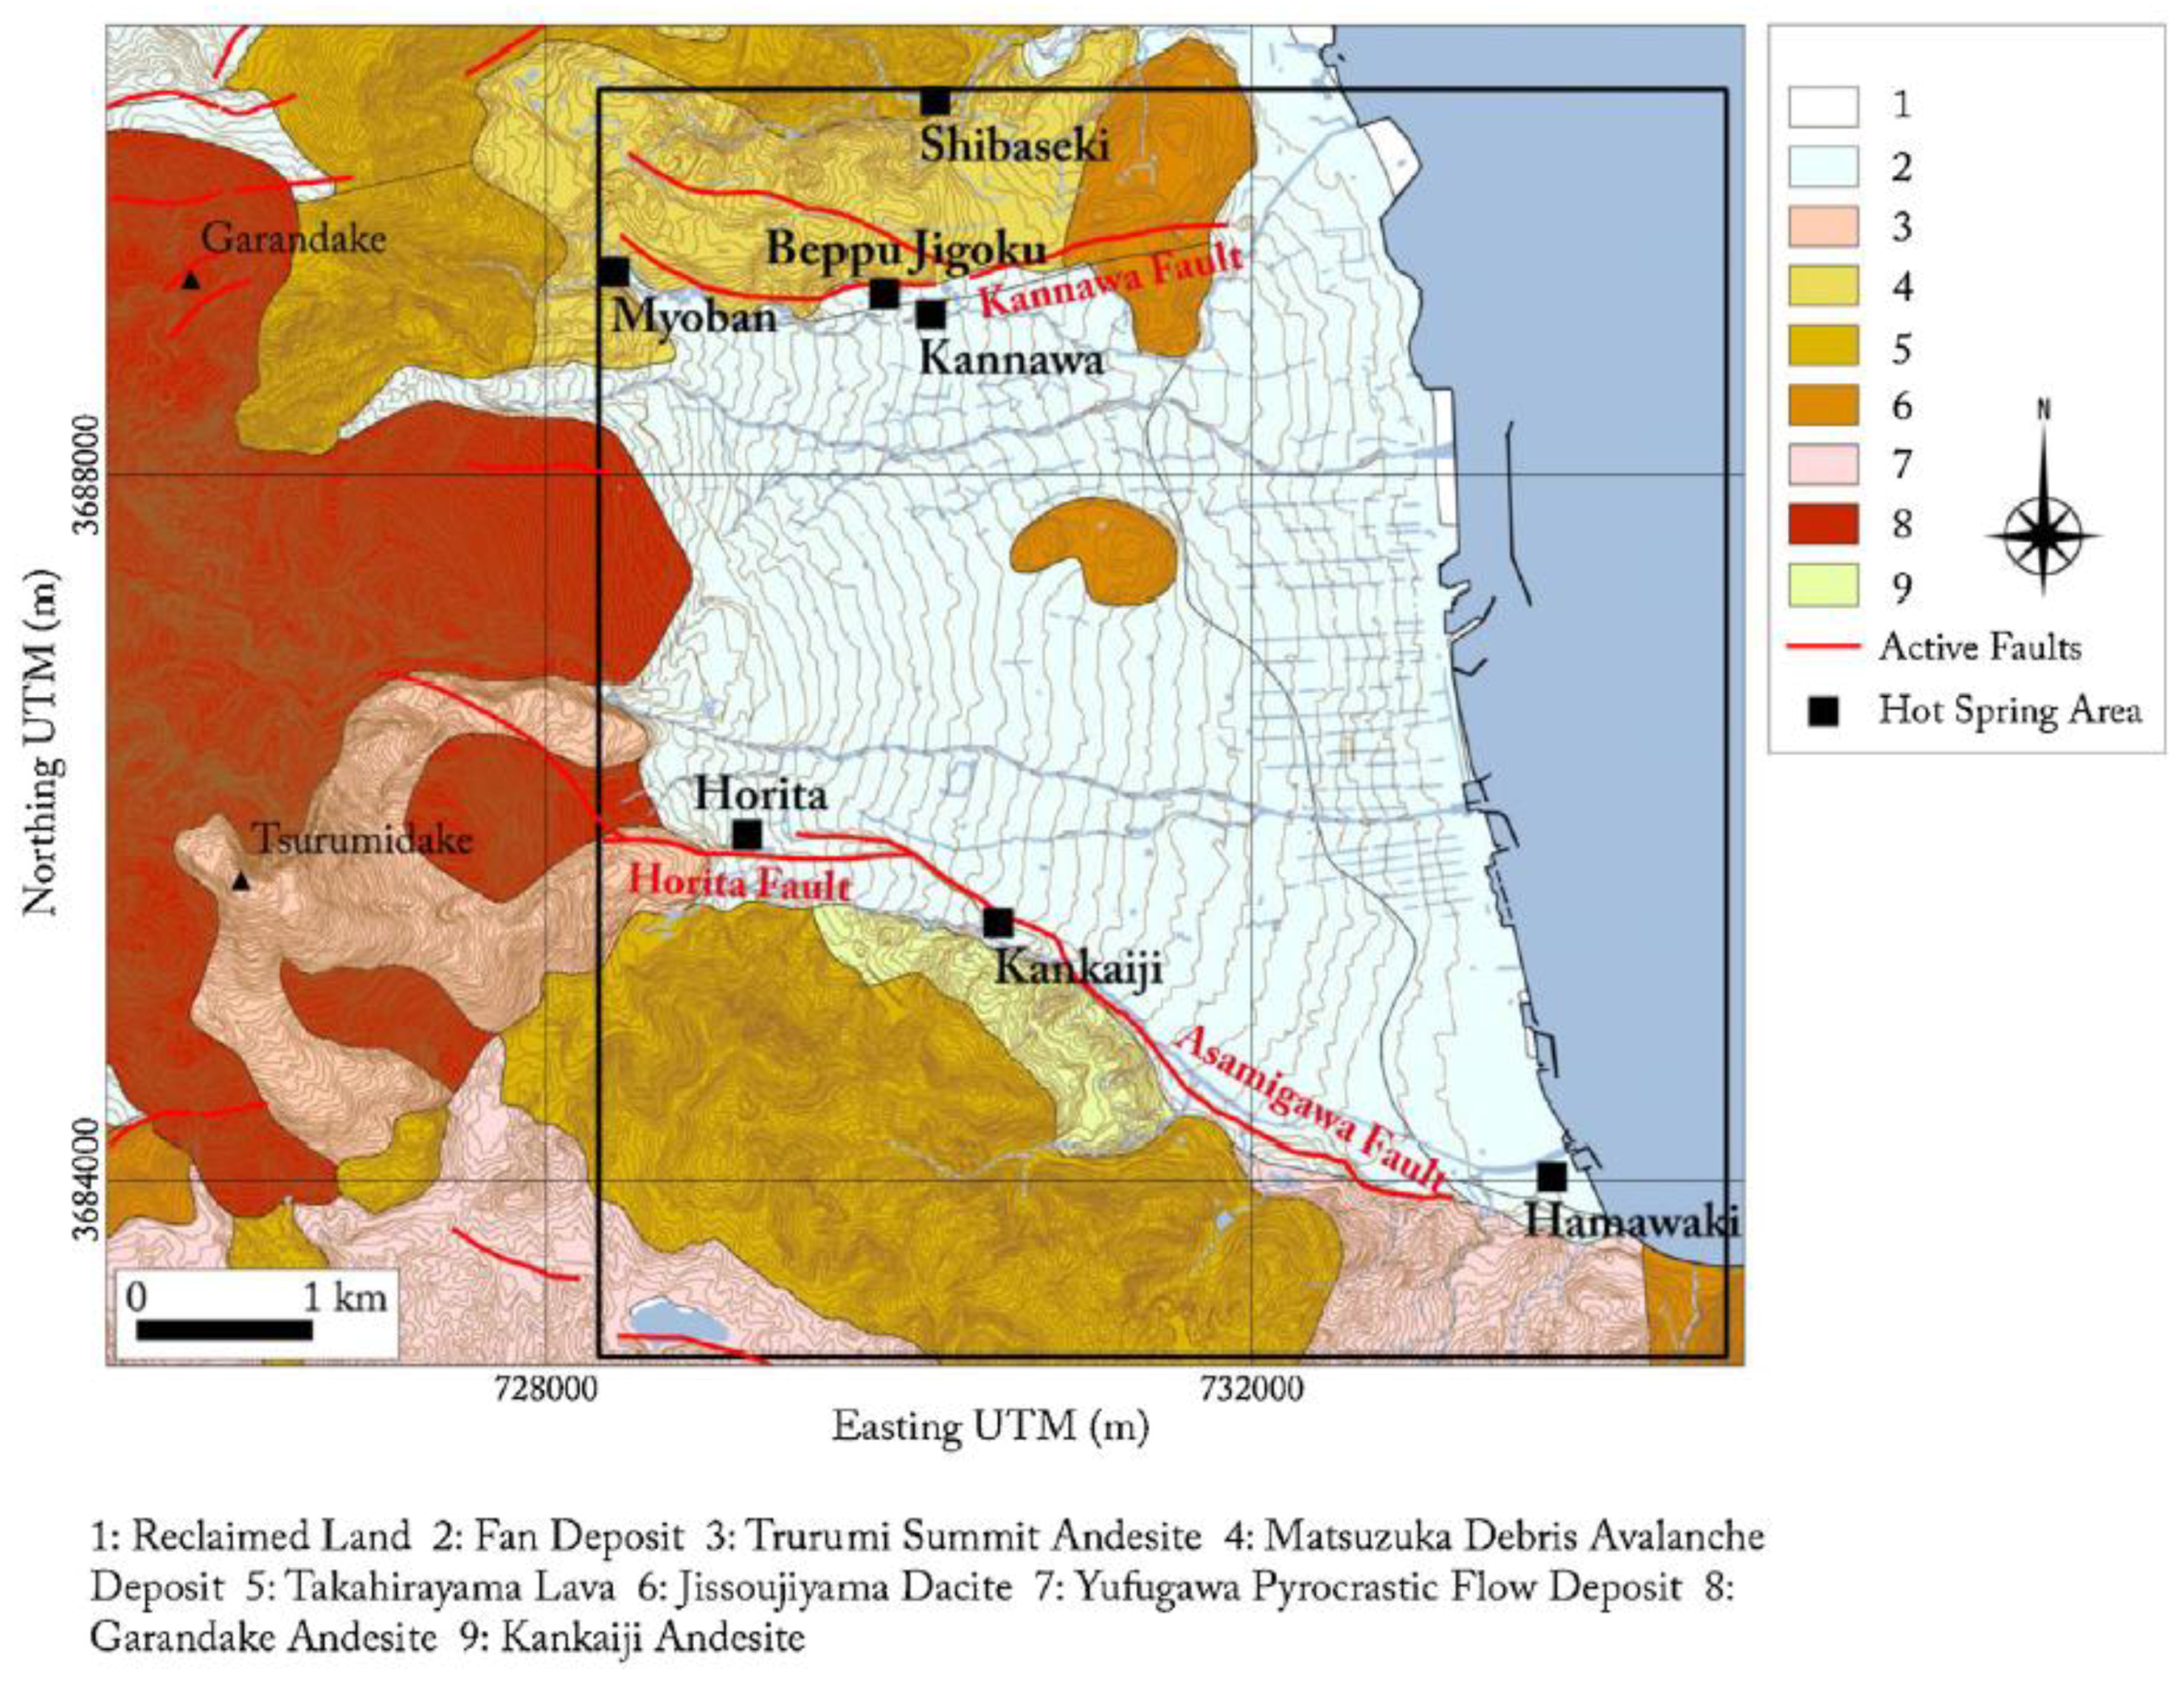
2. Geological Settings of the Study Area

Beppu is a tectonically controlled typical sedimentary basin at the eastern edge of the Beppu–Shimabara graben, which is under the influence of the Philippine convergence plate [23]. The Beppu–Shimabara graben extends NE-SW of the center of Kyushu Island [1]. Active normal faults are predominant in the Beppu graben along the E-W and NE-SW direction. The northern boundary of the Beppu graben is bounded by the Kannawa fault, and the southern border is bounded by the Horita and Asamagawa faults [1,6]. The Beppu geothermal field is situated within 30 km2 on the eastern flanks of Mt. Garan and Mt. Tsurumi, which are late-Quaternary volcanic centers [8,11]. Geologically, the Beppu comprises Pliocene andesite (Kankaiji and esite), Pleistocene volcanic rocks, and sedimentary fan deposits [24,25] (Figure 2). In some parts of the northern and southern borders of the Beppu area, cretaceous granite is cropped out locally.

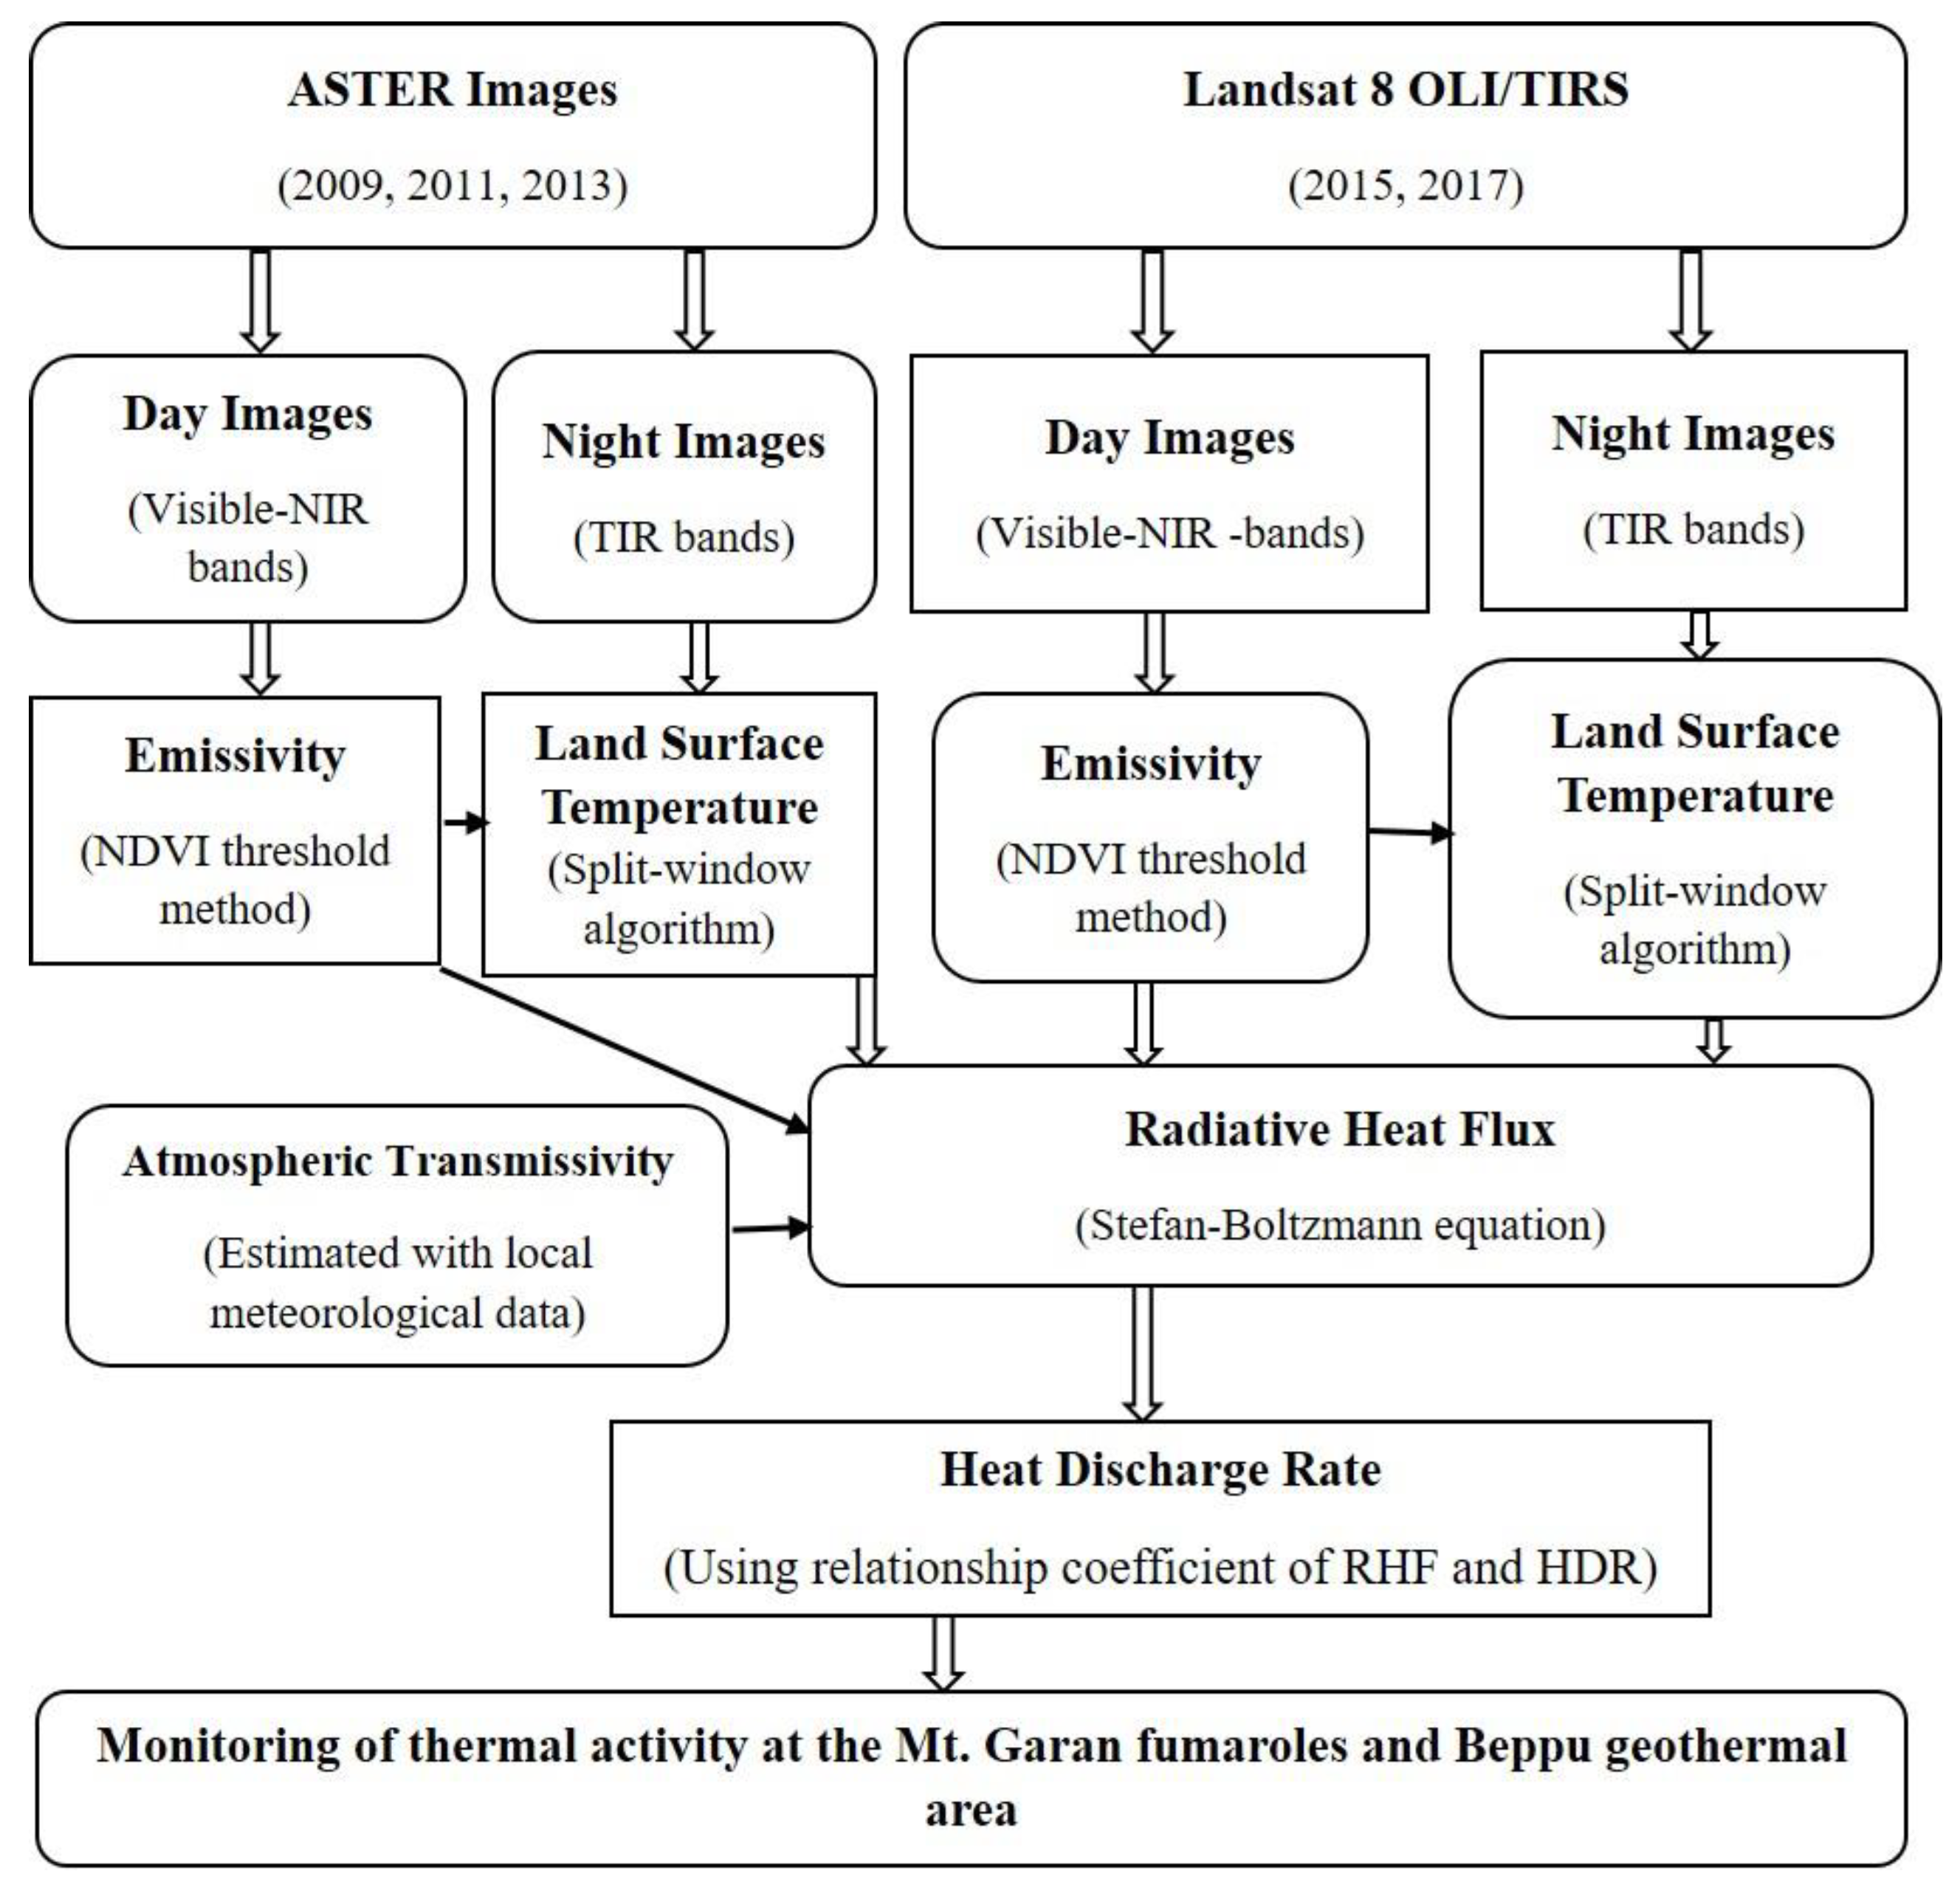
3. Materials and Methods

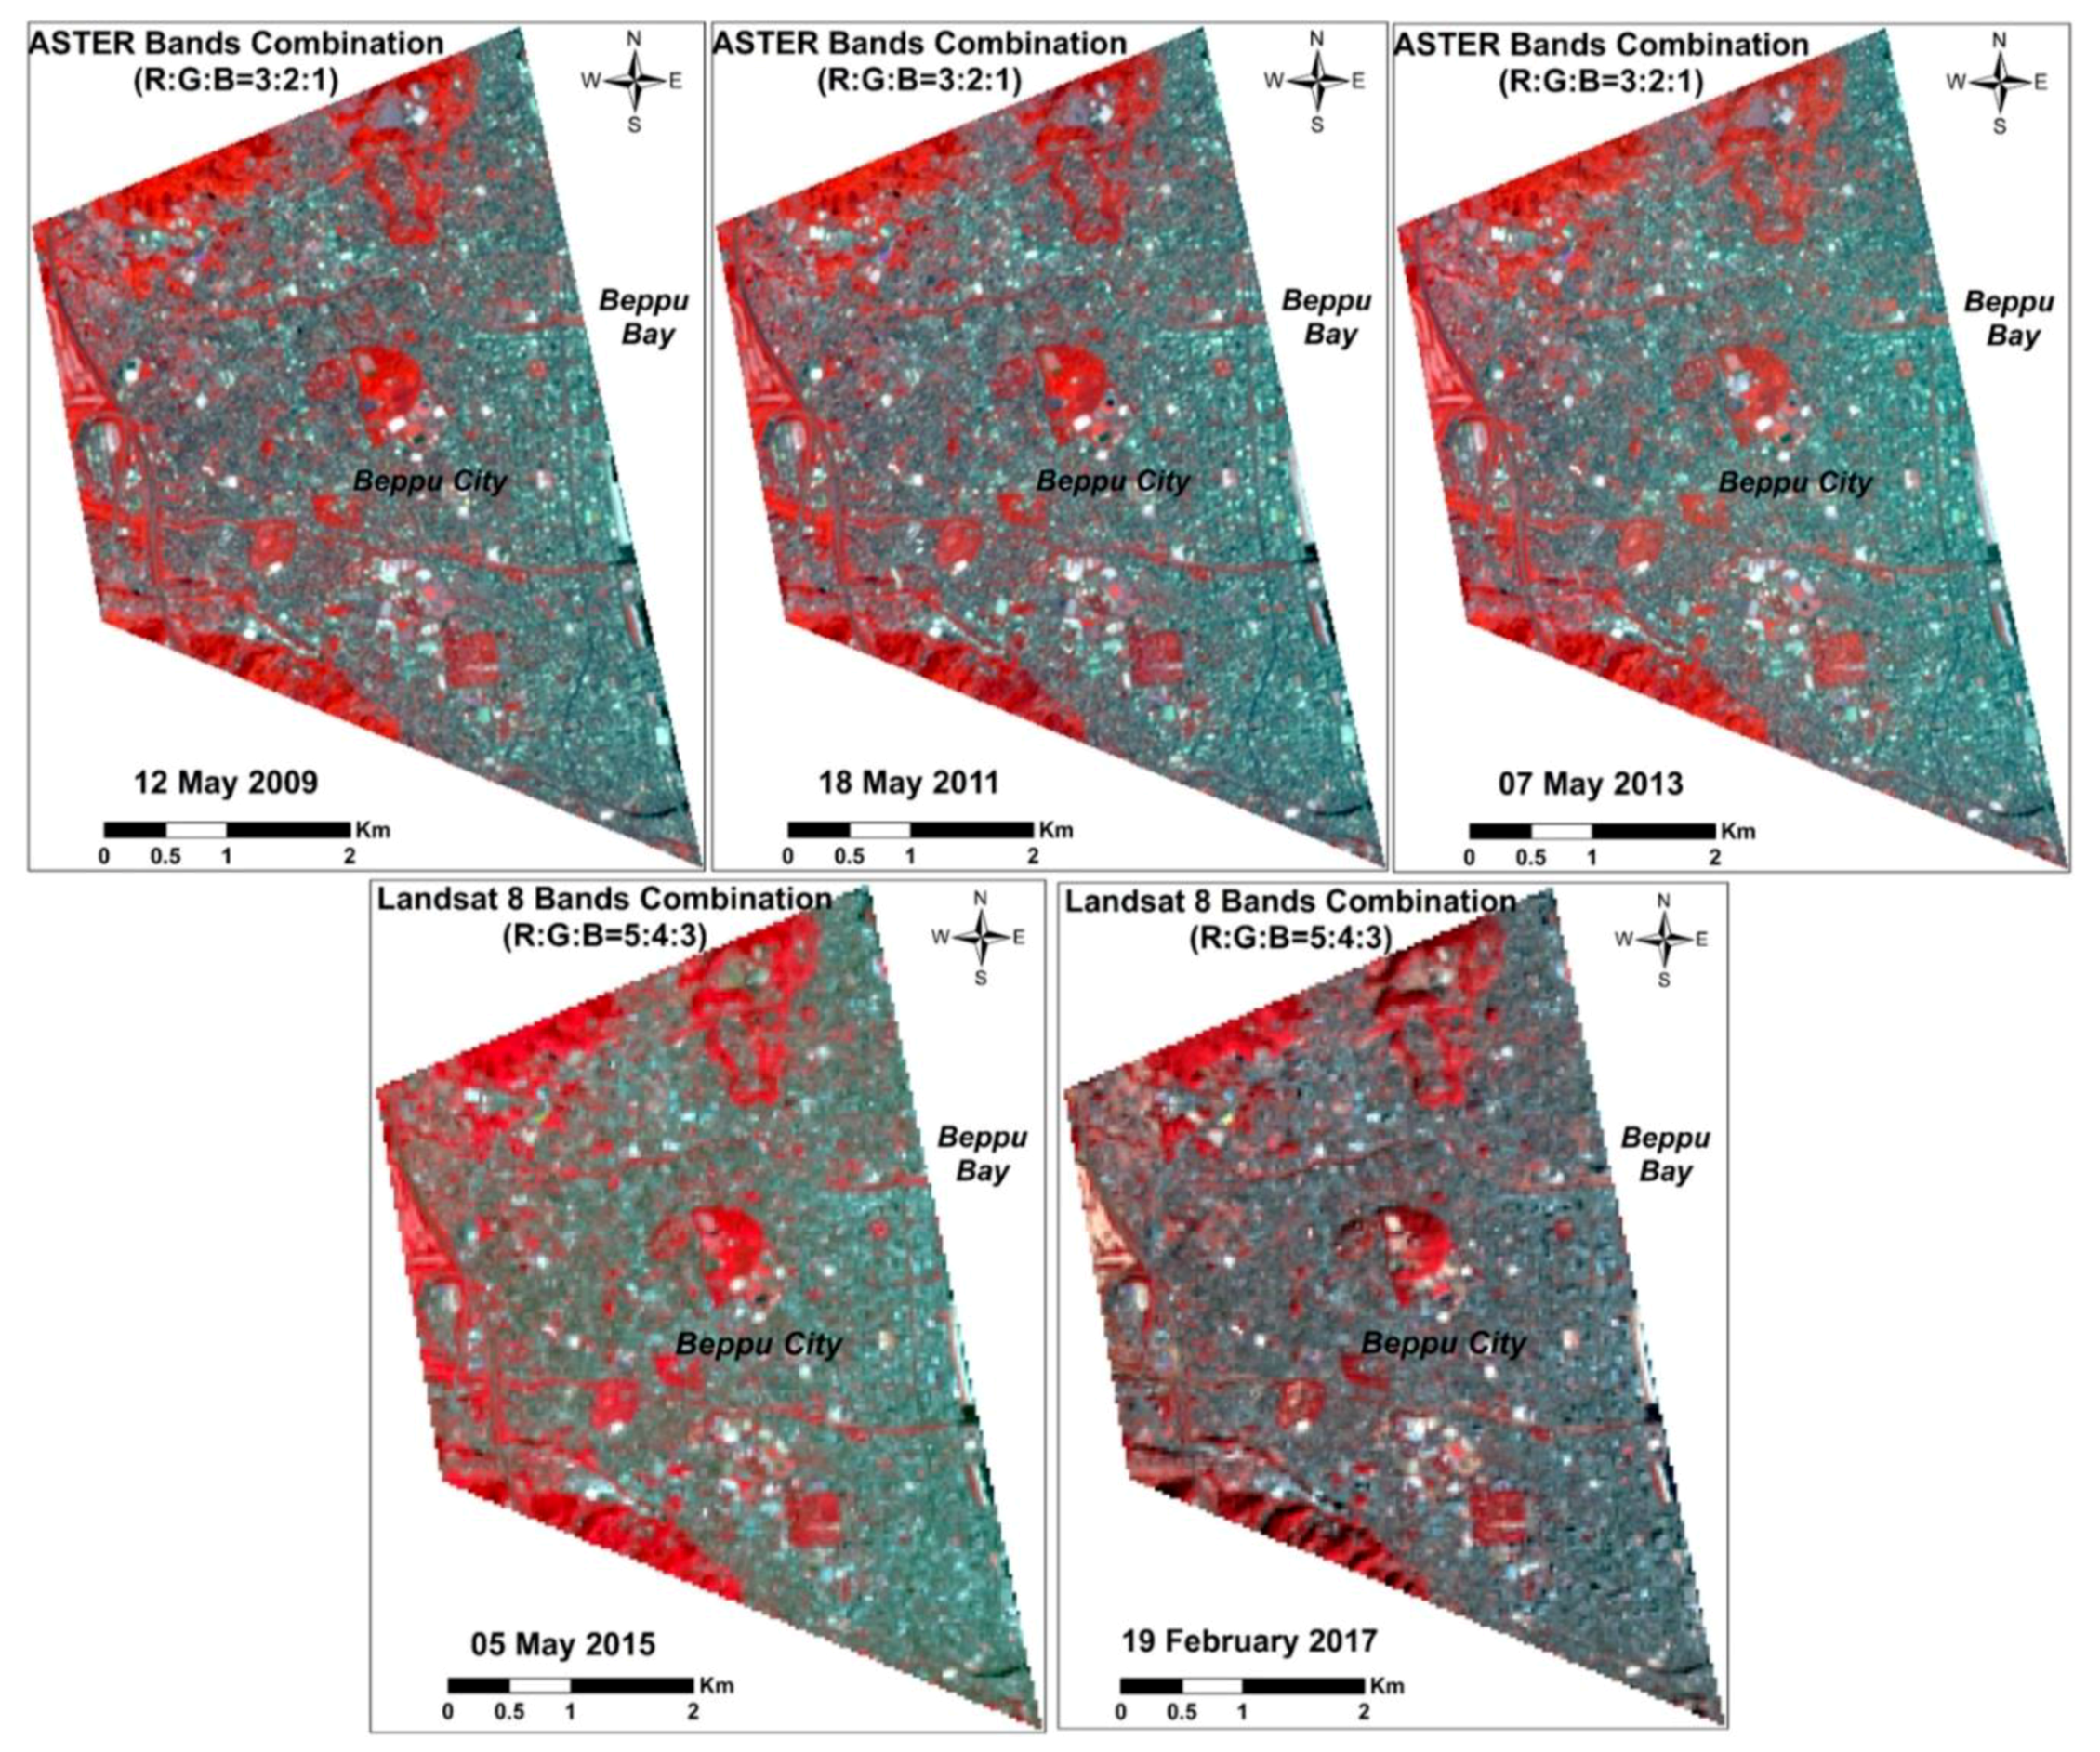
3.1. Satellite Data and Meteorological Data

We used daytime and nighttime visible near-infrared and thermal-infrared images of two satellite sensors, ASTER and Landsat OLI/TIRS, in this study, considering the availability of good-quality images for the first time to explore and monitor heat loss from the Beppu geothermal area and Mt. Garan fumarole of northeast Kyushu Island from 2009 to 2017. We selected three pairs (day and night) of ASTER and two pairs (day and night) of Landsat 8 OLI/TIRS images considering cloud-free, good-quality, and same-season images of the study area (Table 1). The images were best quality (ranked 9 out of 9) (https://landsat.usgs.gov/landsat-8-l8-data-users-handbook-section-4) and 100% cloud-free, and were acquired from the United States Geological Survey (USGS) archives that were both radiometrically and geometrically corrected. Nighttime thermal infrared images were used in this study to avoid or reduce the solar effect to calculate geothermal heat loss from the volcanic thermal grounds. The daytime visible near-infrared images were used to retrieve the emissivity for each land cover of the study area, as emissivity is one of the important factors for heat loss retrieval from thermal ground. The ASTER satellite has 14 multispectral bands: three visible near-infrared bands of 15 m, six shortwave infrared bands of 30 m, and five bands of 90 m spatial resolution. The latest Landsat 8 satellite carries OLI and TIRS sensors, ensuring continuity of image collection, which have nine OLI bands of 30 m image resolution and three TIRS bands of 100 m resolution. We also acquired ASTER standard products (Emissivity, AST_05; Surface kinetic temperature, AST_08) from the land processes distributed active archive center (LP DAAC) of USGS for validating the heat loss monitoring from the study areas. The meteorological data, such as relative humidity and ambient temperature, were collected from the Japanese Automated Meteorological Data Acquisition System (AMeDAS) Oita station, and these data were later adjusted with altitude variation between the station (4.6 m above mean sea level) and the Mt. Garandake fumaroles (1045 m above mean sea level) and the Beppu thermal area using the international standard atmospheric (ISA) method [6,26,27] (Figure 1).

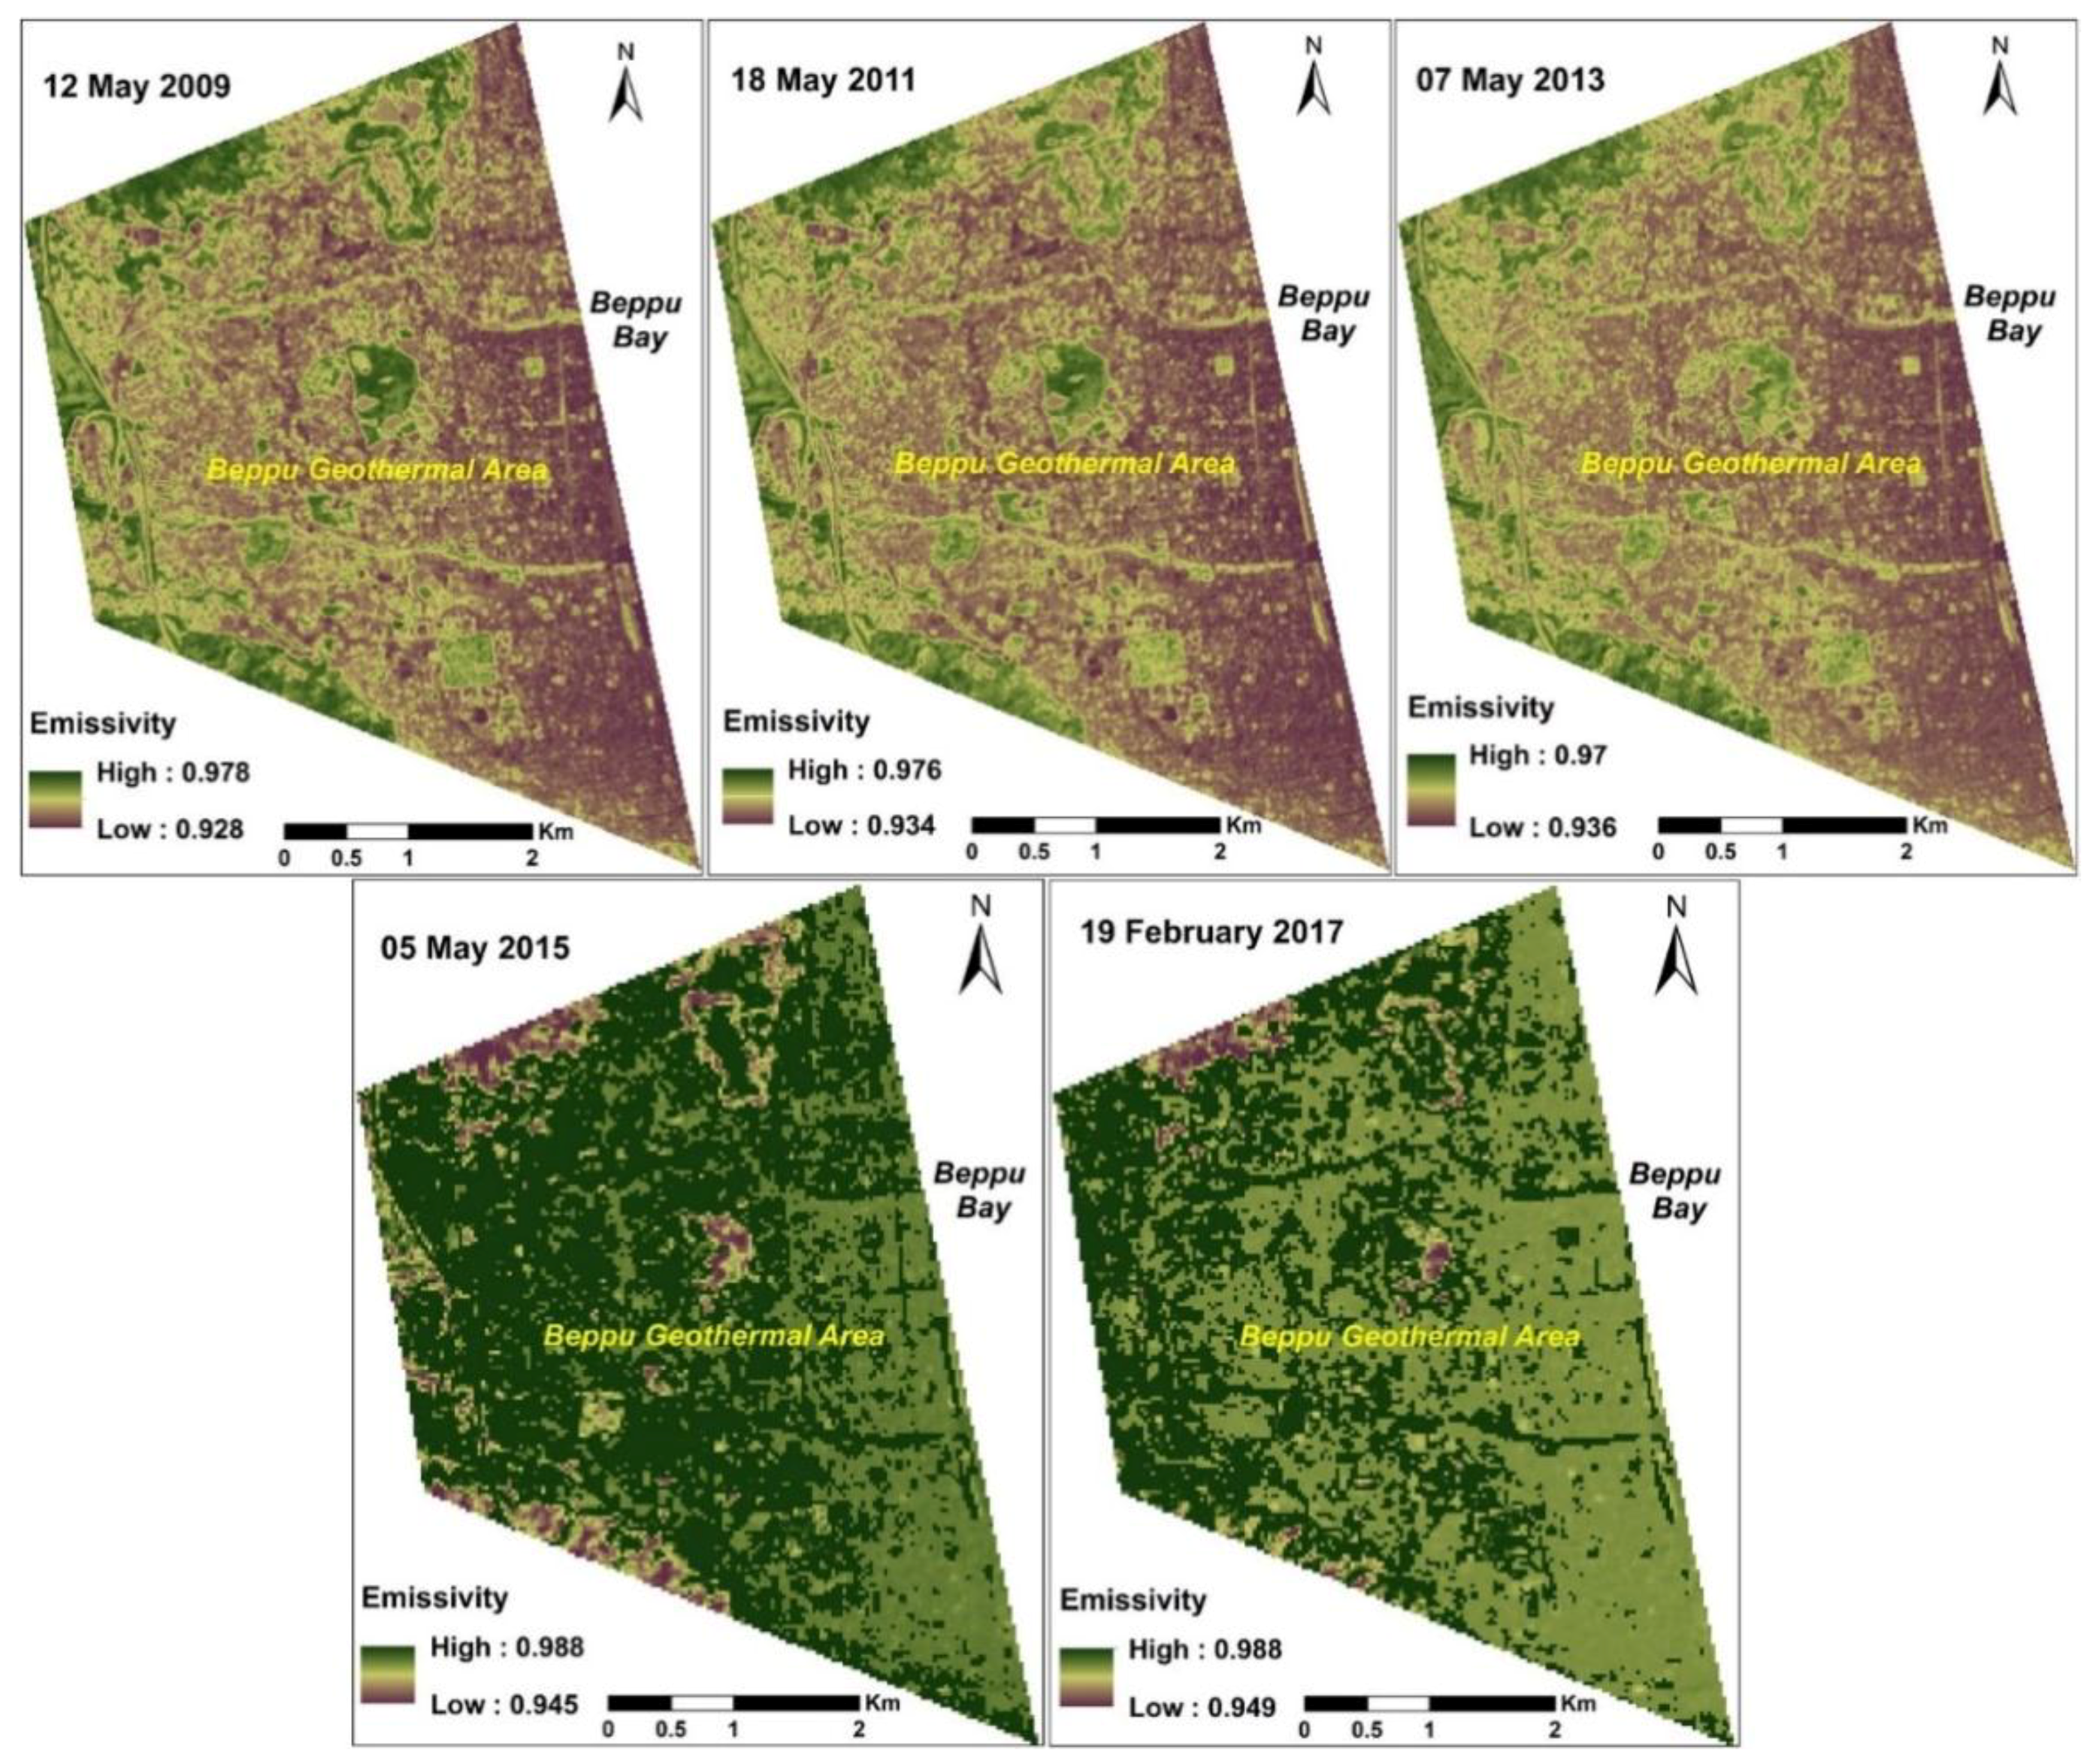
3.2. Emissivity Retrieval from ASTER Data

Both sensors of satellite images were analyzed for heat flow measurements by using various steps after collecting them from the USGS archives free of cost (Figure 3). ASTER daytime images were used to estimate spectral emissivity using the normalized differential vegetation index (NVDI) threshold method for the study areas first, so the necessary atmospheric correction and conversion of digital number (DN) value to reflectance was done for the bands of red and near-infrared, and these reflectance values were later used to calculate NDVI values of the study area for the respective year’s images. The NDVI value was used for estimating emissivity of the study area from 2009 to 2017. The spectral emissivity of each land cover of the study areas was estimated using the NDVI threshold method according to the following equation for thermal bands 13 and 14 of ASTER data [28]:
ε13 = AsRsεs13 + AvRvεv13
ε14 = AsRsεs14 + AvRvεv14
where Av = (1 − As), and Av and As are the vegetation and soil coverage of any pixel; Av = (NDVI − NDVIs)/(NDVIv − NDVIs), and NDVIv and NDVIs are NDVI of vegetation and soil, respectively; NDVI = (b3 − b2)/(b3 + b2), and b3 and b2 are the infrared band and red band of ASTER data, respectively. In the normal case, the NDVI value is above 0.75 for full healthy vegetation coverage of a pixel and below 0.2 for full bare ground or soil. Rv = 0.92762 + 0.07033Av and Rs = 0.99782 + 0.08362Av. εs13 and εs14 are the spectral emissivity of soil for bands 13 and 14, respectively (εs13 = 0.9676 and εs14 = 0.9779), and εv13 and εv14 are the spectral emissivity of vegetation for the bands 13 and 14, respectively (εs13 = 0.9867 and εs14 = 0.9899).

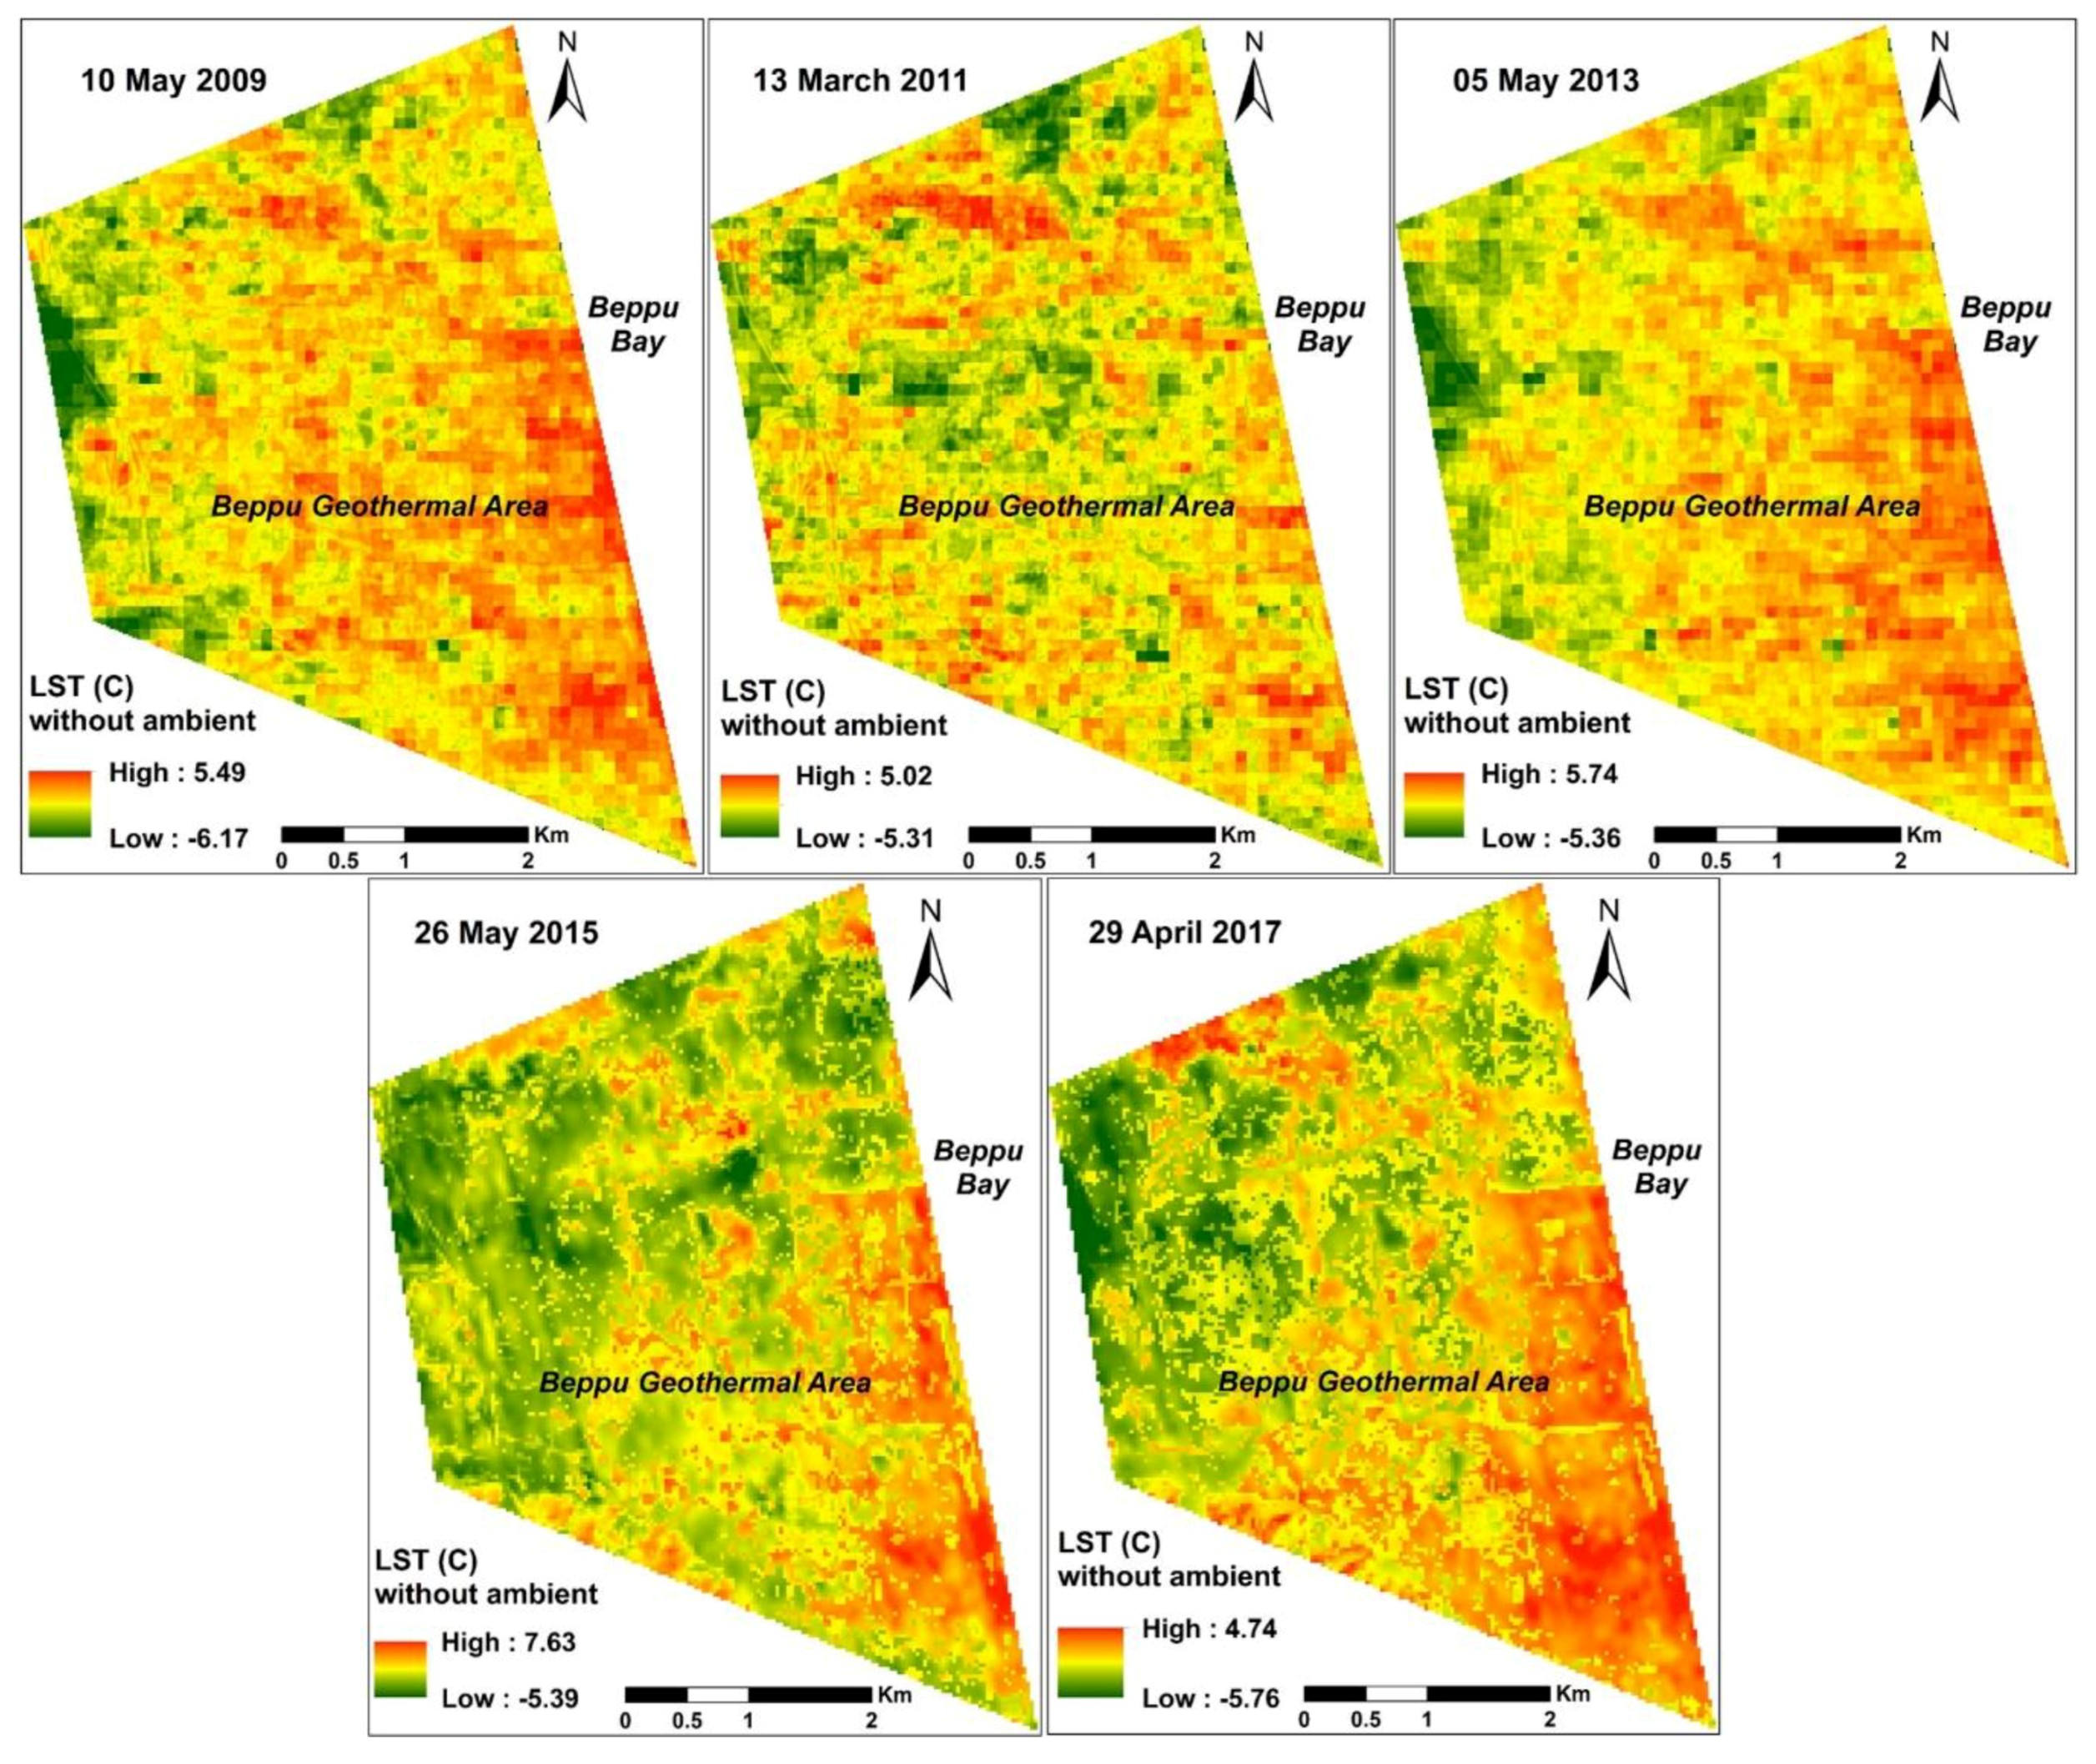
3.3. LST Retrieval from ASTER Data

We used the nighttime ASTER thermal infrared data to estimate true land surface temperature of the study areas using the split-window algorithm, taking into consideration thermal bands 13 and 14 of ASTER images. First, the thermal band data were used to convert into radiance values from the DN of the selected nighttime satellite images using the metadata of those images with the necessary equation [28]. The radiance value was used to estimate the brightness temperature of the study area from the sensor’s information without considering the atmospheric effects. Then, the brightness temperature was used to estimate true skin temperature of the ground using the following split-window algorithm of [29] with TIR bands 13 and 14 of ASTER images:
Ts = B0 + B1T13 − B2T14
where T13 and T14 are the brightness temperatures of ASTER band 13 and band 14; B0, B1, and B2 are the coefficients, defined as B0 = e1a13 − e2a14, B1 = 1 + A + e1b13, and B2 = A + e2b14, A = d13/e0 and A2 = e1l13 − e2l14, here, a13 = −60.994, b13 = 0.40721, a14 = −63.3096, b14 = 0.441977, e1 = d14 (1 − c13 − d13)/e0, e2 = d13(1 − c14 − d14)/e0, and e0 = d14c13 − d13c14 ; ci = εiτi and di = [1 − τi][1 + (1 − εii], i represents the thermal bands of ASTER (i = bands 13 and 14), εi and τi are the emissivity atmospheric transmissivity of ASTER band i. τ13 = 0.979160 − 0.062918w and τ14 = 0.968144 − 0.098942w (in case of water vapor content (w) 0.4–2.0). The total water vapor content was calculated using the relative air humidity, air density, and air saturation mix ratio from local meteorological data [28].

3.4. Emissivity Retrieval from Landsat 8 OLI Data

For the Landsat 8 OLI-TIRS images, we used daytime OLI images to estimate the spectral emissivity of each land cover of the study area and nighttime TIRS images to estimate the land surface temperature without reducing the solar effect. First the digital values of the visible near-infrared bands of daytime Landsat 8 OLI images were converted into reflectances with necessary information from metadata, then the spectral emissivity of the land covers of the study area was estimated using the NDVI threshold method for thermal bands 10 and 11 of Landsat TIRS images as follows [30]:
ε i = { a i Q red + b i NDVI < 0.2 ε v , i P v + ε s , i ( 1 P v ) + C i 0.2 NDVI 0.5 ε v , i + C i NDVI > 0.5 }
where NDVI = (ρnir − ρr)/(ρnir + ρr), here, ρnir and ρr are the reflectance of near-infrared and red band; Pv is the vegetation fraction (NDVI − NDVImin/NDVImax − NDVImin)2, NDVImax = 0.5, NDVImin = 0.2; εv,i is the emissivity of vegetation (TIRS band 10 = 0.9863; band 11 = 0.9896), εs,i is the emissivity of soil (TIRS band 10 = 0.9668; band 11 = 0.9747); Ci is surface roughness (1 − εs,i) εv,i F’ (1 − Pv); and F’ is the geometric factor ranging between 0 and 1 (typically 0.55) [30]. For bare soil (NDVI < 0.2 and Pv = 0), the emissivity of bands 10 and 11 was ε10 = 0.973 − 0.047δ4 and ε11 = 0.984 − 0.026δ4, and δi is the reflectance of the Landsat 8 OLI bands [30].

3.5. LST Retrieval from Landsat 8 TIRS Data

We used nighttime Landsat 8 thermal infrared data to estimate the land surface temperature, which was later used for geothermal heat flux measurement from the Garandake–Beppu thermal area with or without reducing solar effect. First thermal infrared bands 10 and 11 of Landsat 8 were converted into radiance using the equation Lλ = ML × Qcal + AL; here, Lλ is the spectral radiance (W/m2·sr·μm), ML is the multiplicative scaling factor, Qcal is the pixel value, and AL is the radiance additive factor (taken from the metadata of the image). Then the radiance value was converted into effective or brightness temperature using the equation Ti = K2/In(K1/Lλ + 1); here, Ti is the brightness temperature, K1 and K2 are thermal efficient coefficients (taken from the metadata), and Lλ is the radiance value. We used local meteorological data from the Oita AMeDAS station, such as ambient temperature and relative humidity, to calculate atmospheric transmissivity. Because of many difficulties in obtaining in situ atmospheric transmissivity values when the satellite passes, we used simulated equations to get atmospheric transmissivity using the water vapor content in the following equation [30]:
τ10 = −0.0164w2 − 0.04203w + 0.9715 (mid-latitude summer with w = 0.2−3.0 g/m2)
τ11 = −0.01218w2 − 0.07735w + 0.9603 (mid-latitude summer with w = 0.2−3.0 g/m2)
w = (H × E × A/1000)/Rw (0)
where τi is the atmospheric transmissivity of the respected bands of the Landsat thermal infrared data, w is total water vapor content (g/m2), H is relative air humidity (%), E is the saturation mix ratio (g/Kg) of water vapor, A is air density (g/m3), and Rw(0) = 0.6834 and 0.6356 for mid-latitude summer and winter (Table 2).
We used a split-window algorithm to estimate skin LST of the study areas using Landsat 8 TIRS bands 10 and 11, which was developed based on Qin et al., 2001, as follows [30]:
Ts = T10 + D1(T10 − T11) + D0
D0 = [C11(1 − A10 − C10) L10 − C10(1 − A11 − C11) L11]/(C11A10 − C10A11)
where Ts is the LST; Ai = εiτi and Ci = (1 − τi) (1 + (1 − εi) τi), ε is emissivity and τ is atmospheric transmissivity; and Li is the linear fitting coefficient taken from [30].

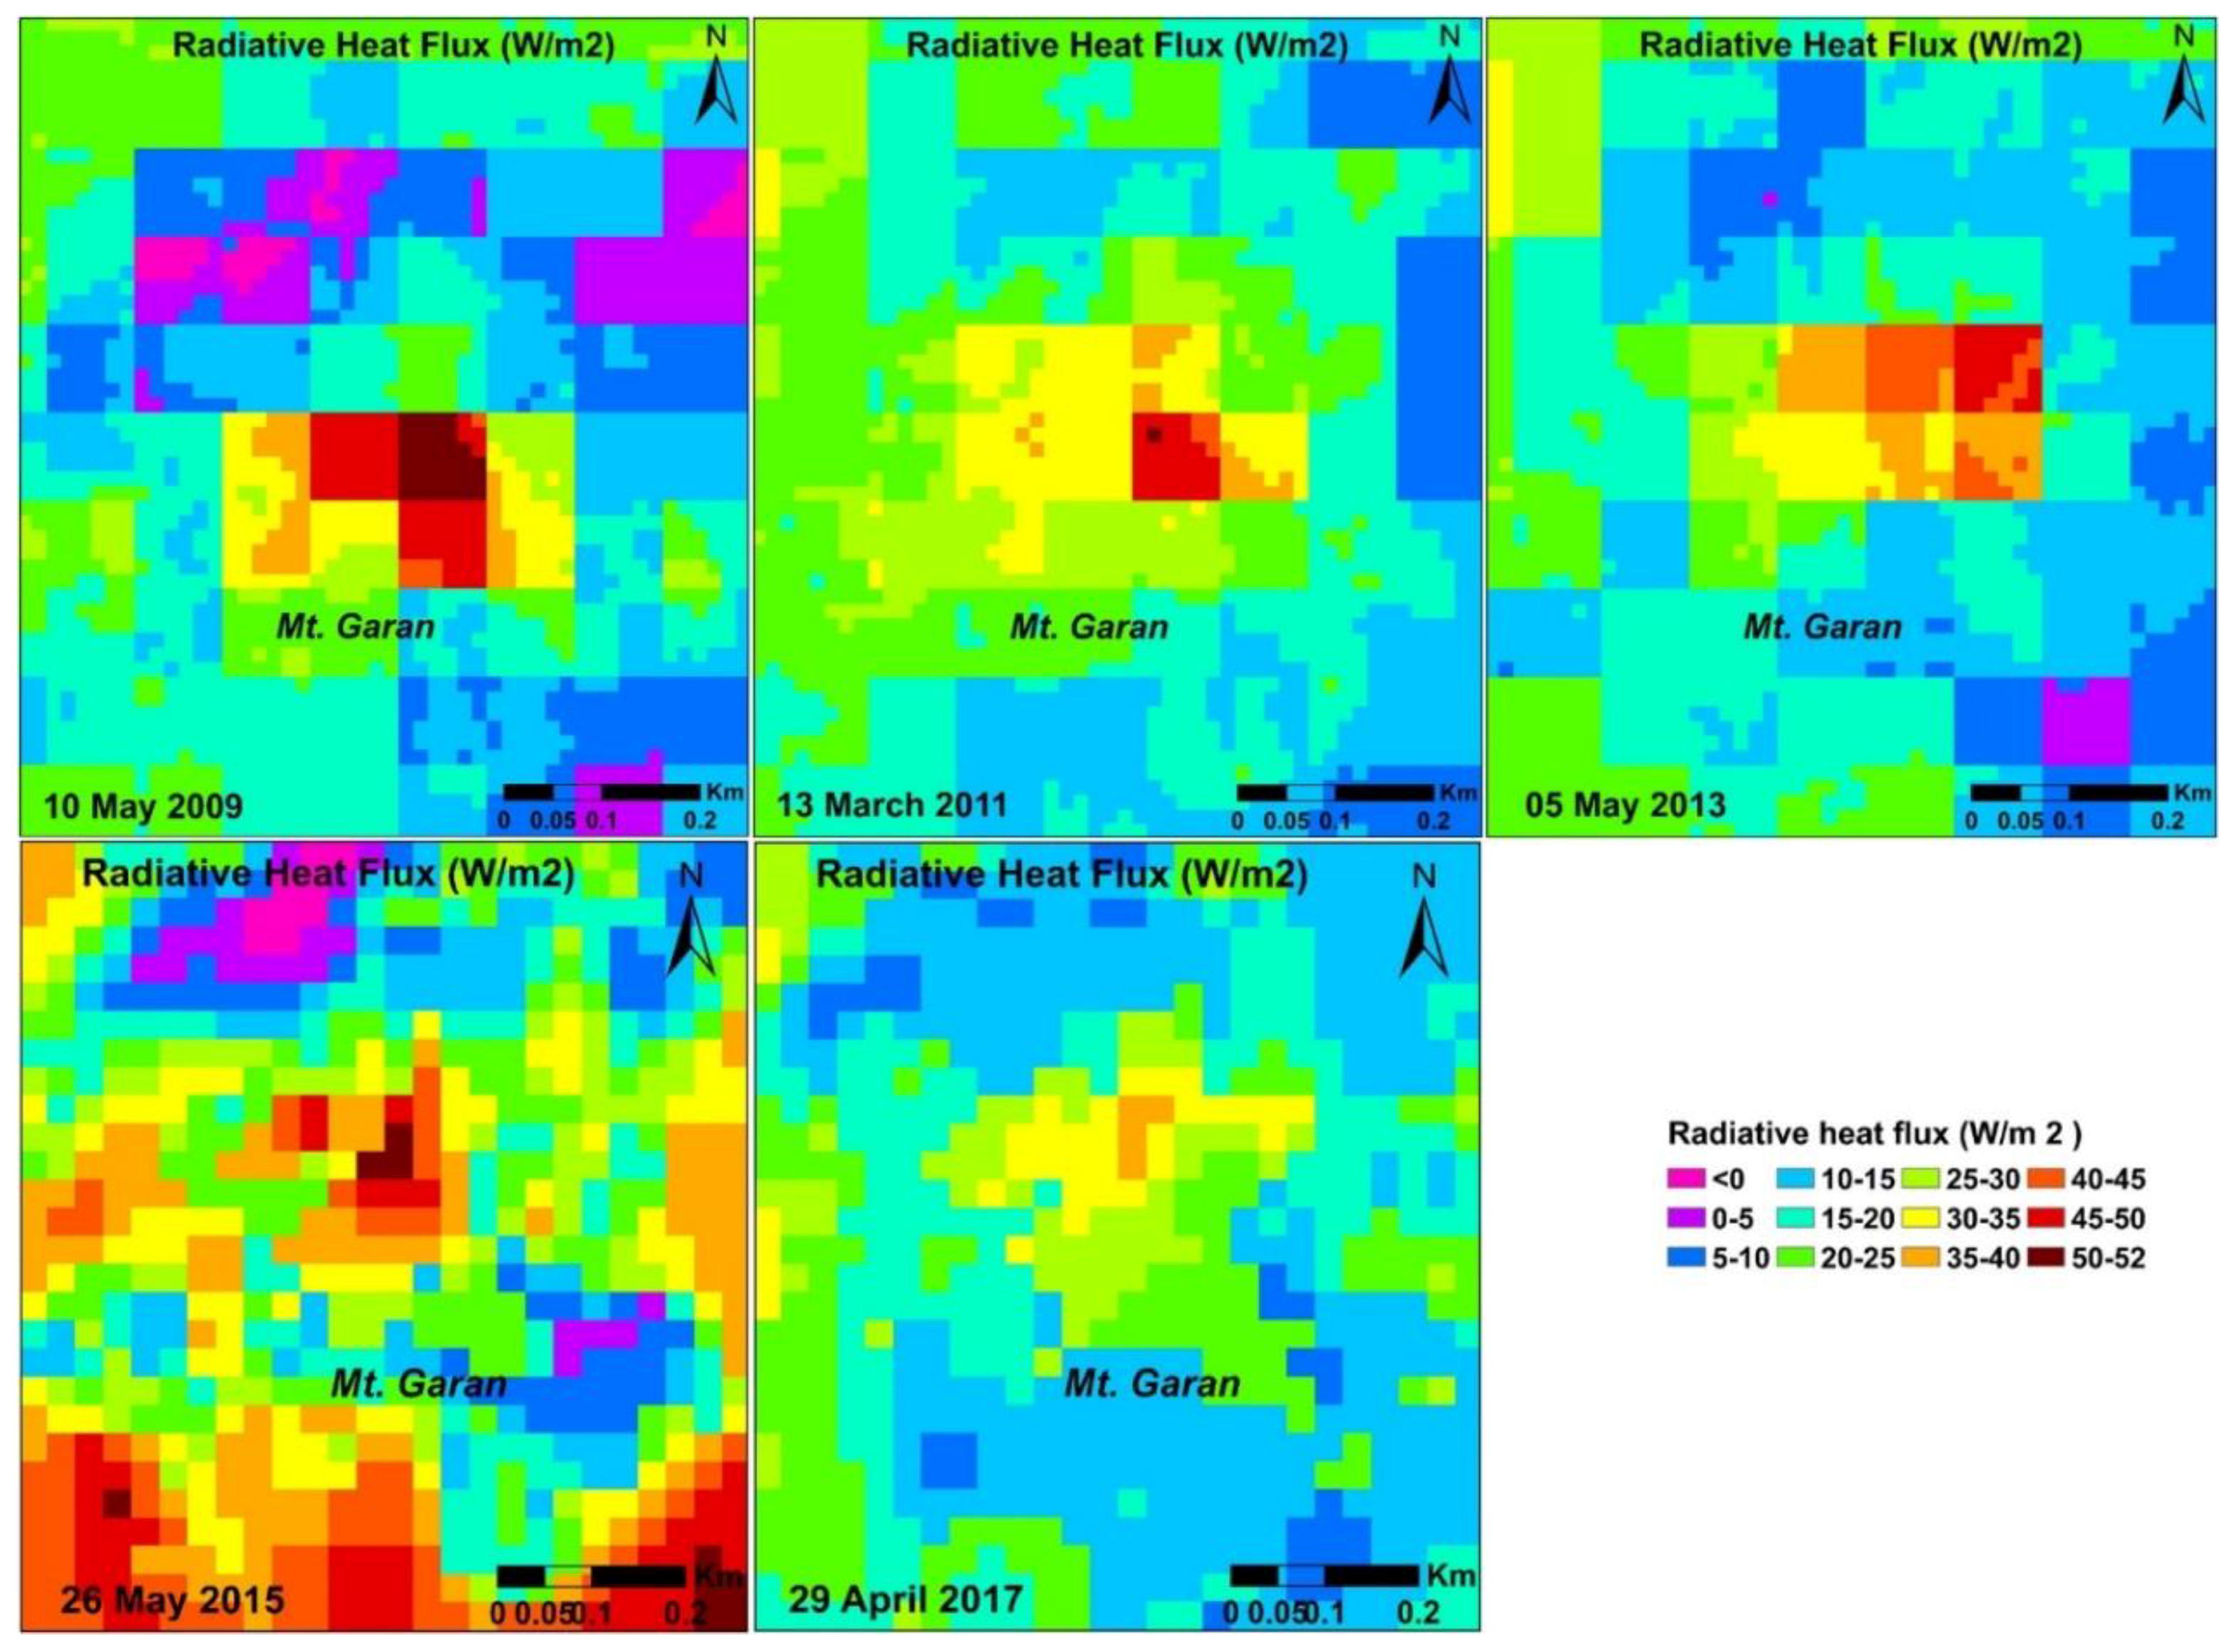
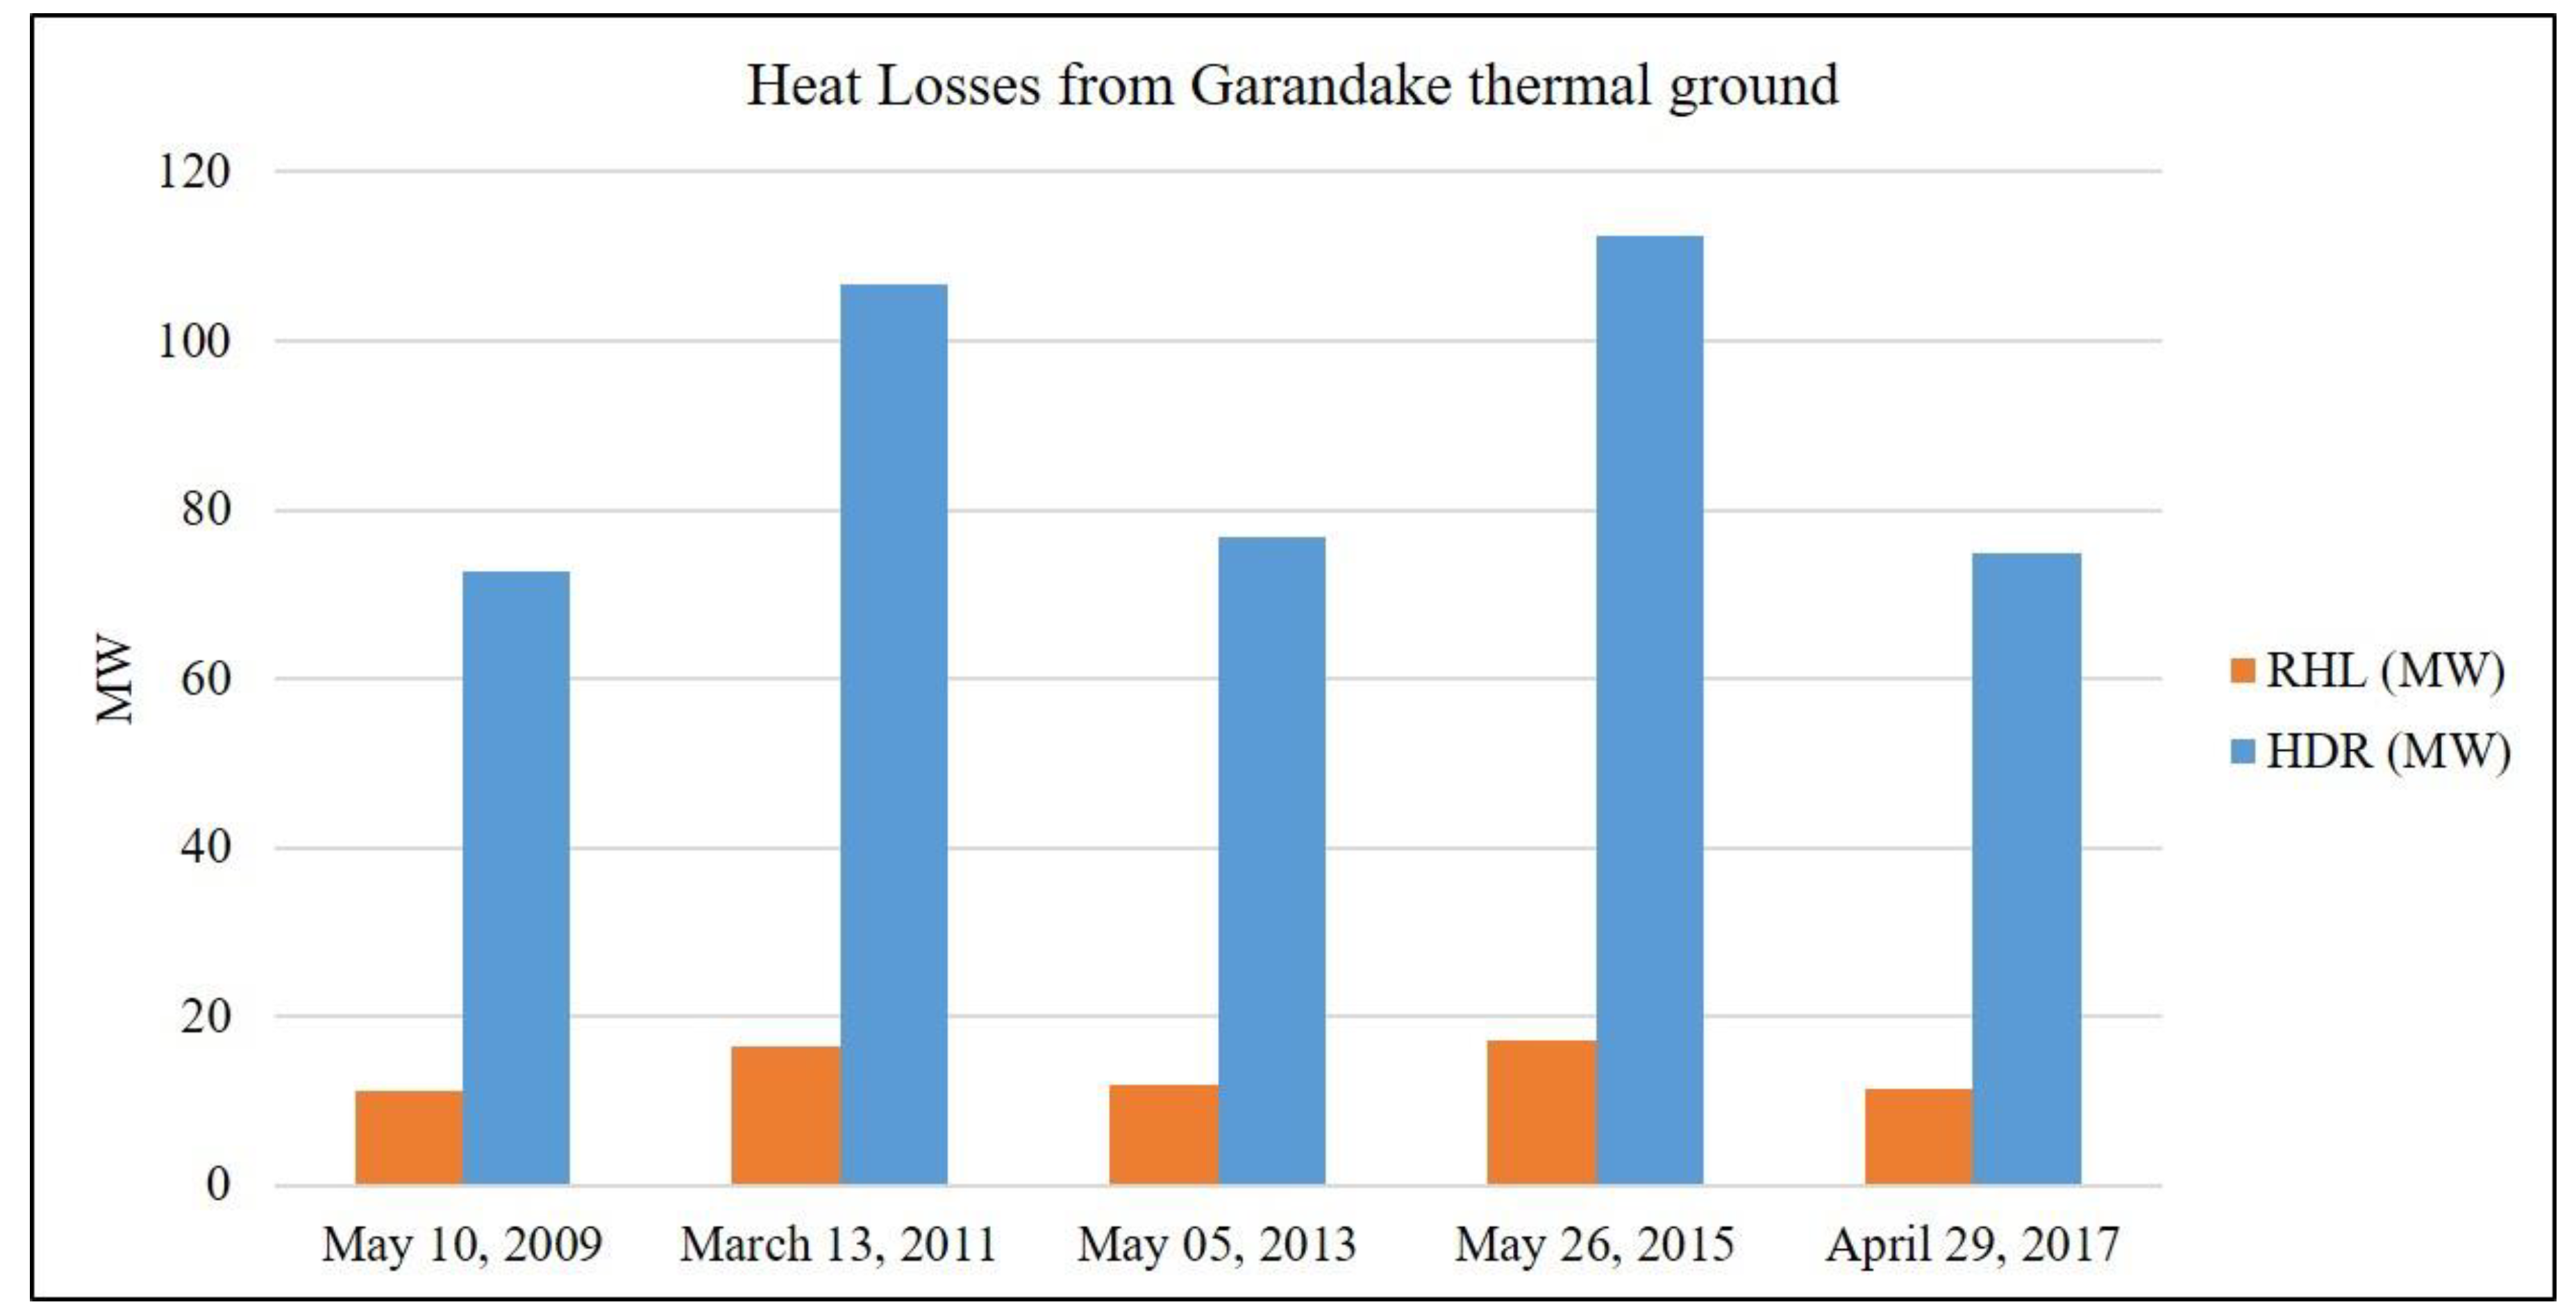
3.6. RHF and Heat Loss Retrieval

Actually, the total heat loss or heat discharge rate (HDR) is the summation of conductive, convective, and radiative heat loss from any volcano or geothermal field without solar effect. As satellite thermal infrared data can only be used to study radiative heat loss, radiative heat flux (RHF) was calculated using the Stefan–Boltzmann equation within the Garandake–Beppu thermal area from 2009 to 2017 [14,31,32]. Strictly speaking, RHF can be defined as the radiative portion of surface heat loss without solar effect from any volcano or geothermal field. The Stefan–Boltzmann equation defines that the thermal energy radiated by a true blackbody per second per unit area is proportional to the fourth power of absolute temperature. According to the Stefan–Boltzmann law, if the hot object or geothermal ground is other than an ideal radiator or blackbody and the thermal surface is radiating to its cooler surrounding atmosphere at temperature Ta, then the net RHF from the thermal area would be as follows [31,32]:
Q = σεA (Ts4 − Ta4)
where Q is the radiative heat flux, σ is the Stefan–Boltzmann constant (5.6703 × 10⁻⁸ watt/m2 K4), A is the area of radiation, Ts is the surface or hot body temperature, and Ta is the cooler surrounding temperature.
We calculated total radiative heat loss (RHL) by summing the pixels’ positive RHF values for each year’s images of the study area at this stage. We used a relationship coefficient (about 15%) between radiative heat flux and heat discharge rate to calculate total heat loss and monitor the trend of heat discharge rate in the study area [16].

4. Results and Discussion

Nighttime multispectral satellite thermal infrared data are used for the first time in this study to investigate and monitor the thermal status of the Beppu geothermal area and the adjacent Mt. Garan (Garandake) fumaroles of the northeast part of Kyushu Island from 2009 to 2017. The intention of nighttime thermal infrared data is to reduce or remove the solar effect to monitor actual geothermal heat loss in the studied area. Daytime images from the same month as nighttime images were used to estimate the spectral emissivity for land cover of the study areas. As the Beppu geothermal system is proximal to the Mt. Garan and Mt. Tsurumi volcano in the west, we also assessed the thermal heat loss of Mt. Garan fumaroles to understand the relationship between them. As the elevation variation between the Beppu geothermal area (less than 300 m) and Mt. Garan fumarole (above 1000 m) is large, we split the study area in two. The results are discussed separately to better understand the relationship between them.

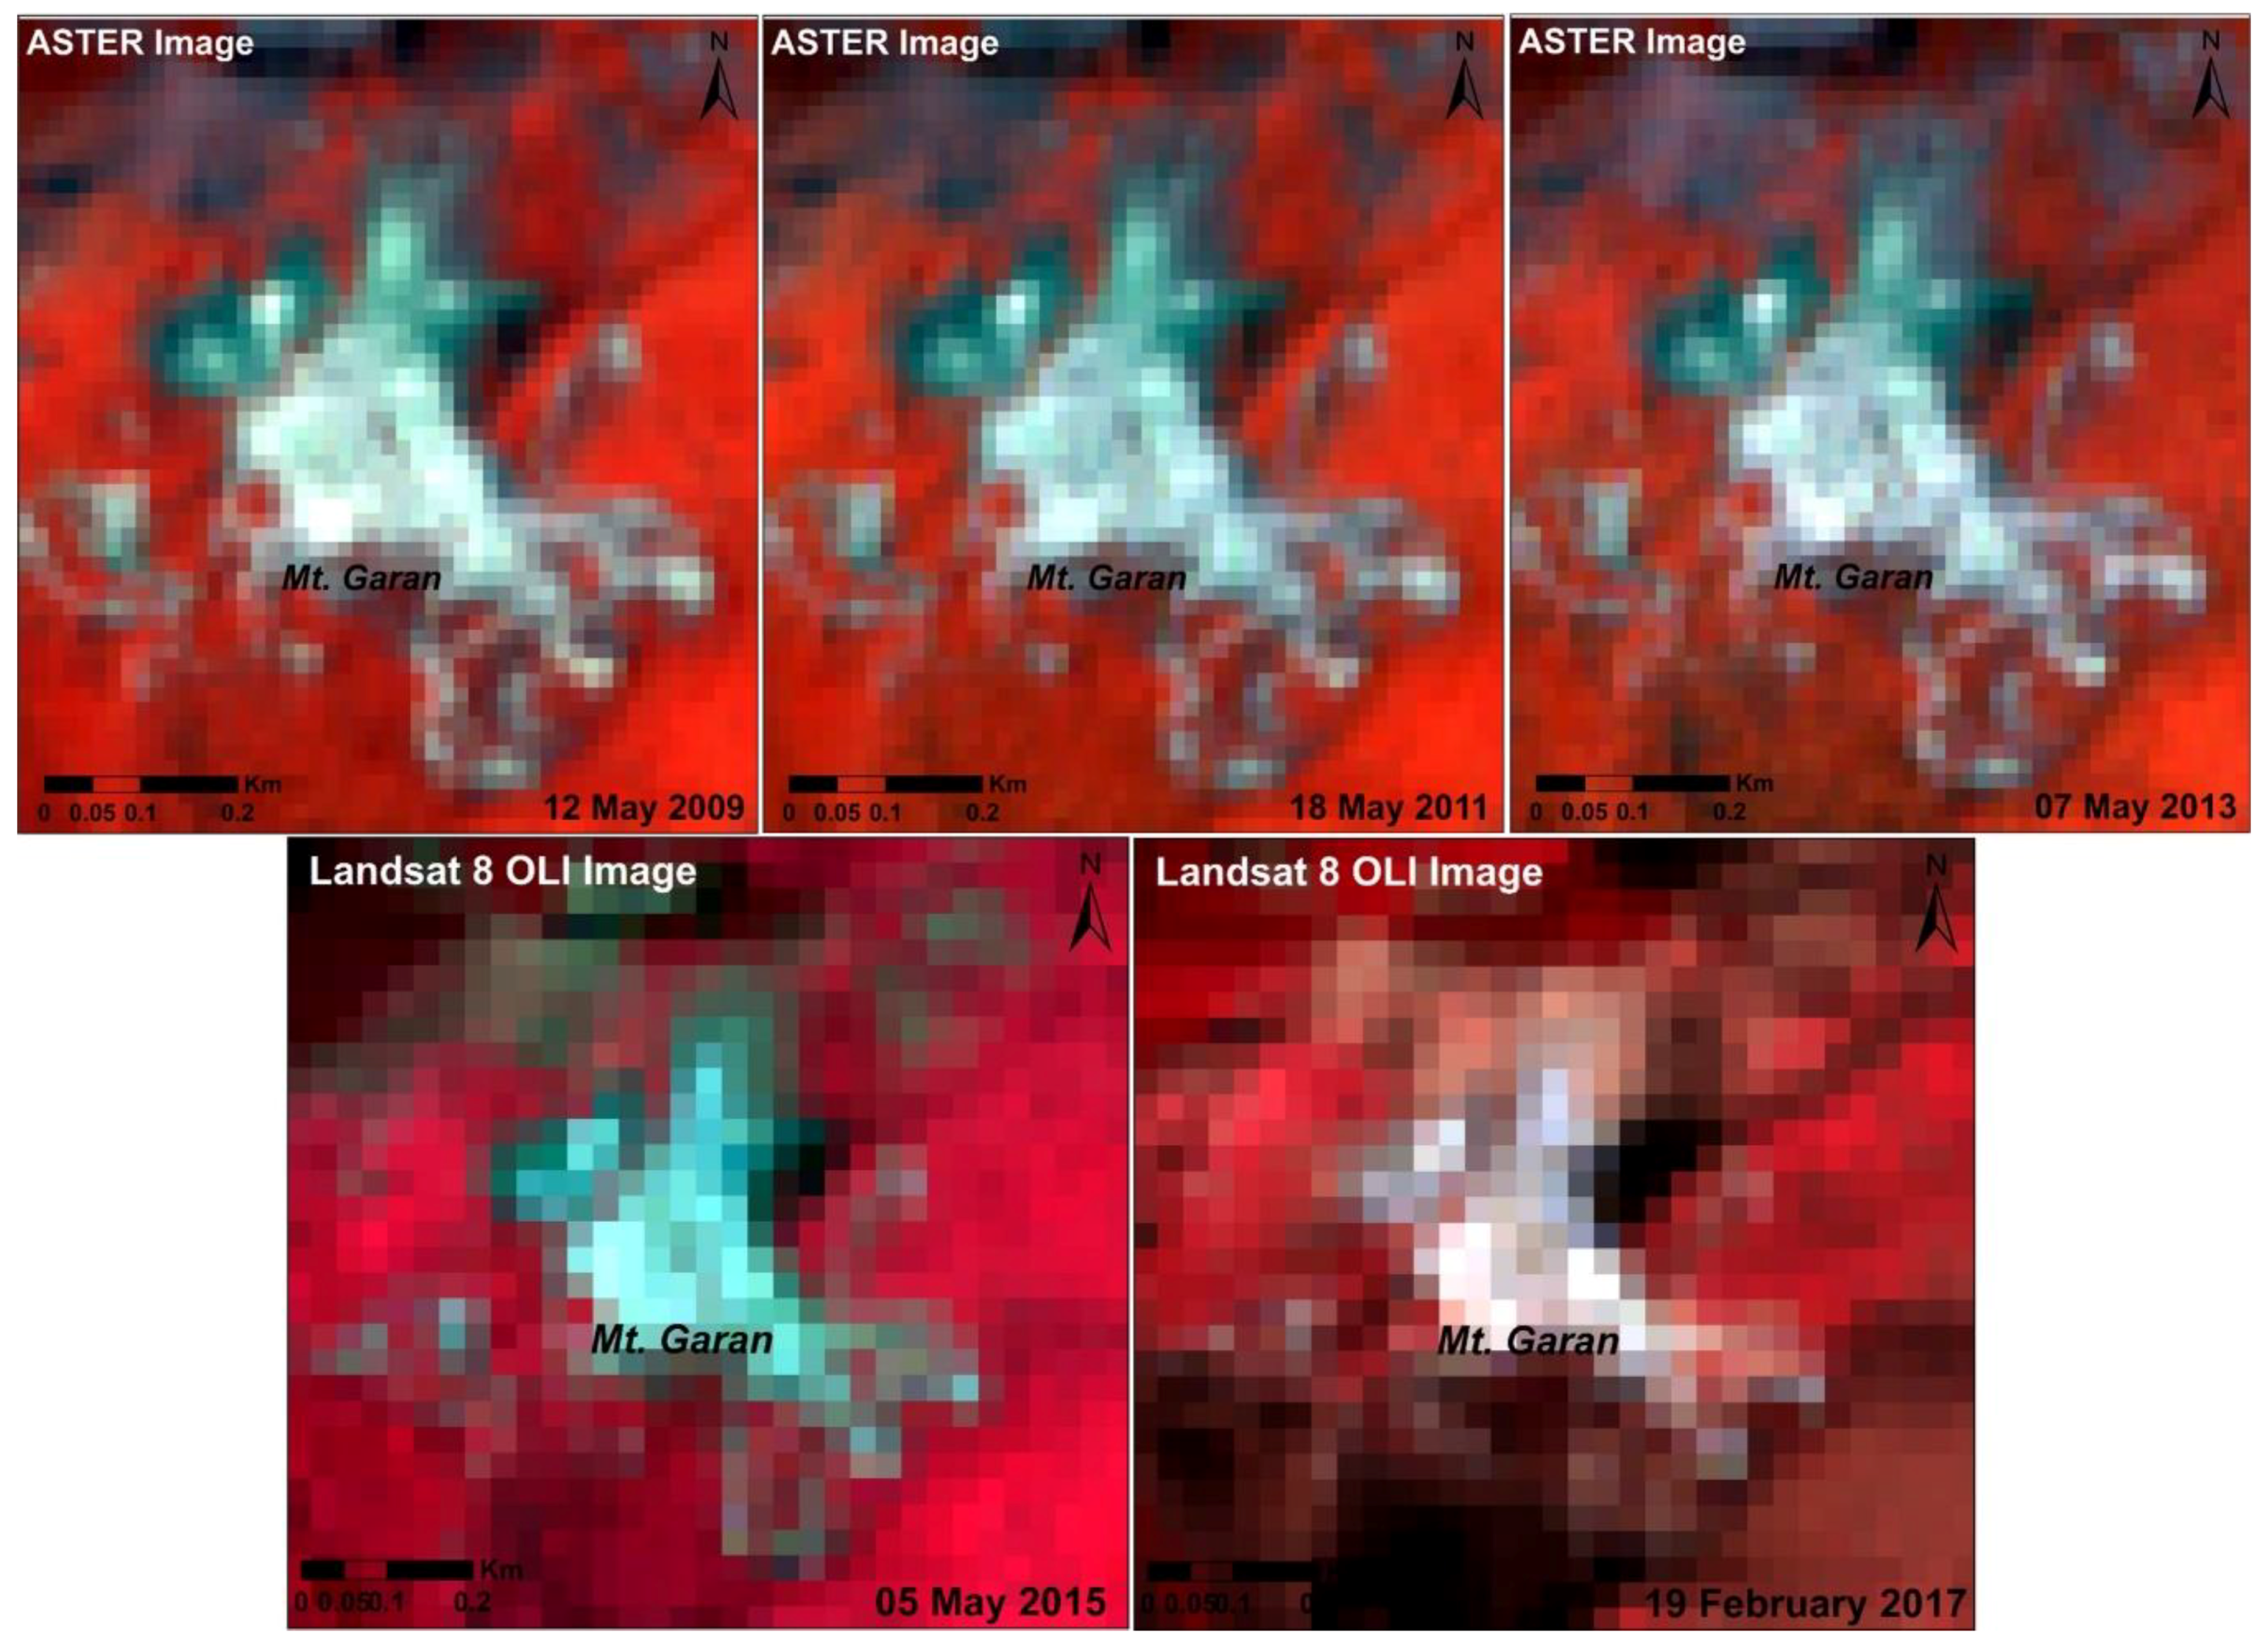
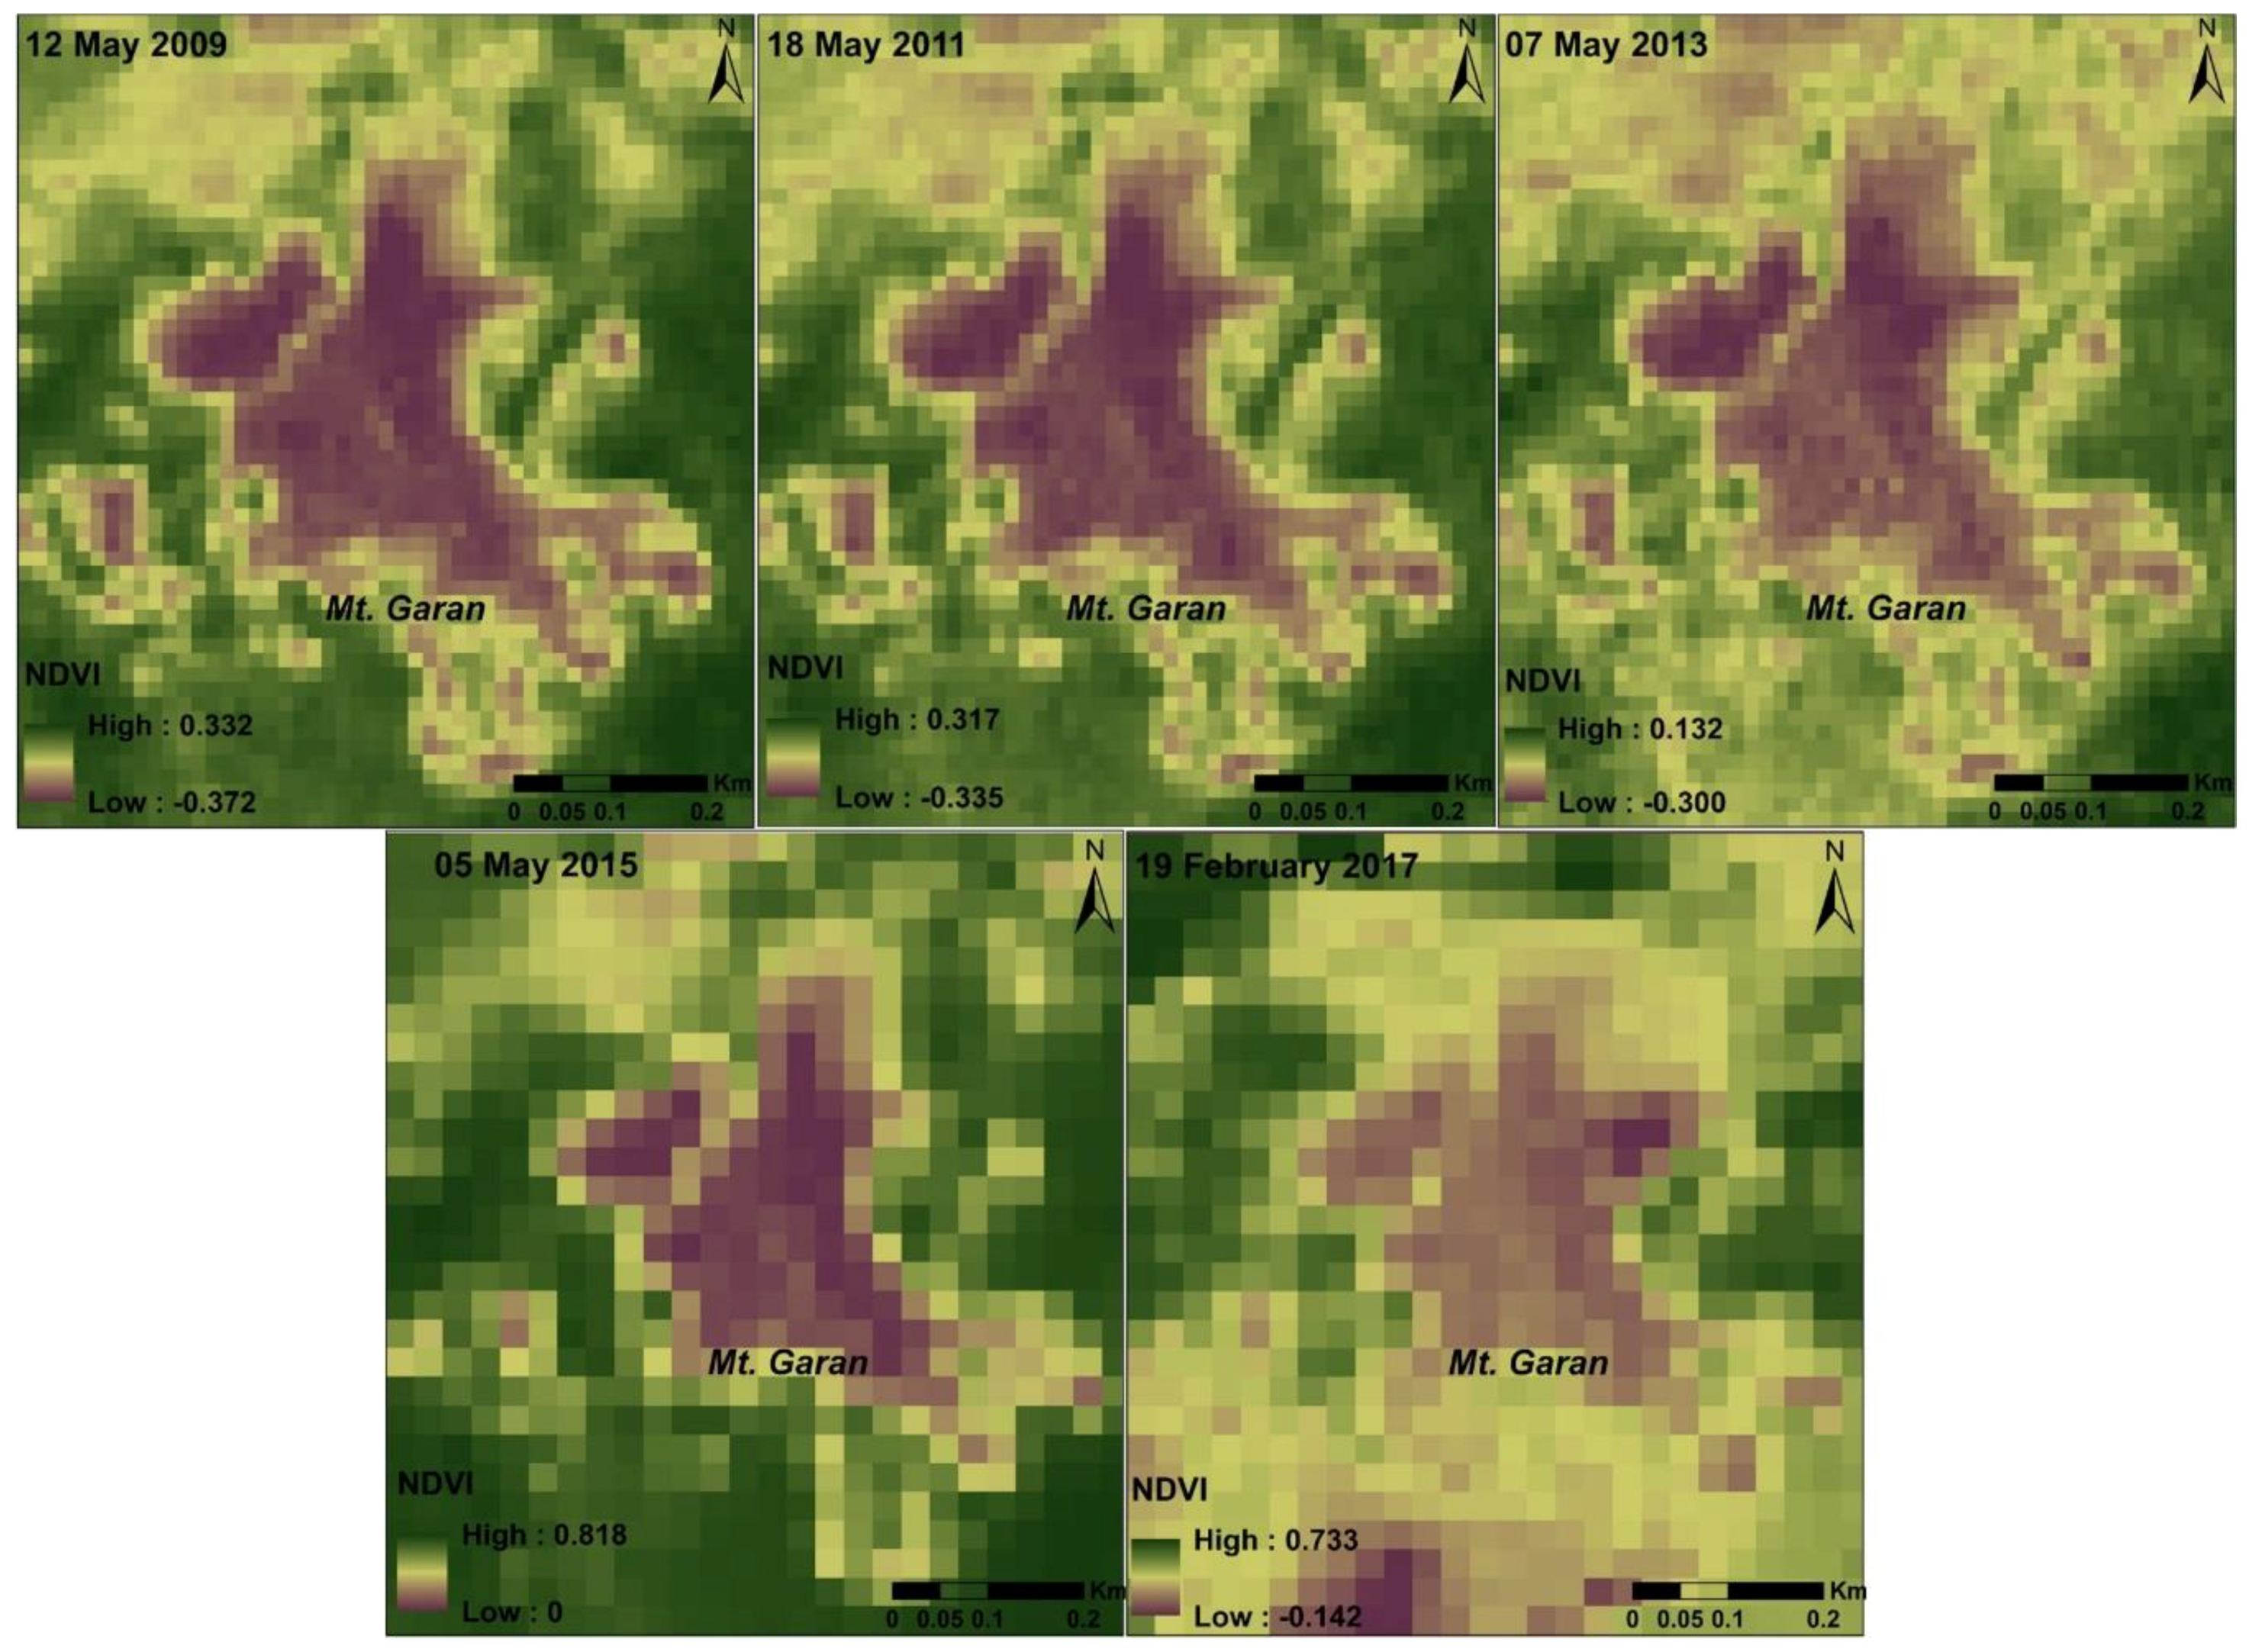
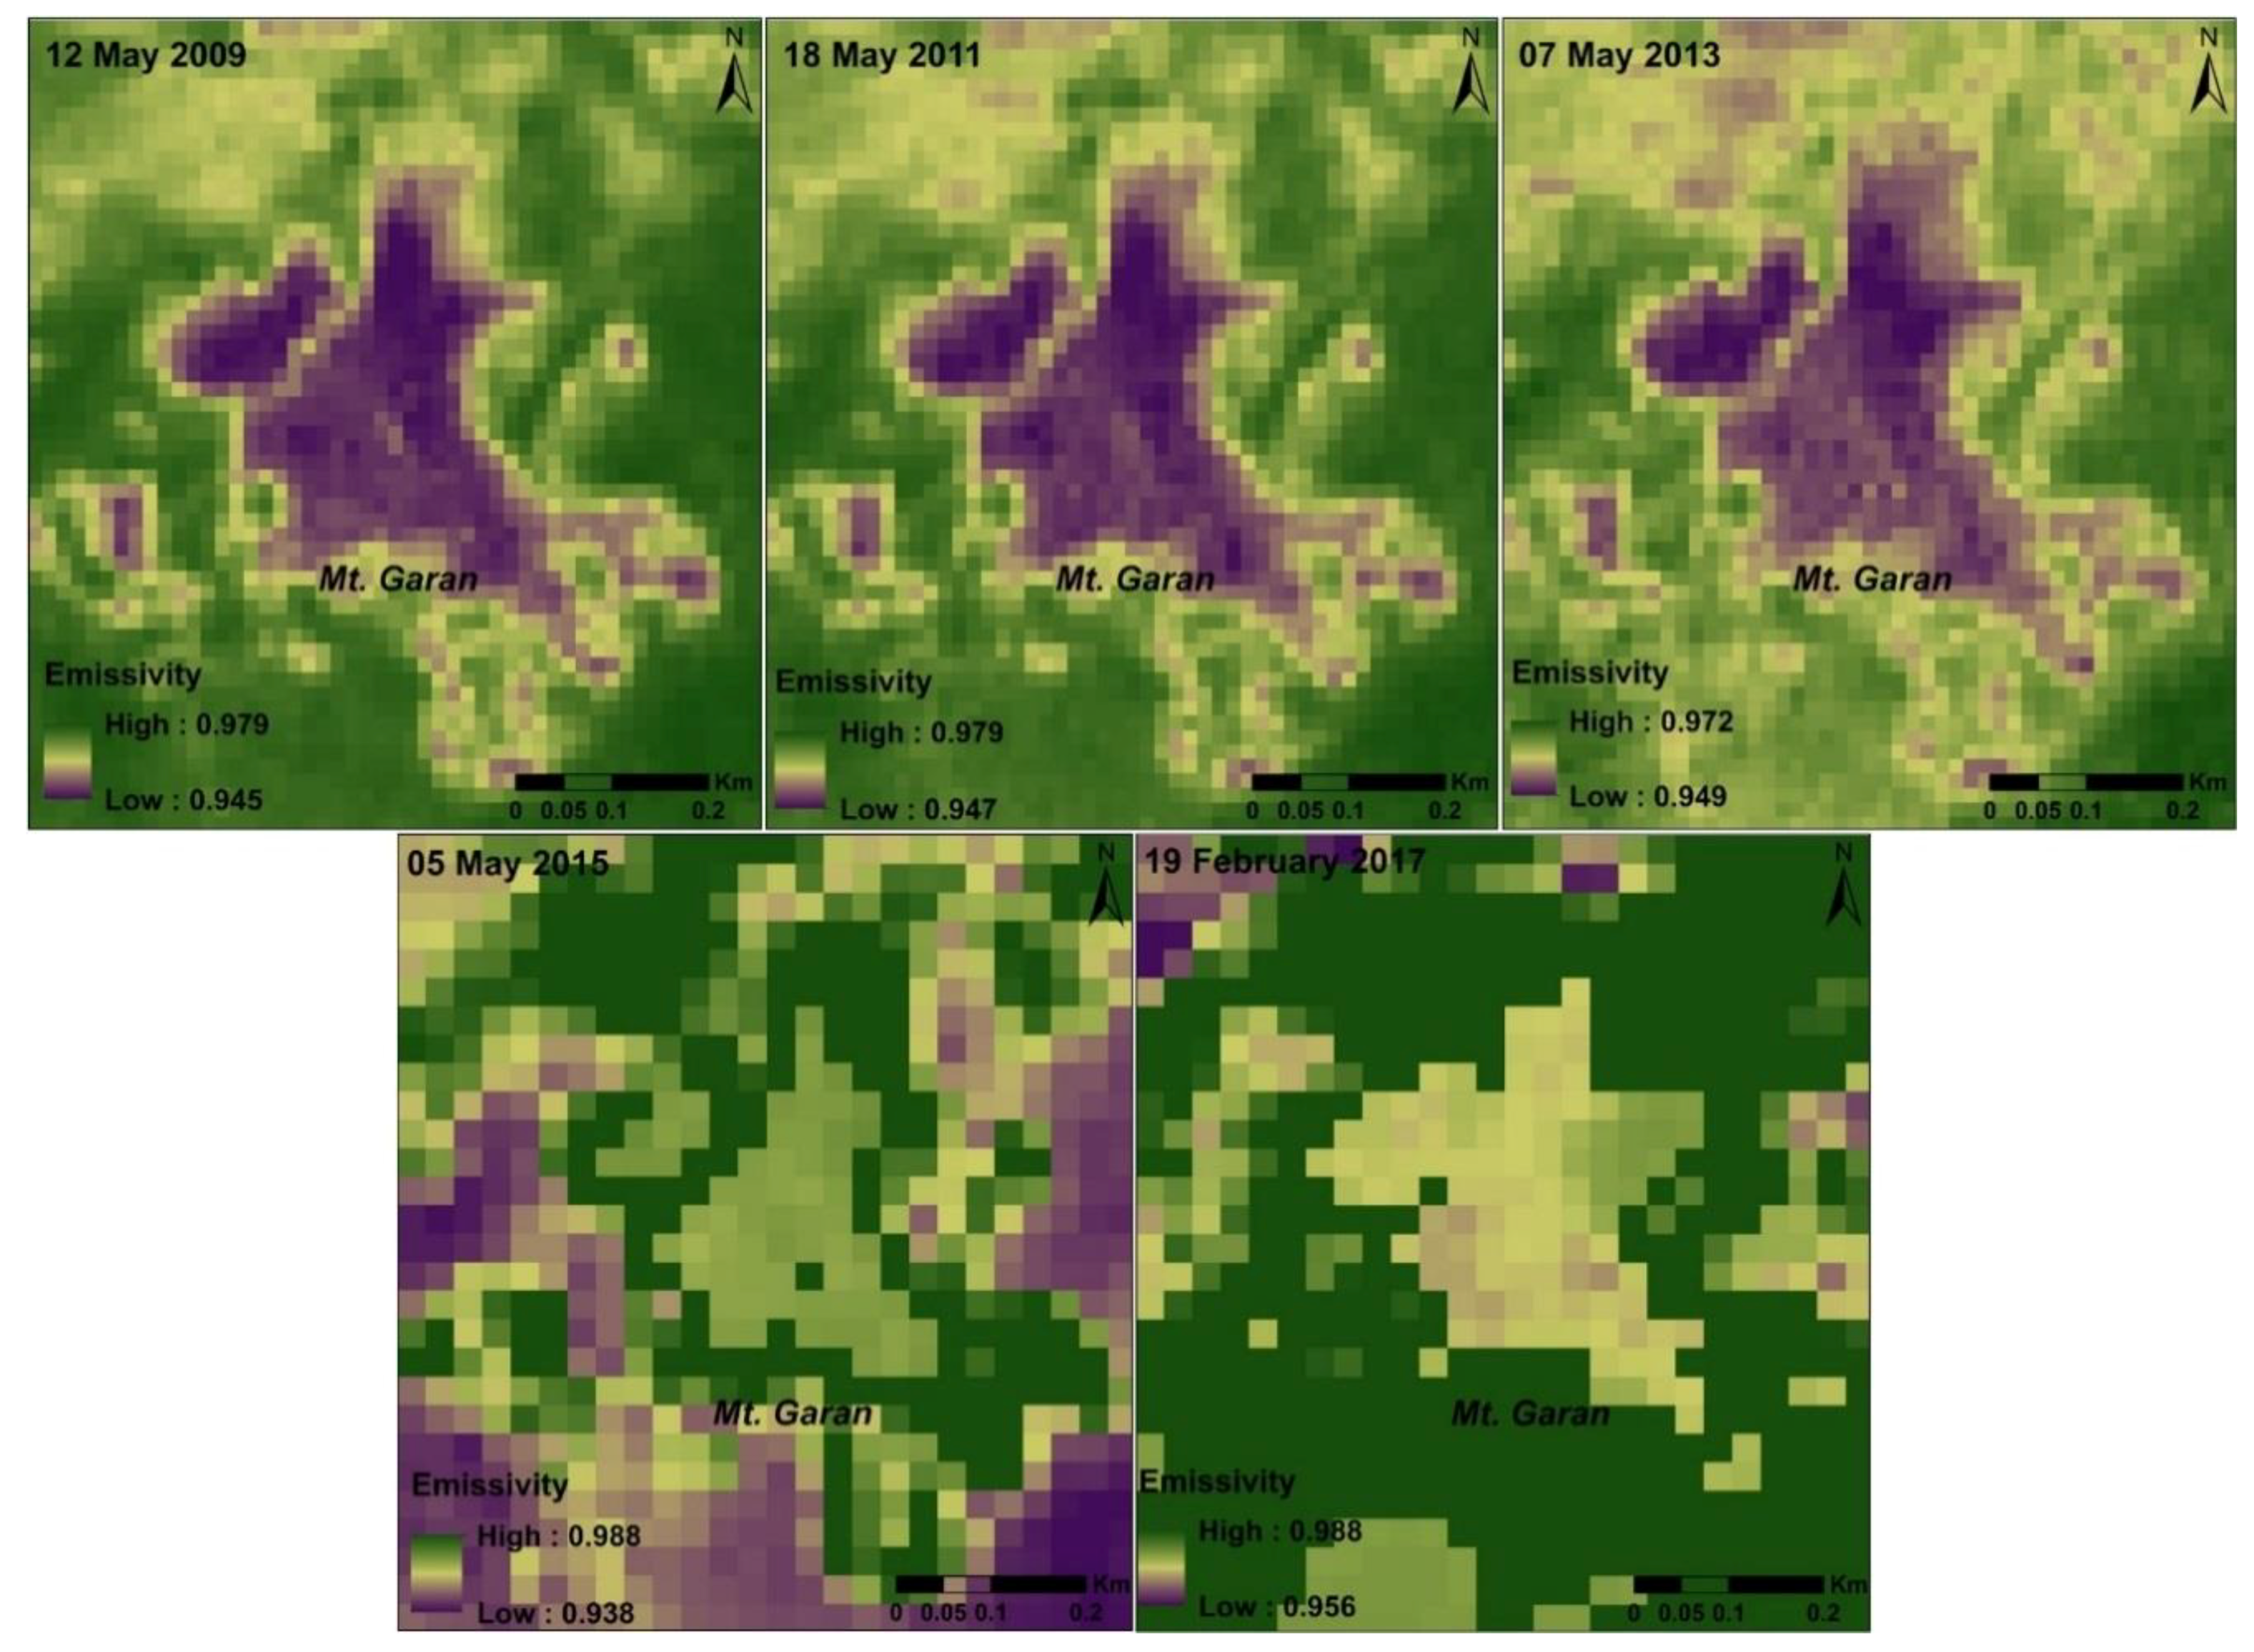
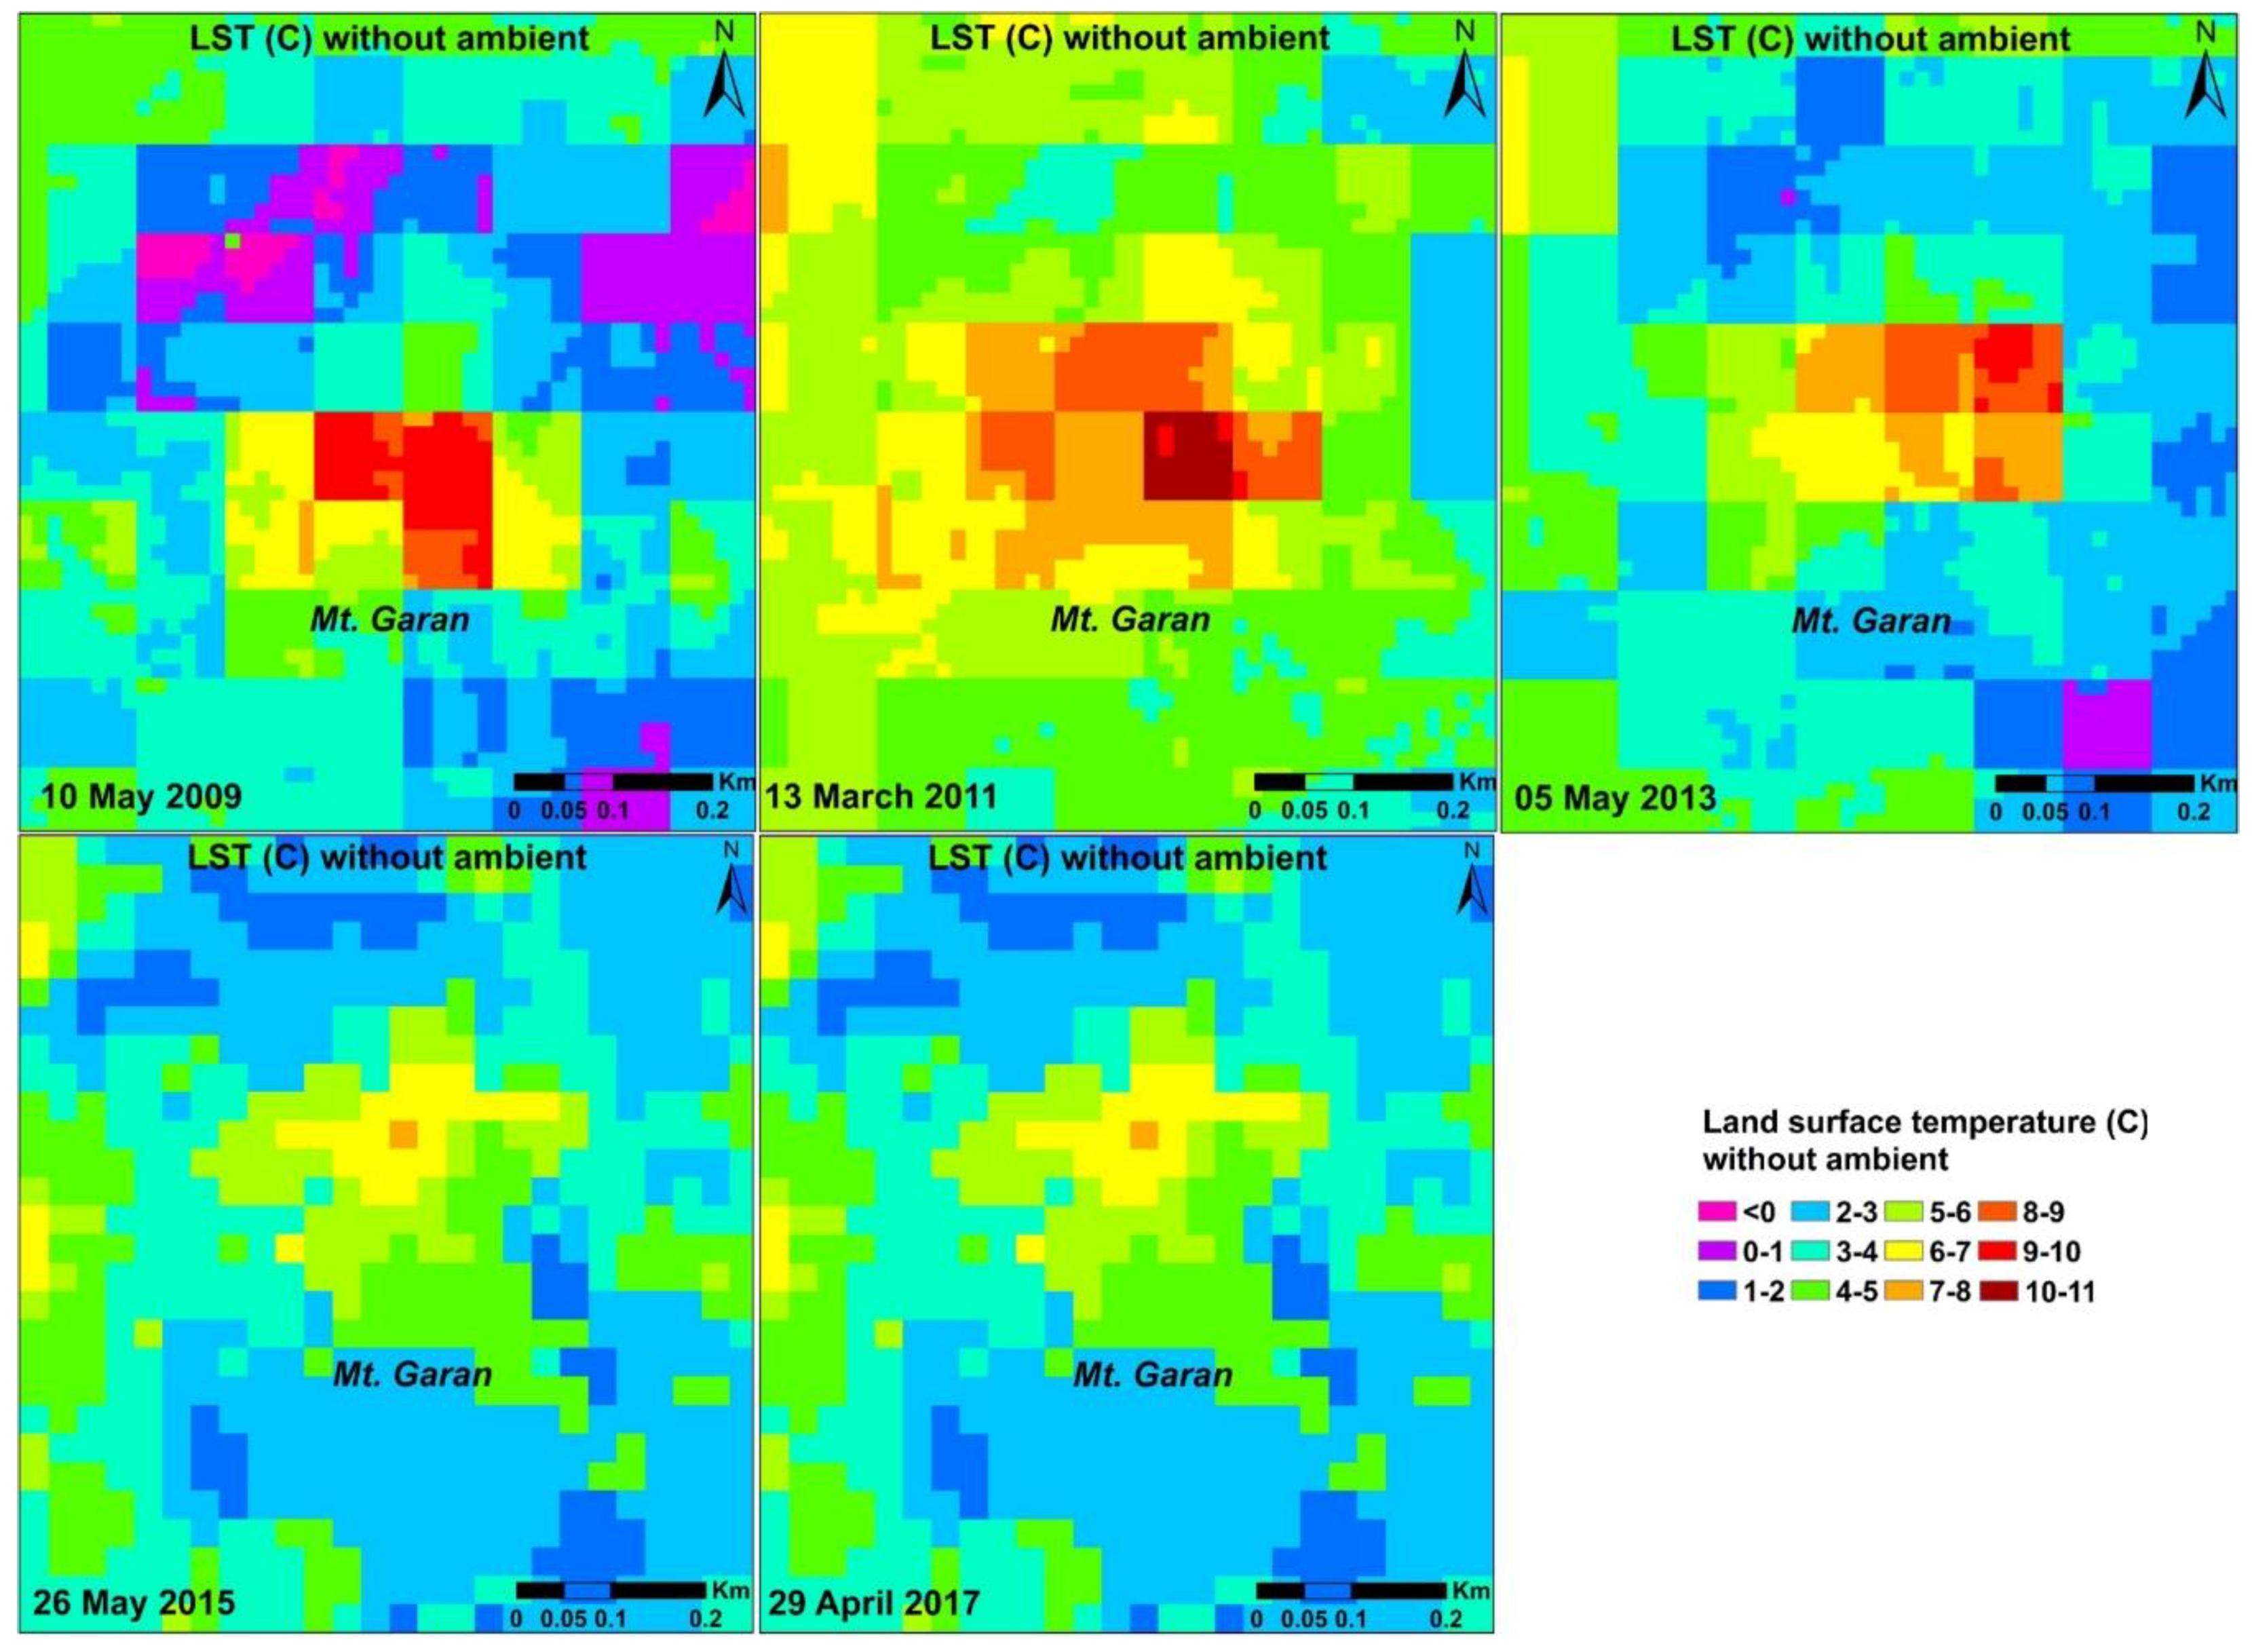
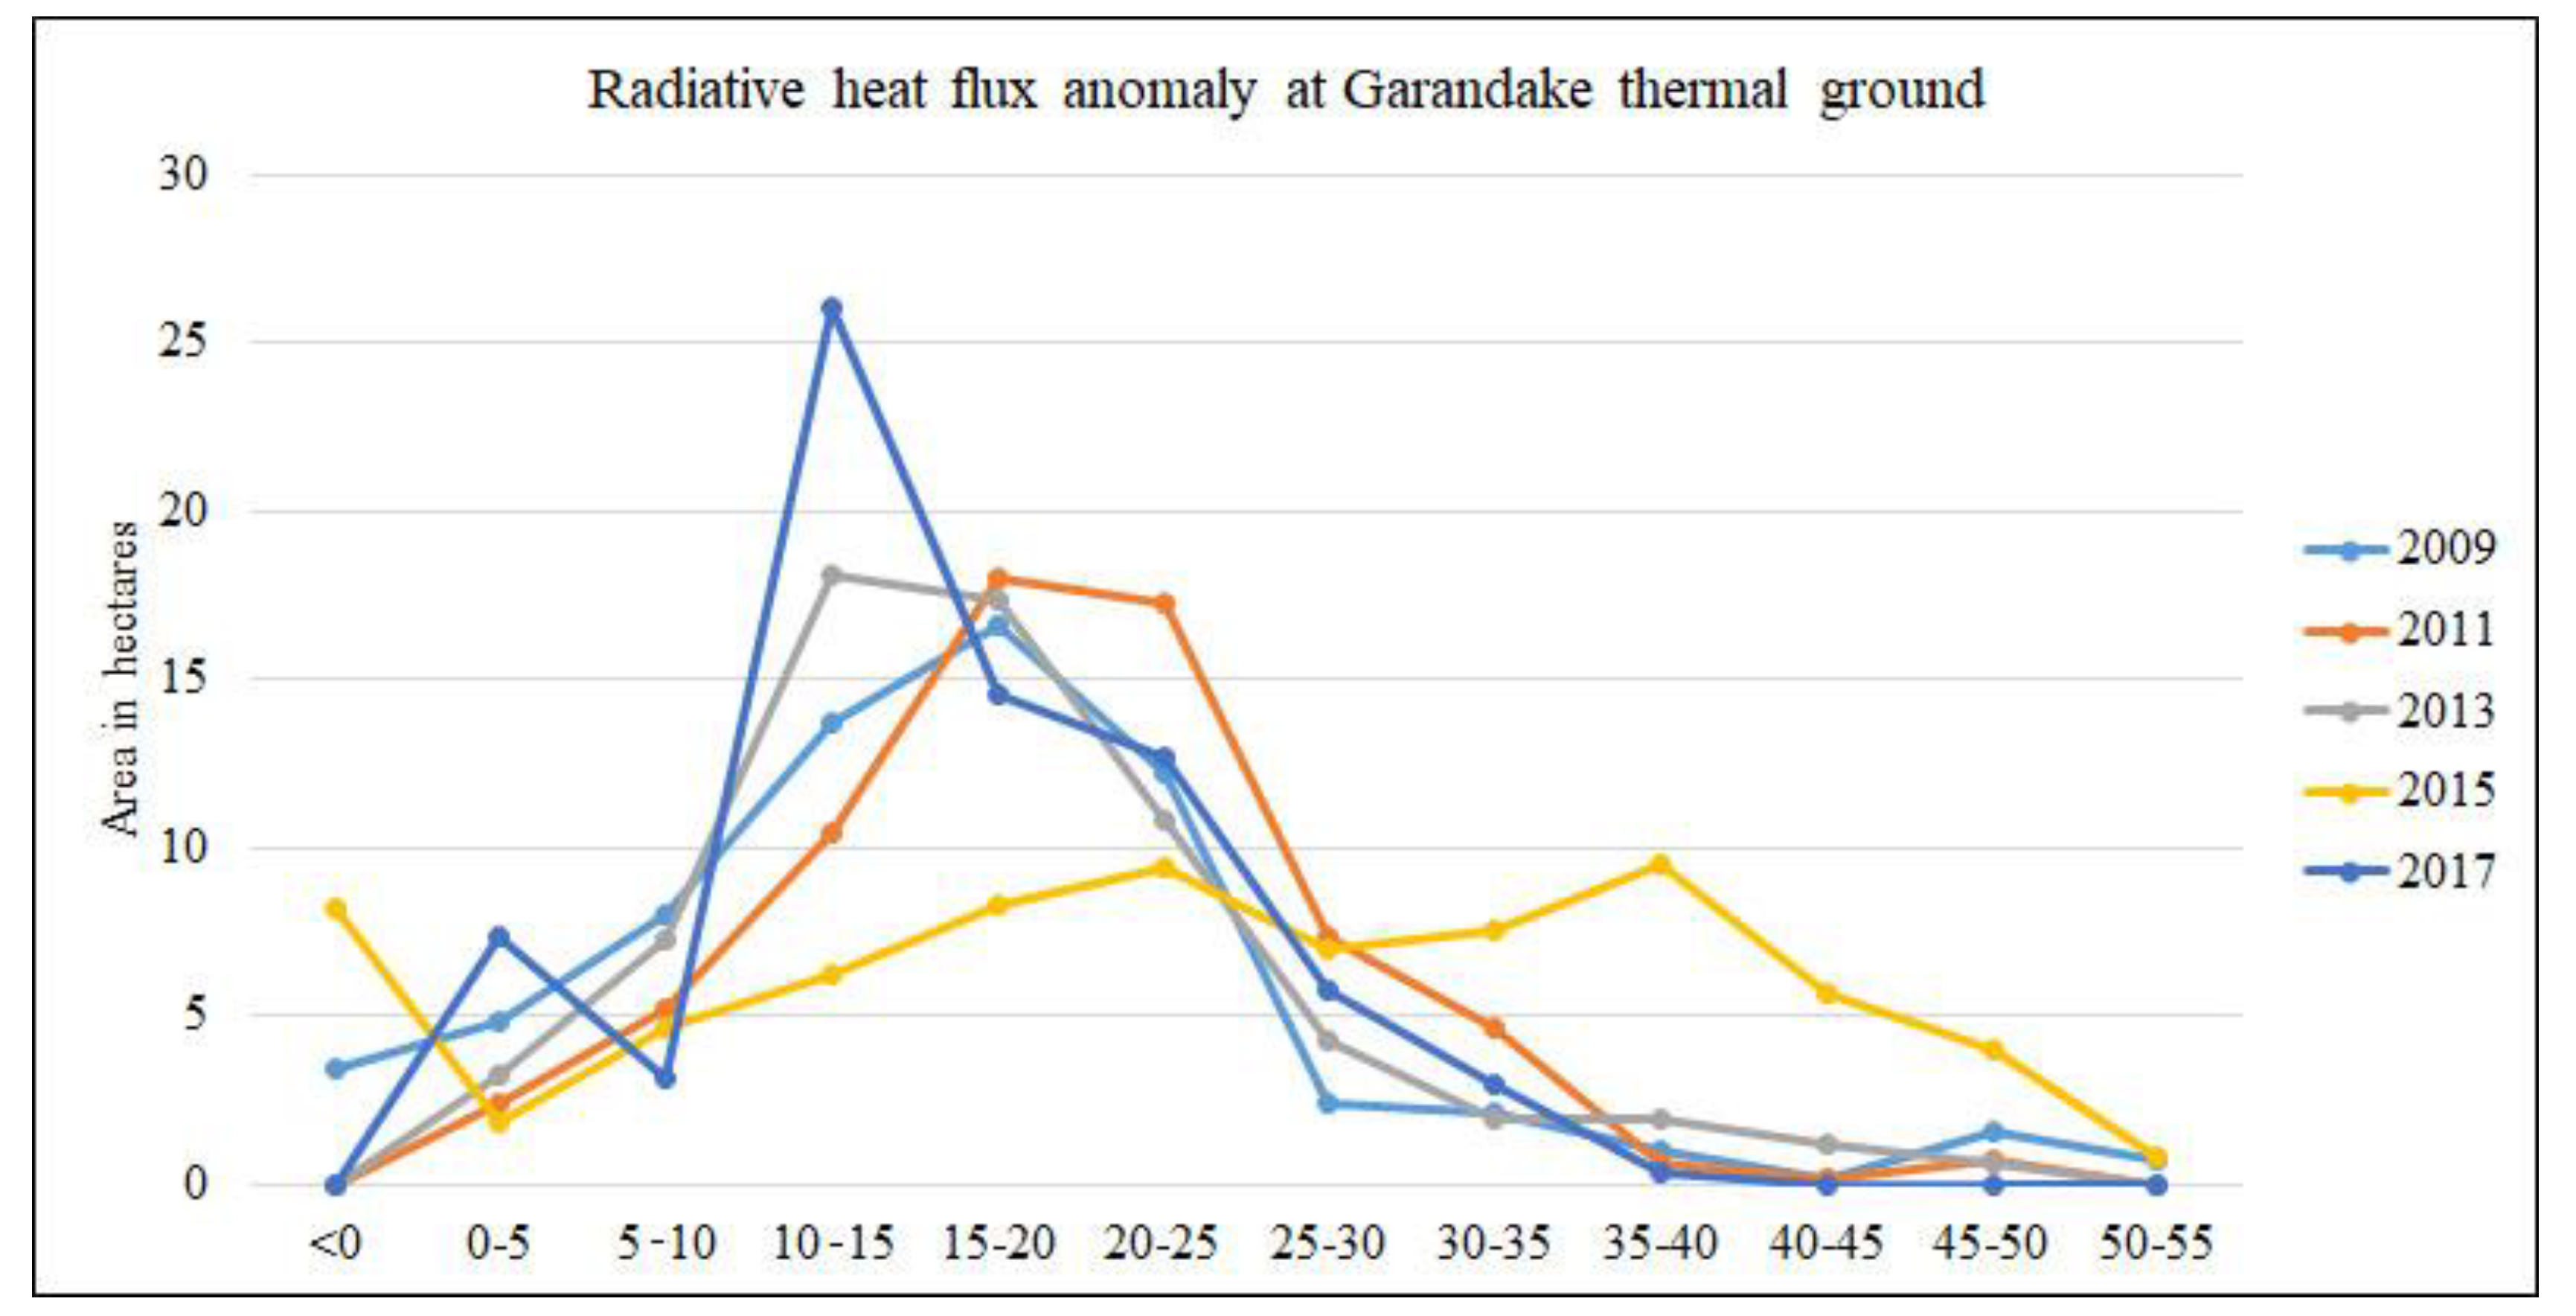
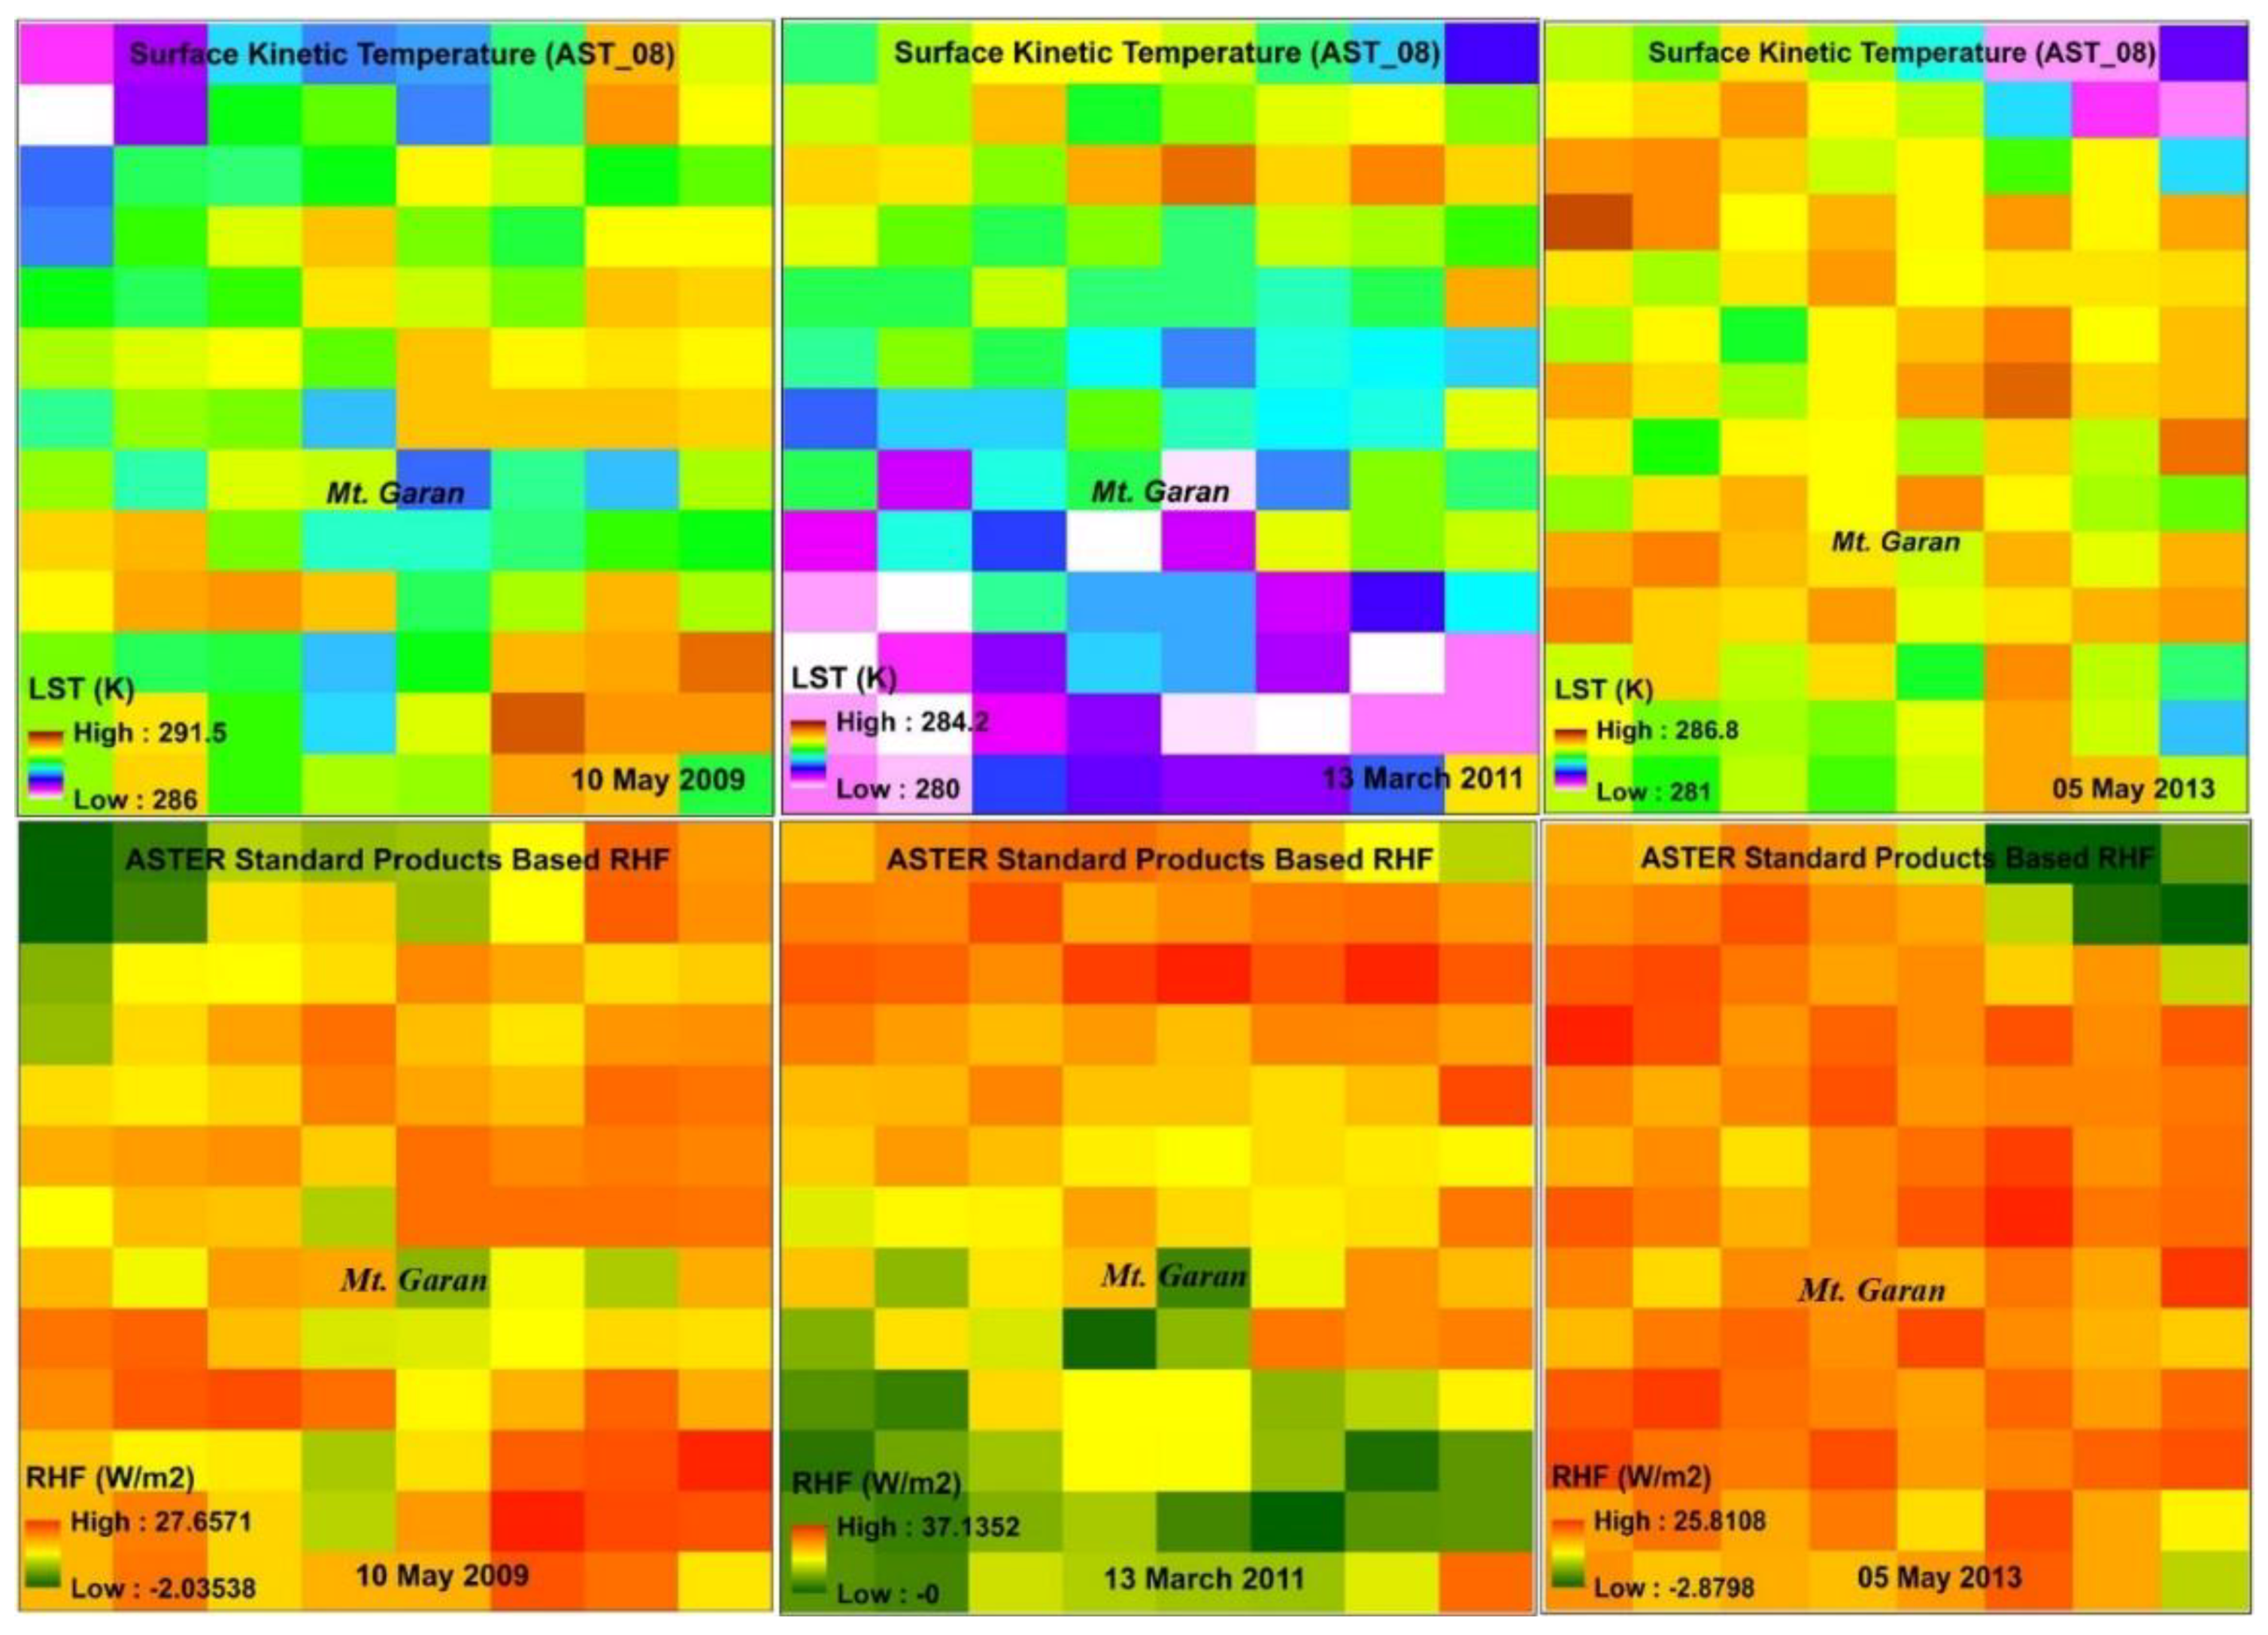
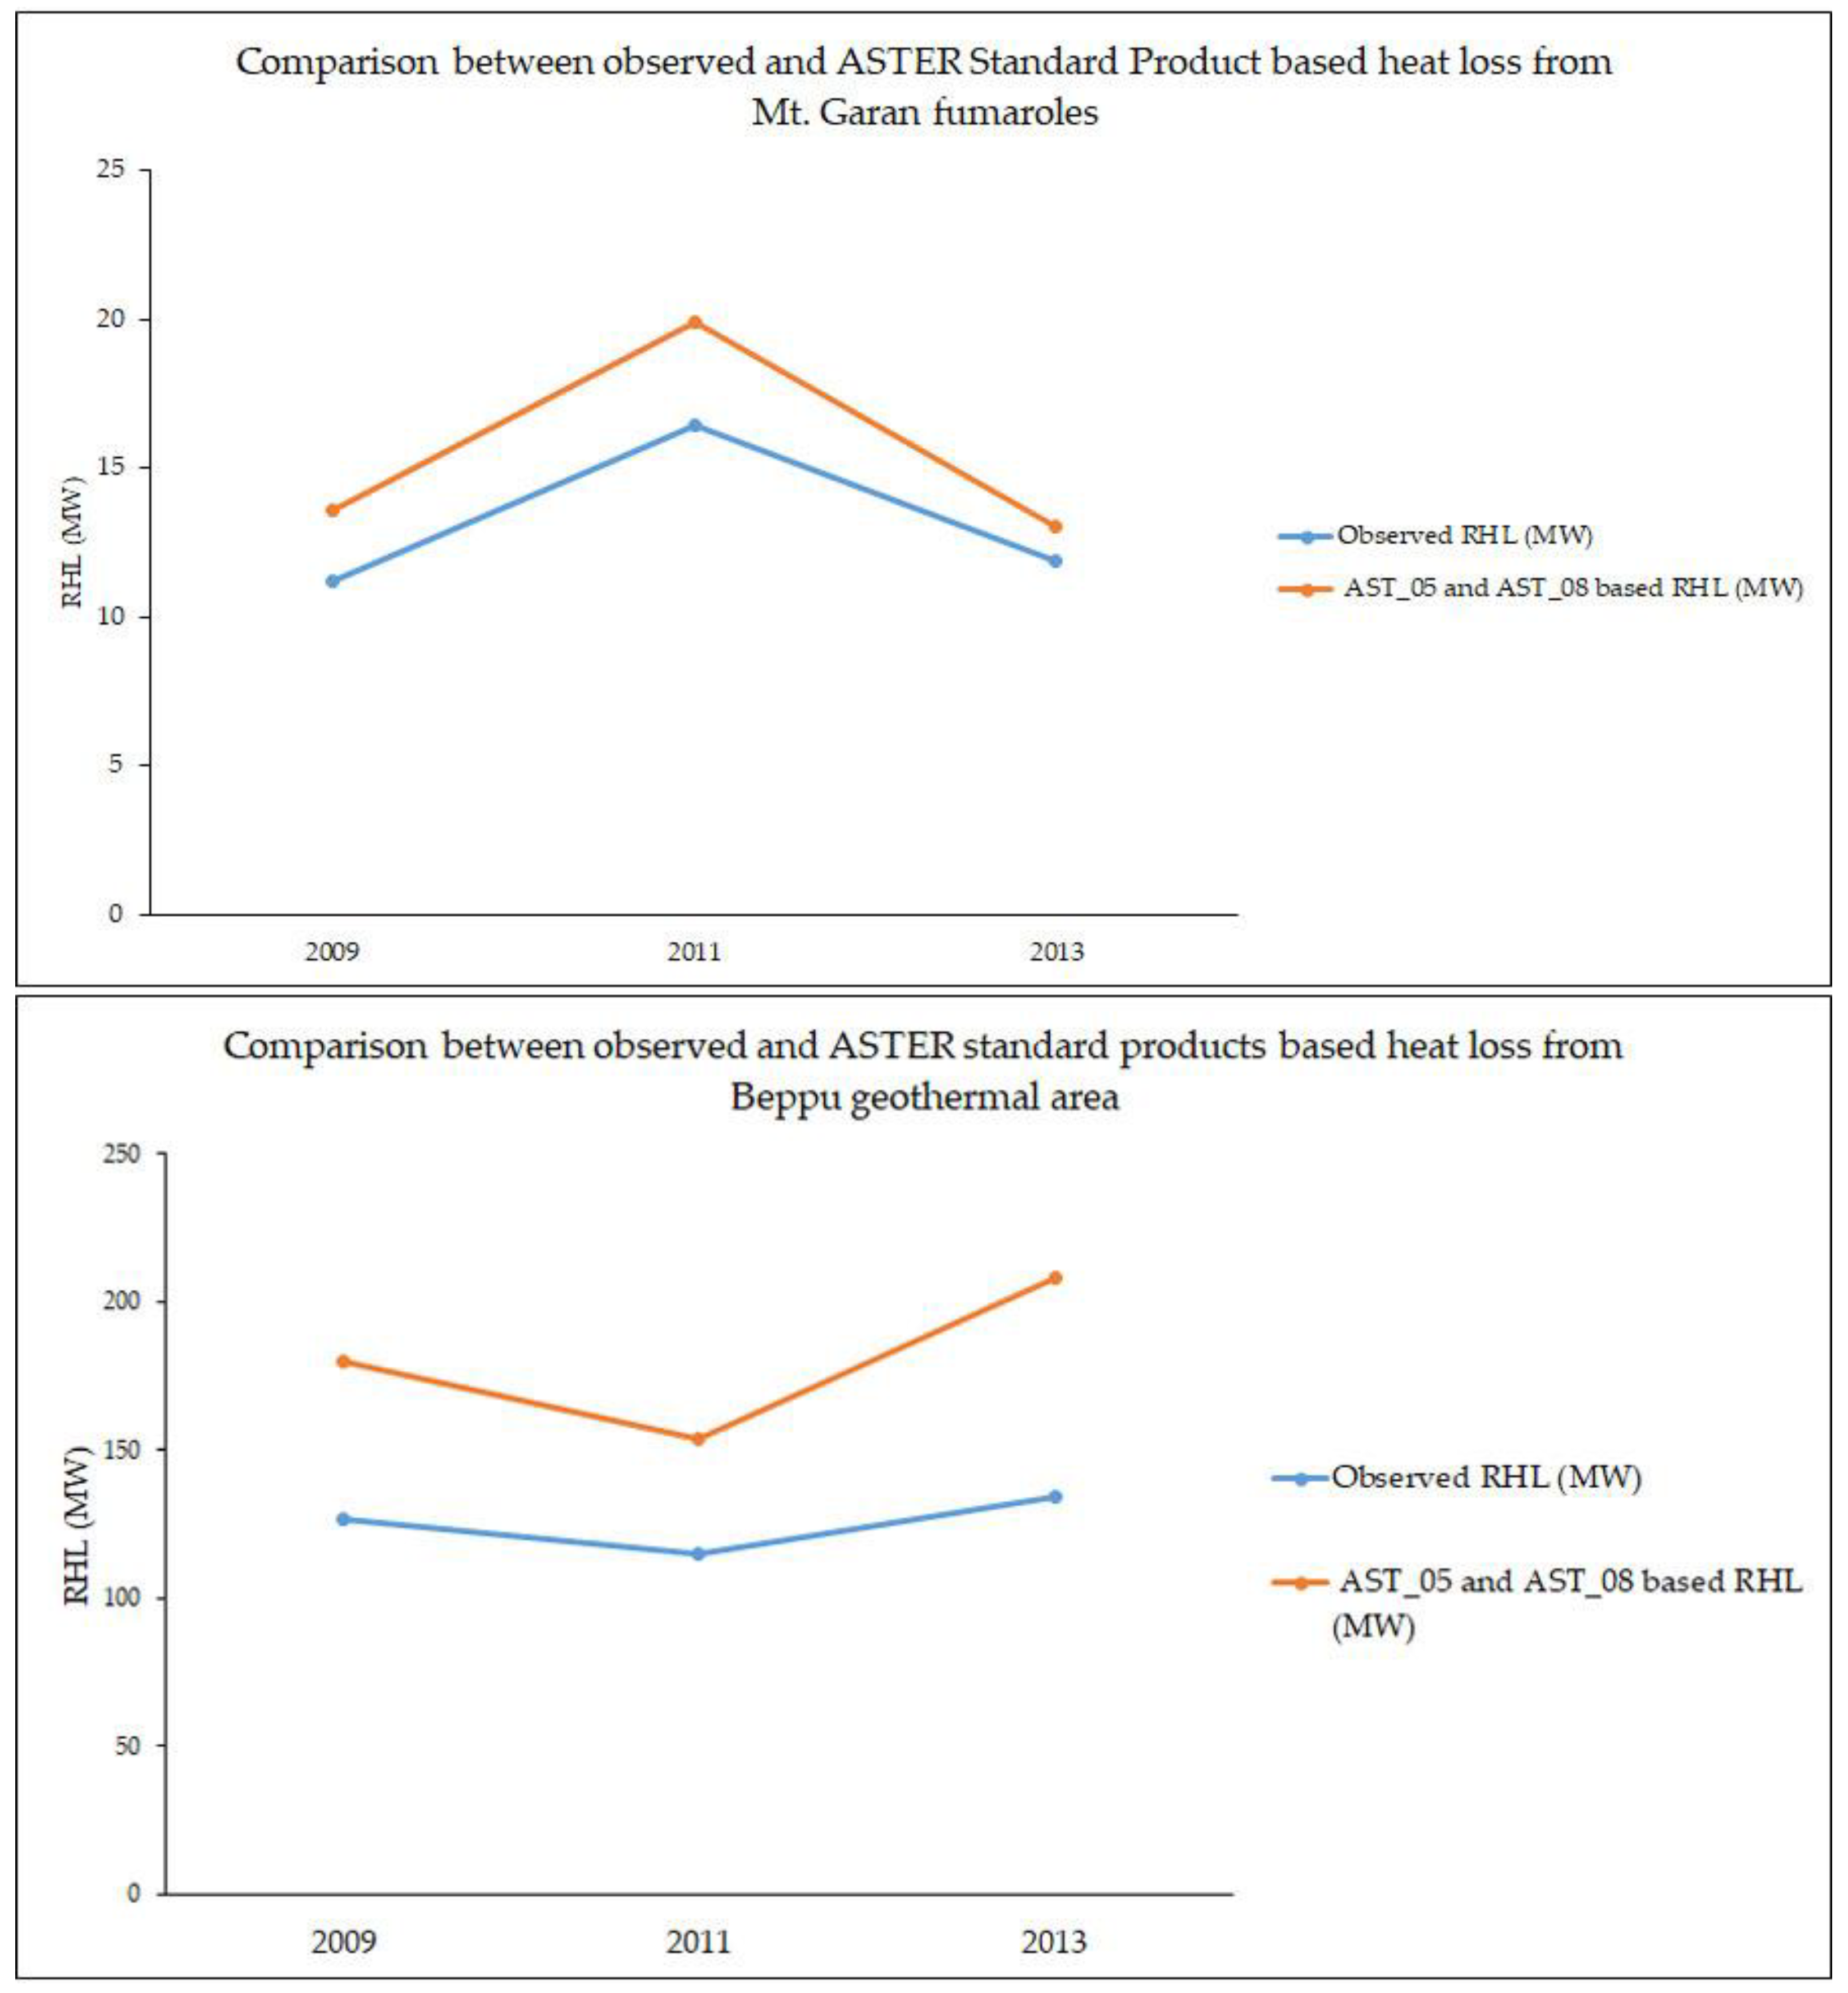
4.1. Mt. Garan Fumaroles

Five daytime visible near-infrared (VNIR) images of the Garandake fumaroles were acquired from USGS archives, three ASTER and two Landsat 8 OLI, considered to be good quality and cloud-free (Figure 4). Daytime images were used to calculate the spectral emissivity of each land cover of the study area using the NDVI threshold method. NDVI indicates the ratio of near-infrared and red bands of ASTER multispectral satellite images. NDVI values range from −1 to 1. Higher NDVI values (above 0.5) indicate healthy vegetation, lower values (below 0.2) indicate bare land or water bodies and mixed land cover (NDVI = 0.2–0.5) [32]. The Garandake fumaroles showed lower or negative NDVI values, indicating bare ground around the fumaroles, and higher positive values in vegetated areas (Figure 5). The NDVI threshold method were used to retrieve spectral emissivity of each land cover of the study area. Average spectral emissivity ranges from 0.988 to 0.94 for the land covers of the Mt. Garan fumaroles area (Figure 6).
Land surface temperature is the main component of heat loss measurement from volcanoes or volcanically thermal ground. Higher spatial resolution of the thermal infrared band is the best option for detailed or accurate results of thermal anomalies or heat loss component. ASTER or Landsat 8 thermal infrared data consist of moderate-resolution images (resampled 30 m of original 90–100 m TIR data) and are used nowadays effectively for the thermal mapping of volcanoes. We estimated the thermal features, i.e., land surface temperatures, of the study areas with the ASTER and Landsat 8 TIRS data using a split-window algorithm with two thermal bands of ASTER (bands 13 and 14) and Landsat 8 TIRS (bands 10 and 11) images. We obtained a higher LST anomaly without ambient temperature within the Garandake fumaroles area than the surrounding area in all five sets of thermal images from 2009 to 2017. The highest LST without ambient temperature in the Garandake fumaroles was about 11 °C in 2011 and the lowest was about 7 °C in 2017 (Figure 7; Table 3). The thermal anomaly area was also the highest in 2011 and the lowest in 2017.
Radiative heat flux is one of the components of heat loss from volcanoes that can be measured using satellite thermal infrared sensors. We applied the Stefan–Boltzmann law of thermal heat loss to estimate RHF using skin land surface temperature of the Garandake fumaroles from 2009 to 2017 derived from the ASTER and Landsat 8 thermal infrared data. The highest pixel RHF value was within the range of 47 to 53 W/m2 from 2009 to 2015, and 38 W/m2 in 2017 (Figure 8; Table 3). The highest maximum RHF value was about 53 W/m2 in 2015 and the lowest maximum RHF was about 38 W/m2 in 2017. The highest anomaly area of radiative heat flux was found in 2011 and the lowest in 2017. After adding all positive RHF values of the Garandake thermal ground, we obtained the highest, about 17 MW radiative heat loss (RHL) in 2015, and the lowest, about 11 MW in 2009 (Table 3). Otherwise, we obtained RHL of about 16, 12, and 12 MW in 2011, 2012, and 2017, respectively (Figure 9). Then the total heat loss or heat discharge rate (HDR) of the Garandake fumarolic area was estimated after multiplying total RHL by a relationship coefficient between RHF and HDR. We obtained the highest heat loss of about 112 MW in 2015 and the lowest of about 73 MW in 2009 (Table 3; Figure 9). There were two consecutive peaks of heat loss from the Mt. Garan fumaroles, one in 2011 and the other in 2015 (Figure 9). In the higher ranges of RHF anomaly, the maximum was in 2015 and the lowest in 2017; the mid-ranges of RHF anomaly were the highest in 2015 and lowest in 2009, and the lower range of RHF anomaly were at the maximum in 2017 and minimum in 2015 (Figure 10).

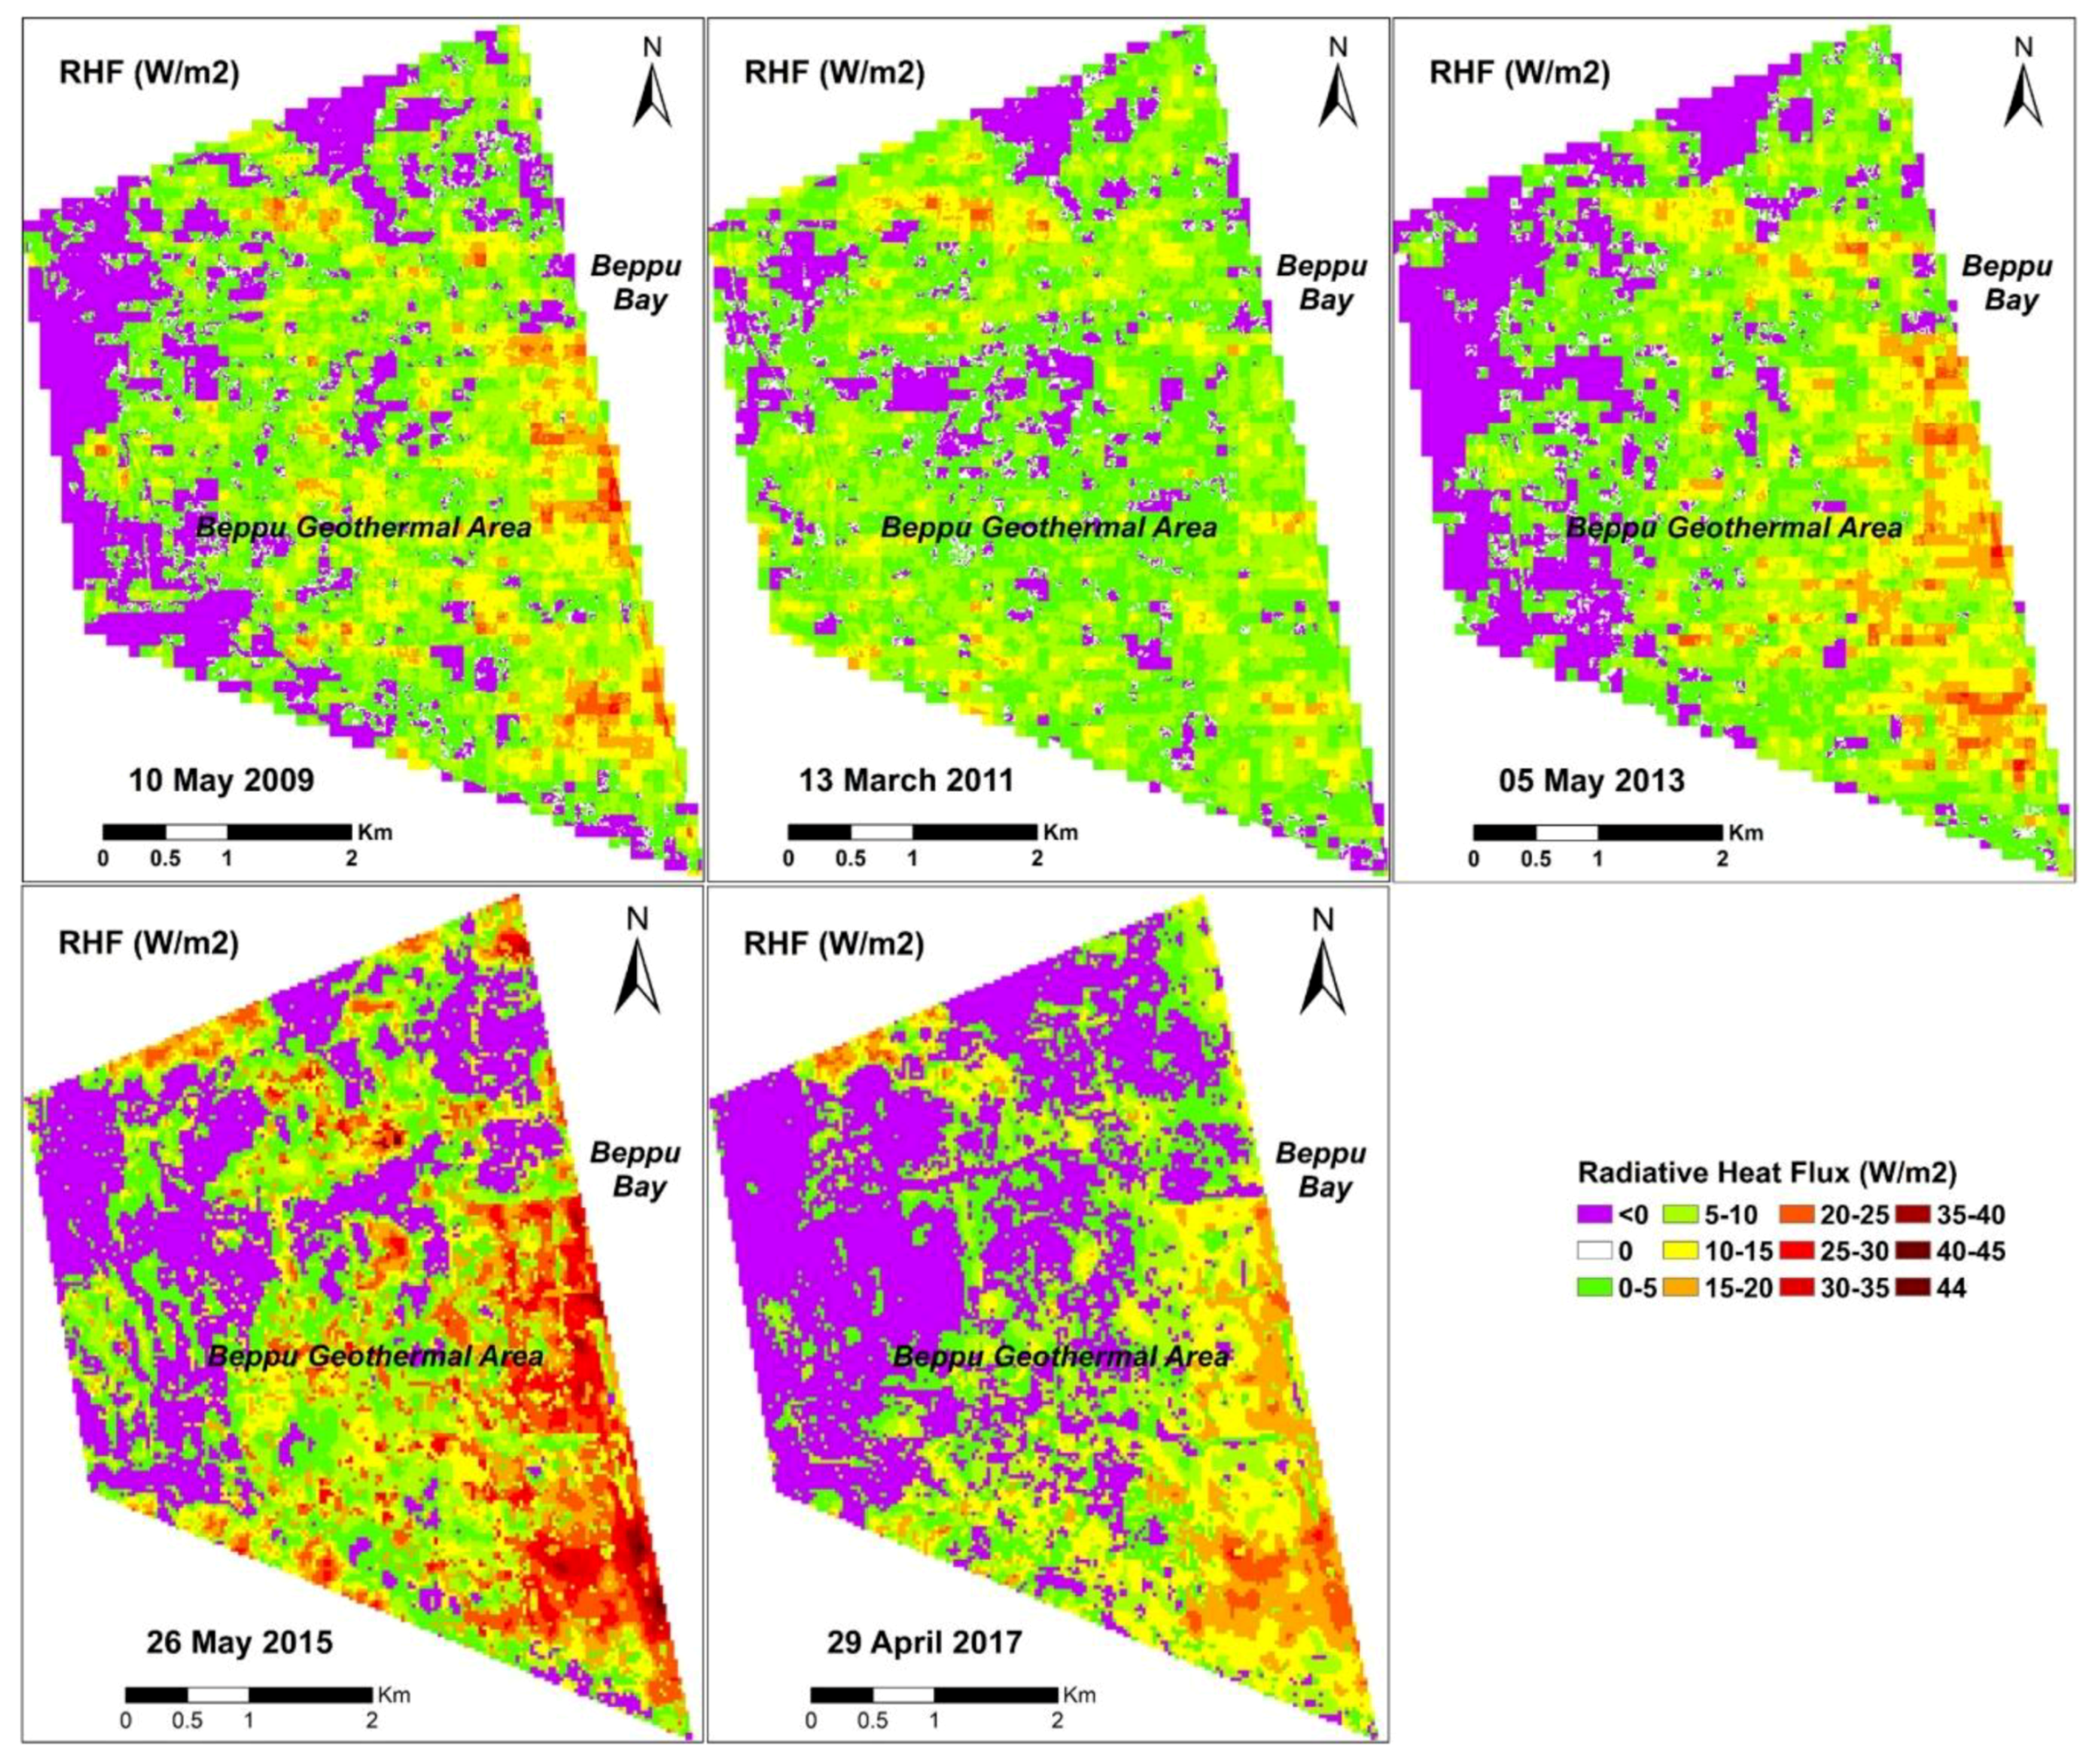
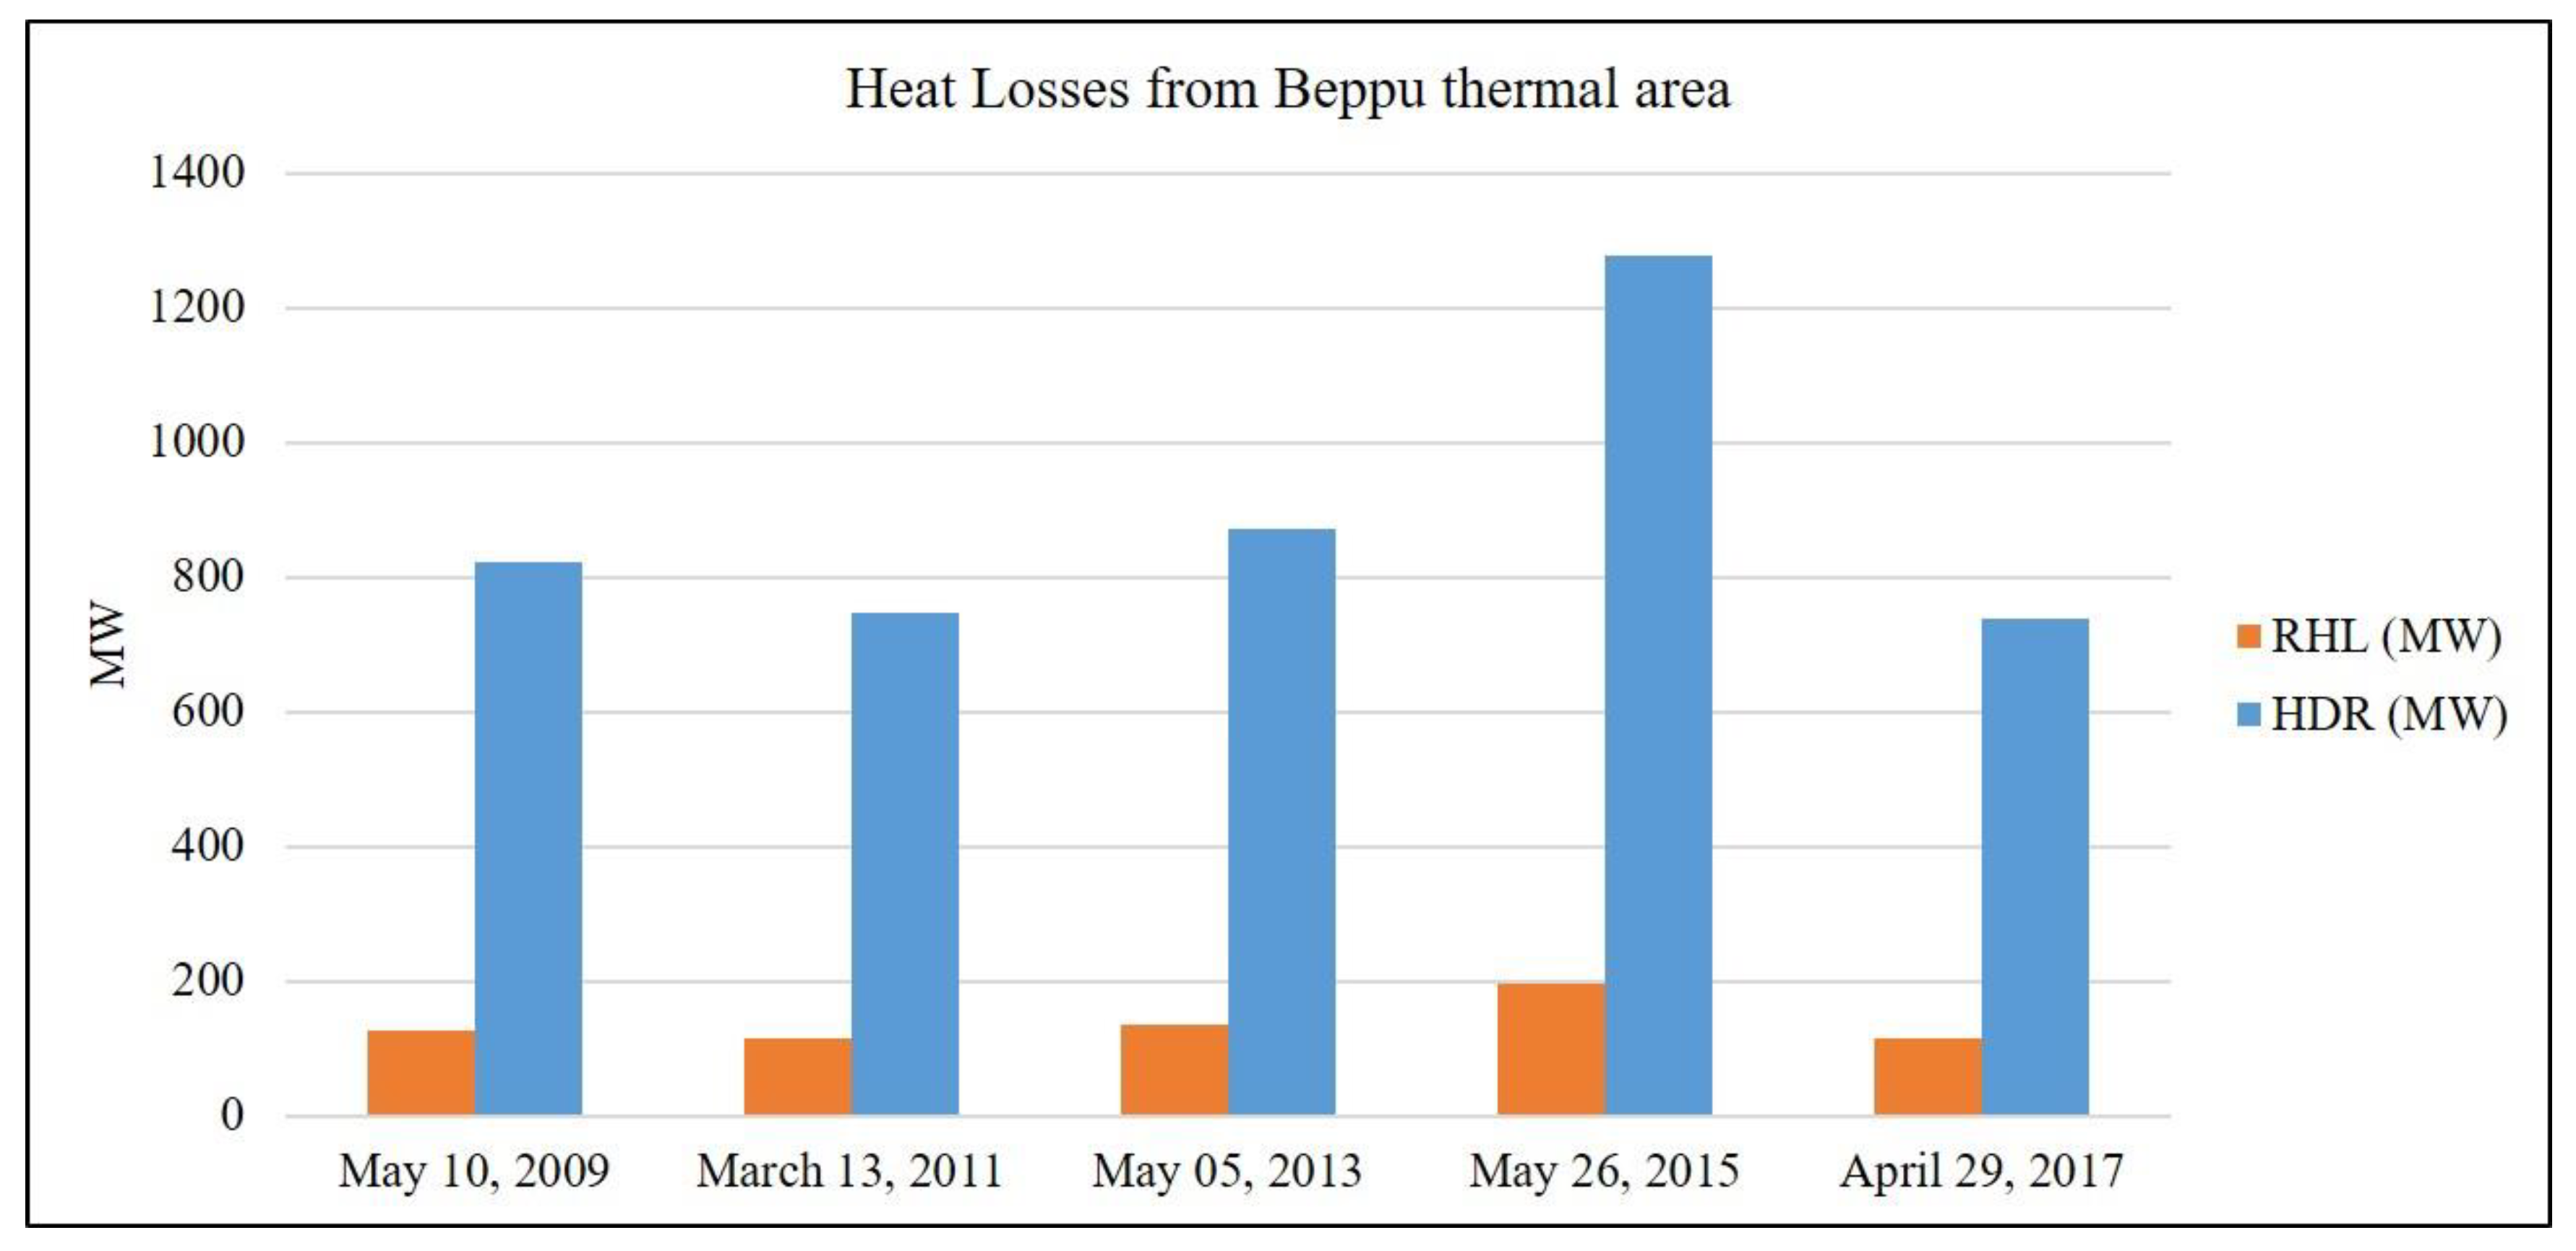
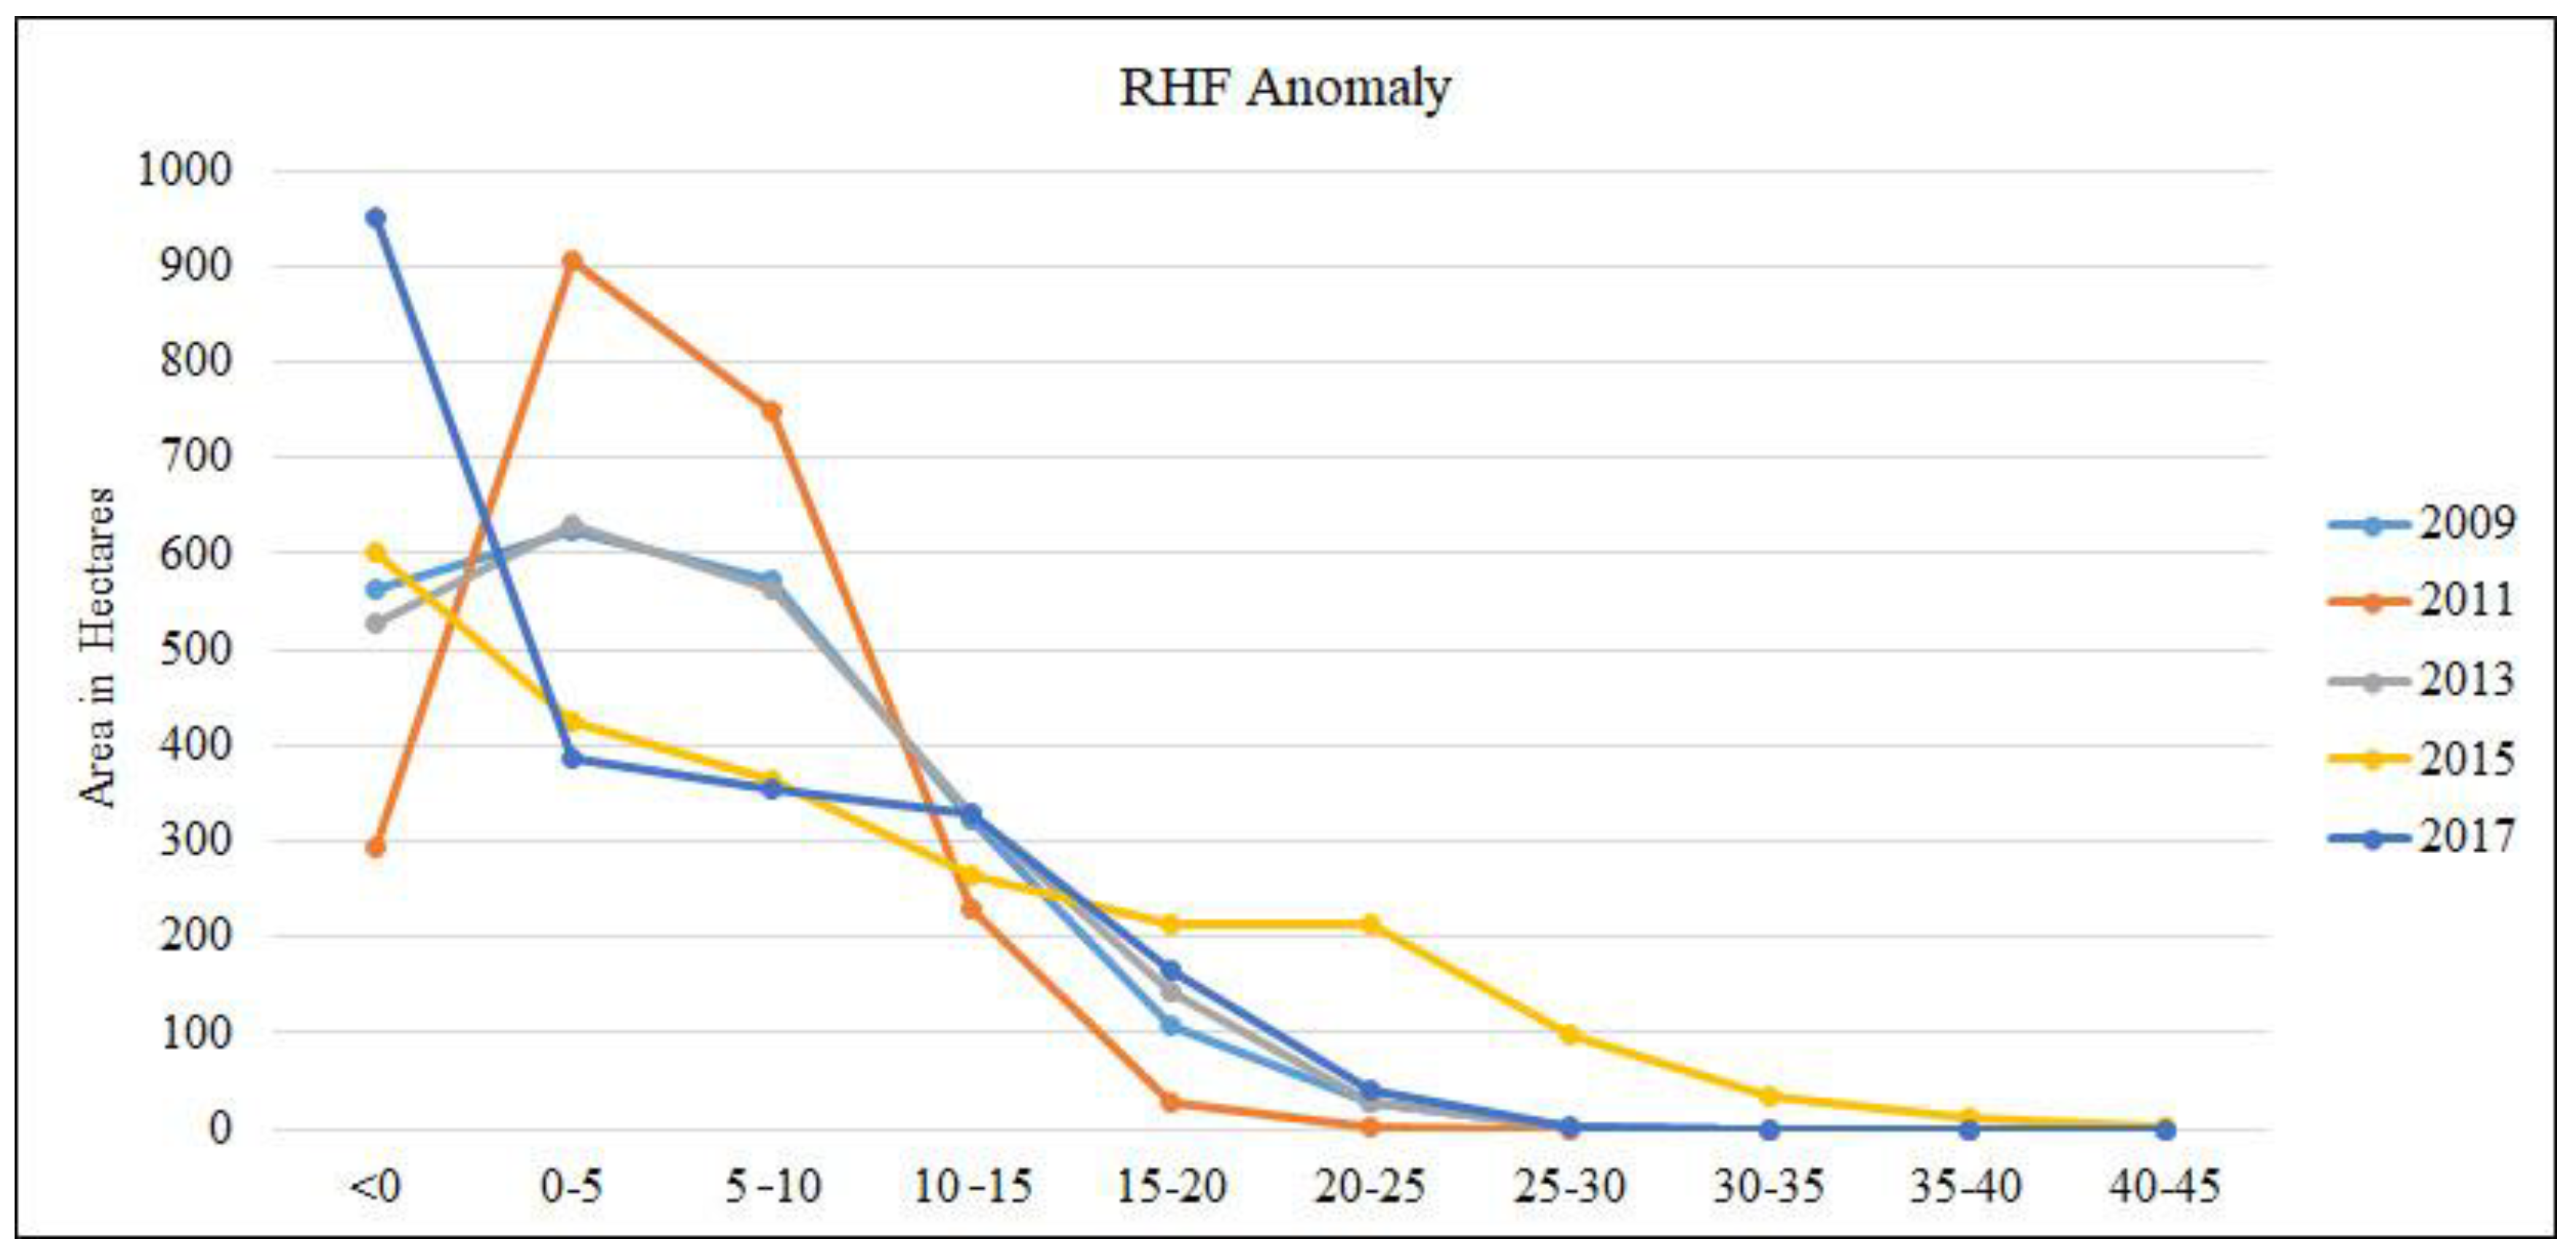
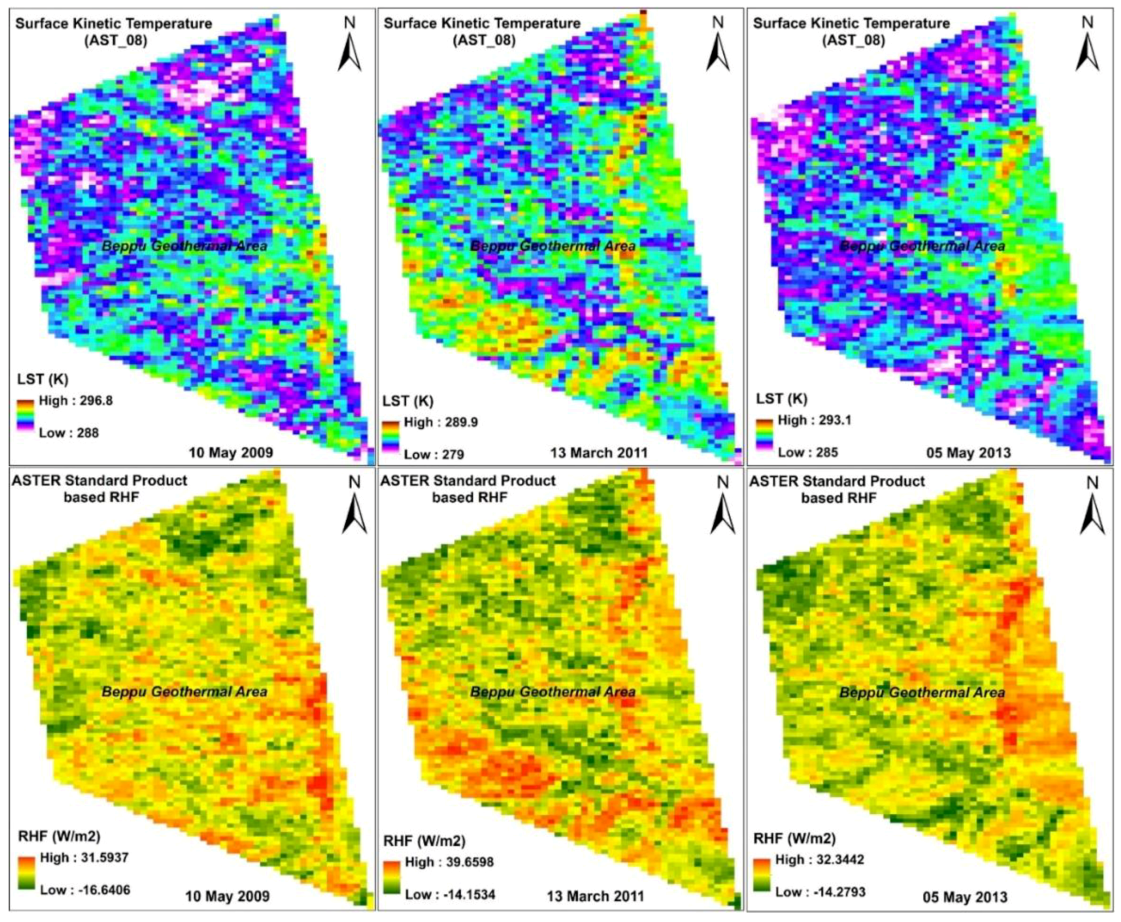
4.2. Beppu Geothermal Area

The Beppu thermal area covers almost all of Beppu city. A false color composite map of the Beppu thermal area shows vegetation as red, urban areas as bluish green, and water bodies as blue for ASTER and Landsat OLI images from 2009 to 2017 (Figure 11). Spectral emissivity is an important component to be considered for heat flux estimation in any volcanic or thermal area. We estimated the spectral emissivity of the Beppu thermal area using the NDVI threshold method for respective thermal bands of ASTER and Landsat 8. NDVI is derived using the red and near-infrared bands of daytime images of ASTER and Landsat OLI images of the Beppu thermal area from 2009 to 2017 (Figure 12). NDVI values range from −1 to +1. A higher positive NDVI indicates healthy vegetation, and negative or close to zero indicates bare or urban area or mixed land. We obtained an average spectral emissivity of the Beppu geothermal area from 0.93 to 0.99 (Figure 13). The higher value indicates healthy vegetation and the lower value indicates bare or urban or mixed land of the Beppu geothermal area.
Land surface temperature was estimated after applying the split-window algorithm with the nighttime thermal infrared data of ASTER and Landsat 8 TIRS images of the Beppu geothermal area from 2009 to 2017 (Figure 14). The highest LST without ambient temperature was about 8 °C in 2015. Higher thermal anomalies were obtained along the southeastern coast of the Beppu thermal area. Radiative heat flux was estimated using the derived land surface temperature of ASTER and Landsat 8 thermal infrared bands after applying the Stefan–Boltzmann law of heat flow. The highest maximum RHF was about 45 W/m2 in 2015 and lowest maximum was about 25 W/m2 in 2011. The range of RHF was 25–30 W/m2 from 2009 to 2017, except in 2015, when it was about 45 W/m2 (Table 4). Higher RHF anomaly was observed in the southeastern part of the Beppu thermal area (Figure 15). Total radiative heat loss was estimated after summation of all positive RHF pixels. The highest RHL was about 197 MW in 2015 and the lowest about 114 MW in 2017. Otherwise, total RHL was about 127, 115, and 134 MW in 2009, 2011, and 2013, respectively (Table 4). The highest total heat loss or heat discharge rate was in 2015, about 1279 MW, and the lowest was about 739 MW in 2017 (Figure 16). Dividing the RHF anomaly areas into three parts, high, moderate, and low, we found that the high heat loss anomaly area converged to maximum in 2015, the moderate anomaly area in 2017, and the lower RHF anomaly area in 2011 (Figure 17).

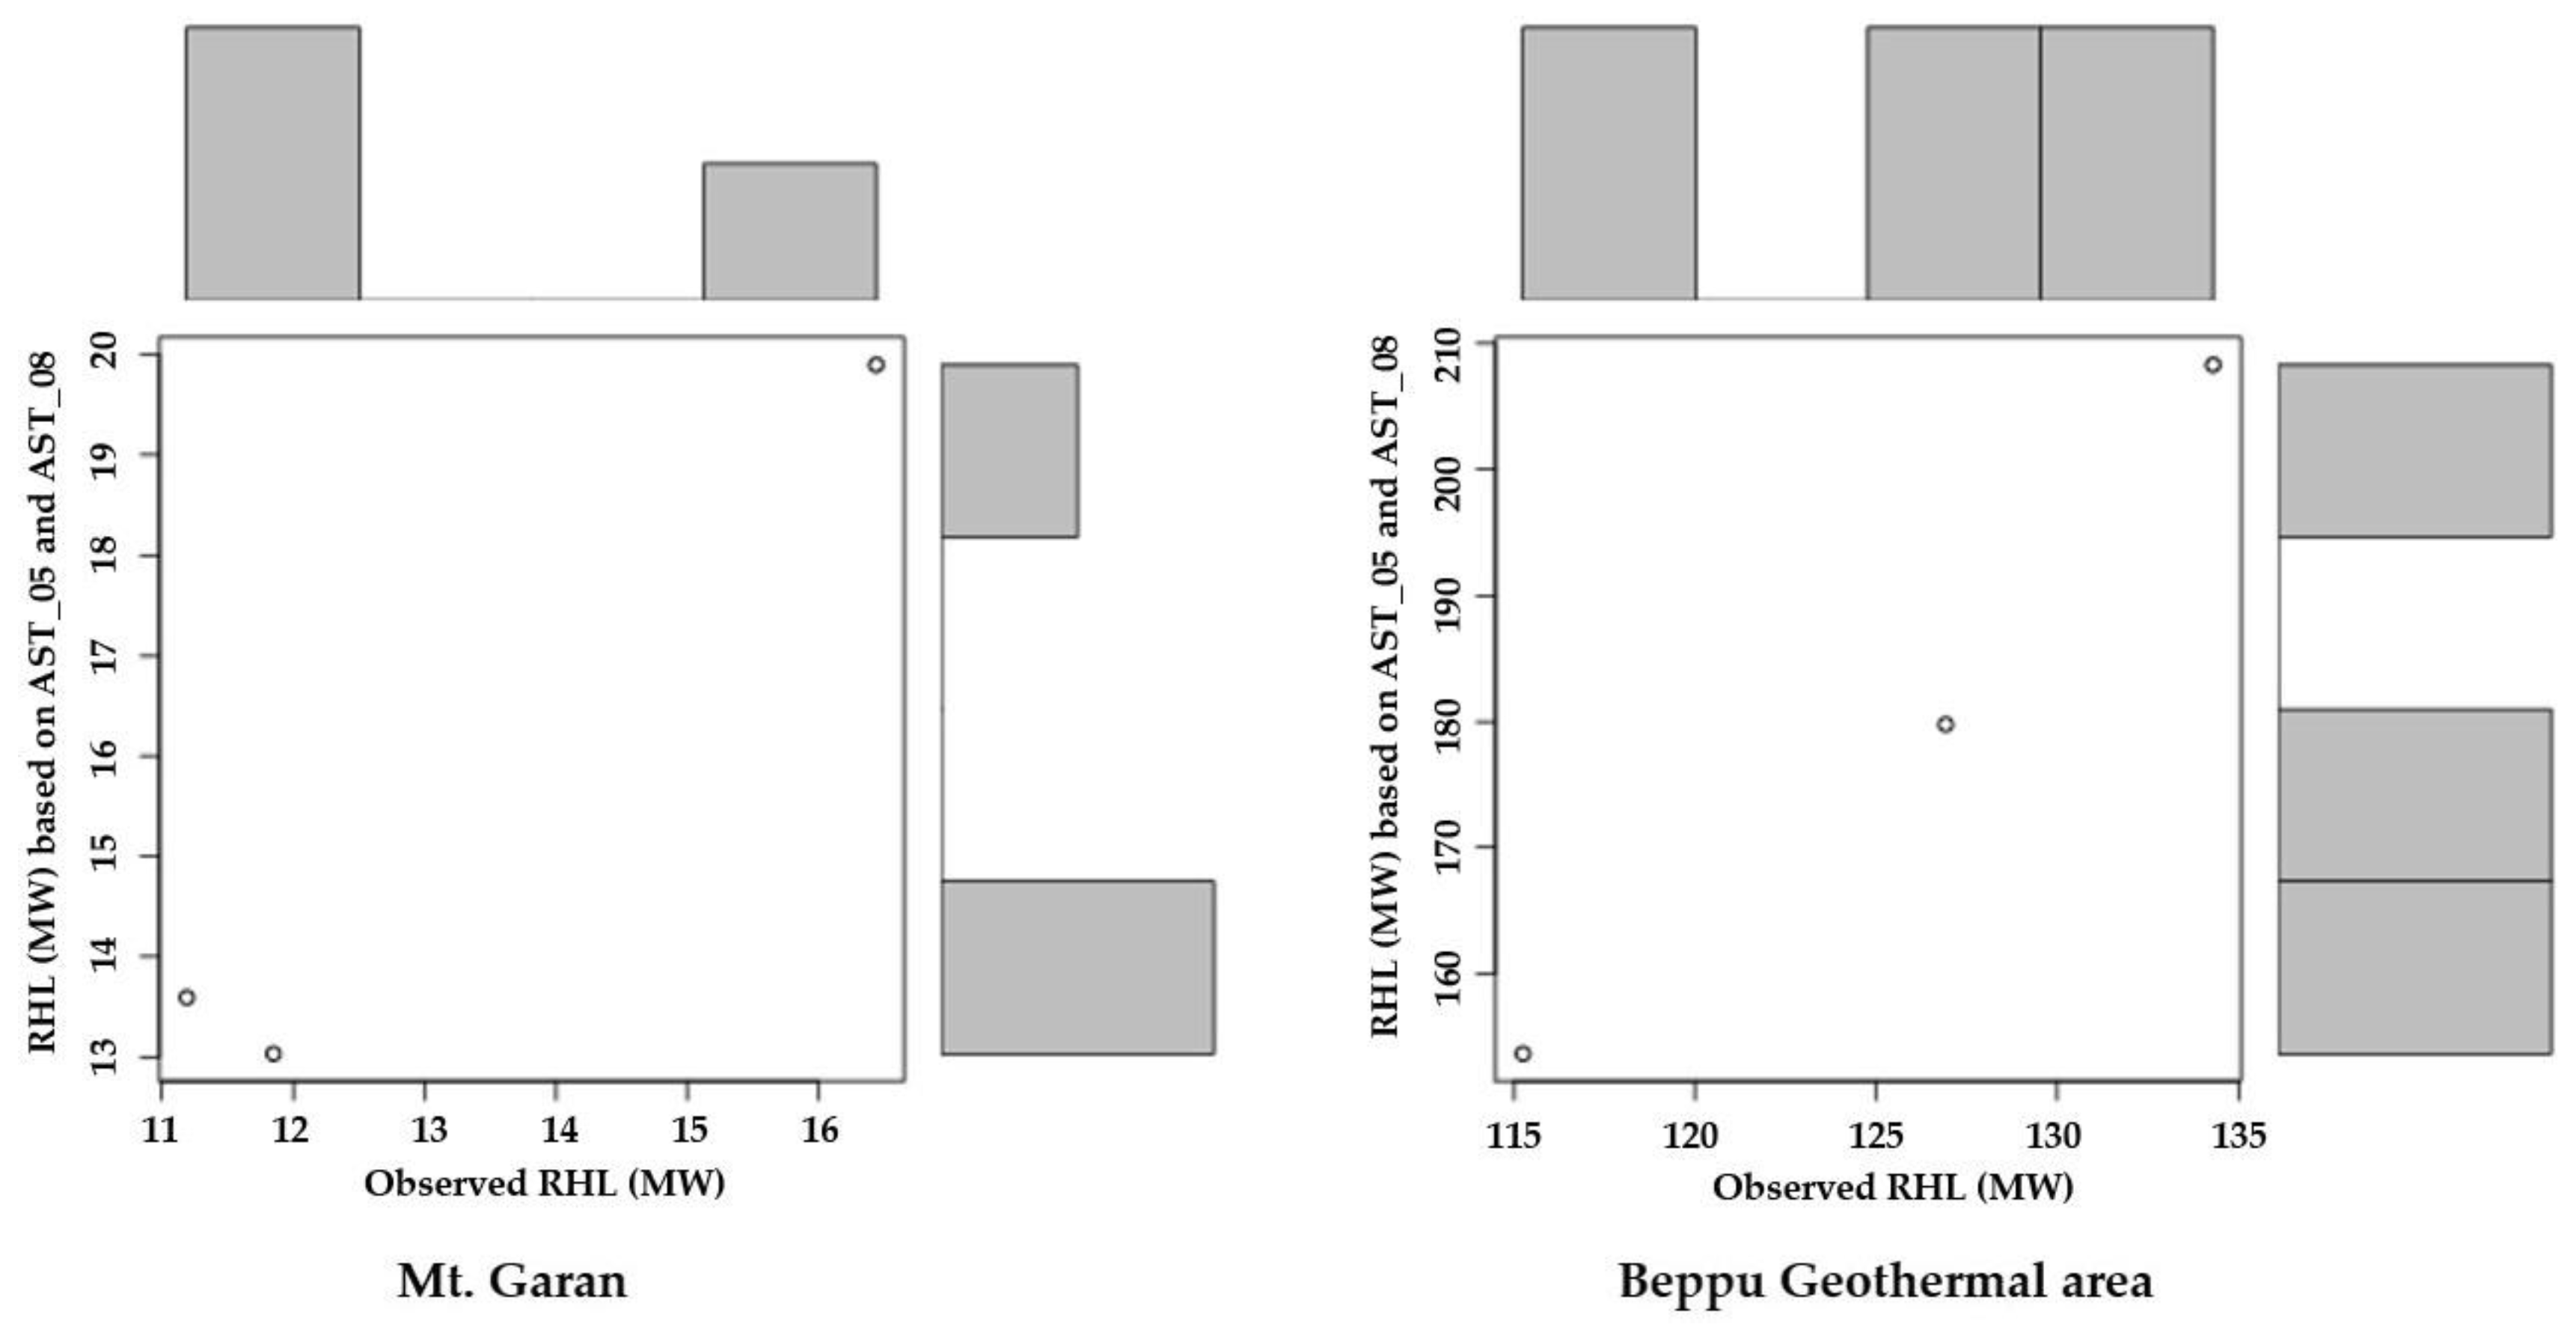
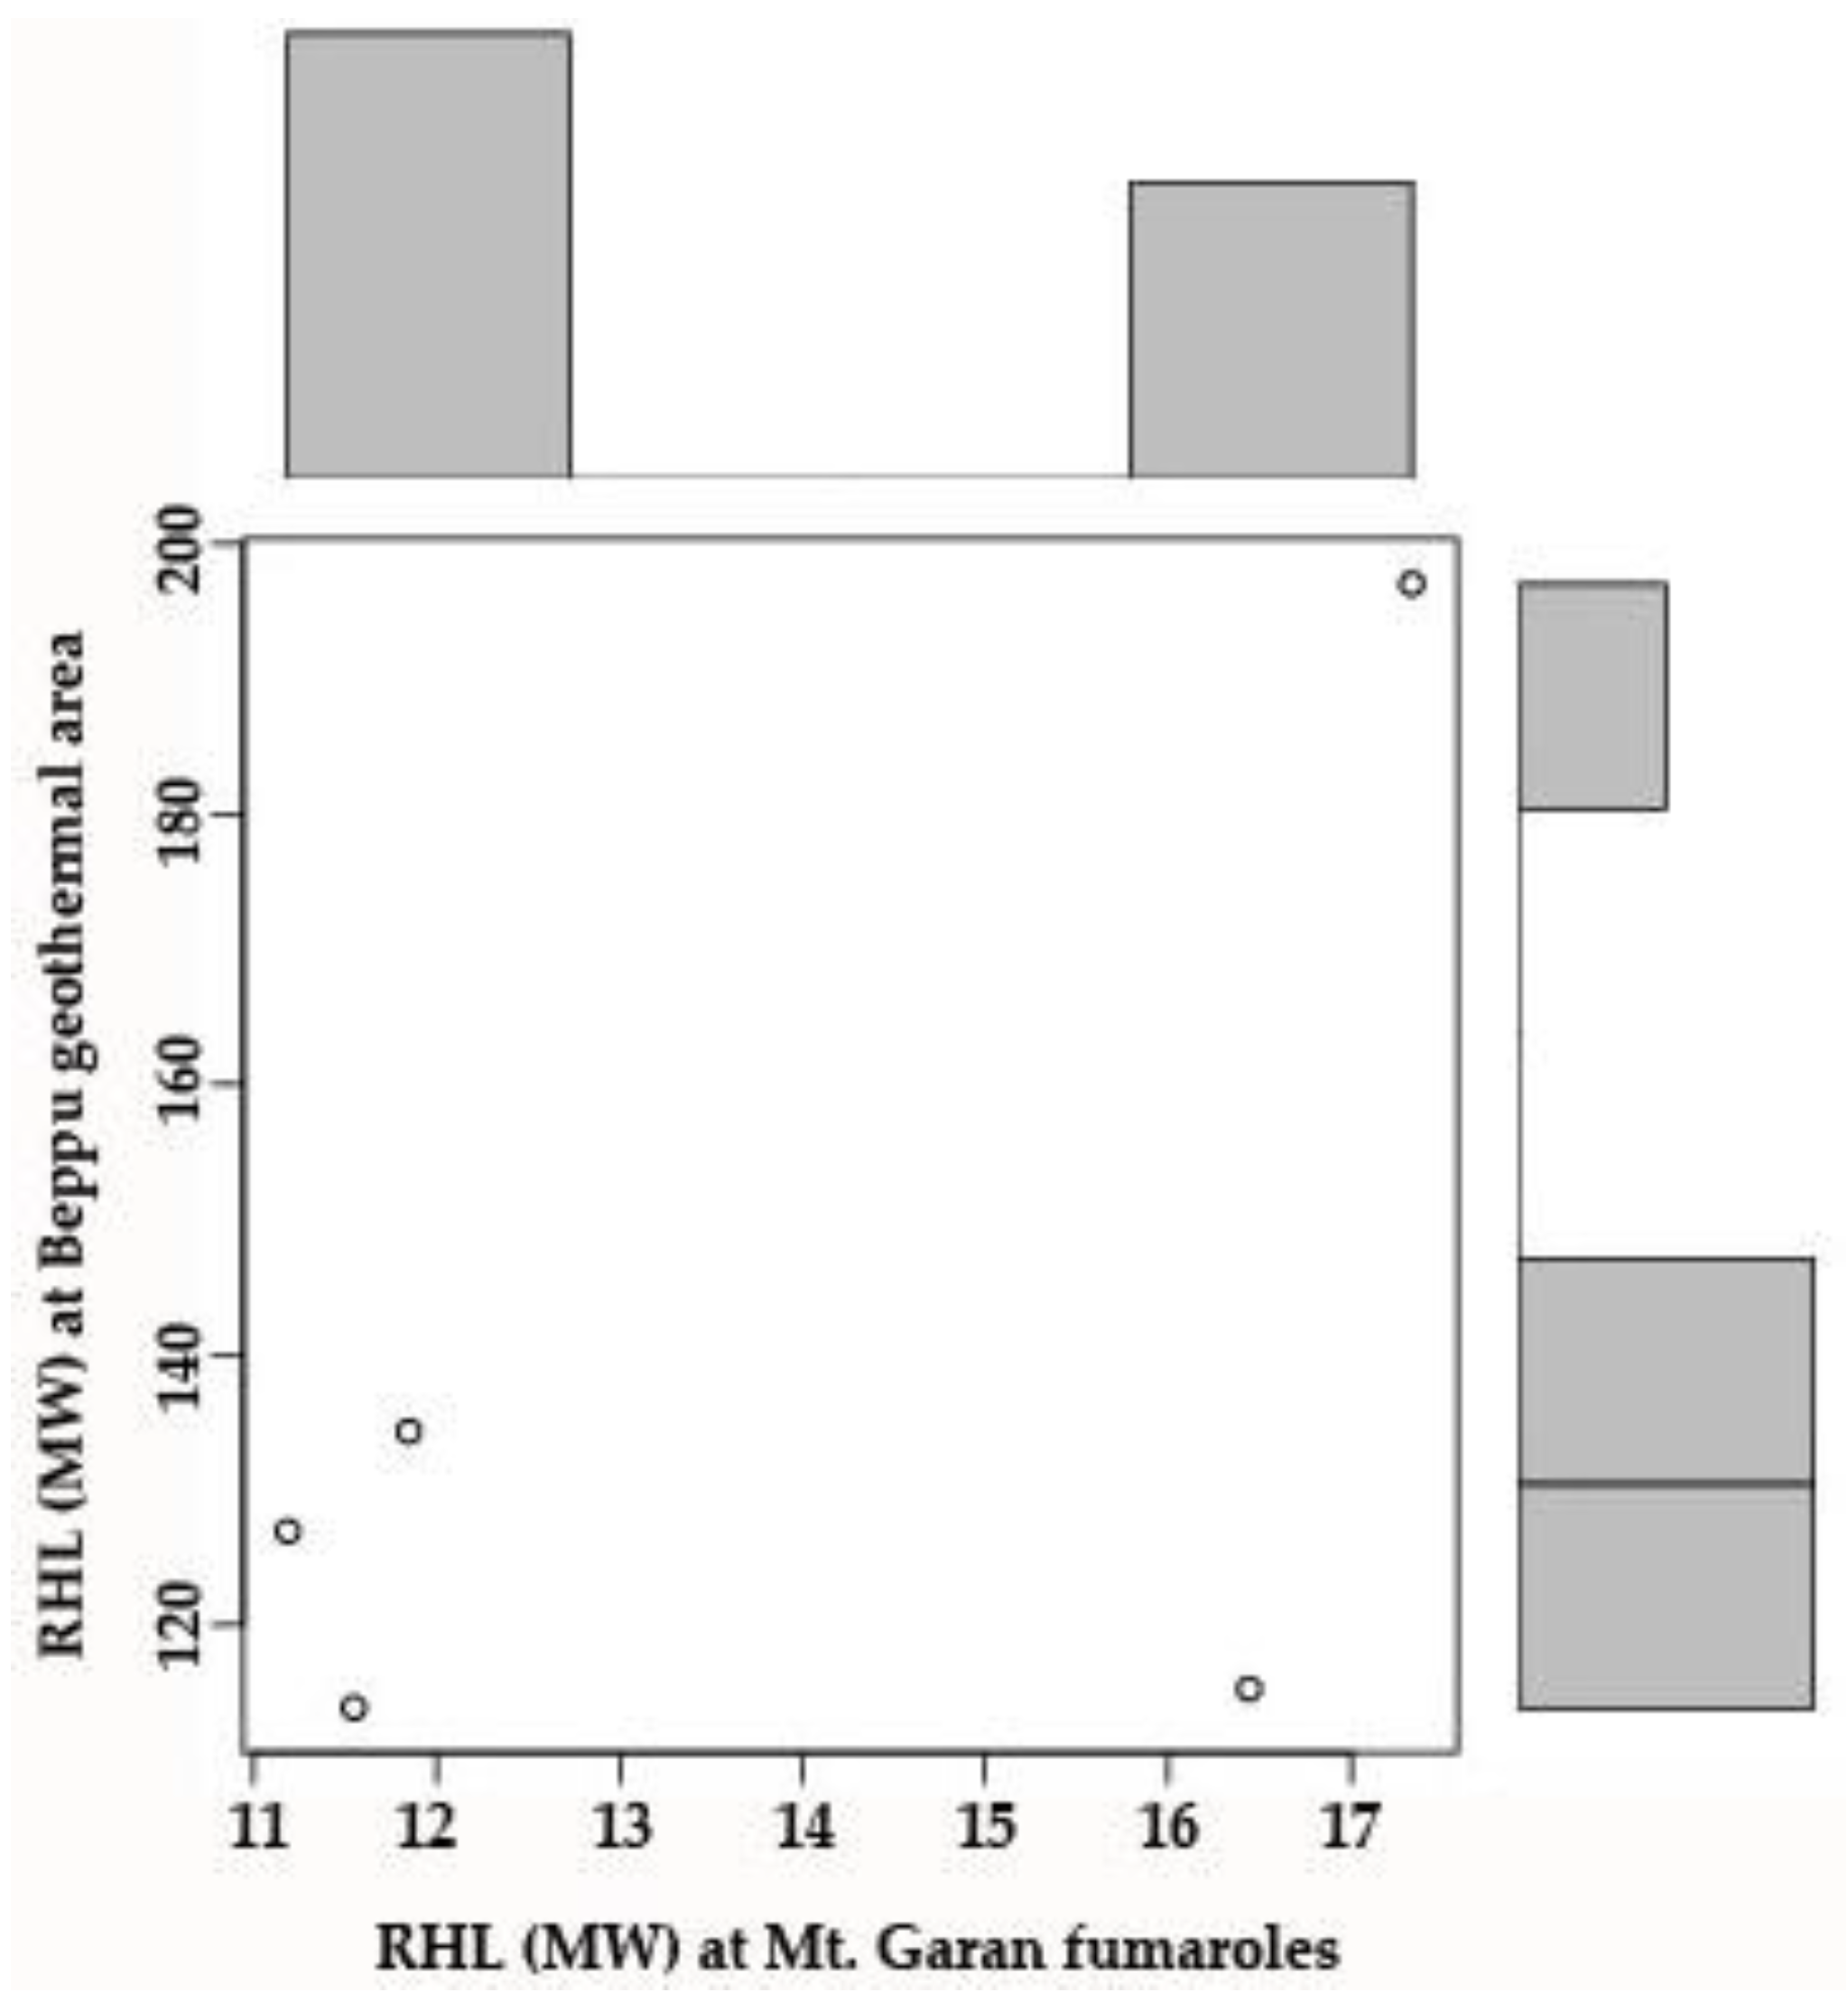
4.3. Validation of the Results

ASTER standard products were used to validate in this study, just for the results of LST and RHL, retrieved using ASTER images for both study areas. We used nighttime high level products of emissivity (AST_05) and surface kinetic temperature (AST_08) to retrieve LST and RHF for the year of 2009, 2011 and 2013 to validate the results of observed heat loss from both Mt. Garan fumaroles and Beppu geothermal area in this study (Figure 18). Although the anomalies of LST and RHF are not closely matched between the results of observed and standard products of ASTER (may be due to the resolution difference 15 and 90 m respectively for observed and standard), but the total RHL showed similar pattern and close to the observed total RHL of the study areas (Figure 18, Figure 19 and Figure 20) (Table 5). We analyzed the Pearson correlation coefficient between total RHL based on ASTER standard products and observed total RHL, and obtained strong correlation (0.9822 for Mt. Garan and 0.9881 for the Beppu geothermal area) between them for the study areas (Figure 21; Table 5). The variation between total RHL based on ASTER standard products and observed total RHL may be related with the atmospheric profile and altitude differences. We used the local Oita meteorological station’s data (AMeDAS, used to acquire atmospheric data in every 10 min) with the same time of the image acquisition in our study, but the meteorological station is located about 15–20 km southeast of the study area. We were also adjusted the altitude variation of atmospheric ambient temperature for the whole Beppu area using a single altitude (284 m as average) for the whole Beppu region. Hence, the total RHLs are varied more between observed and ASTER standard product’s base RHL in the Beppu geothermal area (large area with varied topography) than Mt. Garan fumaroles (small area and more or less uniform topography) (Figure 20).

5. Discussion

The results of this research could be more effective to monitor the thermal activity of the Mt. Garan fumaroles and Beppu geothermal area if it was possible to obtain same sensor of satellite nighttime images of each year during the study period. We did not consider the daytime thermal infrared data due to the solar insolation as well as reduce or remove the solar effect to monitor the geothermal activity of the study area. To get simultaneous images of both sensors of any specific year could be another finding for sensor variations of heat loss from the study area but it was not possible to acquire like these images for a year. We were just able to get good quality and cloud-free ASTER images only for the year of 2009, 2011 and 2013, and Landsat images for the year of 2015, 2017. Although the resolution of thermal infrared data was 90 m for ASTER and 100 m for Landsat 8 TIRS, but we were able to acquire with same resolution of the thermal infrared data as 30 m (resampled) from the USGS archive in case of both sensors.
It is well known that LST is the important component for geothermal heat loss calculation that can be retrieve using the thermal infrared data of various sensors such as Landsat, ASTER among others. There are several types of algorithm nowadays to retrieve LST, among them, the temperature and emissivity separation (TES) and split-window (SW) algorithm are widely used to retrieve LST using ASTER thermal infrared image. It is recognized that the TES algorithm is designed for the ASTER image to calculate LST and emissivity using a maximum-minimum difference (MMD) module, which is an empirical relationship between the minimum emissivity and the difference between maximum and minimum emissivity, to make the number of observe equations equal to that of the unknown variables [33]. This method can estimate LST and emissivity only with atmospheric-corrected data of TIR without any prior knowledge of emissivity [33]. The accuracy of atmospheric correction is an important factor for the efficiency of the TES method, and sometimes, the results of this algorithm are imprecise for low emissivity land cover such as dense vegetation, water and snow [33,34]. On the other hand, the SW algorithm can estimate LST by removing atmospheric effects from the linear or nonlinear combination of the brightness temperature of the nearby bands (i.e., like 11 and 12 μm in wavelength) and therefore, reduces the requirements of detail atmospheric data [33]. The SW method is used widely nowadays, because of its simplicity, efficiency and insensitive to atmospheric uncertainty from a variety of thermal infrared sensors such as Landsat, ASTER among others [13,14,30]. The only prior requisite of SW method is the emissivity of land cover in advance of the study area. This is the motivation to use the SW method for LST estimation in this study using ASTER thermal infrared data. As the land surface emissivity is one of the key component to retrieve LST from remote sensing data. There are various efficient methods to retrieve land surface emissivity from normalized differential vegetation index (NDVI) values [35,36]. The NDVI threshold based emissivity method is very famous and was used in this study to retrieve emissivity for soil, vegetation and water bodies as 15 m in resolution for ASTER and 30 m resolution for Landsat 8 images with efficiently [13,14,28,36], contrasting the TES method used to retrieve emissivity of 90 m in resolution. In case of Landsat 8 OLI/TIRS sensor, it is documented that the TIRS suffered from stray light problem since launch of this satellite [37]. A developed algorithm was applied to correct the stray light problem and supplied the corrected TIRS data from February 2017, but it was not recommended to apply the TIRS band 11 for split-window algorithm [37]. With this in mind, according to our intention to use same method for both ASTER and Landsat 8 TIRS sensor, we applied the SW algorithm using two thermal bands of both sensors in this study from 2009 to 2017.
Geothermal heat loss monitored using nighttime ASTER and Landsat 8 TIRS data from 2009 to 2017 shows that the highest total heat loss occurred in 2015 and the lowest in 2017, although the highest maximum pixel RHF was recorded in 2015 for both the Beppu geothermal area and Mt. Garan fumaroles, and the lowest in 2011 for the Beppu geothermal area and in 2017 for the Mt. Garan fumaroles (Table 3 and Table 4; Figure 9 and Figure 16). Thus, thermal activity increased from 2009 to 2015 in both the Beppu thermal area and Mt. Garan fumaroles and declined afterward up to 2017. We obtained a moderate relationship coefficient (0.59) between the observed total RHL of Mt. Garan fumaroles and Beppu geothermal area using the Pearson correlation coefficient analysis free software of [38] (Figure 22). Spatial analysis of RHF showed that maximum values of higher and middle ranges of RHF were observed in 2015, and lower ranges in 2017 in the Mt. Garan fumaroles (Figure 10). On the other hand, the high heat loss anomaly area converged to maximum in 2015, moderate anomaly area in 2017, and lower RHF anomaly area in 2011 in the Beppu geothermal area (Figure 17). Nighttime image analysis showed that the highest thermal anomaly was associated with the Beppu thermal area, mostly along southeast coastal region, although part of the northern region around the Chinoike Jigoku showed high value, with maximum recorded LST without ambient temperature about 7 °C in 2015 and lowest about 5 °C in 2017 (Figure 14). On the other hand, thermal anomaly showed the highest maximum LST of about 11 °C in 2011 without ambient temperature and lowest of about 7 °C in 2017 within the fumarolic area of Mt. Garan (Figure 7). We obtained spectral emissivity in the range of 0.93 to 0.988 in the Beppu geothermal area, and from 0.94 to 0.988 in the Mt. Garan fumaroles area, where the vegetation showed higher values and bare ground or water bodies showed lower values generally (Table 3 and Table 4). Because of the sensors and methods variation between ASTER and Landsat 8, the results of NDVI and emissivity may vary little bit for the land covers of the study area. Understanding the relationship between RHF and LST against NDVI (or land cover), we observed that the NDVI values less than 0.5 (mixed or bare land) were associated with highest LST and RHF of the Beppu geothermal area and Mt. Garan fumaroles. The study indicates that the Beppu geothermal area is closely connected with the Mt. Garan fumaroles area on the basis of the trend of total heat loss and thermal anomalies from 2009 to 2017.
There are some limitations of this study. A significant limitation of this research is the lack of ground validation due to the inaccessibility of the fumaroles, but we validated the results of ASTER image retrieved total RHL for both of our study regions using the ASTER standard products (AST_05, emissivity and AST_08, surface kinetic temperature) retrieve total RHL in this study. We were also obtained similar results of RHL (11–17 MW) in a recent study of airborne thermal infrared data based heat loss (20 MW) from the Mt. Garan fumaroles in 1987 [12]. Another limitation was that we did not consider urban heat loss in this study for the city in the Beppu geothermal area, although we used nighttime satellite thermal infrared data to reduce the effect of urbanization and solar insolation. With all these limitations, as a first study for thermal activity monitoring using satellite images, we recommend that the applied method would be worthy for long term monitoring of the thermal activity using continuous satellite nighttime thermal infrared data for the sustainability of the resources and utilization within the Mt. Garan fumaroles and the Beppu geothermal area.

6. Conclusions

Our study of nighttime ASTER and Landsat 8 TIRS data indicates that thermal activity in the Beppu geothermal region underwent both increased and decreased heat loss from 2009 to 2017. Total radiative heat loss was about 11, 16, 12, 17, and 12 MW in 2009, 2011, 2013, 2015 and 2017, respectively, in the Mt. Garan fumaroles, and about 127, 115, 134, 197 and 114 MW in 2009, 2011, 2013, 2015 and 2017, respectively, in the Beppu geothermal area. Heat loss increased from 2009 to 2015 and then declined in 2017 overall in both the Mt. Garan fumaroles and the Beppu geothermal area. The thermal anomaly was highest in 2011 and lowest in 2017 within the Mt. Garan fumaroles. Hence, a higher anomaly of radiative heat flux was obtained in 2015 and lowest in 2017 in the Mt. Garan fumarolic area. On the other hand, we obtained the highest LST and higher thermal anomalies in 2015, mostly within the southeastern coastal area and in parts of the northwestern Beppu geothermal area. We also obtained the highest maximum RHF in 2015 and lowest maximum RHF in 2011 in the Beppu geothermal area. The areas of higher range of RHF values were observed higher in 2015 both in the Mt. Garan fumaroles and Beppu geothermal area. Finally, the results suggest that the Beppu geothermal area has a close connection with the Mt. Garan fumaroles in terms of heat loss as well as thermal anomalies in this study. The study infers that nighttime multisource satellite thermal infrared data were applied successfully and may be the best option for spatial thermal status monitoring of the Beppu geothermal region in the future based on free data availability, effectivity, and less analysis time.

Author Contributions

This research was carried out with the collaboration of all authors. M.B.M. was involved in conceptualizing the problem, gathering data, analyzing satellite images, and writing the manuscript. Y.F. and J.N. were mostly involved with addressing the issue, helped a lot with data collection, fund collection, and writing, and checked the English language of the manuscript.

Funding

This research was funded by the Grant-in-Aid for JSPS fellows research fund (KAKENHI) (grant no. JP16F16081).

Acknowledgments

We acknowledge the Grant-in-Aid for JSPS fellows research fund (KAKENHI) for supporting this research (grant no. JP16F16081). The first author is an overseas researcher under a postdoctoral fellowship of the Japan Society for the Promotion of Science (P16081). We thank Ilene Roizman from MDPI English editing services for editing a draft of this manuscript. The authors gratefully thank the editor and reviewers for upgrading the manuscript. We also acknowledge the USGS archives for supporting the satellite imagery for this research free of cost. Special thanks go to the Japan Meteorological Agency for providing the necessary weather data for this research.

Conflicts of Interest

The authors declare no conflicts of interest.

References

  1. Furukawa, Y. Temperature- and fluid-controlled seismicity in the Beppu graben, Kyushu, Japan. J. Volcanol. Geotherm. Res. 2009, 181, 61–66. [Google Scholar] [CrossRef]
  2. Komatsu, G.; Takemura, K.; Goto, K.; Shibuya, H.; Yamagishi, A.; Sekine, Y.; Ishimaru, R. Beppu Hotspring, Japan, As a terrestrial analog for ancient hydrothermal systems on Mars. In Proceedings of the 43rd Lunar and Planetary Science Conference, The Woodlands, TX, USA, 19–23 March 2012; p. 1096. [Google Scholar]
  3. Yusa, Y.; Ohsawa, S.; Kitaoka, K. Long-term changes associated with exploitation of the Beppu hydrothermal system, Japan. Geothermics 2000, 29, 609–625. [Google Scholar] [CrossRef]
  4. Gianelli, G.; Yusa, Y.; Battaglia, S.; Takemura, K. Water-Rock Interaction in a Zone of Lateral Flow: A Natural Example from the Active Geothermal Field and Gold-Mineralized Zone of Beppu (Kyushu Island, Japan). Mineral. Petrol. 1992, 45, 247–259. [Google Scholar] [CrossRef]
  5. Allis, R.G.; Yusa, Y. Fluid flow processes in the Beppu geothermal system, Japan. Geothermics 1989, 18, 743–759. [Google Scholar] [CrossRef]
  6. Nishijima, J.; Naritomi, K. Interpretation of gravity data to delineate undergroundstructure in the Beppu geothermal field, central Kyushu, Japan. J. Hydrol. Reg. Stud. 2017, 11, 84–95. [Google Scholar] [CrossRef]
  7. Yusa, Y.; Ohsawa, S. Age of the Beppu hydrothermal system, Japan. In Proceedings of the World Geothermal Congress, Kyushu-Tohoku, Japan, 28 May–10 June 2000; pp. 305–308. [Google Scholar]
  8. Sturchio, N.C.; Ohsawa, S.; Sano, Y.; Arehart, G.; Kitaoka, K.; Yusa, Y. Geochemical characteristics of the Yufuin outflow plume, Beppu hydrothermal system, Japan. Geothermics 1996, 25, 2015–2230. [Google Scholar] [CrossRef]
  9. Oue, K.; Ohsawa, S.; Yusa, Y. Change in color of the hot spring deposits at the Chinoike-Jigoku hot pool, Beppu geothermal field. Geothermics 2002, 31, 361–380. [Google Scholar] [CrossRef]
  10. Sekioka, M. A Micrometeorological Estimation of the Water and the Heat Discharged in a Hot Pool. Arch. Met. Geophys. Bioklimatol. Ser. B 1977, 25, 283–290. [Google Scholar] [CrossRef]
  11. Kitaoka, K. Water circulation rates in a geothermal field: A study of tritium in the Beppu hydrothermal system, Japan. Geothermics 1990, 19, 515–539. [Google Scholar] [CrossRef]
  12. Yuhara, K.; Ehara, S.; Hara, M.; Fujimitsu, Y. Infra-red imageries of volcanic and geothermal areas in Kyushu by helicopter. J. Geotherm. Res. Soc. Jpn. 1987, 9, 307–355. (In Japanese) [Google Scholar]
  13. Mia, M.B.; Fujimitsu, Y.; Nishijima, J. Thermal Activity Monitoring of an Active Volcano Using Landsat 8/OLI-TIRS Sensor Images: A Case Study at the Aso Volcanic Area in Southwest Japan. Geosciences 2017, 7, 118. [Google Scholar] [CrossRef]
  14. Mia, M.B.; Nishijima, J.; Fujimitsu, Y. Exploration and monitoring geothermal activity using Landsat ETM + images-A case study at Aso volcanic area in Japan. J. Volcanol. Geotherm. Res. 2014, 275, 14–21. [Google Scholar] [CrossRef]
  15. Eskandari, A.; Rosa, R.D.; Amini, S. Remote sensing of Damavand volcano (Iran) using Landsat imagery: Implications for the volcano dynamics. J. Volcanol. Geotherm. Res. 2015, 306, 41–57. [Google Scholar] [CrossRef]
  16. Mia, M.B.; Bromley, C.J.; Fujimitsu, Y. Monitoring heat losses using Landsat ETM + thermal infrared data: A case study in Unzen geothermal field, Kyushu, Japan. Pure Appl. Geophys. 2013, 170, 2263–2271. [Google Scholar] [CrossRef]
  17. Mia, M.B.; Fujimitsu, Y. Mapping hydrothermal altered deposits using Landsat 7 ETM + image in and around Kuju volcano, Kyushu, Japan. J. Earth Syst. Sci. 2012, 121, 1049–1057. [Google Scholar] [CrossRef]
  18. Loveland, T.R.; Irons, J.R. Landsat 8: The plans, the reality, and the legacy. Remote Sens. Environ. 2016, 185, 1–6. [Google Scholar] [CrossRef]
  19. Abrams, M.; Tsu, H.; Glynn Hulley, G.; Iwao, K.; Pieri, D.; Cudahy, T.; Kargel, J. The Advanced Spaceborne Thermal Emission and Reflection Radiometer (ASTER) after fifteen years: Review of global products. Int. J. Appl. Earth Obs. Geoinf. 2015, 38, 292–301. [Google Scholar] [CrossRef]
  20. Kato, S.; Kouyama, T.; Nakamura, R.; Matsunaga, T.; Fukuhara, T. Simultaneous retrieval of temperature and area according to sub-pixel hotspots from nighttime Landsat 8 OLI data. Remote Sens. Environ. 2018, 204, 276–286. [Google Scholar] [CrossRef]
  21. Blackett, M. Early Analysis of Landsat-8 Thermal Infrared Sensor Imagery of Volcanic Activity. Remote Sens. 2014, 6, 2282–2295. [Google Scholar] [CrossRef] [Green Version]
  22. Pieri, D.; Abrams, M. ASTER watches the world’s volcanoes: A new paradigm for volcanological observations from orbit. J. Volcanol. Geotherm. Res. 2004, 135, 13–28. [Google Scholar] [CrossRef]
  23. Itoh, Y.; Kusumoto, S.; Takemura, K. Evolutionary process of Beppu Bay in central Kyushu, Japan: A quantitative study of the basin-forming process controlled by plate convergence modes. Earth Planets Space 2014, 66, 1–14. [Google Scholar] [CrossRef]
  24. Kamata, H. Volcanic and structural history of the Hohi volcanic zone, central Kyushu, Japan. Bull. Volcanol. 1989, 51, 315–332. [Google Scholar] [CrossRef]
  25. Hoshizumi, H.; Ono, K.; Mimura, K.; Noda, T. Geology of the Beppu district with geological sheet map of 1:50,000. Geol. Surv. Jpn. 1988, 131. (In Japanese with English abstract). [Google Scholar]
  26. Talay, T.A. Introduction to the Aerodynamics of Flight, NASA SP -367; National Aeronautics and Space Adminstration: Washington, DC, USA, 1975; pp. 6–9.
  27. Airbus. Getting to Grips with Aircraft Performance; Airbus Indusrie, Customer Services: Blagnac, France, 2000; pp. 11–16. [Google Scholar]
  28. Qin, Z.; Li, W.; Gao, M.; Zhang, H. An algorithm to retrieve land surface temperature from ASTER thermal band data for agricultural drought monitoring. In Proceeding of the SPIE Remote Sensing Conference, Stockholm, Sweden, 11–14 September 2006; pp. 63591F1–63591F8. [Google Scholar]
  29. Qin, Z.; Karnieli, A.; Berliner, P. A mono-window algorithm for retrieving land surface temperature fromLandsat TM data and its application to the Israel–Egypt border region. Int. J. Remote Sens. 2001, 22, 3719–3746. [Google Scholar] [CrossRef]
  30. Yu, X.; Guo, X.; Wu, Z. Land Surface Temperature Retrieval from Landsat 8 TIRS—Comparison between Radiative Transfer Equation-Based Method, Split Window Algorithm and Single Channel Method. Remote Sens. 2014, 6, 9829–9852. [Google Scholar] [CrossRef] [Green Version]
  31. Bromley, C.J.; Manen, S.M.; Mannington, W. Heat Flux from Steaming Ground: Reducing Uncertainties. In Proceedings of the 36th Workshop on Geothermal Reservoir Engineering, Stanford University, Stanford, CA, USA, 31 January–2 February 2011. SGP-TR-191. [Google Scholar]
  32. Mia, M.B.; Bromley, C.J.; Fujimitsu, Y. Monitoring heat flux using Landsat TM/ETM + thermal infrared data-A case study at Karapiti (‘Crater of the Moon’) thermal area, New Zealand. J. Volcanol. Geotherm. Res. 2012, 235–236, 1–10. [Google Scholar] [CrossRef]
  33. Ren, H.; Ye, X.; Liu, R.; Dong, J.; Qin, Q. Improving Land Surface Temperature and Emissivity Retrieval from the Chinese Gaofen-5 Satellite Using a Hybrid Algorithm. IEEE Trans. Geosci. Remote Sens. 2018, 56, 1080–1090. [Google Scholar] [CrossRef]
  34. Gillespie, A.; Rokugawa, S.; Matsunaga, T.; Cothern, J.S.; Hook, S.; Kahle, A.B. A temperature and emissivity separation algorithm for Advanced Spaceborne Thermal Emission and Reflection Radiometer (ASTER) images. IEEE Trans. Geosci. Remote Sens. 1998, 36, 1113–1126. [Google Scholar] [CrossRef]
  35. Van de Griend, A.A.; Owe, M. On the Relationship between Thermal Emissivity and the Normalized Difference Vegetation Index for Natural Surfaces. Int. J. Remote Sens. 1993, 14, 1119–1131. [Google Scholar] [CrossRef]
  36. Sobrino, J.A.; Jimenez-Munoz, J.C.; Soria, G.; Romaguera, M.; Guanter, L.; Moreno, J.; Plaza, A.; Martincz, P. Land Surface Emissivity Retrieval from Different VNIR and TIR Sensors. IEEE Trans. Geosci. Remote Sens. 2008, 46, 316–327. [Google Scholar] [CrossRef]
  37. Gerace, A.; Montanaro, M. Derivation and validation of the stray light correction algorithm for the thermal infrared sensor onboard Landsat 8. Remote Sens. Environ. 2017, 191, 246–257. [Google Scholar] [CrossRef]
  38. Wessa, P. Pearson Correlation (v1.0.13) in Free Statistics Software (v1.2.1). Office for Research Development and Education, 2017. Available online: https://www.wessa.net/rwasp_correlation.wasp/ (accessed on 28 July 2018).
Figure 1. Location map of the study. The Beppu geothermal area is shown using a polygon and Mt. Garan fumaroles are shown with a square. Contours show elevation in meters above mean sea level, prepared using the values of shuttle radar topography mission digital elevation model. The Beppu geothermal area is about 22 km2 and Mt. Garan fumaroles are about 0.7 km2. The Oita meteorological station (Automated Meteorological Data Acquisition System, AMeDAS) is shown with a star in the index map of Kyushu Island, located at 33°14.1′ N and 131°37.1′ E.
Geosciences 08 00306 g001
Figure 2. Geological map of the study area (modified after [6]).
Geosciences 08 00306 g002
Figure 3. Satellite image processing flowchart of the study. Both day- and nighttime images from ASTER and Landsat 8 sensors were used to estimate spectral emissivity and land surface temperature using the various methods listed above. NIR, near-infrared; TIR, thermal infrared; NDVI, normalized differential vegetation index; RHF, radiative heat flux; HDR, heat discharge rate.
Geosciences 08 00306 g003
Figure 4. Top row: False color composite of red/green/blue (RGB) of NIR-visible bands of ASTER satellite images of the Mt. Garan fumarole area for 2009, 2011, and 2013. Bottom row: Band composite of RGB of NIR-visible bands of Landsat 8 OLI of the Mt. Garan fumaroles for 2015 and 2017.
Geosciences 08 00306 g004
Figure 5. Normalized differential vegetation index (NDVI) of the Mt. Garan fumaroles area from 2009 to 2017. Higher NDVI values indicate healthy vegetation and lower values indicate bare land.
Geosciences 08 00306 g005
Figure 6. Average emissivity of the land cover of the Garandake fumaroles area from 2009 to 2017.
Geosciences 08 00306 g006
Figure 7. Land surface temperature without ambient temperature of the Mt. Garan fumaroles area using a split-window algorithm derived from nighttime ASTER infrared data for 2009, 2011, and 2013 (top row), and derived from nighttime Landsat 8 TIRS data for 2015 and 2017 (bottom row).
Geosciences 08 00306 g007
Figure 8. Radiative heat flux maps of the Mt. Garan fumaroles, derived from nighttime ASTER thermal infrared data for 2009, 2011, and 2013 (top row), and from nighttime Landsat 8 TIRS data for 2015 and 2017 (bottom row).
Geosciences 08 00306 g008
Figure 9. Changes in total radiative heat loss and heat discharge rates from the Mt. Garan fumaroles from 2009 to 2017.
Geosciences 08 00306 g009
Figure 10. Areas of radiative heat loss anomaly of the Mt. Garan fumaroles from 2009 to 2017, divided naturally into high (above 30 W/m2), middle (10–30 W/m2), and low (less than 10 W/m2) ranges.
Geosciences 08 00306 g010
Figure 11. Top row: False color composite of RGB of NIR-visible bands of ASTER satellite images of the Beppu geothermal area for 2009, 2011, and 2013. Bottom row: Band composite of RGB of NIR-visible bands of Landsat 8 OLI of the Beppu geothermal area for 2015 and 2017.
Geosciences 08 00306 g011
Figure 12. Normalized differential vegetation index (NDVI) of the Beppu geothermal area from 2009 to 2017. Higher NDVI values indicate healthy vegetation and lower values indicate bare land or urban areas.
Geosciences 08 00306 g012
Figure 13. Average emissivity of the land cover of the Beppu geothermal area from 2009 to 2017.
Geosciences 08 00306 g013
Figure 14. Land surface temperature without ambient temperature of the Beppu geothermal area, derived from nighttime ASTER infrared data using split-window algorithm for 2009, 2011, and 2013 (top row), and derived from nighttime Landsat 8 TIRS data using split-window algorithm for 2015 and 2017 (bottom row).
Geosciences 08 00306 g014
Figure 15. Radiative heat flux maps of the Beppu geothermal area, derived from nighttime ASTER thermal infrared data for 2009, 2011, and 2013 (top row), and derived from nighttime Landsat 8 TIRS data for 2015 and 2017 (bottom row).
Geosciences 08 00306 g015
Figure 16. Changes in total radiative heat loss and heat discharge in the Beppu geothermal area from 2009 to 2017.
Geosciences 08 00306 g016
Figure 17. Areas of radiative heat loss anomaly in the Beppu geothermal area from 2009 to 2017, separated into high (above 20 W/m2), middle (5–20 W/m2), and low (less than 5 W/m2) ranges.
Geosciences 08 00306 g017
Figure 18. High level ASTER product of surface kinetic temperature (AST_08) of the Mt. Garan fumaroles from 2009 to 2013 (top row). RHFs are retrieved from the ASTER standard products of emissivity (AST_05) and surface kinetic temperature (AST_08) from 2009 to 2013 of the Mt. Garan fumaroles, shown in the bottom row.
Geosciences 08 00306 g018
Figure 19. High level ASTER product of surface kinetic temperature (AST_08) of the Beppu geothermal area from 2009 to 2013 are shown in the top row. RHFs are retrieved from the ASTER standard products of emissivity (AST_05) and surface kinetic temperature (AST_08) from 2009 to 2013 of the Beppu geothermal area, shown in the bottom row.
Geosciences 08 00306 g019
Figure 20. Comparison between observed and ASTER standard products base heat loss from the Mt. Garan fumaroles (upper) and Beppu geothermal area (lower).
Geosciences 08 00306 g020
Figure 21. Scatter plots and histogram between observed and ASTER standard products base heat loss from the Mt. Garan fumaroles (left) and Beppu geothermal area (right).
Geosciences 08 00306 g021
Figure 22. Scatter plots and histogram of RHL between Mt. Garan fumaroles and Beppu geothermal area.
Geosciences 08 00306 g022
Table 1. Specification of satellite images used in this study.
SensorDateDay/NightTime (h:min:s)Sun Elevation (Degree)Path/RowASTERLandsat 8 OLI/TIRS
ASTER12 May 2009Day11:05:5569.08112/37Used BandWavelength (μm)Used BandWavelength (μm)
10 May 2009Night22:19:33−32.02211/207
18 May 2011Day11:04:5069.997112/37Band 2-Red0.630–0.690Band 4-Red0.636–0.673
13 March 2011Night22:18:21−47.56211/207
7 May 2013Day11:05:1168.004112/37Band 3-Near Infrared0.760–0.860Band 5-Near Infrared0.851–0.879
5 May 2013Night22:18:50−33.12211/207
Landsat 8 OLI-TIRS5 May 2015Day10:46:2564.52112/37Band 13-Thermal Infrared10.250–10.950Band 10-Thermal Infrared10.60–11.19
26 May 2015Night22:06:17−27.80211/207
19 February 2017Day10:47:2739.58112/37Band 14-Thermal Infrared10.950–11.650Band 11-Thermal Infrared11.50–12.51
29 April 2017Night22:06:31−33.38211/207
Path/Row is the image acquisition system of the world by satellite as described for Landsat at: https://landsat.gsfc.nasa.gov/the-worldwide-reference-system/.
Table 2. Relationship between air temperature (T), saturation mix ratio (E), and air density (A) [30].
T (°C)454035302520151050−5−10
E (g·kg−1)66.3349.8137.2527.6920.4414.9510.837.765.53.842.521.63
A (kg·m−3)1.111.131.151.171.181.211.231.251.271.291.321.34
Table 3. Summary of heat loss at the Mt. Garan fumaroles from 2009 to 2017 based on ASTER and Landsat 8 TIRS images. Ambient temperature and relative humidity were recorded at Oita station (AMeDAS) and later adjusted for variation with altitude using the International Standard Atmospheric method after Talay (1975).
Mt. Garan Fumaroles
SensorDateDay/Night* Relative Humidity (%)* Altitude Adjusted Ambient Temperature (°C)TransmissivityEmissivityLST (°C) without AmbientRHF (W/m2)RHL (MW)HDR (MW)
B13/B10 **B14/B11 **MinMaxMinMaxMinMax
ASTER12 May 2009Day0.9450.979
10 May 2009Night5113.140.9230.879−1.099.85−5.5952.2711.1972.62
18 May 2011Day0.9470.979
13 March 2011Night773.340.9340.8980.0010.660.0051.4316.44106.70
7 May 2013Day0.9490.972
5 May 2013Night628.540.9280.8880.009.370.0047.7911.8576.91
Landsat 8 OLI-TIRS5 May 2015Day0.9380.988
26 May 2015Night5815.040.9030.857−0.649.80−3.4252.6017.33112.47
19 February 2017Day0.9560.988
29 April 2017Night4310.040.9400.9090.007.230.0037.6411.5574.96
* Data available through the Automated Meteorological Data Acquisition System (AMeDAS) in Japan. ** ASTER thermal infrared bands (bands 13 and 14) and Landsat 8 TIRS bands (bands 10 and 11). D, day; N, night; LST, land surface temperature; RHF, radiative heat flux; RHL, radiative heat loss; HDR, heat discharge rate.
Table 4. Summary of heat loss in the Beppu geothermal area from 2009 to 2017 based on ASTER and Landsat 8 TIRS images. Ambient temperature and relative humidity were recorded at Oita station (AMeDAS).
Beppu Thermal Area
SensorDateDay/Night* Relative Humidity (%)Ambient Temp. (°C)TransmissivityEmissivityLST (°C) without AmbientRHF (W/m2)RHL (MW)HDR (MW)
B13/B10 *B14/B11 *MinMaxMinMaxMinMax
ASTER12 May 2009Day0.9280.978
10 May 2009Night5119.900.8940.835−6.175.49−33.1030.08126.92823.71
18 May 2011Day0.9340.976
13 March 2011Night7710.100.9100.860−5.315.02−25.7925.21115.25747.97
7 May 2013Day0.9360.970
5 May 2013Night6215.300.9030.849−5.365.74−27.5130.18134.30871.61
Landsat 8 OLI-TIRS5 May 2015Day0.9450.988
26 May 2015Night5821.800.8500.791−5.397.63−30.1444.92197.031278.72
19 February 2017Day0.9490.988
29 April 2017Night4316.800.9170.876−5.764.74−30.5126.19113.85738.89
* Data available through the Automated Meteorological Data Acquisition System (AMeDAS) in Japan. ** ASTER thermal infrared bands (band 13 and band 14) and Landsat 8 TIRS bands (band 10 and band 11). D, day; N, night; LST, land surface temperature; RHF, radiative heat flux; RHL, radiative heat loss; HDR, heat discharge rate.
Table 5. Comparison between observed and ASTER standard products base heat loss from both study areas.
AreaYearObserved RHL (MW)AST_05 and AST_08 Based RHL (MW)Pearson Correlation Coefficient
Mt. Garan200911.1913.590.9822
201116.4419.9
201311.8513.03
Beppu Geothermal Area2009126.92179.770.9881
2011115.25153.64
2013134.3208.31

