Improving Flood Maps in Ungauged Fluvial Basins with Dendrogeomorphological Data. An Example from the Caldera de Taburiente National Park (Canary Islands, Spain)

 ,
,  ,
, 
 ,
, 
Abstract
:1. Introduction
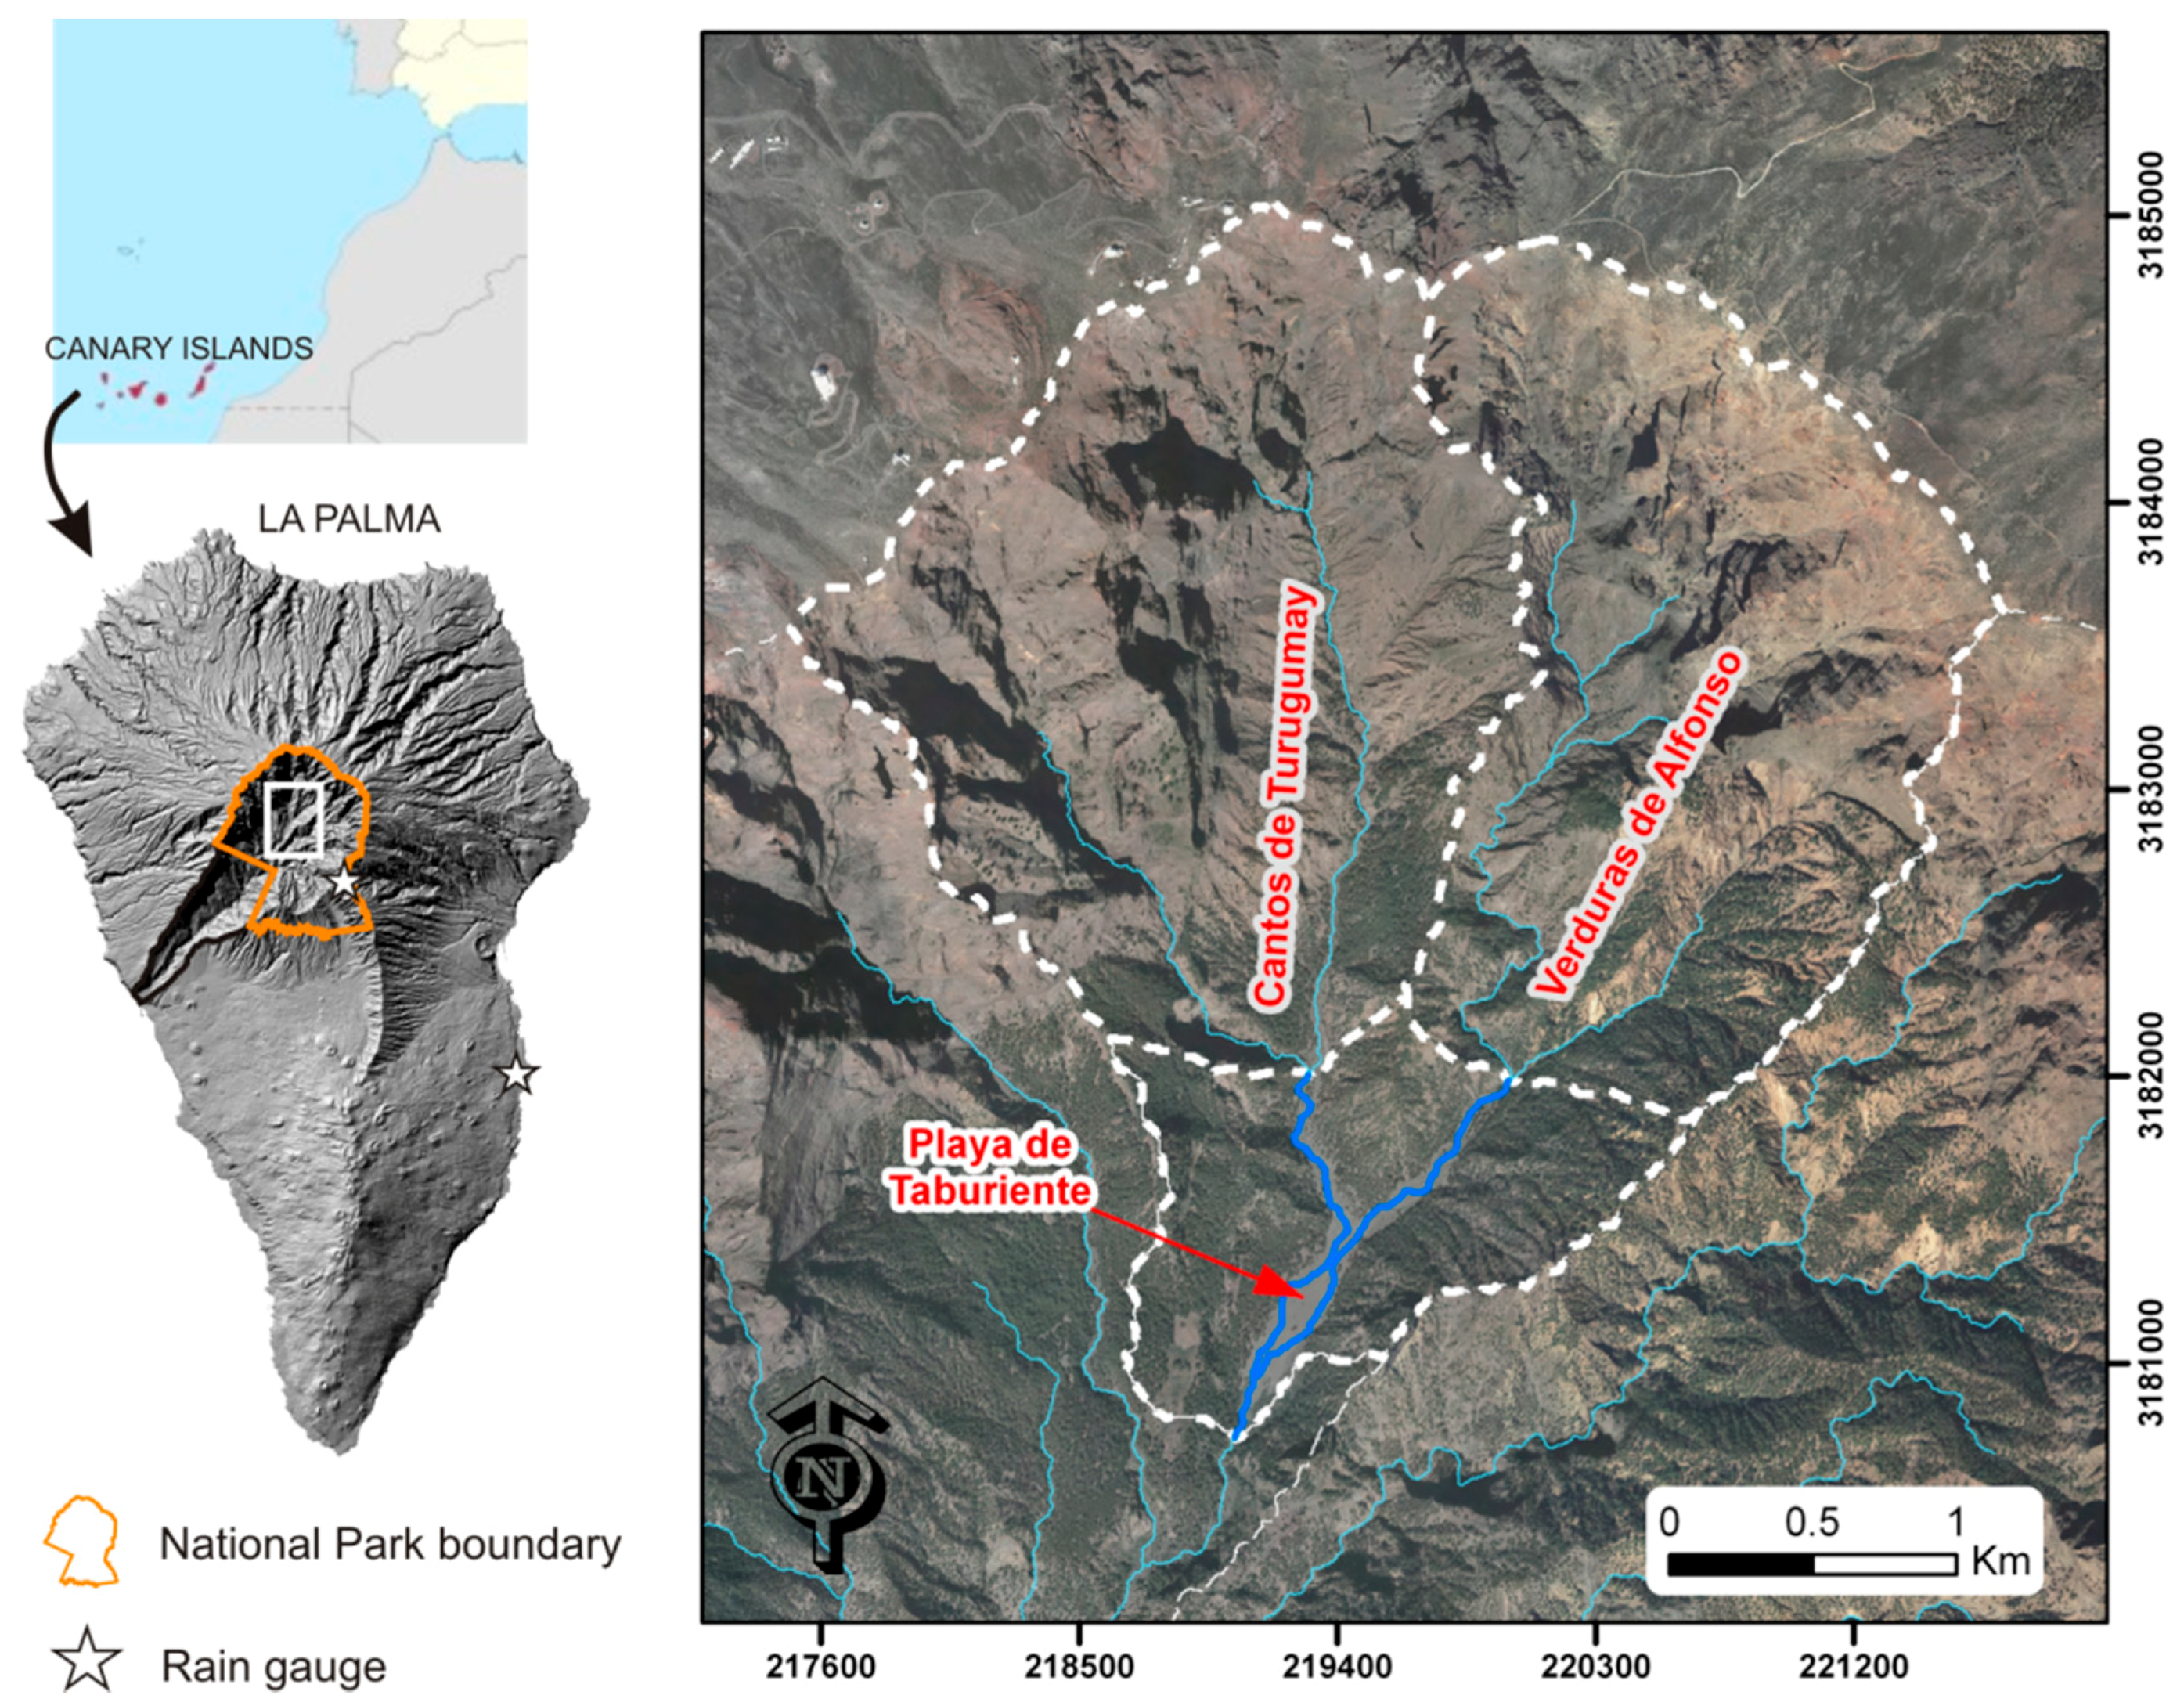
2. Case Study Area
3. Material and Methods
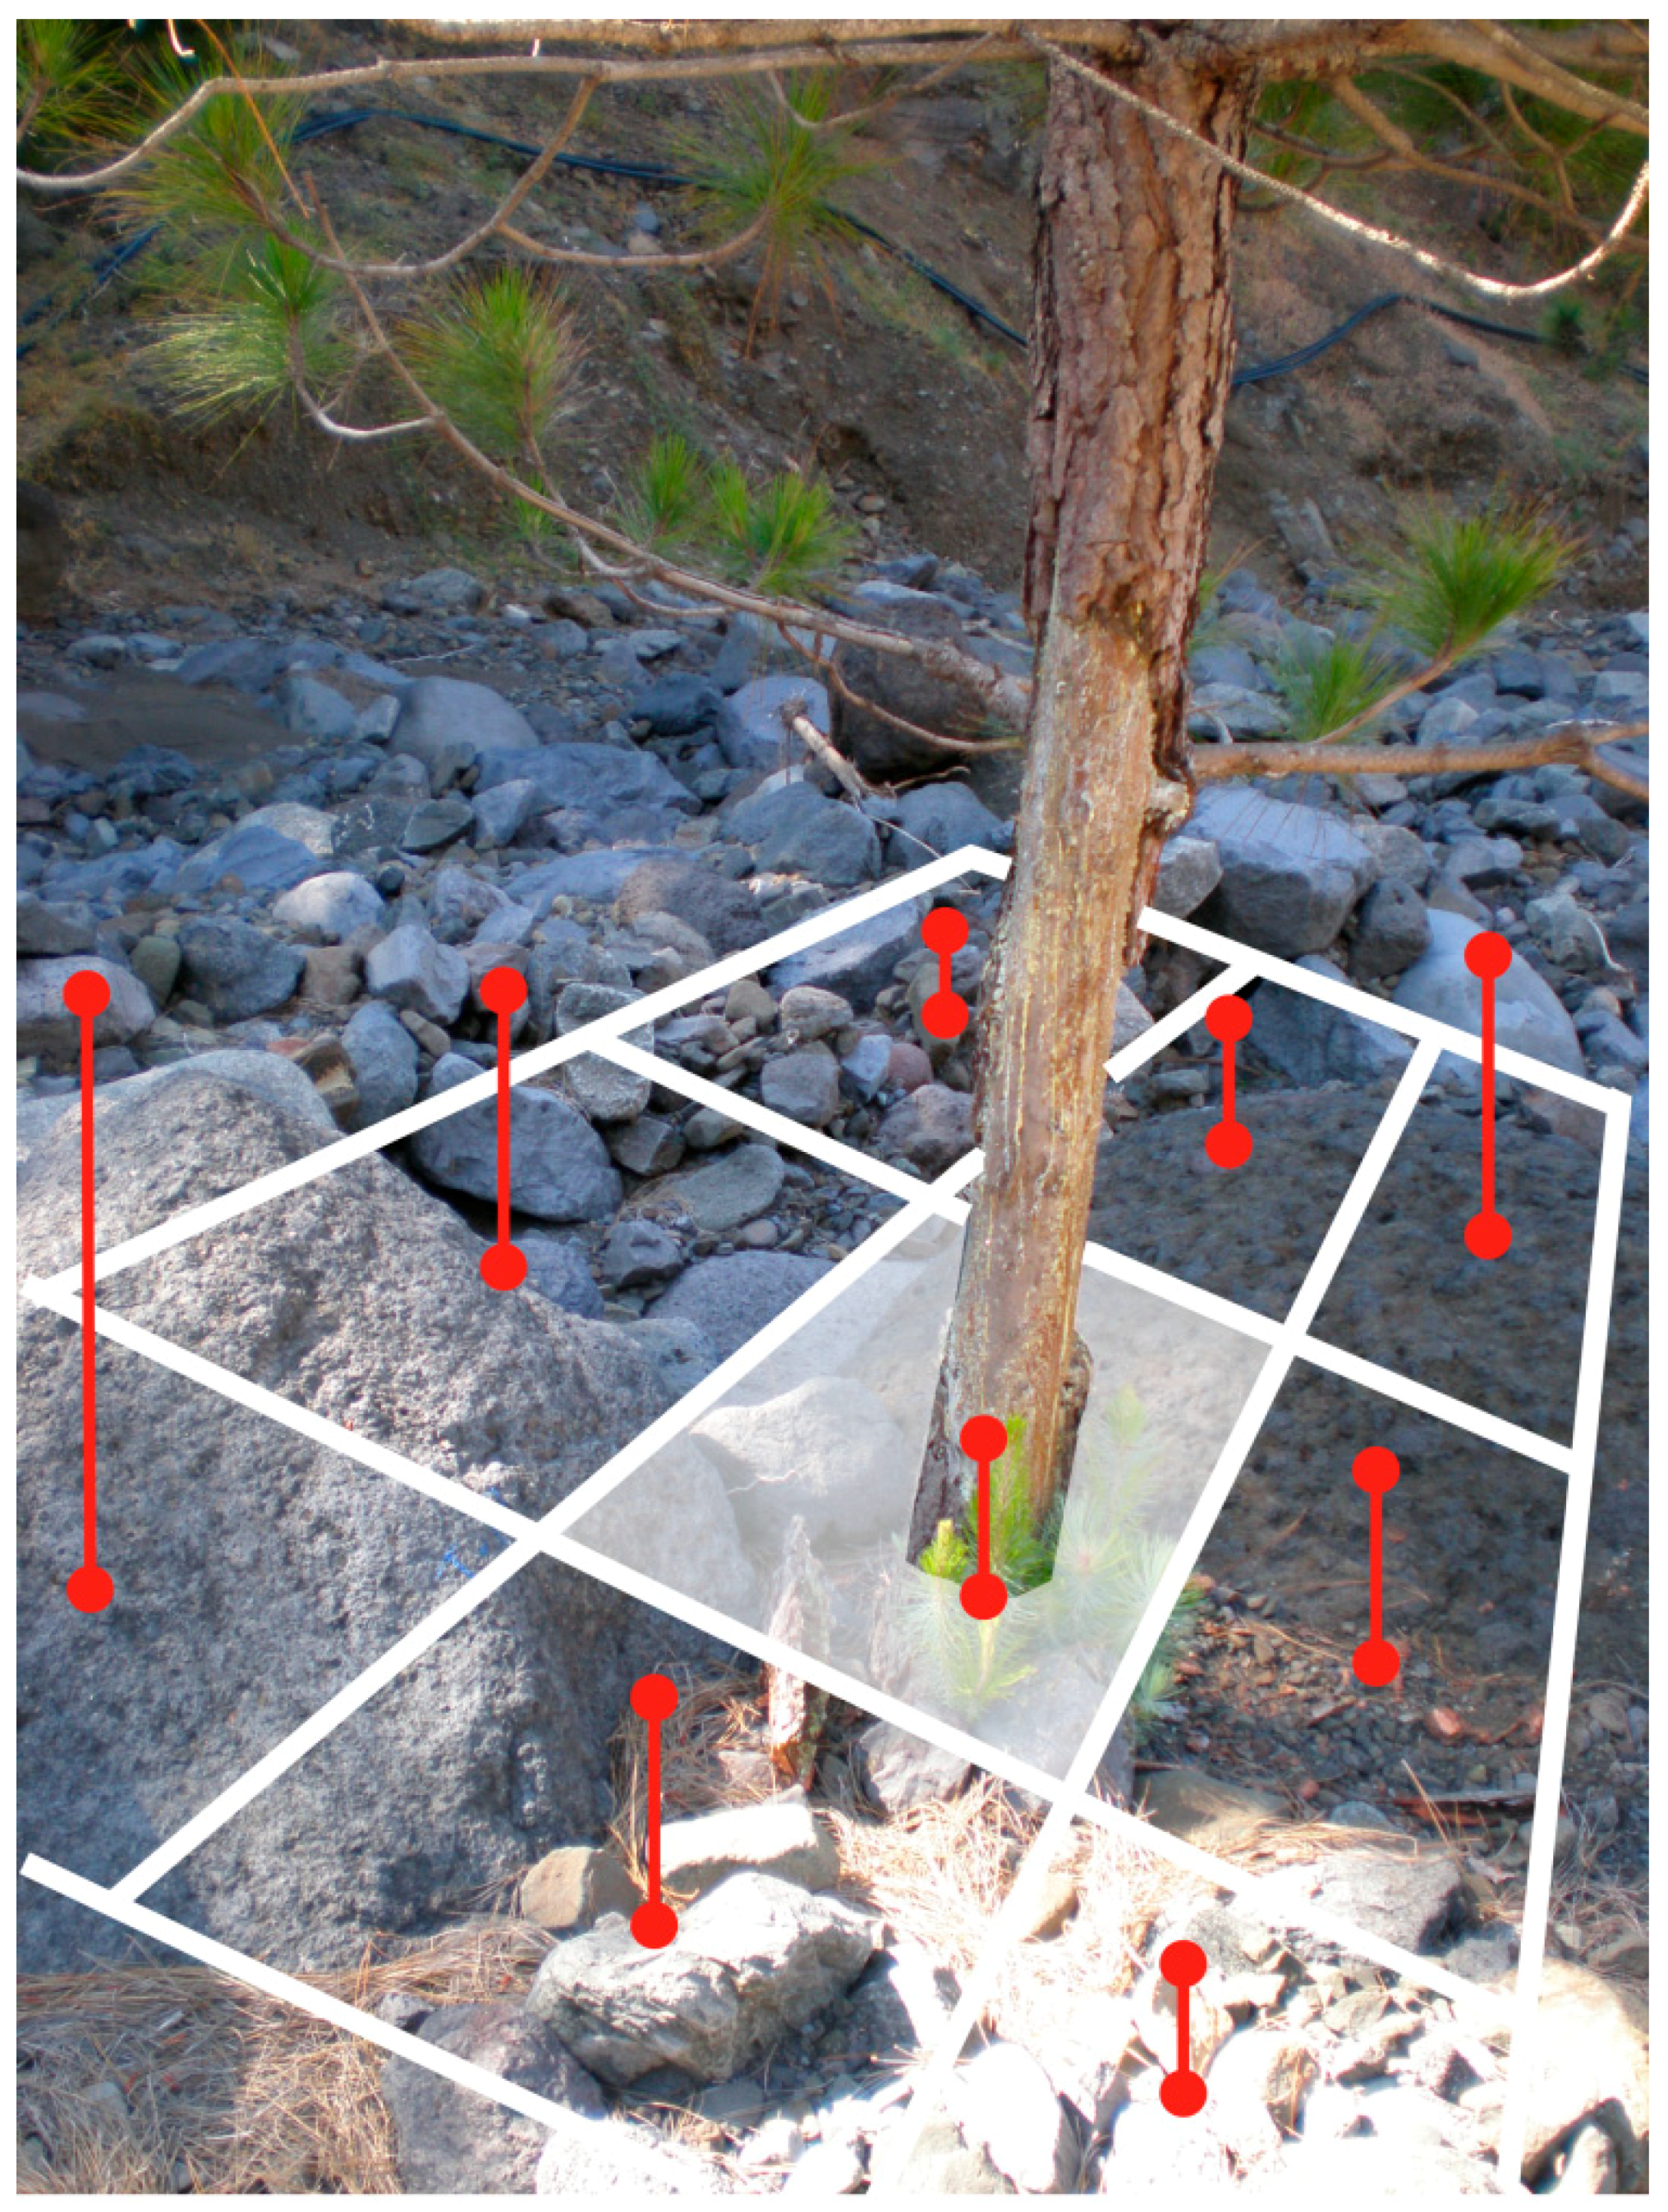
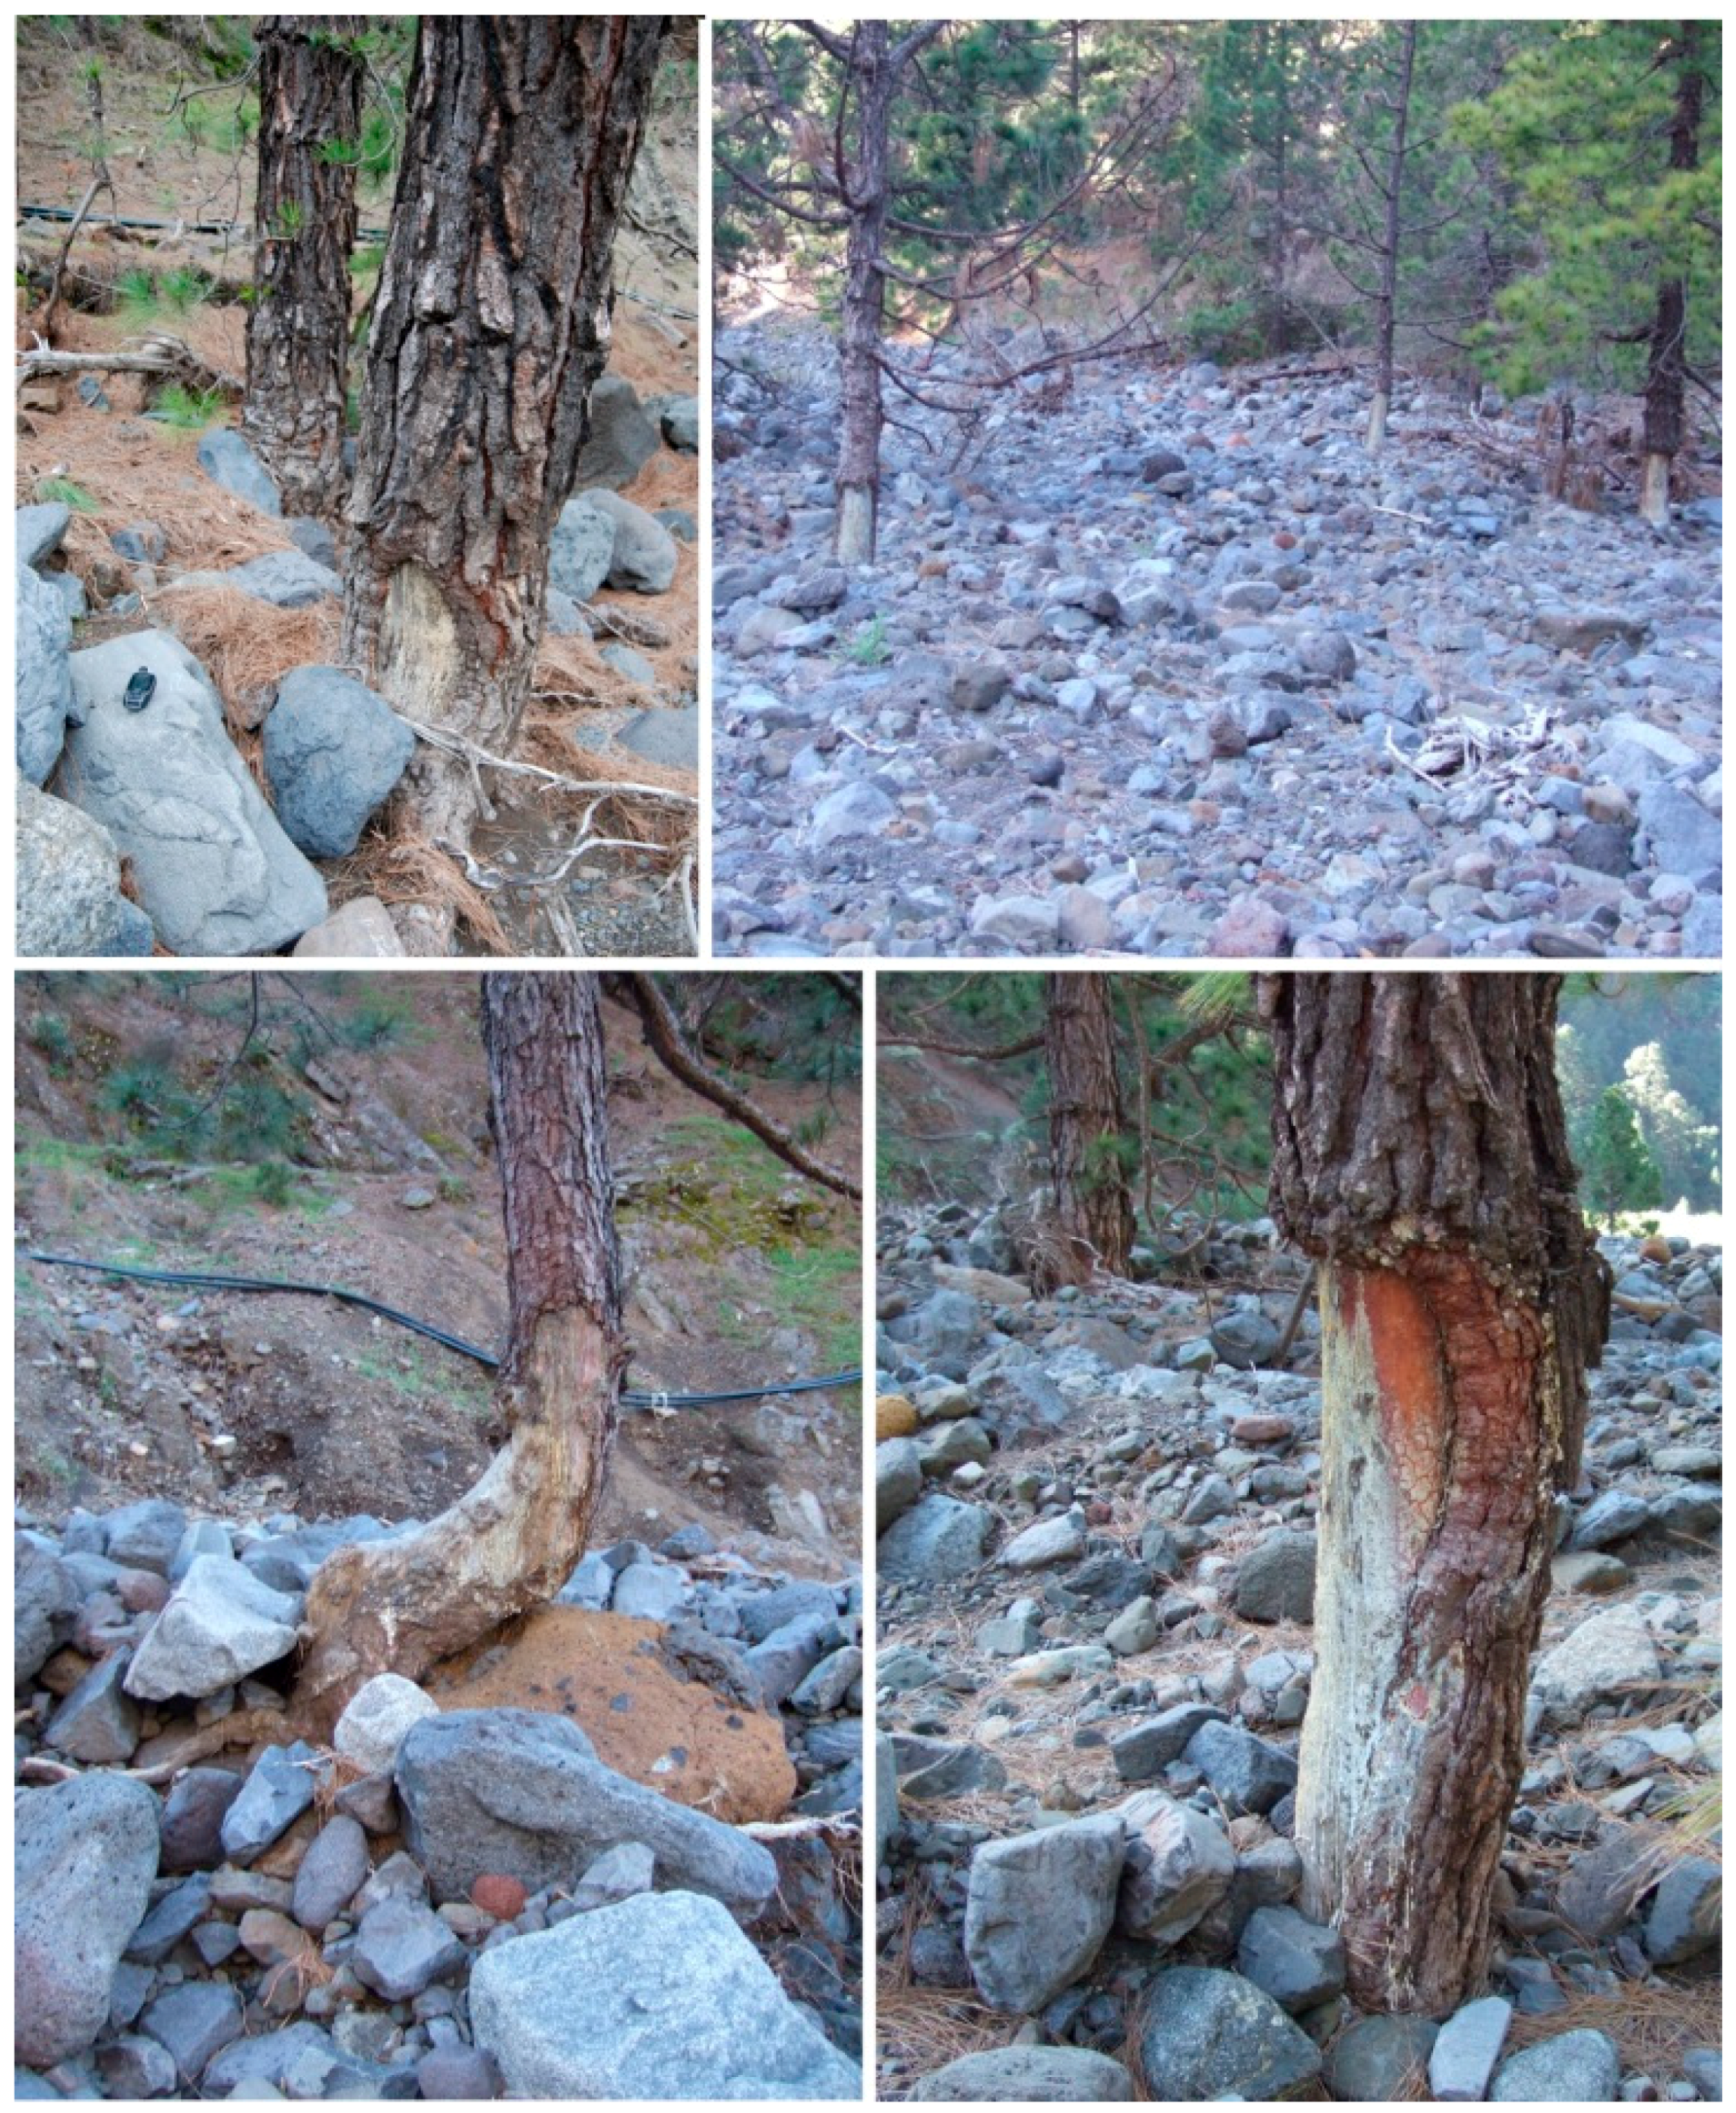
3.1. Dendrogeomorphological Data Sources
3.2. Hydrological Data
3.3. Hydraulic Modelling
- -
- Peak flows associated with precipitations recorded during the 11–13 January 1997 event, obtained from Garrote et al. [28].
- -
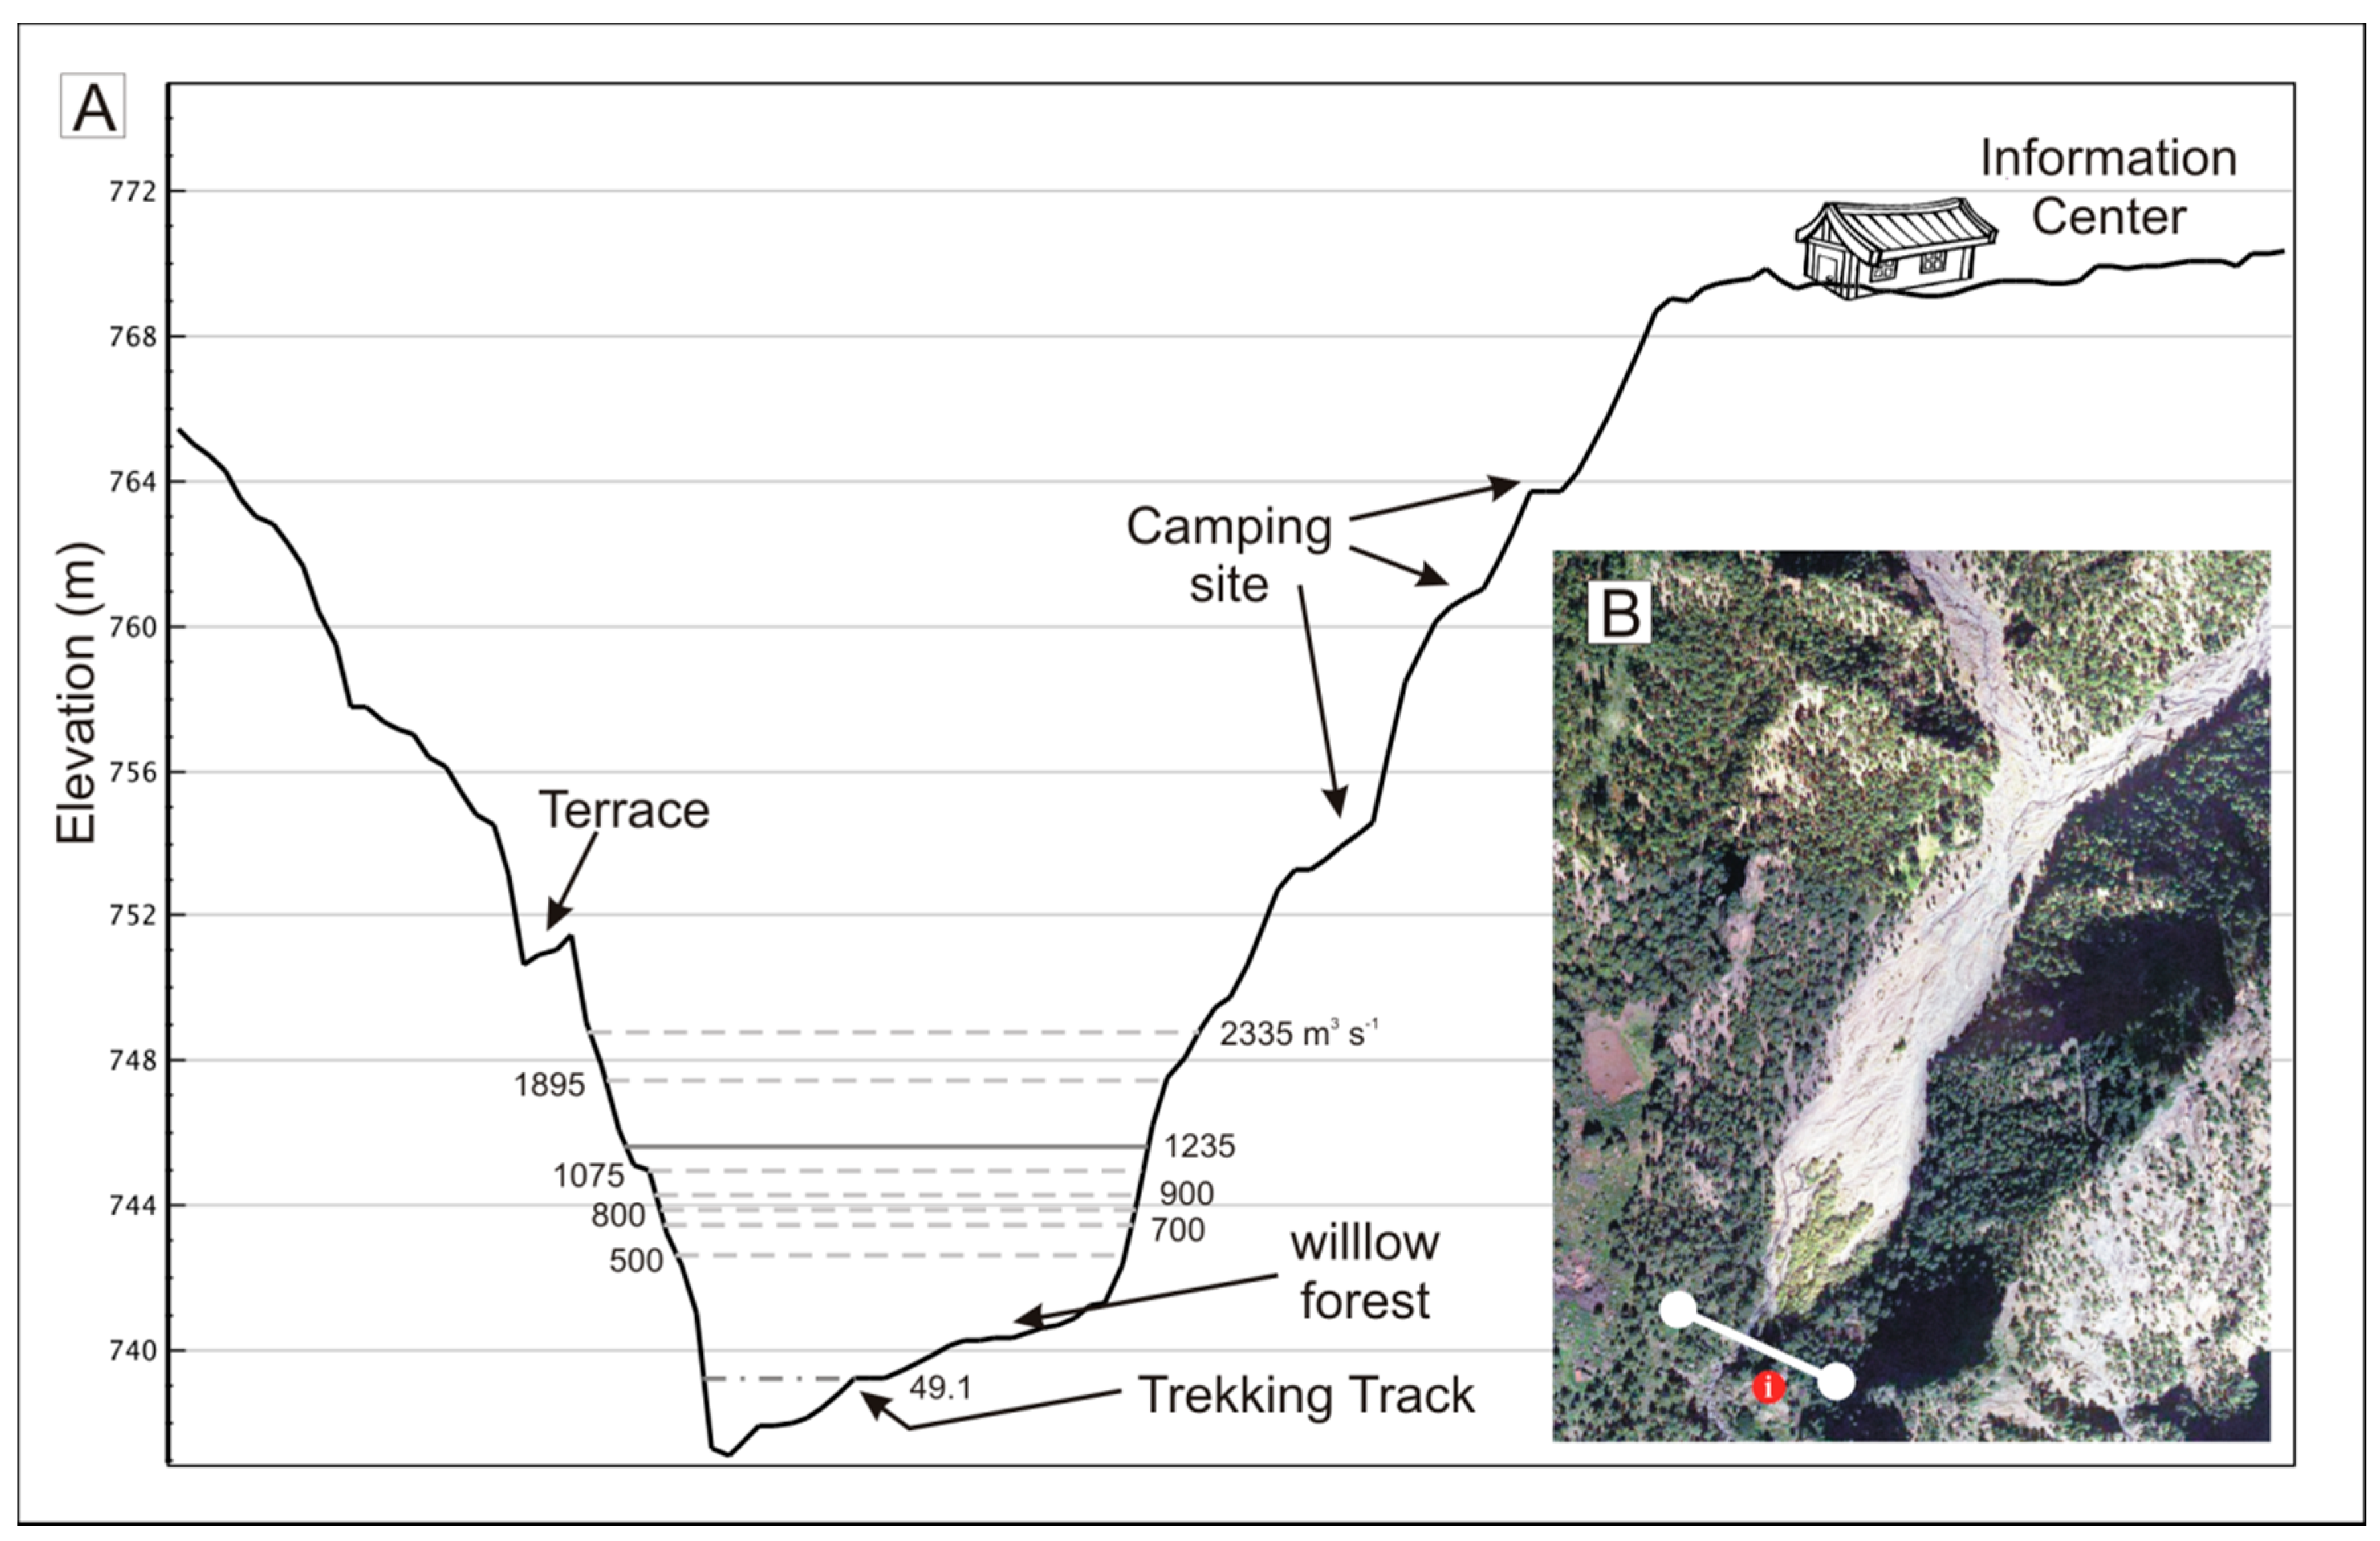
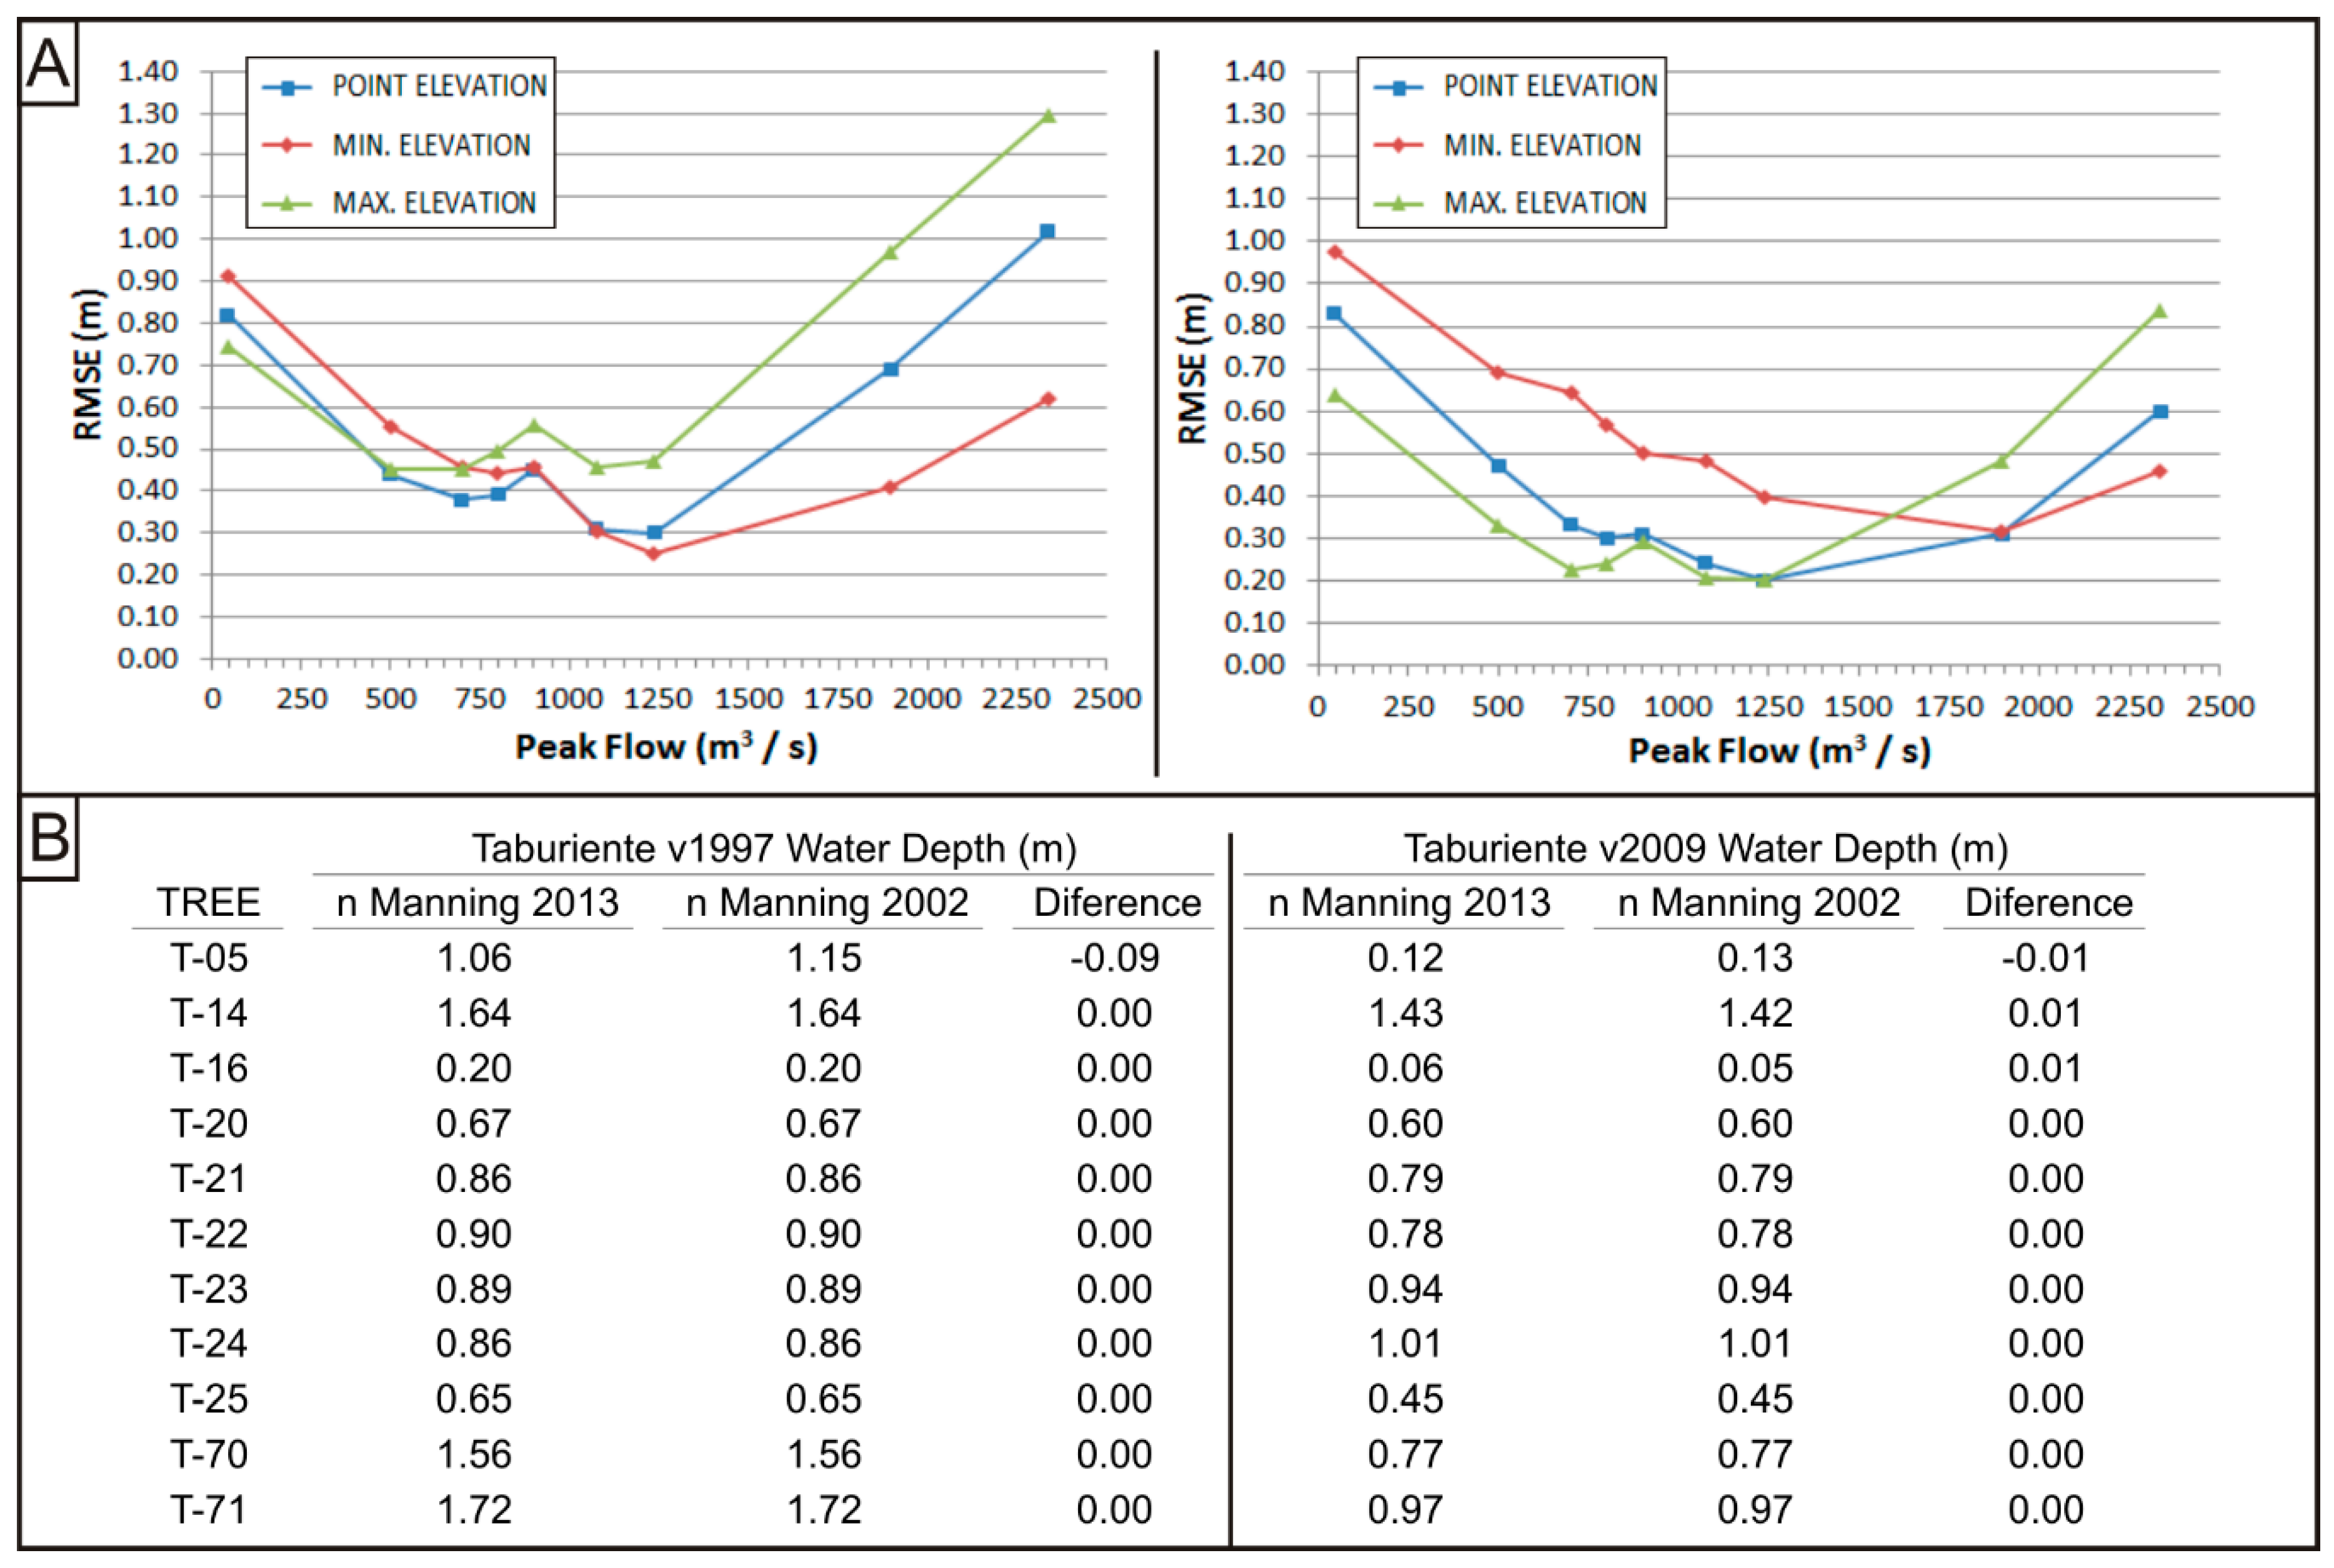
- Peak flow range (300–2500 m3 s−1), seeking to minimize errors (RMSE) when they are related with the dendro-geomorphological data (tree scars), by comparing the water sheet depths with the height of the disturbances. The aim here was to define the liquid flows needed to minimize this error.
4. Results and Discussion
4.1. 1997 Flood Reconstruction
4.2. Uncertainty Sources of Flood Hazard Results
5. Conclusions
Author Contributions
Funding
Acknowledgments
Conflicts of Interest
References
- Williams, A.; Archer, D. The use of historical flood information in the English Midlands to improve risk assessment. Hydrol. Sci. J. 2002, 47, 67–76. [Google Scholar] [CrossRef]
- Benito, G.; Lang, M.; Barriendos, M.; Llasat, M.C.; Frances, F.; Ouarda, T.; Thorndycraft, V.R.; Enzel, Y.; Bardossy, A.; Coeur, D.; et al. Use of systematic, palaeoflood and historical data for the improvement of flood risk estimation. Review of scientific methods. Nat. Hazards 2004, 31, 623–643. [Google Scholar] [CrossRef]
- Machado, M.J.; Botero, B.A.; López, J.; Francés, F.; Díez-Herrero, A.; Benito, G. Flood frequency analysis of historical flood data under stationary and non-stationary modelling. Hydrol. Earth Syst. Sci. 2015, 19, 2561–2576. [Google Scholar] [CrossRef] [Green Version]
- Díez-Herrero, A.; Laín Huerta, L.; Llorente Isidro, M. A Handbook on Flood Hazard Mapping Methodologies; Instituto Geológico y Minero de España: Madrid, Spain, 2009; pp. 17–108. ISBN 978-84-7840-813-9. [Google Scholar]
- Gaume, E.; Borga, M. Post-flood field investigations in upland catchments after major flash floods: Proposal of a methodology and illustrations. J. Flood Risk Manag. 2008, 1, 175–189. [Google Scholar] [CrossRef]
- Benito, G.; Thorndycraft, V.R. Palaeoflood hydrology and its role in applied hydrological sciences. J. Hydrol. 2004, 313, 3–15. [Google Scholar] [CrossRef]
- Gaume, E. On the asymptotic behavior of flood peak distributions. Hydrol. Earth Syst. Sci. 2006, 10, 233–243. [Google Scholar] [CrossRef] [Green Version]
- Santos, P.P.; Tavares, A.O.; Andrade, A.I.A.S.S. Comparing historical-hydrogeomorphological reconstitution and hydrological-hydraulic modeling in the estimation of flood-prone areas—A case study in Central Portugal. Nat. Hazards Earth Syst. Sci. 2011, 11, 1669–1681. [Google Scholar] [CrossRef]
- Benito, G. Palaeoflood hydrology in Europe. In Palaeofloods, Historical Data and Climatic Variability: Applications in Flood Risk Assessment; Thorndycraft, V.R., Benito, G., Barriendos, M., Llasat, M.C., Eds.; Centro de Ciencias Medioambientales: Madrid, Spain, 2003; pp. 19–24. ISBN 8492195827. [Google Scholar]
- Brazdil, R.; Kundzewicz, Z.W.; Benito, G. Historical hydrology for studying flood risk in Europe. Hydrol. Sci. J. 2006, 51, 739–764. [Google Scholar] [CrossRef] [Green Version]
- Díez-Herrero, A.; Ballesteros, J.A.; Ruiz-Villanueva, V.; Bodoque, J.M. A review of dendrogeomorphological research applied to flood risk analysis in Spain. Geomorphology 2013, 196, 211–220. [Google Scholar] [CrossRef]
- Ballesteros, J.A.; Bodoque, J.M.; Díez-Herrero, A.; Sanchez-Silva, M.; Stoffel, M. Calibration of floodplain roughness and estimation of flood discharge based on tree-ring evidence and hydraulic modelling. J. Hydrol. 2011, 403, 103–115. [Google Scholar] [CrossRef]
- Ballesteros-Cánovas, J.A.; Stoffel, M.; St George, S.; Hirschboeck, K. A review of flood records from tree rings. Prog. Phys. Geogr. 2015, 39, 794–816. [Google Scholar] [CrossRef]
- Benito, G.; Díaz-Herrero, A. Palaeoflood hydrology: Reconstructing rare events and extreme flood discharges. In Hydro-Meteorological Hazards, Risks and Disasters; Paron, P., di Baldassarre, G., Eds.; Elsevier: Amsterdam, The Netherlands, 2015; pp. 65–104. ISBN 978-0-12-394846-5. [Google Scholar]
- Yanosky, T.M. Documentation of high summer flows on the Potomac River from the wood anatomy of ash trees. Water Resour. Bull. 1984, 20, 241–250. [Google Scholar] [CrossRef]
- St George, S.; Nielsen, E. Palaeoflood records for the Red River, Manitoba, Canada, derived from anatomical tree-ring signatures. Holocene 2003, 13, 547–555. [Google Scholar] [CrossRef]
- Ballesteros-Cánovas, J.A.; Stoffel, M.; Bodoque, J.M.; Bollschweiler, M.; Hitz, O.; Díez-Herrero, A. Changes in wood anatomy in tree rings of Pinus pinaster Ait. following wounding by flash floods. Tree-Ring Res. 2010, 66, 93–103. [Google Scholar] [CrossRef]
- Stoffel, M.; Casteller, A.; Luckman, B.H.; Villaba, R. Spatiotemporal analysis of channel wall erosion in ephemeral torrents using tree roots: An example from the Patagonian Andes. Geology 2012, 40, 247–250. [Google Scholar] [CrossRef]
- Wertz, E.; St George, S.; Zeleznik, J.D. Vessel anomalies in Quercus macrocarpa tree rings associated with recent floods along the Red River of the North, United States. Water Resour. Res. 2013, 49, 630–634. [Google Scholar] [CrossRef]
- Génova, M.; Díez-Herrero, A.; Furdada, G.; Guinau, M.; Victoriano, A. Dendrogeomorphological evidence of flood frequency changes and human activities (Portainé Basin, Spanish Pyrenees). Tree-Ring Res. 2018, in press. [Google Scholar]
- Gottesfeld, A.S. British Columbia flood scars: Maximum flood-stage indicator. Geomorphology 1996, 14, 319–325. [Google Scholar] [CrossRef]
- McCord, V.A. Fluvial process dendrogeomorphology: Reconstruction of flood events from the southwestern United States using flood-scarred trees. In Tree-Ring, Environment and Humanity; University of Arizona: Tucson, AZ, USA, 1996; pp. 689–699. [Google Scholar]
- Corriell, F. Reconstruction of a Paleoflood Chronology for the Middlebury River Gorge Using Tree Scars as Flood Stage Indicators. Ph.D. Thesis, Middlebury College, Middlebury, MT, USA, 2002. [Google Scholar]
- Ruiz-Villanueva, V.; Díez-Herrero, A.; Stoffel, M.; Bollschweiler, M.; Bodoque, J.M.; Ballesteros, J.A. Dendrogeomorphic analysis of flash floods in a small ungauged mountain catchment (Central Spain). Geomorphology 2010, 118, 383–392. [Google Scholar] [CrossRef]
- Casteller, A.; Stoffel, M.; Crespo, S.; Villalba, R.; Corona, C.; Bianchi, E. Dendrogeomorphic reconstruction of flash floods in the Patagonian Andes. Geomorphology 2015, 228, 116–123. [Google Scholar] [CrossRef]
- Victoriano, A.; Díez-Herrero, A.; Génova, M.; Guinau, M.; Furdada, G.; Khazaradze, G.; Calvet, J. Four-topic correlation between flood dendrogeomorphological evidence and hydraulic parameters (the Portainé stream, Iberian Peninsula). CATENA 2018, 162, 216–229. [Google Scholar] [CrossRef]
- Ballesteros-Cánovas, J.A.; Rodríguez-Morata, C.; Garófano-Gómez, V.; Rubiales, J.M.; Sánchez-Salguero, R.; Stoffel, M. Unravelling past flash flood activity in a forested mountain catchment of the Spanish Central System. J. Hydrol. 2015, 529, 468–479. [Google Scholar] [CrossRef] [Green Version]
- Garrote, J.; Díez-Herrero, A.; Bodoque, J.M.; Perucha, M.A.; Mayer, P.L.; Génova, M. Flood Hazard Management in Public Mountain Recreation Areas vs. Ungauged Fluvial Basins. Case Study of the Caldera de Taburiente National Park, Canary Islands (Spain). Geosciences 2018, 8, 6. [Google Scholar] [CrossRef]
- Génova, M.; Máyer, P.; Ballesteros-Cánovas, J.A.; Rubiales, J.M.; Saz, M.A.; Díez-Herrero, A. Multidisciplinary study of flash floods in the Caldera de Taburiente National Park (Canary Islands, Spain). CATENA 2015, 131, 22–34. [Google Scholar] [CrossRef]
- Colmenero, J.R.; De la Nuez, J.; Casillas, R.; Castillo, C. Epiclastic deposits associated with large-scale landslides and the formation of erosive calderas in oceanic islands: The example of the La Palma Island (Canary Archipelago). Geomorphology 2012, 177, 108–127. [Google Scholar] [CrossRef]
- Rinn, F. TSAP-Win: Time Series Analysis and Presentation for Dendrochronology and Related Applications, version 0.53; User Reference; RinnTech: Heidelberg, Germany, 2003. [Google Scholar]
- Cook, E.; Kairiukstis, L. Methods of Dendrochronology: Applications in the Environmental Sciences; Kluwer Academic Publishers: Dordrecht, The Netherlands, 1990. [Google Scholar]
- Grissino-Mayer, H.D. Evaluating crossdating accuracy: A manual and tutorial for the computer program COFECHA. Tree-Ring Res. 2001, 57, 205–221. [Google Scholar]
- Holmes, R. Program JOLTS: Finding Growth Surges or Suppressions in Trees; Laboratory of Tree-Ring Research, University of Arizona: Tucson, AZ, USA, 1999. [Google Scholar]
- Bladé, E.; Cea, L.; Corestein, G.; Escolano, E.; Puertas, J.; Vázquez-Cendón, E.; Dolz, J.; Coll, A. Iber: Herramienta de simulación numérica del flujo en ríos. Rev. Int. Metod. Numer. 2014, 30, 1–10. [Google Scholar] [CrossRef]
- Arcement, G.J.; Schneider, V.R. Guide for Selecting Manning’s Roughness Coefficients for Natural Channels and Flood Plains; USGS: Denver, CO, USA, 1989.
- Brunner, G.W. HEC-RAS, River Analysis System Hydraulic Reference Manual, version 4.1; U.S. Army Corps of Engineers: Davis, CA, USA, 2010.
- Rahman, M.S.; Di, L. The state of the art of spaceborne remote sensing in flood management. Nat. Hazards 2017, 85, 1223–1248. [Google Scholar] [CrossRef]
- Abt, S.R.; Wittler, R.J.; Taylor, A.; Love, D.J. Human stability in a high hazard flood zone. JAWRA J. Am. Water Resour. Assoc. 1989, 25, 881–890. [Google Scholar] [CrossRef]
- Merz, B.; Thieken, A.H.; Gocht, M. Flood risk mapping at the local scale: Concepts and challenges. In Flood Risk Management in Europe; Begum, S., Stive, M.J.F., Hall, J.W., Eds.; Springer: Dordrecht, The Netherlands, 2007; pp. 231–251. ISBN 978-1-4020-4200-3. [Google Scholar]
- Ballesteros-Cánovas, J.A.; Trappmann, D.; Shekhar, M.; Bhattacharyya, A.; Stoffel, M. Regional flood-frequency reconstruction for Kullu district, Western Indian Himalayas. J. Hydrol. 2017, 546, 140–149. [Google Scholar] [CrossRef]
- Ruiz-Villanueva, V.; Bodoque, J.M.; Díez-Herrero, A.; Eguibar, M.A.; Pardo-Igúzquiza, E. Reconstruction of a flash flood with large wood transport and its influence on hazard patterns in an ungauged mountain basin. Hydrol. Process. 2013, 27, 3424–3437. [Google Scholar] [CrossRef]
- Ruiz-Villanueva, V.; Bladé, E.; Sánchez-Juny, M.; Martí-Cardona, B.; Díez-Herrero, A.; Bodoque, J.M. Two-dimensional numerical modeling of wood transport. J. Hydroinform. 2014, 16, 1077–1096. [Google Scholar] [CrossRef]
- Neuhold, C.; Stanzel, P.; Nachtnebel, H.P. Incorporating river morphological changes to flood risk assessment: Uncertainties, methodology and application. Nat. Hazards Earth Syst. Sci. 2009, 9, 789–799. [Google Scholar] [CrossRef]
- Bodoque, J.M.; Díez-Herrero, A.; Eguibar, M.A.; Benito, G.; Ruiz-Villanueva, V.; Ballesteros-Cánovas, J.A. Challenges in paleoflood hydrology applied to risk analysis in mountainous watersheds—A review. J. Hydrol. 2015, 529, 449–467. [Google Scholar] [CrossRef]
- Ballesteros-Cánovas, J.A.; Eguibar, M.; Bodoque, J.M.; Díez-Herrero, A.; Stoffel, M.; Gutiérrez-Pérez, I. Estimating flash flood discharge in an ungauged mountain catchment with 2D hydraulic models and dendrogeomorphic paleostage indicators. Hydrol. Process. 2011, 25, 970–979. [Google Scholar] [CrossRef]
- Ballesteros-Cánovas, J.A.; Stoffel, M.; Spyt, B.; Janecka, K.; Kaczka, R.J.; Lempa, M. Paleoflood discharge reconstruction in Tatra Mountain streams. Geomorphology 2016, 272, 92–101. [Google Scholar] [CrossRef]
- Hardy, R.J.; Bates, P.D.; Anderson, M.G. The importance of spatial resolution in hydraulic models for floodplain environments. J. Hydrol. 1999, 216, 124–136. [Google Scholar] [CrossRef]
- Omer, C.R.; Nelson, E.J.; Zundel, A.K. Impact of varied data resolution on Hydraulic Modeling and Floodplain Delineation. J. Am. Water Resour. Assoc. 2003, 39, 467–475. [Google Scholar] [CrossRef]
- Casas, A.; Benito, G.; Thorndycraft, V.R.; Rico, M.T. The topographic data source of digital terrain models as a key element in the accuracy of hydraulic flood modelling. Earth Surf. Proc. Landf. 2006, 31, 444–456. [Google Scholar] [CrossRef]
- Horritt, M.S.; Bates, P.D. Predicting floodplain inundation: Rasted-based modelling versus the finite-element approach. Hydrol. Process. 2001, 15, 825–842. [Google Scholar] [CrossRef]
- Horritt, M.S. Development of physically based meshes for two-dimensional models of meandering channel flow. Int. J. Numer. Methods Eng. 2000, 47, 2019–2037. [Google Scholar] [CrossRef]
- Horritt, M.S.; Bates, P.D. Effects of spatial resolution on a raster based model of flood flow. J. Hydrol. 2001, 253, 239–249. [Google Scholar] [CrossRef]
- Zielonka, T.; Holeksa, J.; Ciapala, S. A reconstruction of flood events using scarred trees in the Tatra Mountains, Poland. Dendrochronologia 2008, 26, 173–183. [Google Scholar] [CrossRef]
- Stoffel, M.; Bollschweiler, M. Tree-ring analysis in natural hazards research—An overview. Nat. Hazards Earth Syst. Sci. 2008, 8, 187–202. [Google Scholar] [CrossRef]
- Stoffel, M.; Corona, C. Dendroecological dating of geomorphic disturbance in trees. Tree-Ring Res. 2014, 70, 3–20. [Google Scholar] [CrossRef]
- Rodriguez-Morata, C.; Ballesteros-Cánovas, J.A.; Trappmann, D.; Beniston, M.; Stoffel, M. Regional reconstruction of flash flood history in the Guadarrama range (Central System, Spain). Sci. Total Environ. 2016, 550, 406–417. [Google Scholar] [CrossRef] [PubMed] [Green Version]


© 2018 by the authors. Licensee MDPI, Basel, Switzerland. This article is an open access article distributed under the terms and conditions of the Creative Commons Attribution (CC BY) license (http://creativecommons.org/licenses/by/4.0/).
Share and Cite
Garrote, J.; Díez-Herrero, A.; Génova, M.; Bodoque, J.M.; Perucha, M.A.; Mayer, P.L. Improving Flood Maps in Ungauged Fluvial Basins with Dendrogeomorphological Data. An Example from the Caldera de Taburiente National Park (Canary Islands, Spain). Geosciences 2018, 8, 300. https://doi.org/10.3390/geosciences8080300
Garrote J, Díez-Herrero A, Génova M, Bodoque JM, Perucha MA, Mayer PL. Improving Flood Maps in Ungauged Fluvial Basins with Dendrogeomorphological Data. An Example from the Caldera de Taburiente National Park (Canary Islands, Spain). Geosciences. 2018; 8(8):300. https://doi.org/10.3390/geosciences8080300
Chicago/Turabian StyleGarrote, Julio, Andrés Díez-Herrero, Mar Génova, José M. Bodoque, María A. Perucha, and Pablo L. Mayer. 2018. "Improving Flood Maps in Ungauged Fluvial Basins with Dendrogeomorphological Data. An Example from the Caldera de Taburiente National Park (Canary Islands, Spain)" Geosciences 8, no. 8: 300. https://doi.org/10.3390/geosciences8080300
APA StyleGarrote, J., Díez-Herrero, A., Génova, M., Bodoque, J. M., Perucha, M. A., & Mayer, P. L. (2018). Improving Flood Maps in Ungauged Fluvial Basins with Dendrogeomorphological Data. An Example from the Caldera de Taburiente National Park (Canary Islands, Spain). Geosciences, 8(8), 300. https://doi.org/10.3390/geosciences8080300