Article

Proximal Monitoring of the 2011–2015 Etna Lava Fountains Using MSG-SEVIRI Data

1
Centro Nazionale Terremoti (CNT)-Istituto Nazionale di Geofisica e Vulcanologia (INGV), 00143 Rome, Italy
2
Istituto di Scienze dell’Atmosfera e del Clima (ISAC)-Consiglio Nazionale delle Ricerche (CNR), 40129 Bologna, Italy
3
Osservatorio Etneo, Istituto Nazionale di Geofisica e Vulcanologia (INGV), 95123 Catania, Italy
*
Author to whom correspondence should be addressed.
Geosciences 2018, 8(4), 140; https://doi.org/10.3390/geosciences8040140
Submission received: 21 December 2017 / Revised: 7 April 2018 / Accepted: 17 April 2018 / Published: 21 April 2018

Abstract

:
From 2011 to 2015, 49 lava fountains occurred at Etna volcano. In this work, the measurements carried out from the Spinning Enhanced Visible and InfraRed Imager (SEVIRI) instrument, on board the Meteosat Second Generation (MSG) geostationary satellite, are processed to realize a proximal monitoring of the eruptive activity for each event. The SEVIRI measurements are managed to provide the time series of start and duration of eruption and fountains, Time Averaged Discharge Rate (TADR) and Volcanic Plume Top Height (VPTH). Due to its temperature responsivity, the eruptions start and duration, fountains start and duration and TADR are realized by exploiting the SEVIRI 3.9 μm channel, while the VPTH is carried out by applying a simplified procedure based on the SEVIRI 10.8 μm brightness temperature computation. For each event, the start, duration and TADR have been compared with ground-based observations. The VPTH time series is compared with the results obtained from a procedures-based on the volcanic cloud center of mass tracking in combination with the Hybrid Single-Particle Lagrangian Integrated Trajectory (HYSPLIT) back-trajectories. The results indicate that SEVIRI is generally able to detect the start of the lava emission few hours before the ground measurements. A good agreement is found for both the start and the duration of the fountains and the VPTH with mean differences of about 1 h, 50 min and 1 km respectively.

1. Introduction

In 2011–2015, the eruptive style of Mt. Etna volcano (Sicily, Italy) showed an intense explosive activity. Strombolian events became more frequent, often associated to magnificent episodes of lava fountains. The most intense phase of these eruptions, commonly indicated as “paroxysmal” episodes, can be very short (from minutes to hours). The low frequency of polar-orbiting satellite observations is often inadequate to detect these paroxysmal episodes. Therefore, the Spinning Enhanced Visible and InfraRed Imager (SEVIRI), the primary instrument aboard Meteosat Second Generation (MSG) geostationary platforms, with its high temporal resolution (15 min for the Earth full disk and 5 min for the rapid scan mode over Europe and Northern Africa) has become an important tool for volcano observation in spite of its coarse spatial resolution [1,2]. SEVIRI has 12 spectral channels from visible (VIS) to Thermal InfraRed (TIR) with a nadir spatial resolution of 3 km (1 km for the high resolution High Resolution Visible-HRV channel). Measurements from SEVIRI allow the monitoring of the whole evolution of both the proximal volcanic activity and the ash and gas emissions into the atmosphere generated by explosive events, from the near-source plume column to the distal volcanic clouds transported by the winds [1]. Several physical parameters estimated from each SEVIRI image provide a quantitative characterization of the volcanic clouds in terms of ash mass burden, effective radius, aerosol optical depth and SO2 mass [3,4,5]. The space-based observations covering an entire eruptive event allow the description of the evolution of these volcanic cloud parameters, and the detection of the horizontal and vertical extent of the atmospheric volume affected by the ash cloud [1]. Moreover, they provide a record of the proximal thermal history of the event [6,7,8] and a precise timing of the early phase of the eruption [9]. All these space-based parameters enable continuous monitoring of the volcanic activity which can be complemented and validated by the available ground-based observations [1].
In this work a review of the lava fountaining events that occurred at Etna volcano from the beginning of 2011 to the end of 2015 is presented with a focus on the induced proximal activity analyzed by using SEVIRI data. Here both the SEVIRI instruments aboard MSG platforms positioned at 0 and 9.5° E, with a repeat cycle of 15 min (Earth full disk) and 5 min (rapid scan mode) are considered.
The paper is organized as follows: Section 2 outlines and references the Etna 2011–2015 lava fountains, and Section 3 describes the methods used to retrieve the eruptions and fountains beginning and duration, the Time Averaged Discharge Rate (TADR) and the Volcanic Plume Top Height (VPTH) from SEVIRI data. In Section 4 the results of these analyses are reported, while in Section 5 they are validated by exploiting the comparison with ground-based data, or by applying different and independent retrieval methods based on satellite measurements and model simulations. Final conclusions are drawn in Section 6.

2. The 2011–2015 Etna Lava Fountains

Since 2011 Etna was very active with 49 lava fountain events produced from the central craters with the most violent eruptions forming high plumes that overtake the tropopause. Those eruptions were characterized by three well defined phases: in the first one, there was the rising of Strombolian activity and lava flow emission; the second phase was characterized by the formation of lava fountains which produced abundant tephra fallout entirely covering the volcano flanks and finally, in the third and last phase, there was a decreasing of the explosive activity up to the end of the eruption [9,10]. The most frequent events were produced from the New South East Crater (NSEC), a new vent that opened in 2010 at the base of the South East Crater (SEC). During those events eruption columns were well visible from the video-surveillance system [11] and, in some cases, were also retrieved by lidar [9] that showed volcanic ash concentrations higher than the ash concentration thresholds for safe airspace defined by the International Civil Aviation Organization (ICAO) in the 2010 Volcanic Ash Contingency Plan [12]. Tephra fallout from the NSEC events gives total masses between ~108 and ~109 kg [13] and this variability is function of the ratio between ash and lava amount produced during the eruption [14]. Among the NSEC events, the 23 November 2013 lava fountain had a great impact because the high mass eruption rate associated to strong winds allowed to larger clasts to fall at distances of 5–6 km from the vent, hitting hikers and tourists [13] and affecting the airspace [1]. It is noteworthy that similar violent events were produced from the Voragine Crater (VOR) that produced four events in less than three days from 3 to 5 December 2015. This eruption produced columns rising up to 15 km a.s.l. [15] and copious tephra fallout deposit having a volume of 7.1 × 10⁶ m3 [16].

3. Proximal Monitoring of Volcanic Eruptions

In this work the proximal monitoring is referred to the analysis of SEVIRI data on the Etna summit craters area. In this section, the procedures developed for the estimation of eruptions and fountains start and duration, TADR and VPTH are described.

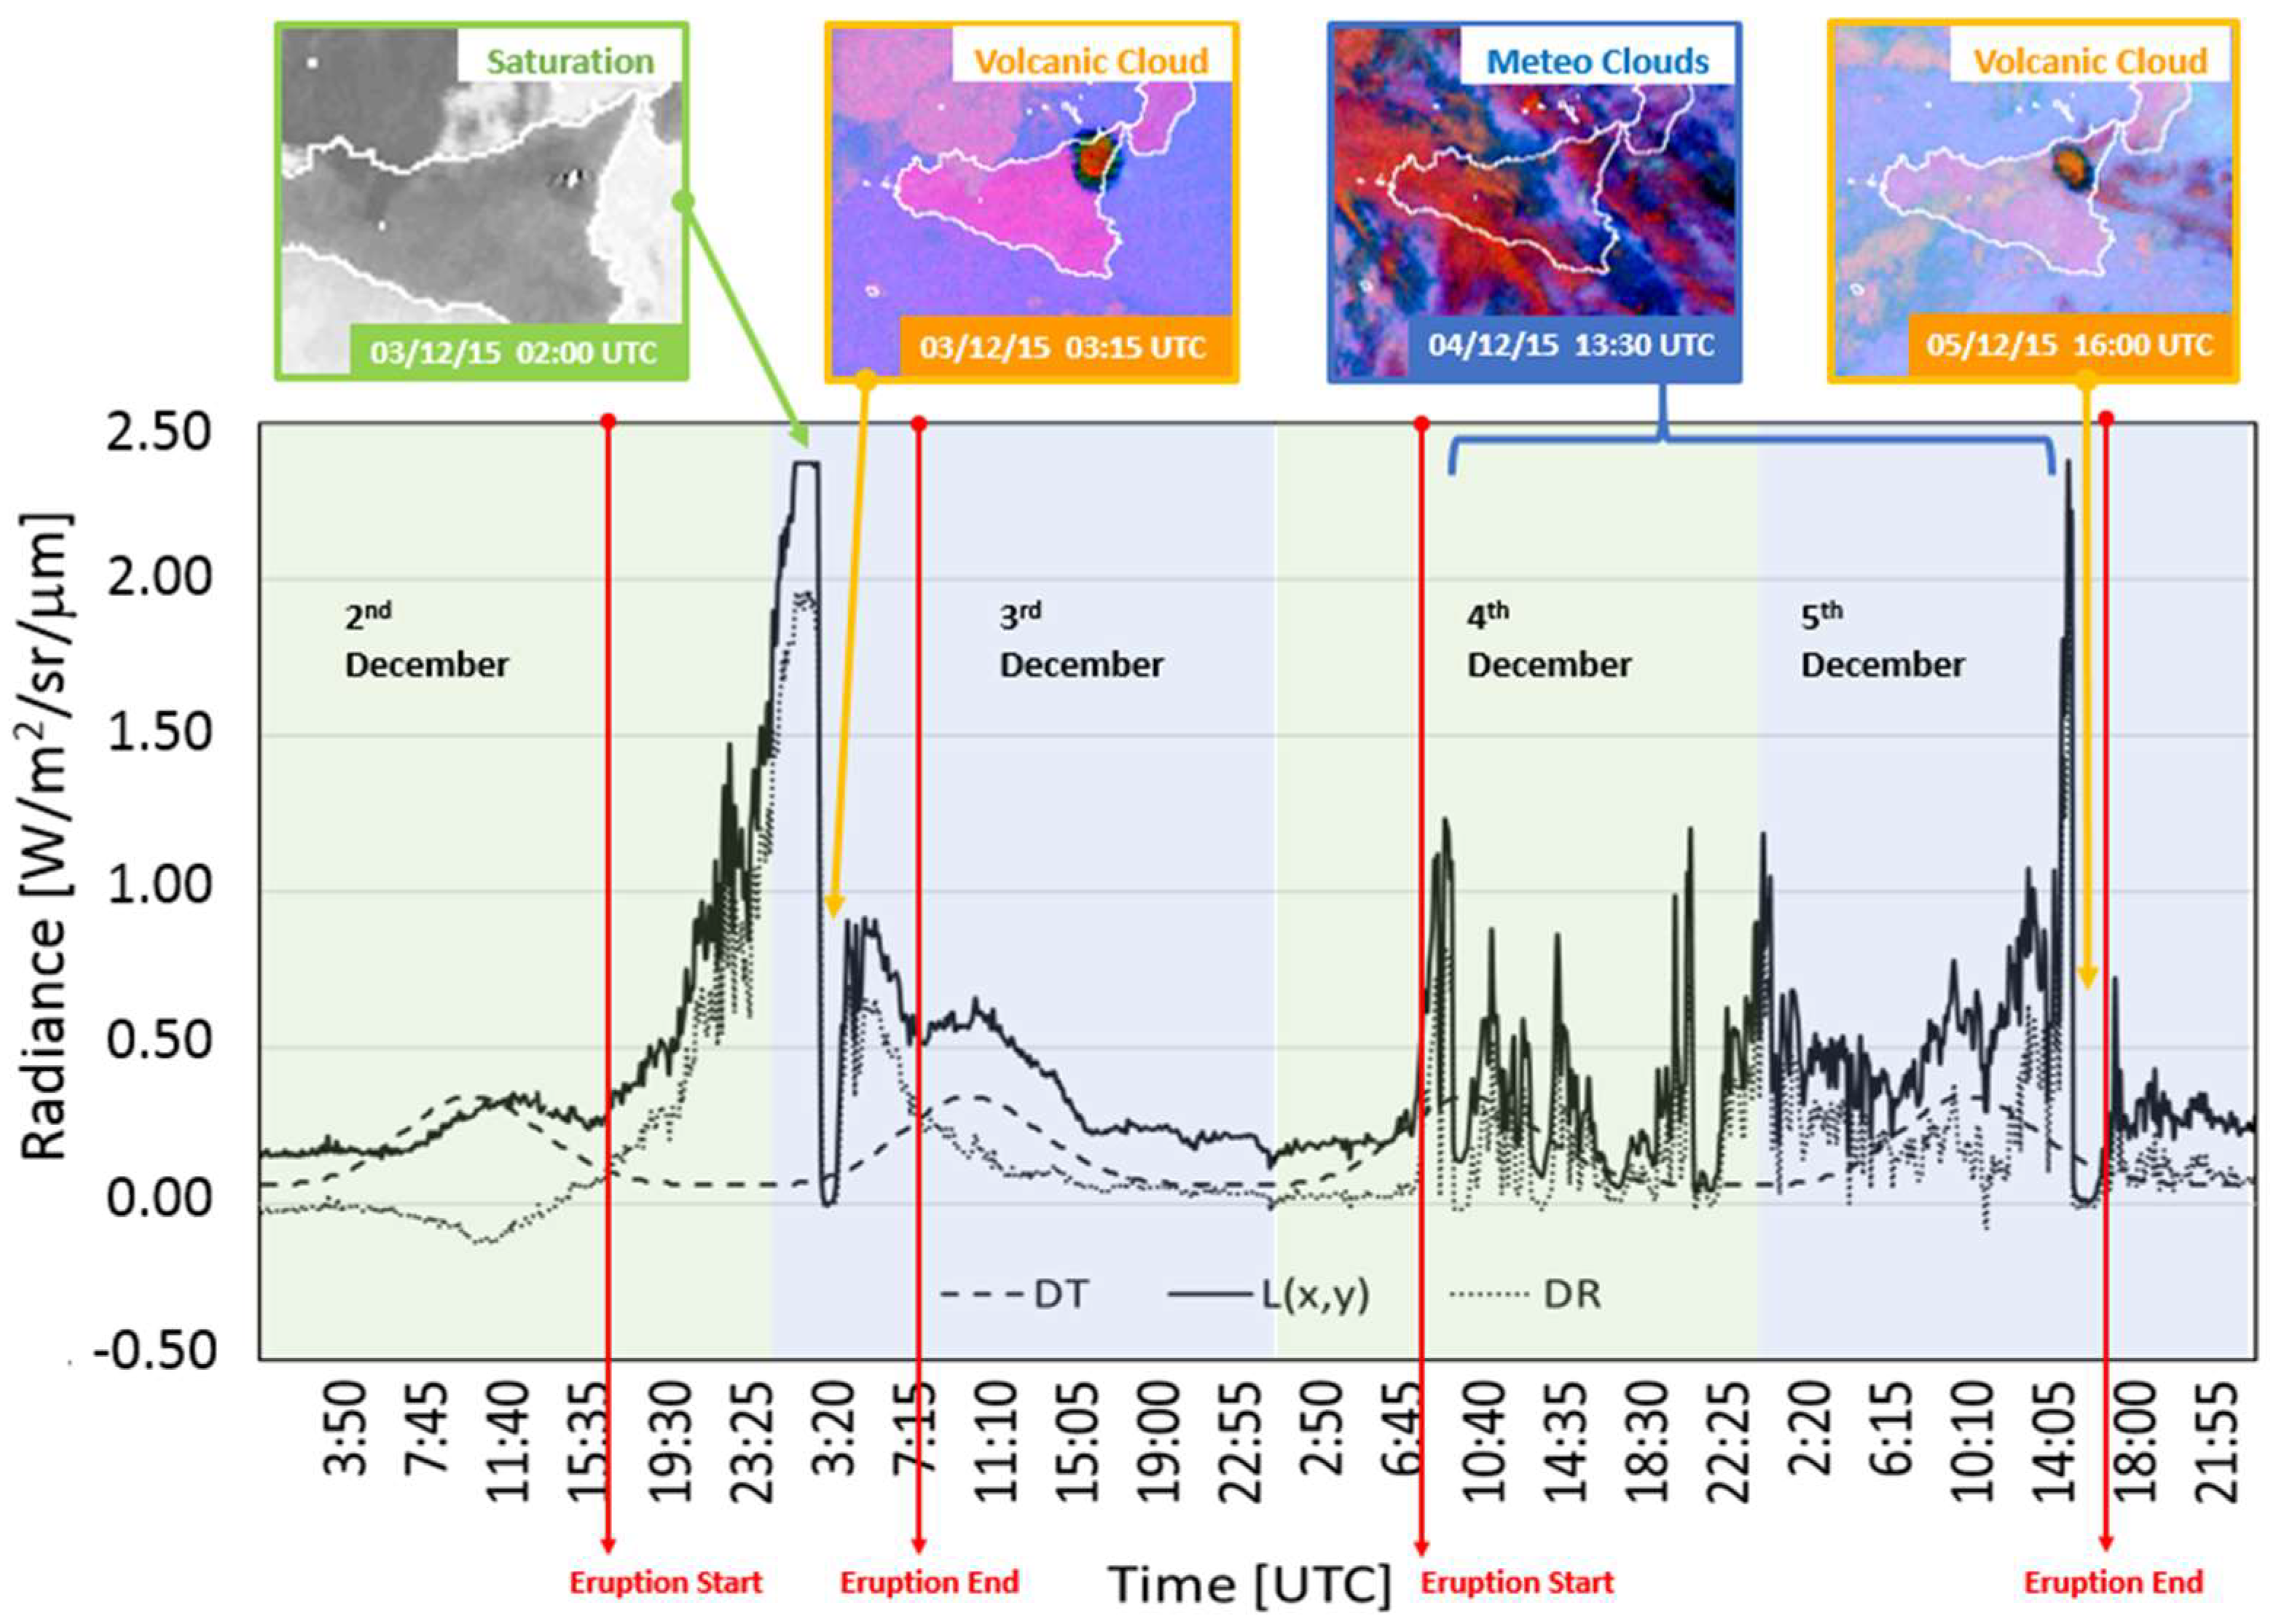
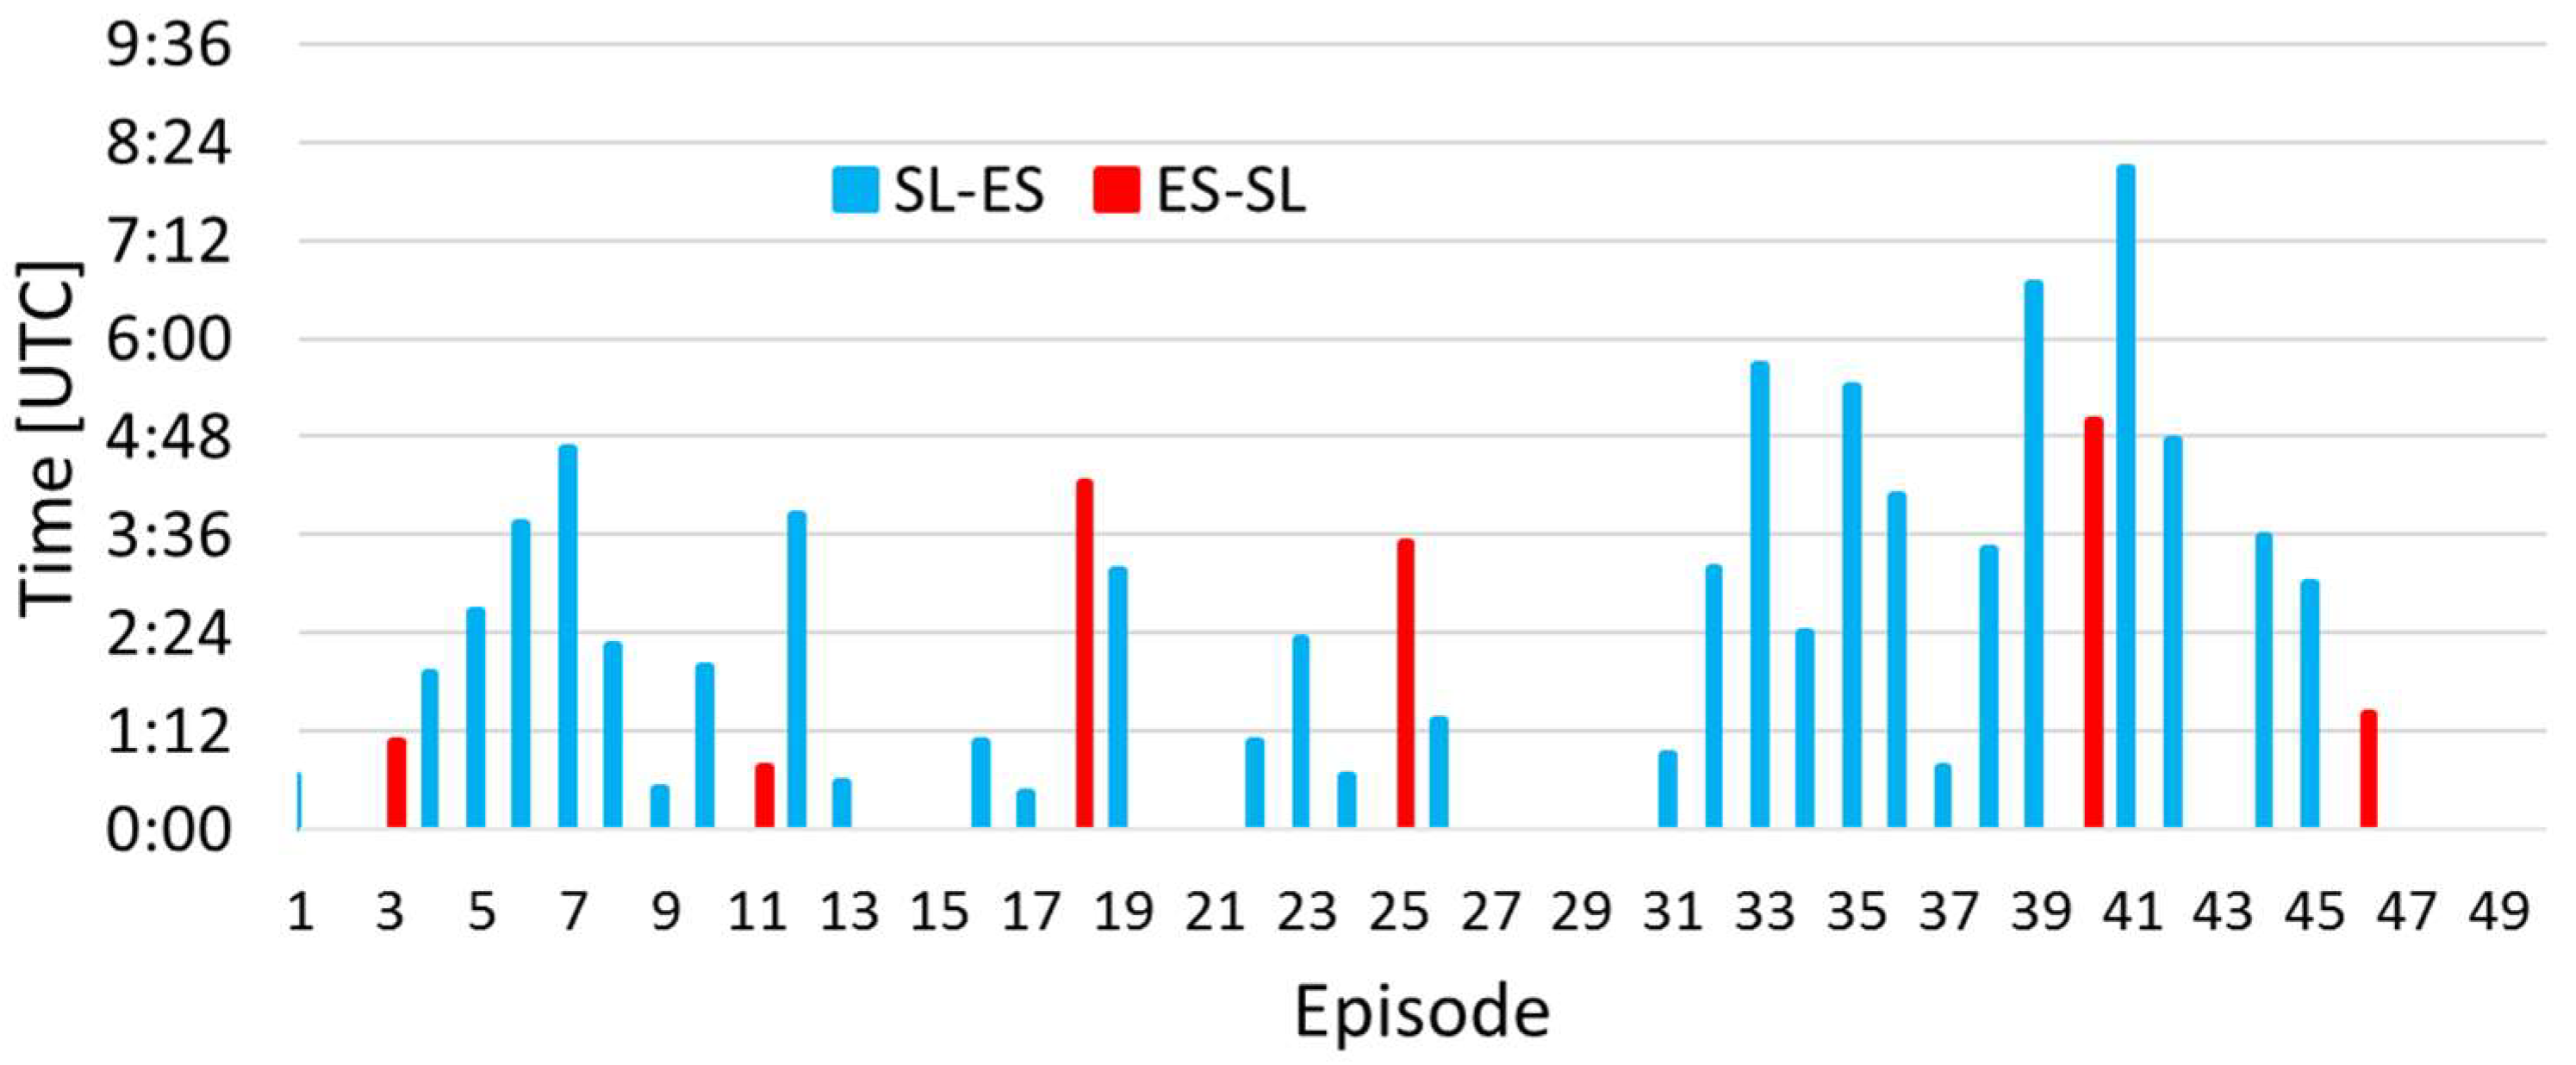
3.1. Eruption Start and Duration

Infrared remotely sensed data can be used to evaluate the surface thermal state of active volcanoes [17,18,19,20]. Because the spectral radiance emitted by hot spots reaches its maximum in the region of Mid InfraRed (MIR), the early detection of an impending eruption is realized by exploiting the SEVIRI 3.9 μm channel. Despite its relatively coarse spatial resolution (3 × 3 km2 at sub satellite point) the presence of a high temperature source, even affecting only a small portion of one large pixel, causes a dramatic increase of the emitted MIR radiance [18].
A procedure named MS2RWS (MeteoSat to Rapid Response Web Service), has been developed to exploit the capability to detect the beginning and duration of an eruption. The algorithm is an improvement of the procedure presented in Musacchio et al. [21,22] applied to the SEVIRI 3.9 μm measurements. The procedure starts from the assumption that in a remote sensing image a pixel may assume a limited number of values ranging from 0 up to the saturation. During a continuous daily acquisition, the radiance of a given pixel, in clear sky condition and no eruption, follows a characteristic trend related to the Sun irradiance. By considering the 3.9 μm SEVIRI channel, five years of images have been analyzed for each 15 min SEVIRI acquisition and the maximum radiance values of the pixel centered on Etna craters (red pixel in the inset zoom of Figure 1), and the maximum average radiance in a region of 5 × 5 pixels around it (blue pixels in the inset zoom of Figure 1) have been computed.
In this space and time domain an “historical” threshold called “Dynamic Threshold” (DT) is defined:
DT ( t ) = Upper _ Limit ( t ) Lower _ Limit ( t )
where Upper_Limit is the maximum radiance values for the pixel centered on Etna craters defined as:
Upper _ Limit ( t ) = max ( L t k ( x , y ) ) t k T
With L t k ( x , y ) is the radiance at 3.9 μm of the pixel centered on Etna craters at time tk;
T = {t0, t1, …, tm} with m = 365 days × 5 years.
The Lower_Limit(t) is the maximum of the mean value computed in a region of 5 × 5 pixels around the pixel centered on Etna:
Lower _ Limit ( t ) = max { [ i , j = 1 n L t k ( x i , y j ) ] L t k ( x , y ) n 2 1 } t k T
with n = 5.
DT(t) is then compared with the “Difference of Radiances” (DR(t)) defined as DT(t), but, instead of the maximum historical values, the real time radiance values are considered.
Finally, by making the difference DT(t)–DR(t), two solutions are possible:
DT(t) ≥ DR(t), no eruption occurs;
DT(t) < DR(t), eruption occur.
Figure 2 shows two examples of no eruption (17 April 2013, upper plot) and eruption (5 January 2012, lower plot) test cases respectively. In these plots, DT(t), the radiance measured at 3.9 μm for the central pixel ( L ( x , y ) ) and DR(t) are represented by the dashed, solid and dotted lines respectively. As the upper plate of Figure 2 shows, the dotted line is always below the dashed line, therefore no eruption was detected. On the contrary, the lower plate of Figure 2 shows an abrupt increase of the 3.9 μm radiance until the saturation value (2.37 W/m2/sr/μm). The beginning of the eruption is identified at 01:10 UTC when DR(t) became greater than DT(t), while the end of the eruption is detected at 20:15 UTC, when DR drops back to values lower than DT(t). The trend of DR(t) and L(x*,y*) identifies also minor oscillations due to fluctuations of the volcanic activity, and a deep absorption between 5:50 to 6:55 UTC that indicate the start and the end of the fountaining with the formation of an eruptive plume. In fact, the volcanic plume, absorbing the underlying radiation, produce the decrease of the radiance measured from the satellite.

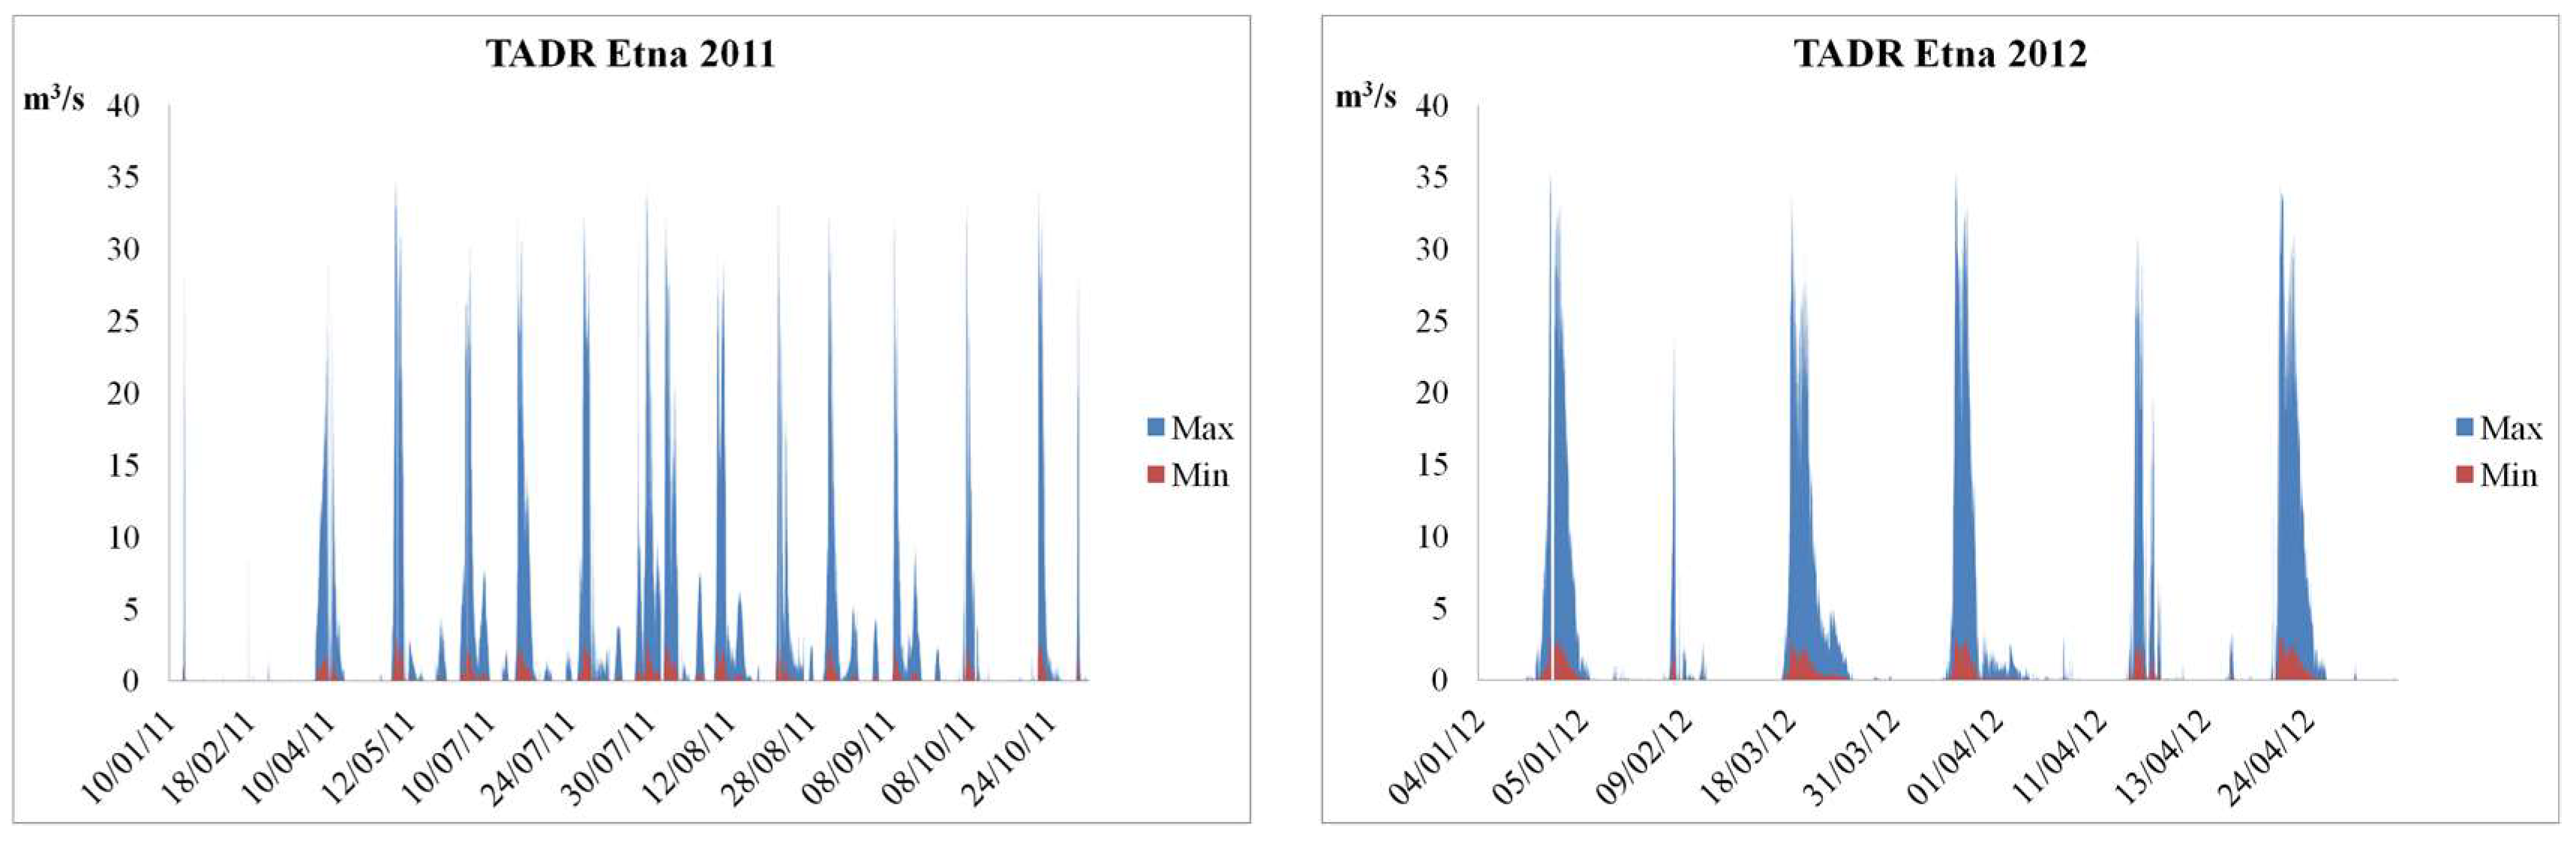
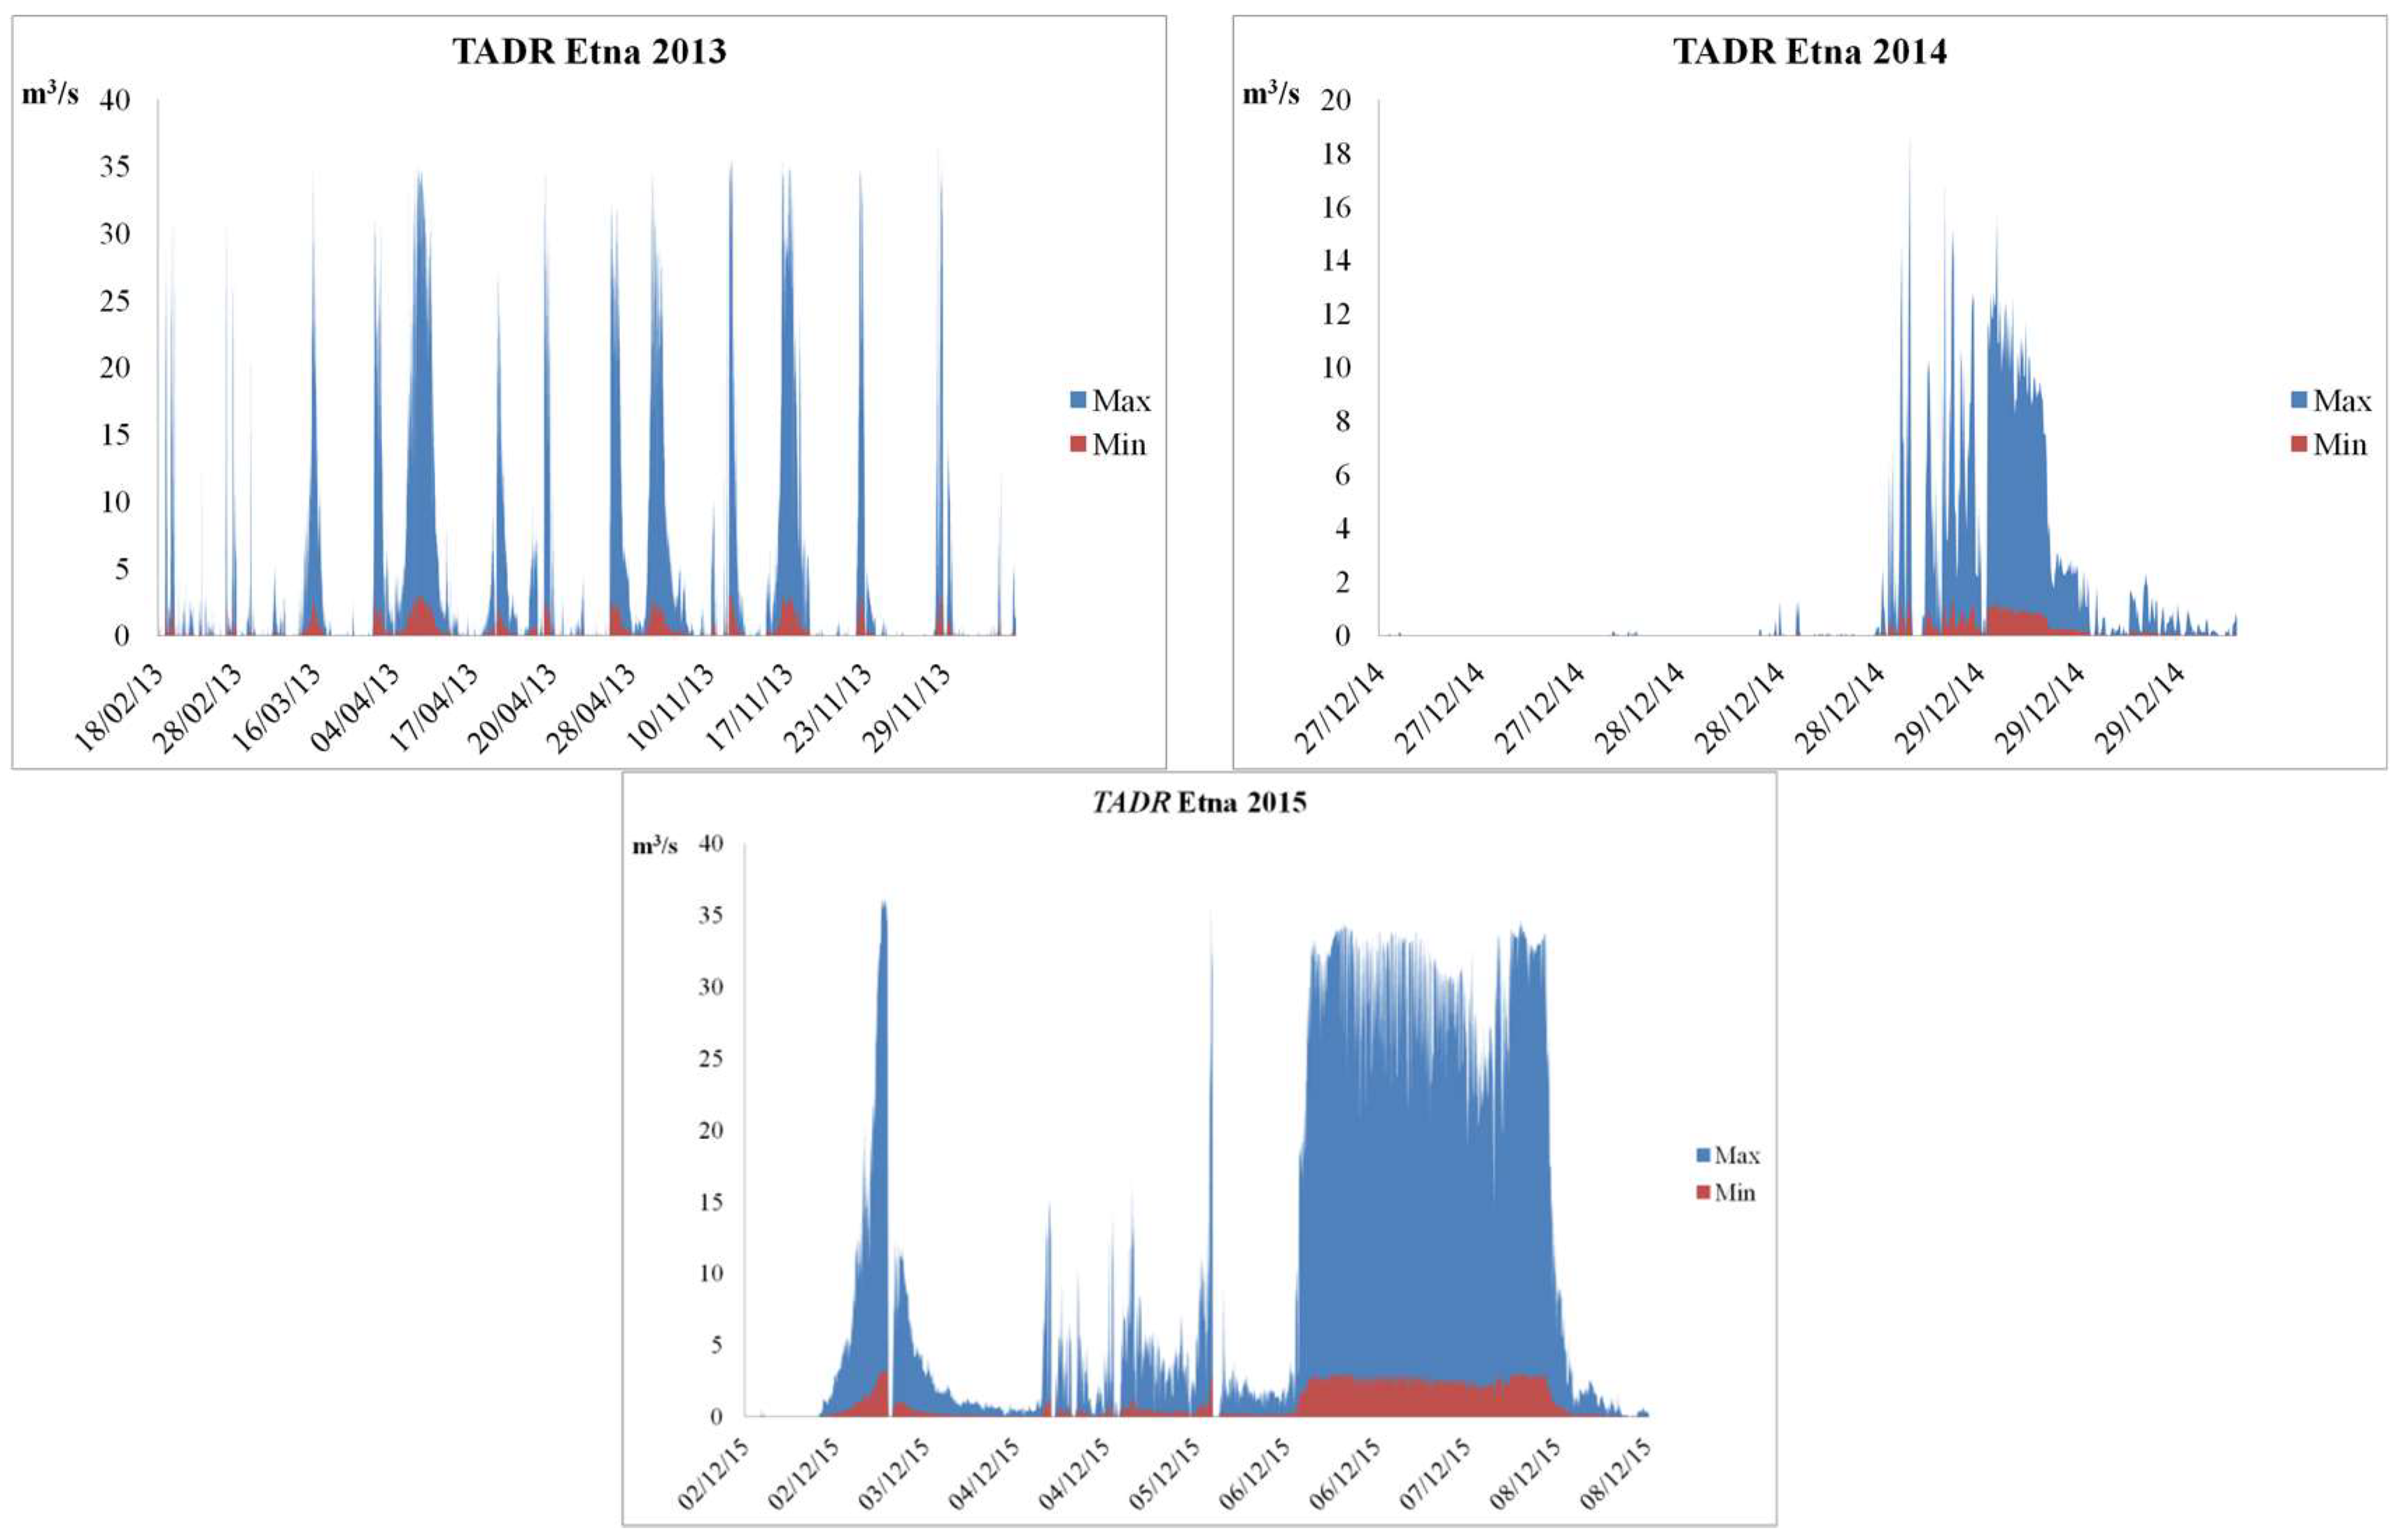
3.2. Lava Discharge during Etna’s Lava Fountains

Following Gouhier et al. [23], Wright et al. [24] and Harris et al. [6], the Time Averaged Discharge Rate (TADR) is estimated during Etna’s 2011–2015 eruptive events using SEVIRI 3.9 μm measurements. The data are processed using AVHotRR routine developed by Lombardo [25] to monitor volcanic activities in near-real time. AVHotRR allows for automatic hot-spot detection and heat flux estimate (Qtot). To convert Qtot to TADR using the satellite thermal data, the well-established conversion of Harris et al. [6] is applied. The conversion to TADR reduces to an empirical relation, whereby [24]:
TADR = mA/c,
in which A is the area of active lava flow derived from the satellite image, and m and c are coefficients set on a case-by-case basis [26]. Following Gouhier et al. [23], A is estimated from radiant pixels containing lava from:
A = L ( x , y ) L ( T a ) L ( T c ) L ( T a ) A pix ,
where Apix is the pixel area, L(Ta) and L(Tc) are the 3.9 μm radiances at ambient (Ta) and lava (Tc) temperature respectively. Ta is computed from adjacent lava-free pixels using the TIR channels. Because of the small fraction of the SEVIRI pixel occupied by lava and considering that the radiant peak of energy is centered at MIR wavelengths, there is no anomaly in the TIR. Therefore, Tc is set by considering a suitable range of values [27] that lead to a solution spanning over a wide range of TADR values. Uncertainties in TADR estimates can be reduced using data from higher spatial and spectral resolution sensors such as the Moderate Resolution Imaging Spectroradiometer (MODIS) or the Advanced very-high-resolution radiometer (AVHRR) [28,29,30], for which the pixel size of about 1 km2 is generally sufficient to detect anomalies also in the TIR.

3.3. Volcanic Plume Top Height

The VPTH is determined by using a simplified procedure based on the computation of the brightness temperature at 10.8 μm (Tb,10.8) of the most opaque pixels of the volcanic plume, and considered as a proxy for the ambient temperature at the same height [31]. This value can be compared with a temperature profile (as close as possible in time and space) to obtain the height where the temperature best matches the plume-top temperature [31,32]. For each SEVIRI image, the VPTH is estimated by computing the minimum Tb,10.8 value in an area of 9 × 9 pixels centered over the volcanic vents. This procedure, labelled in the following Dark Pixel (DP), is very simply to apply despite it works reliably only when the cloud behaves as a black-body and the atmospheric profile is representative. The highest uncertainties occur for plume heights near the tropopause where the temperature variation as a function of height is small. In this work, the atmospheric temperature profiles used for the VPTH estimation are those derived from the mesoscale model of the hydrometeorological service of Agenzia Regionale per la Protezione Ambientale (ARPA) Emilia Romagna named ARPA-SIM. An hourly model output from 72-h weather forecast provided every 12 h is considered. The ARPA-SIM grid spans from 12.5° to 18.5° E and from 34.5° to 40.5° N and has 22 isobaric levels. Data are provided as GRIB of 101 × 101 points stepped by 0.0625°.
Figure 3 shows an example of the VPTH retrieval obtained from the SEVIRI image collected the 23 November 2013 at 10:00 UTC and the corresponding ARPASIM temperature profile. In this case, the brightness temperature of the most opaque pixels is −53 °C and yields to an altitude of 11.1 km. The VPTH uncertainty is obtained by computing the altitudes for Tb,10.8 +/− 2 K (dashed gray lines), in which 2 K take into account the statistical variability of the most opaque pixels of the cloud. This leads to a final result of 11.1 +/− 0.7 km.

4. Results

Figure 4 shows the time series of DT(t), L ( x , y ) and DR(t) for the 2–5 December 2015 events. In the figure the start and end of eruptions, the 3.9 μm signal saturation, the presence of volcanic plumes (lava fountains) and the meteorological clouds over the vents are emphasized. The SEVIRI images on the top highlight the different plot signatures. In particular, in the first image on the left, the 3.9 μm channel shows the high. The other RGB composite images (R: Tb,12–Tb,10.8; G: Tb,10.8–Tb,8.6; B: Tb,10.8) emphasize the presence of the volcanic and/or meteorological clouds in the area of interest.
Figure 4 clarifies possibilities and limits of the SEVIRI 3.9 μm channel analysis. For the 2–3 December event, the eruption start, end and volcanic cloud presence are clearly detected, while for the 4–5 December events the situation is much more critic due to the presence of a wide meteorological cloud system in the area. In this latter case, it is not possible to identify the end of the 4 December and the start of the 5 December events: from the 3.9 μm analysis these two events are merged into one.
Table 1 (formatted in agreement with Behncke et al. [10] and De Beni et al. [33]) summarizes the timing and duration of the different phases identified for all the 2011–2015 events with the MS2RWS procedure applied to the 3.9 μm SEVIRI measurements. As the table shows, in some cases the estimations are impossible because of the presence of meteorological clouds over the volcanic area that covers completely the eruption signal (gray rows). As an example, the MS2RWS approach cannot discriminate the start and the end of all the events from 19 to 23 February 2013 and from 4 to 5 December 2015 because of the cloudy scenarios. The table shows also that several start/end fountains cannot be detected. The reason of that can be threefold: the presence of meteorological clouds over the plume that mask completely the ash signal, a plume too thin to sufficiently darken the 3.9 μm signal, and a plume too quickly transported out from the volcano area due to the high wind speed.
The last column of Table 1 shows the VPTHs estimated with the DP technique and the associated errors. It indicates that more than the 60% of the VPTHs are between 8 and 12 km a.s.l. and that the mean uncertainty is about 0.5 km.
Figure 5 shows the unconstrained TADR obtained for all the Etna lava fountains in which Tc has been set in the range 100–600 °C. As the figure shows the big uncertainty on Tc values lead to big uncertainties on the TADR, ranging from 3 to 35 m3/s. Moreover, TADR estimates suffer from radiance saturation of the SEVIRI 3.9 μm channel and therefore TADR values result underestimated. Figure indicate also the occurrence of many short-term but quite intense fire fountains and a significant event from 6 to 8 December 2015 (bottom plot) not considered in Table 1. The reason is that this event produced lava flow emission without the formation of stable lava fountain. In Section 5.2 the AVHRR higher spatial resolution measurements will be used to reduce the SEVIRI TADR uncertainty.
It is important to note that the duration of the 3 December 2015 eruption measured from SEVIRI data (bottom plot of Figure 5) is longer than the duration derived from ground observations [16]. This can be explained by the presence of volcanic products that are still hot after the end of the eruption. Sensors measure the thermal emission from fallout deposits and effusive materials even if the activity has been over for days. As a result, the application of Equation (6) can yield to false TADR.

5. Validation

The start of the eruption and the start and duration of the lava fountains are compared with ground-based measurements, while the VPTH with estimations obtained merging procedures based on tracking the volcanic cloud center of mass and on HYSPLIT backwards trajectories.

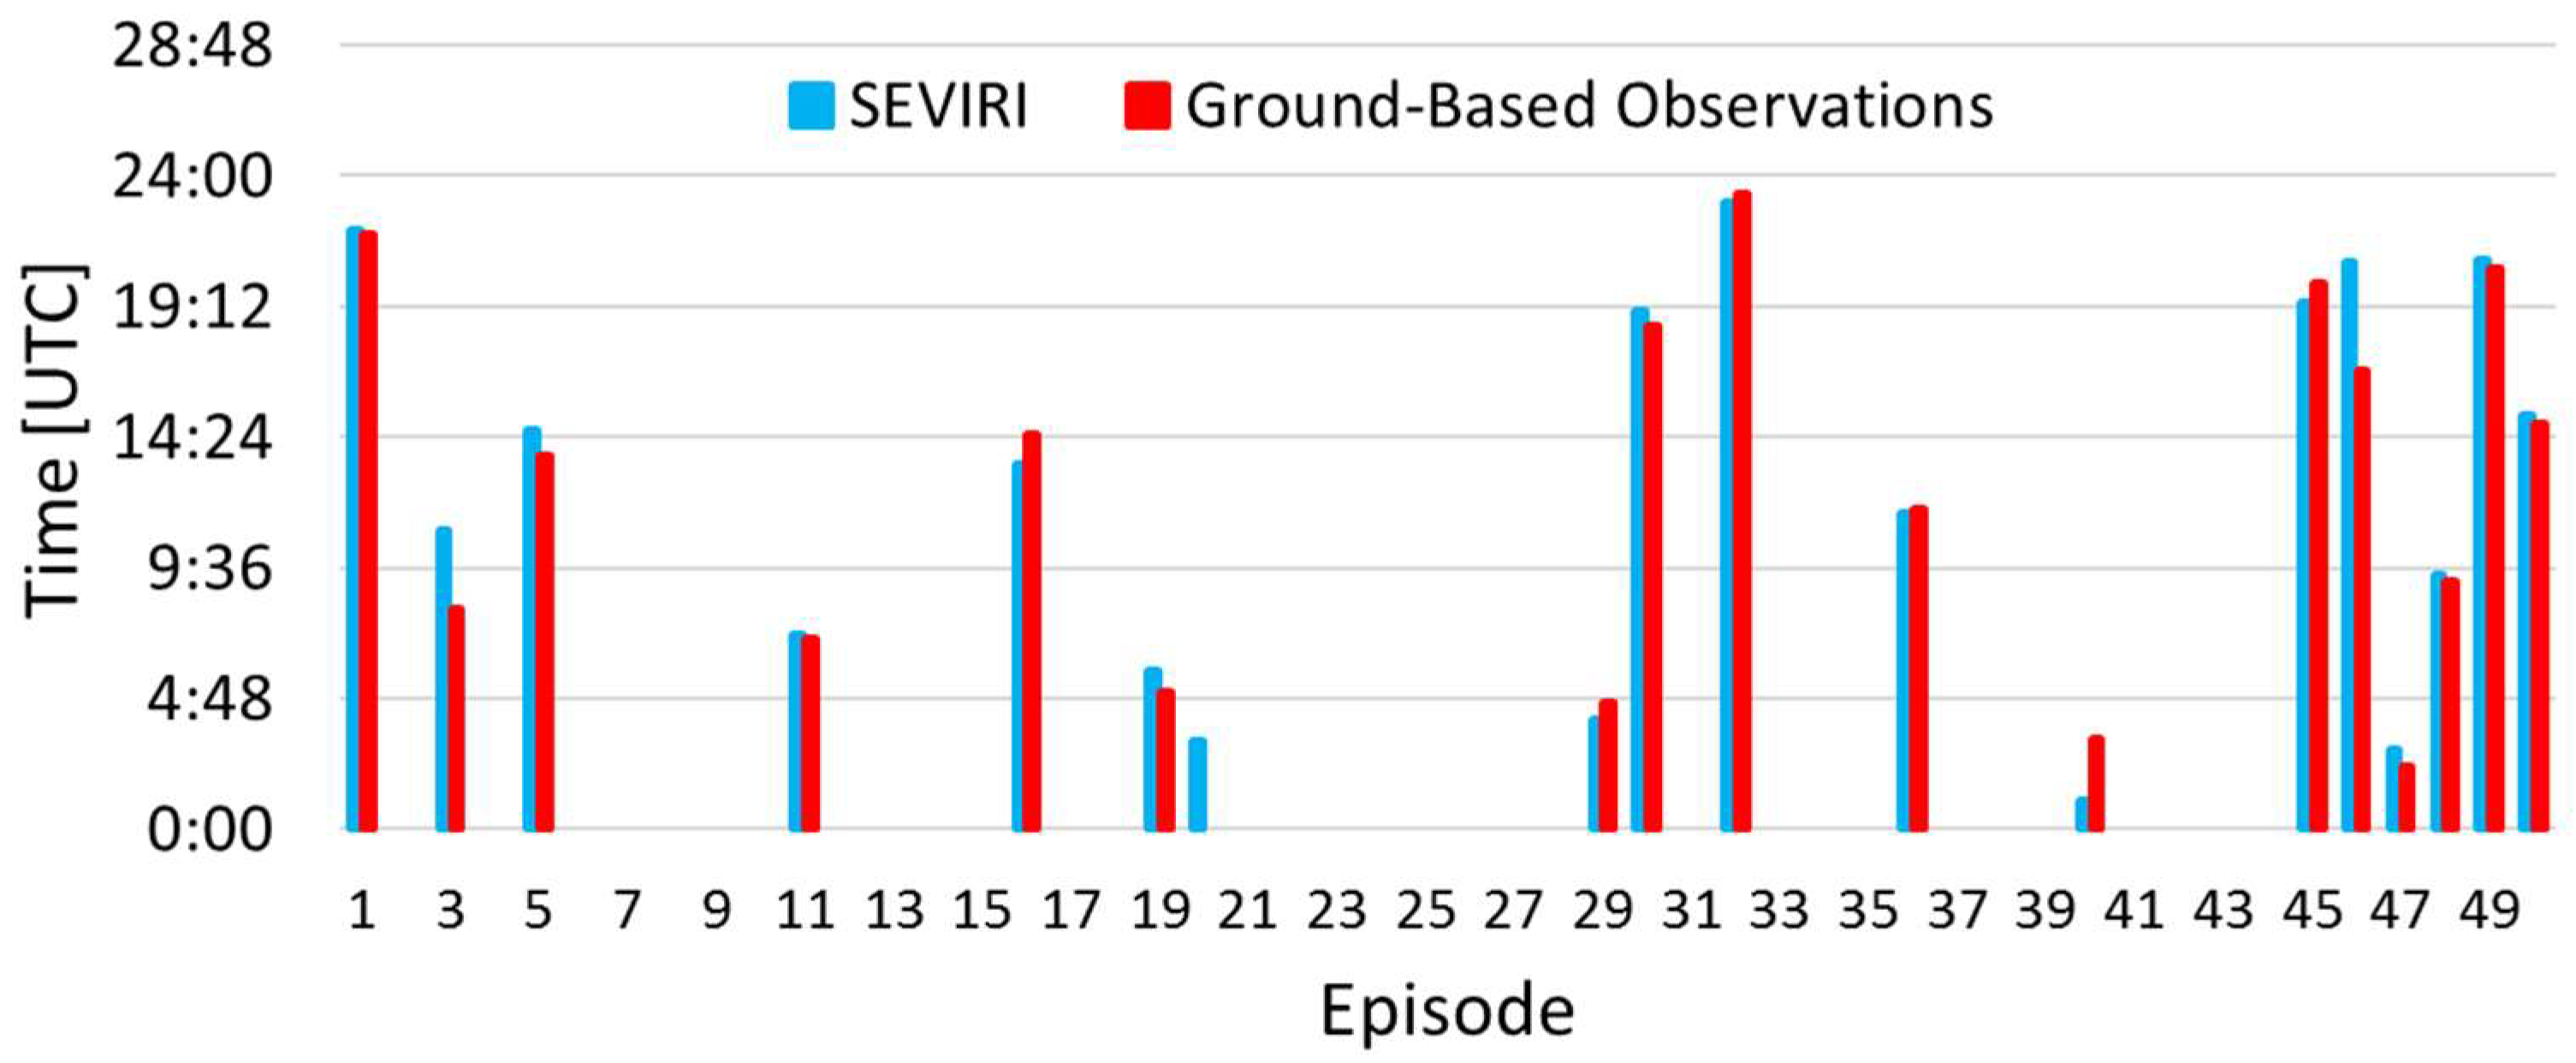
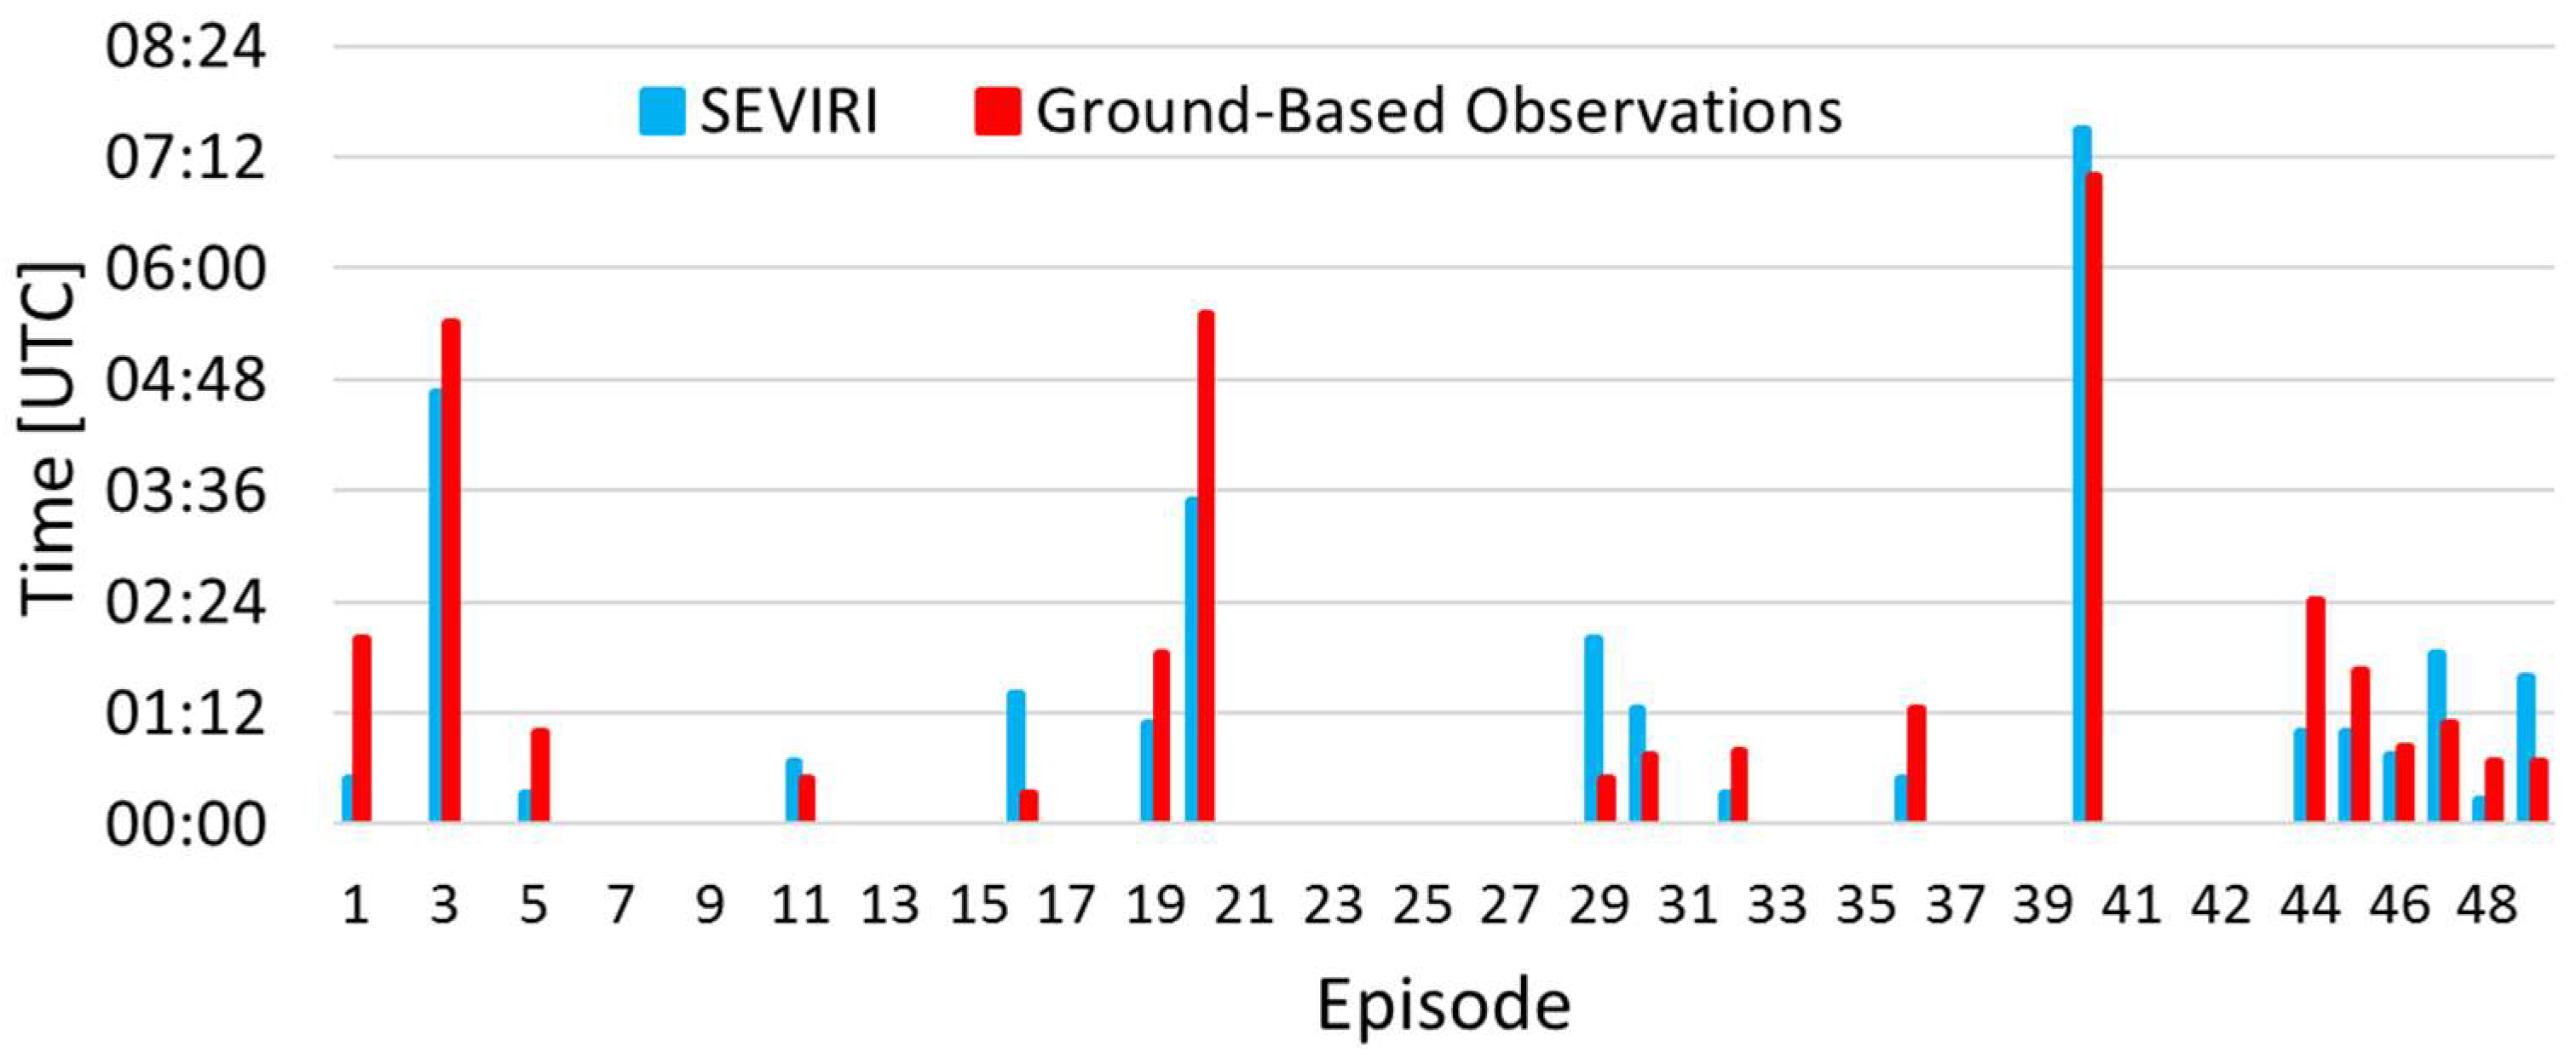
5.1. Eruption and Fountains Start and Duration

Being the high temperature source mainly caused by the presence of lava emission, the Eruption Start retrieved from SEVIRI (ES) has been compared with the “Start Lava emission” (SL) results published by Behncke et al. [10] and De Beni et al. [33], that were obtained from the analysis of the VIS-TIR ground based cameras placed at Etna and volcanological observations hereafter named ground-based observations.
The blue and red bars in Figure 6 represent the time differences (SL-ES) and (ES-SL) respectively. Following the latter definition, the blue bars indicate that, for a single event, SEVIRI is able to detect the lava emission before the VIS-TIR cameras, while the contrary is true for the red bars. As the figure shows, for the most of the eruption, the SEVIRI alert is given, on average, about 3 h before the ground-based alert. Possible reasons of this early SEVIRI alert could be the presence of the magma in the conduit or an increase of the strombolian activity that usually precede the lava emission.
Figure 7 and Figure 8 show time start and duration of the lava fountains estimated from SEVIRI and from ground-based observations.
Figure 7 indicates a good agreement for the start of the lava fountains, while greater differences are found for the duration time (Figure 8). The fountaining duration retrieved from SEVIRI can be lower than the duration obtained from the cameras because the plume could be too transparent to cause the drop of the SEVIRI 3.9 μm signal. The opposite (SEVIRI duration greater than ground-based observations) can be due to the presence of meteorological clouds not correctly detected.

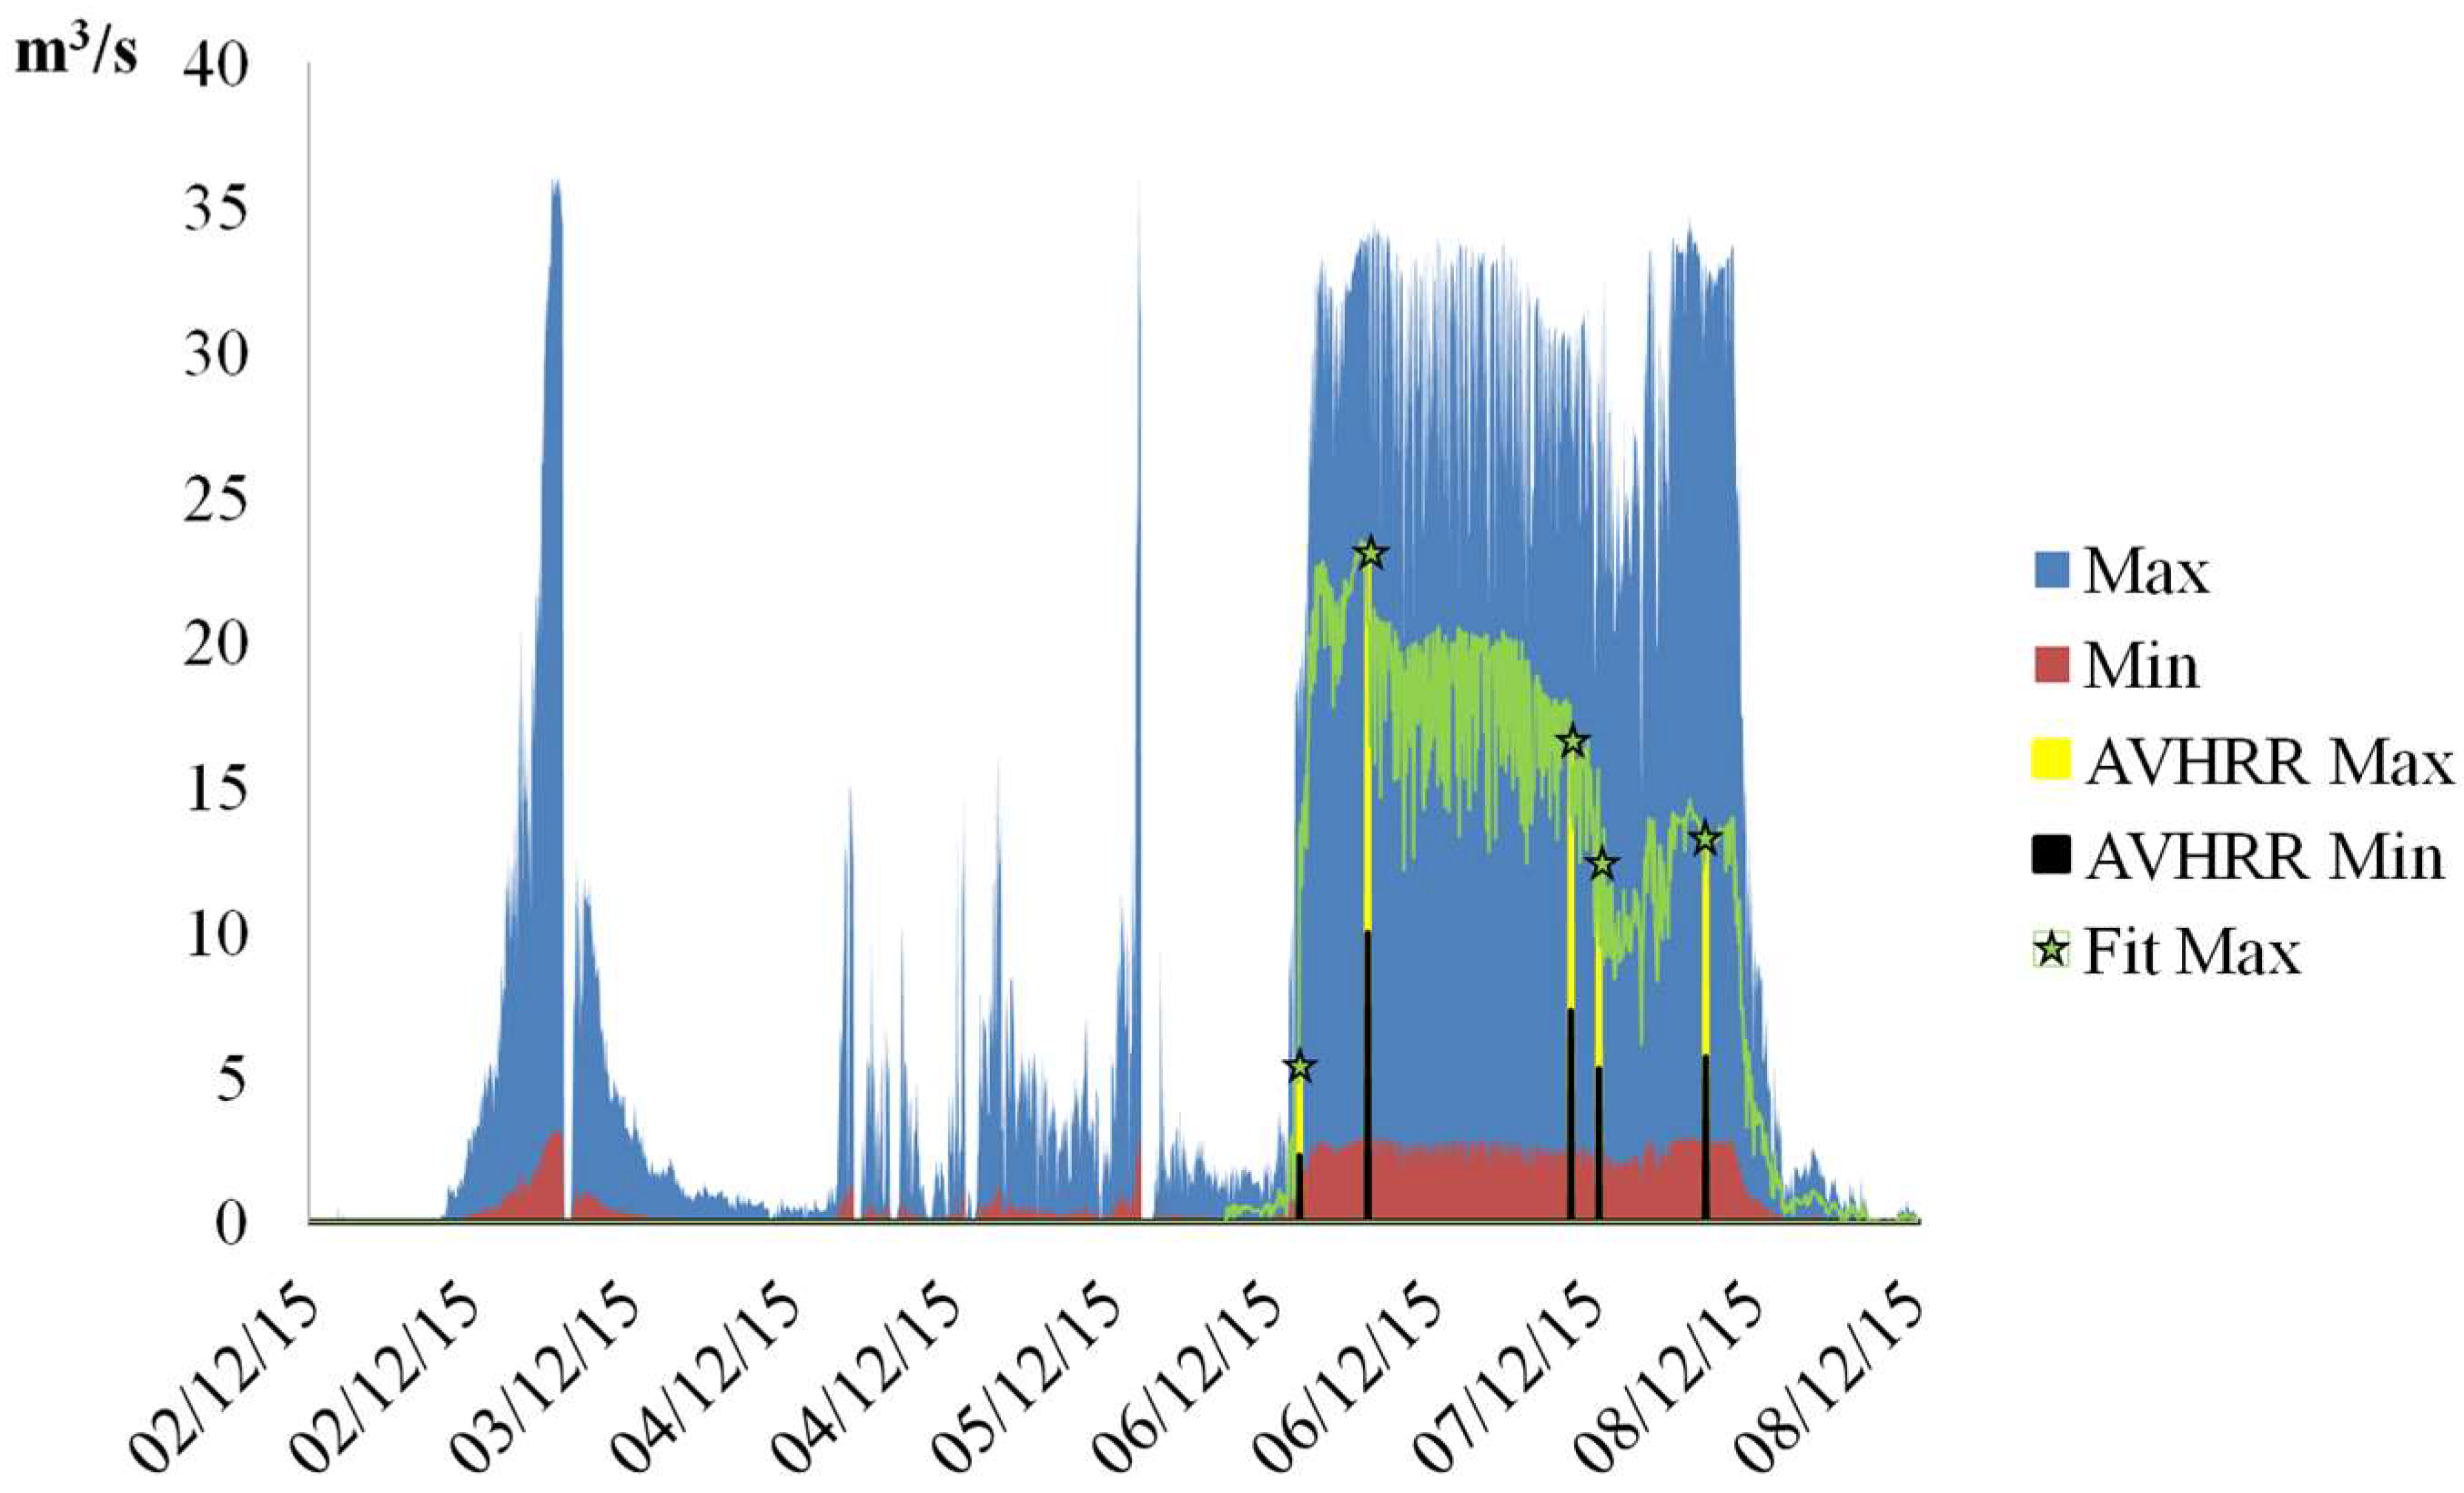
5.2. TADR Improvement Using AVHRR Data

The TADR accuracy can be improved by using remote sensing systems with higher spatial resolution compared to SEVIRI. Here the AVHRR data have been considered to constrain the SEVIRI time series. Figure 9 shows the minimum (black bars) and maximum (yellow bars) TADR derived from 5 images collected from 6 to 8 December 2015 by AVHRR. The green line shows the maximum SEVIRI derived TADR, rescaled using the maximum AVHRR derived TADR. SEVIRI values are corrected with each new AVHRR acquisition (green stars) as in the real-time case. Minimum values are not shown in the graph for clarity. Figure 9 shows that, even if only five cloud-free AVHRR images are available in this time frame, the TADR derived from AVHRR allows to reduce uncertainties in SEVIRI estimates by 40%. Constrained SEVIRI time series show a mean TADR of 12 m3/s that is in good agreement with the effusion rates of 10–15 m3/s measured by Corsaro et al. [16] from field data.

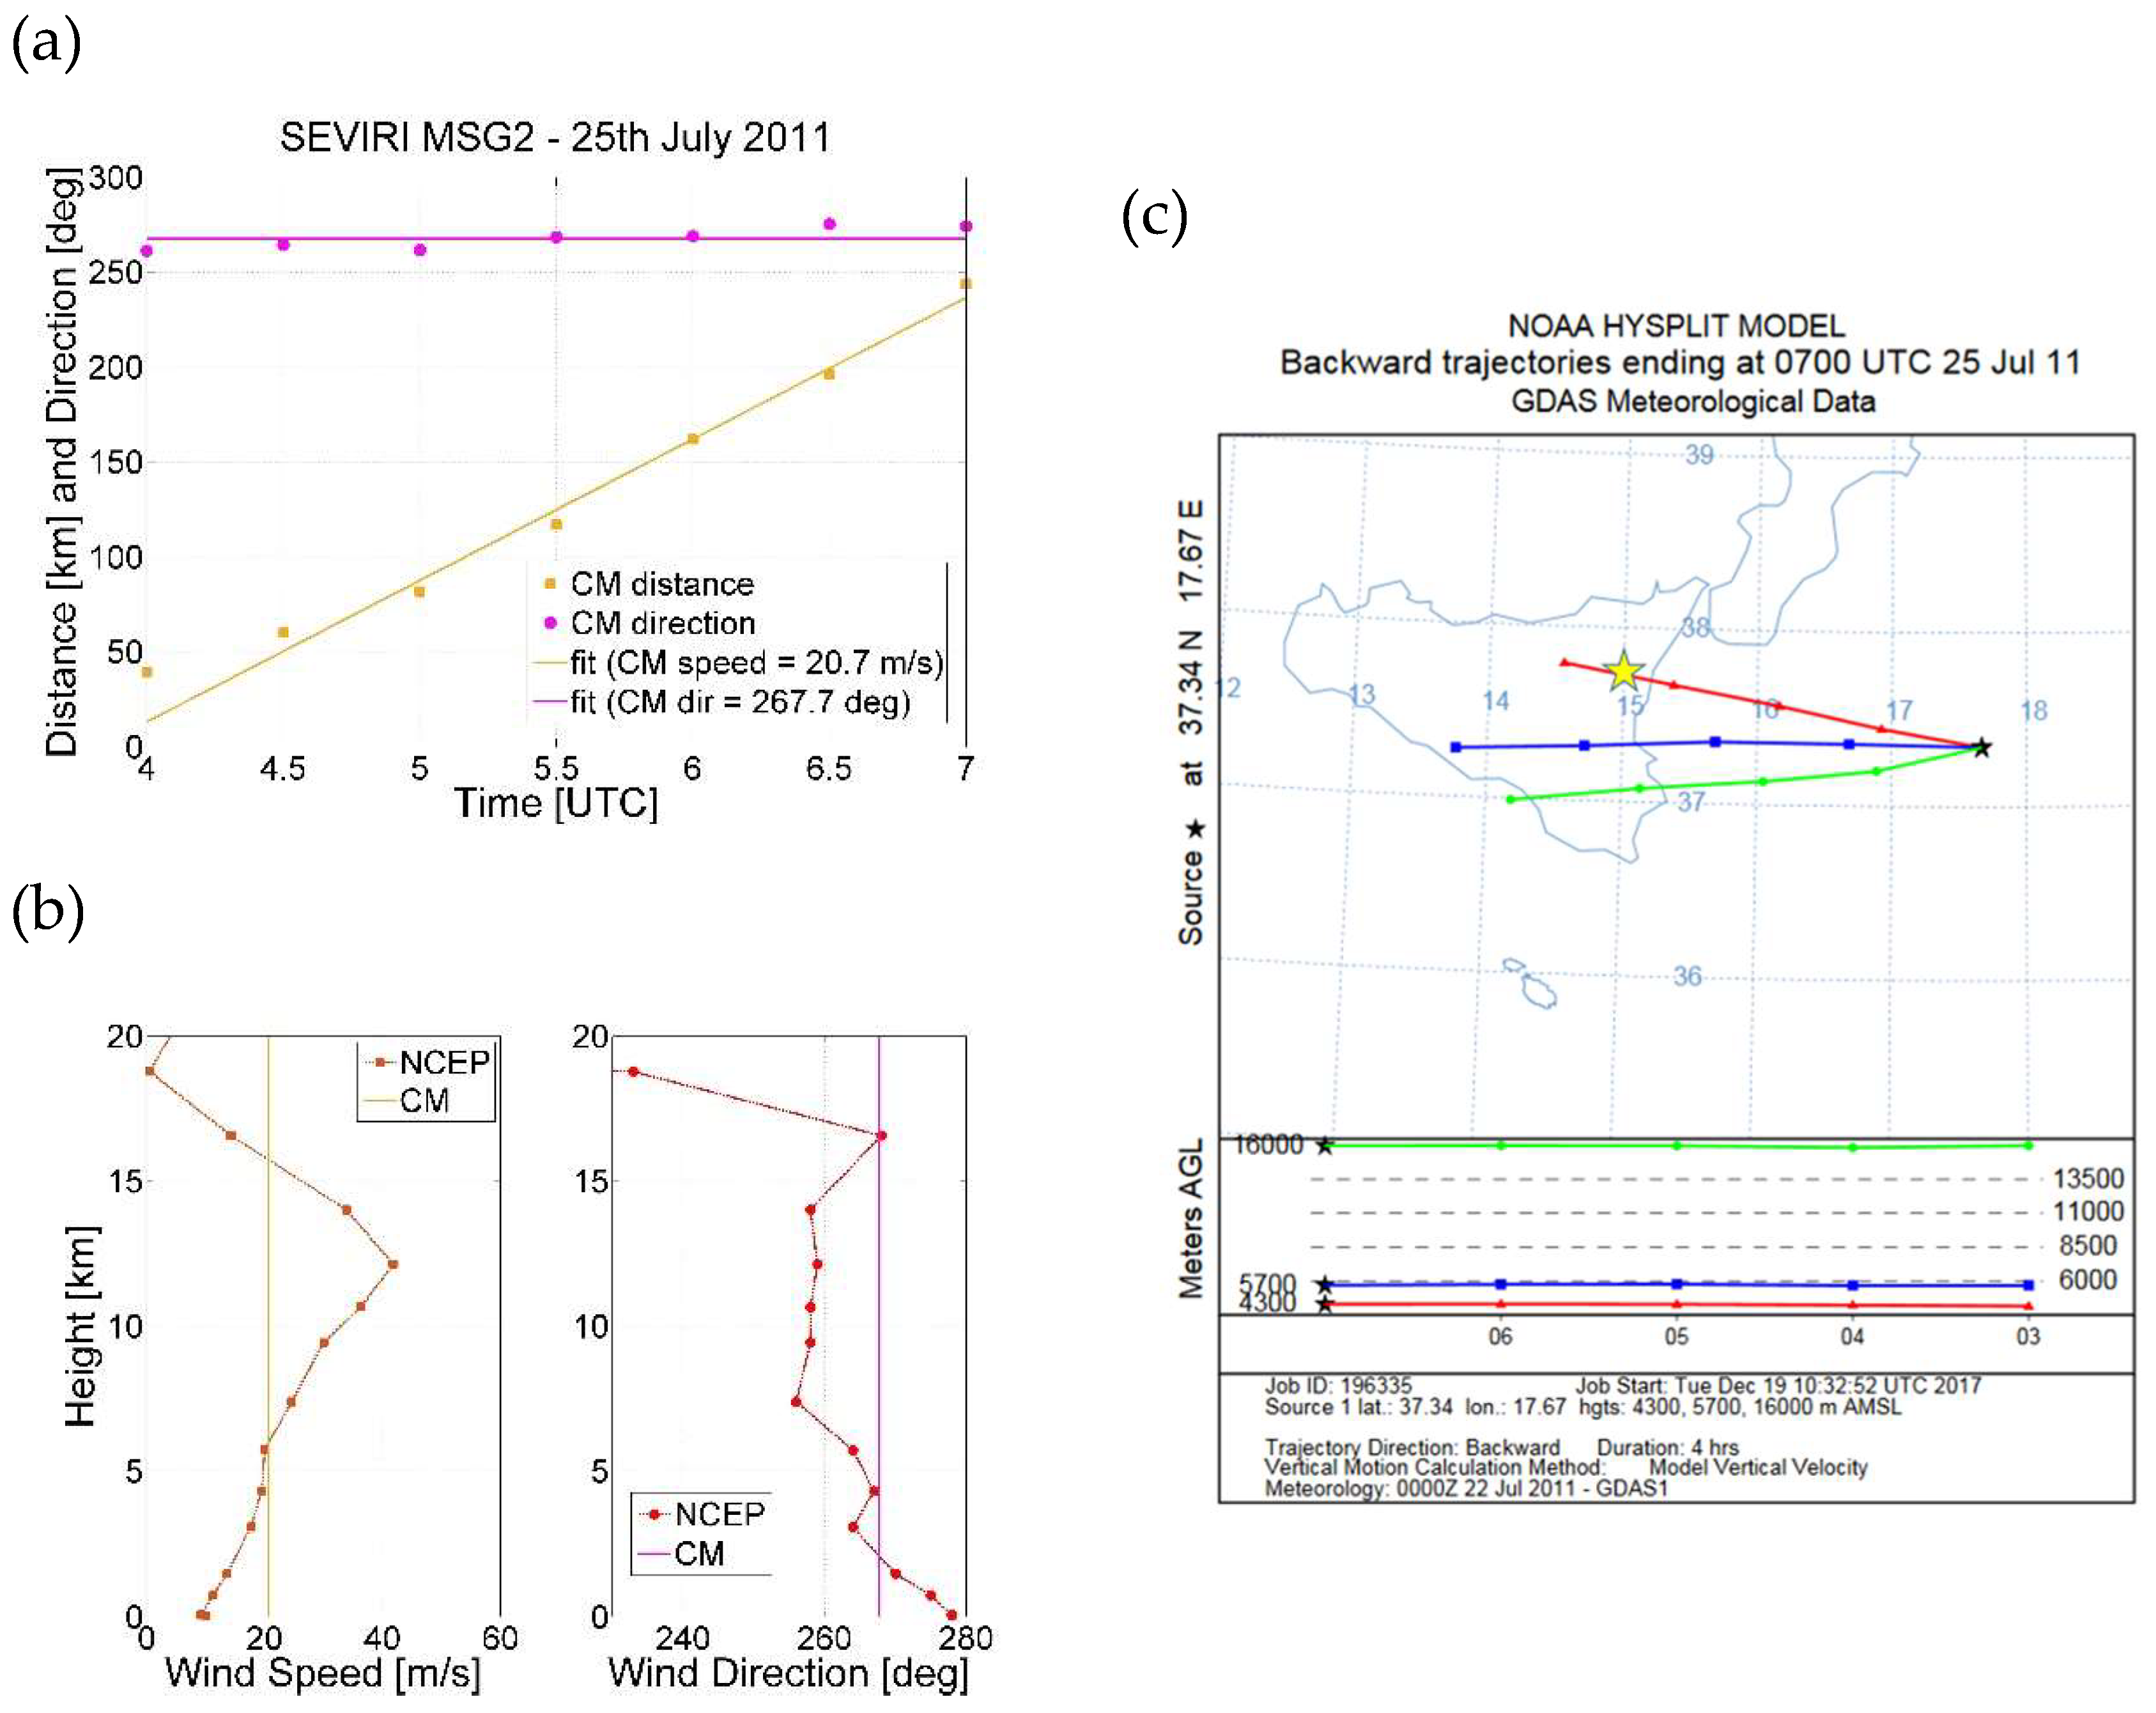
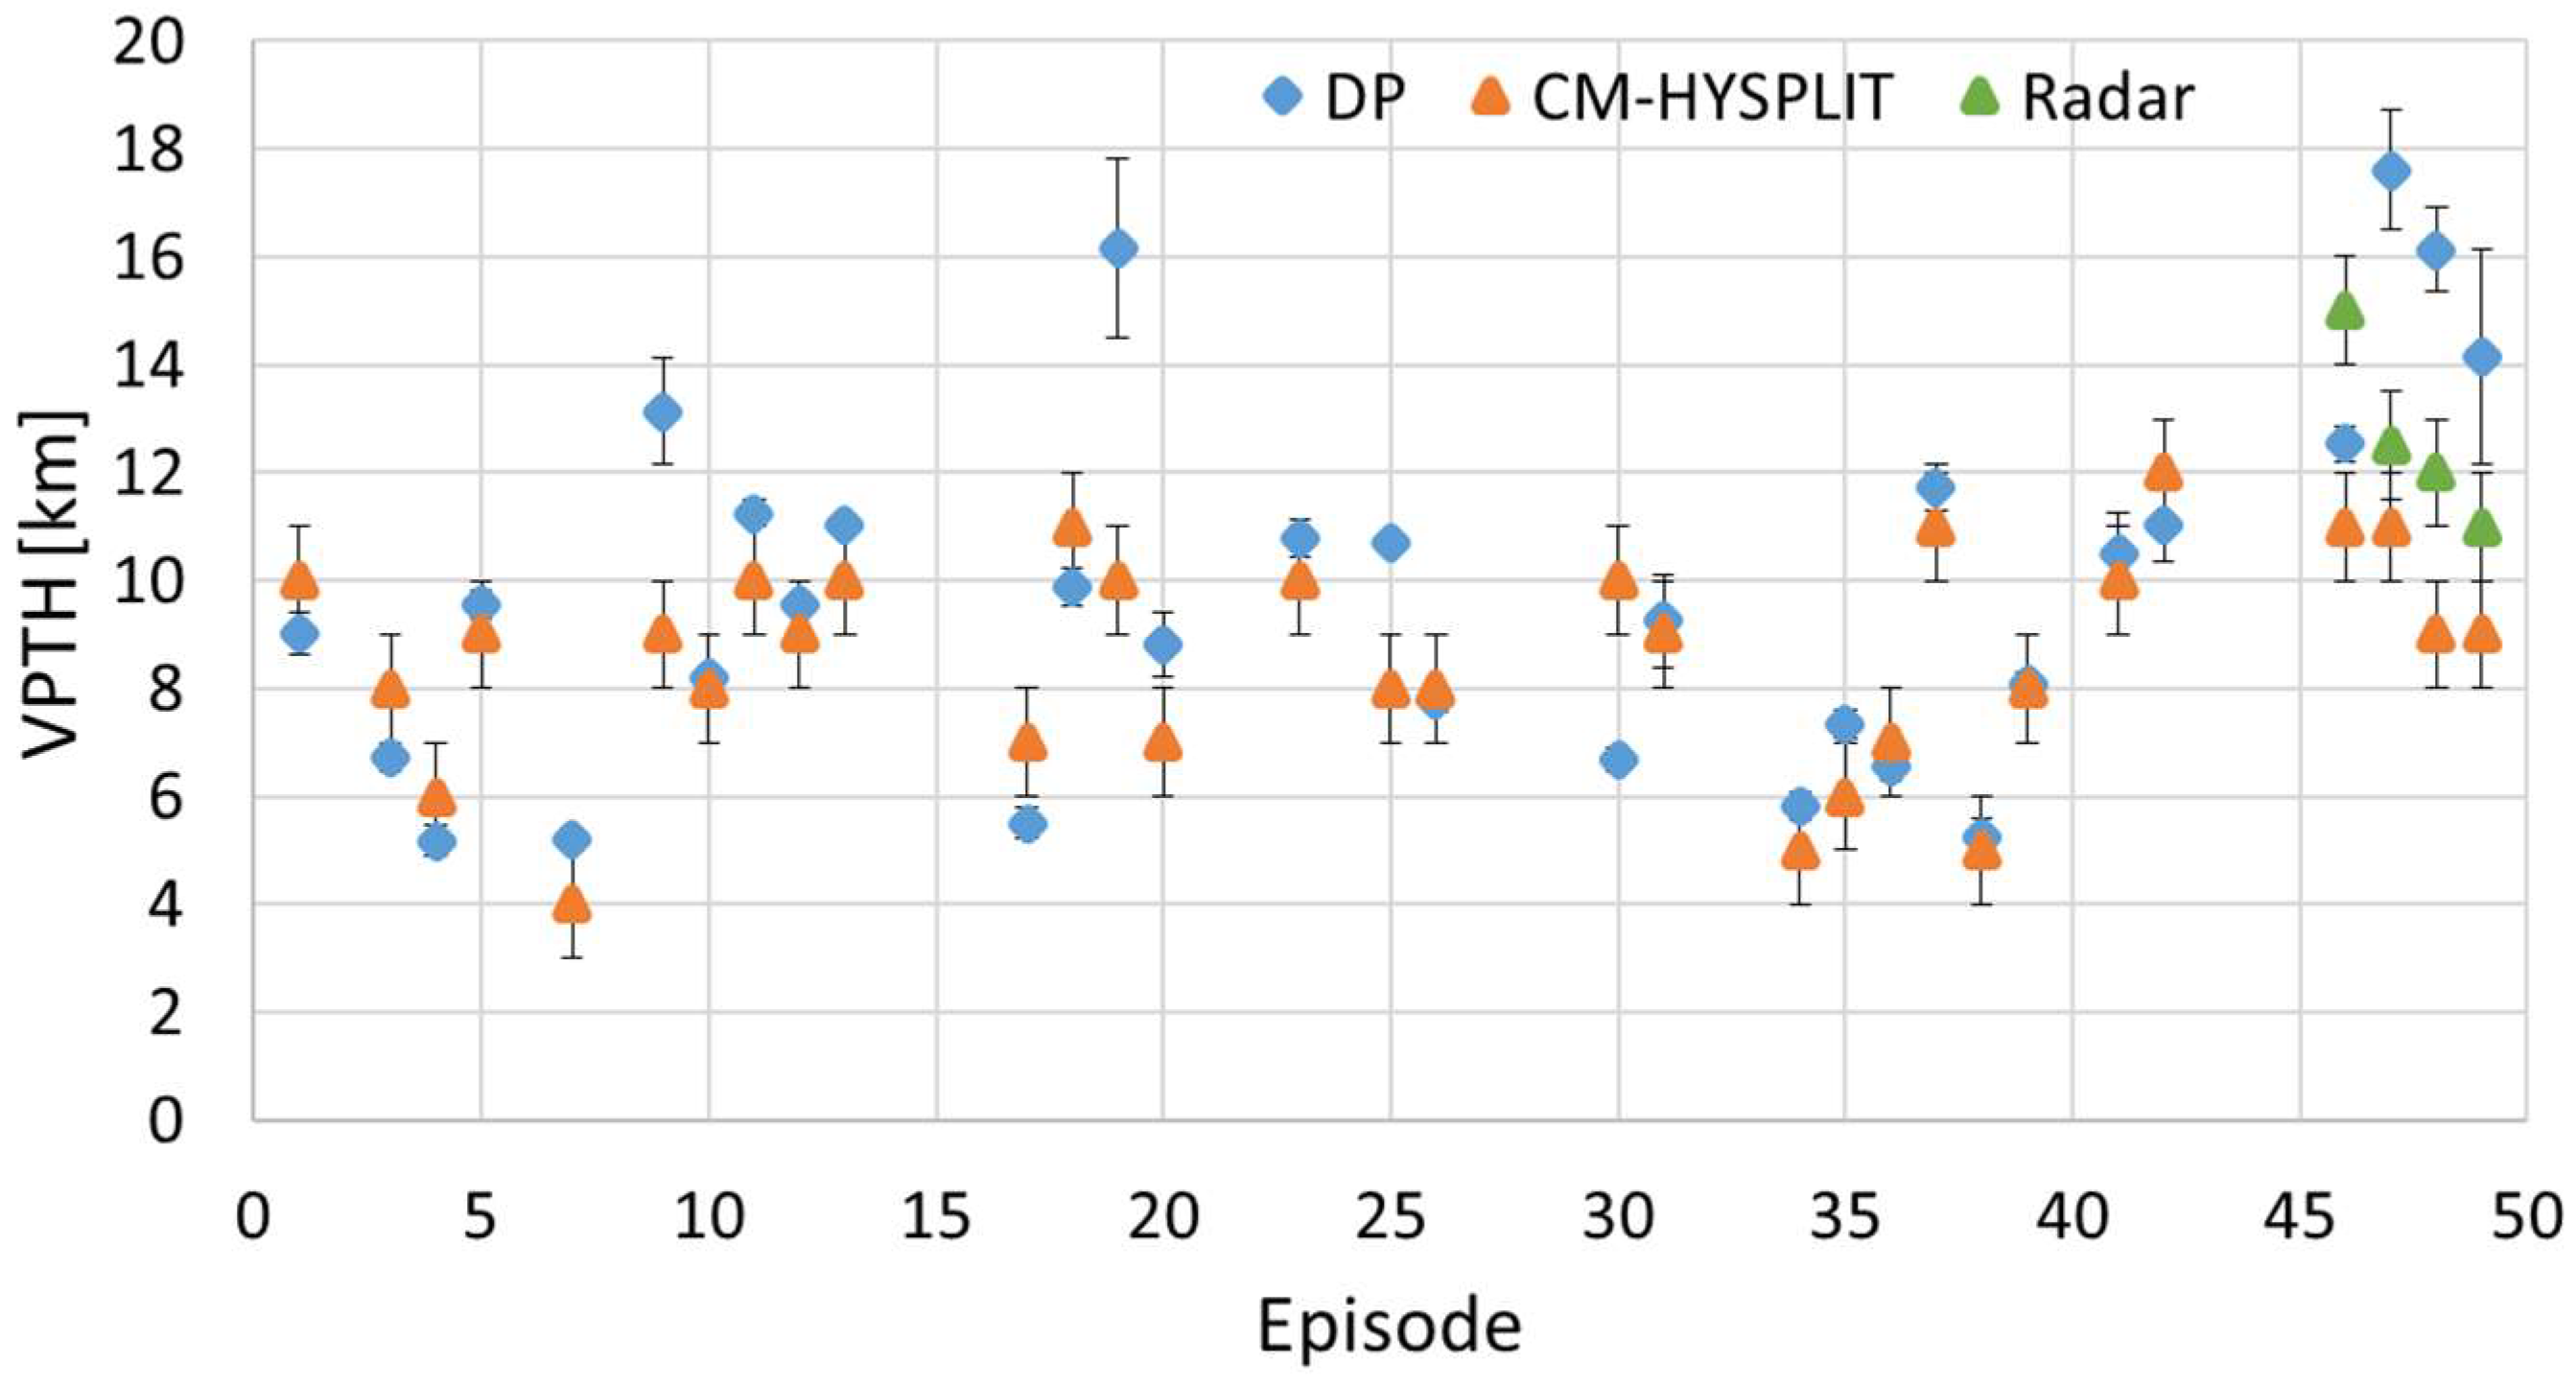
5.3. VPTH by Using the Tracking of the Ash Cloud Center of Mass and HYSPLIT Backtrajectories

The high data frequency of the SEVIRI images (every 15 or 5 min) can be exploited to retrieve wind speed and direction of the volcanic clouds for each event [34]. These terms were derived by applying the following steps:
  • retrieval of the ash abundance map from a given SEVIRI image [34];
  • identification of the ash cloud centre of mass;
  • computation of the ash centre of mass distance from the top of the volcano and the angle relative to the North.
The previous three steps are repeated for some subsequent SEVIRI images (at least 2–3 h from the start of the eruption). Using a linear fit, the speed (from distance and image time acquisition) and direction (from angle) of the volcanic cloud were obtained.
Basic assumption of this method is that the estimated peak speed is assumed to be the whole plume speed, which is the true wind speed at cloud altitude. Then, by comparing the wind speed and direction with the wind speed and direction of an atmospheric profile collected in the same time and position, the volcanic cloud altitude can be derived. For this purpose the National Centers for Environmental Prediction (NCEP)/National Center for Atmospheric Research (NCAR) reanalysis profiles [35] (resolution 2.5° × 2.5°) centered near the Etna volcano (37.5° N, 15.0° E) and collected close in time with the eruption start (time resolution 6 h) have been considered.
Due to the characteristics of the atmospheric wind speed and direction profiles, more than a single intersection with the wind speed and direction computed from the volcanic ash center of mass, can be found. For this reason, a procedure [36] based on HYSPLIT backtrajectories has been also considered [37,38,39]. By plotting several backtrajectories at different altitudes starting from a volcanic cloud detected several hours after the eruption, the correct volcanic cloud top height has been identified as the one corresponding to the trajectory that intersects Etna at the time of the eruption start.
Figure 10 shows an example of the volcanic cloud height estimation obtained by combining of the described methods (labelled in the following CM-HYSPLIT). The not univocal results obtained from wind speed (from 4.3 to 5.7 km and 16 km) and direction (4.3 and 16.5 km) are constrained by using the HYSPLIT backward trajectories obtaining for the plume height a final result of 4.3 km.
Figure 11 shows the comparison between the results obtained from the DP and the CM-HYSPLIT procedures. The figure shows a general good agreement, except for few dates (episode numbers: 9 and 19, respectively 5 August 2011 and 5 January 2012) and for the events of December 2015. These significant discrepancies can be due to an inertial overshoot of the plume and a consequent settling at the level of neutral buoyancy. Another reason can be that the volcanic cloud reaches the tropopause where the temperature profile is almost constant. This leads to big uncertainties on the VPTH estimation obtained with the DP procedure. For the December 2015 events, also the estimation made by a ground-based radar system collocated at Catania airport have been plotted [15]. As the figure shows, these measurements lie in between the DP and CM-HYSPLIT retrievals.

6. Conclusions

In this work the MSG-SEVIRI space-based measurements have been used for a proximal monitoring of the Etna lava fountain events occurred from 2011 to 2015.
Results show that the SEVIRI 3.9 μm radiance measurements can be exploited to estimate eruption start and duration and the volcanic cloud presence. In particular, the ash plume presence (recognized by the drop of the 3.9 μm signal) can be used to estimate the start and end of the lava fountains. The procedure considered is based on the comparison between the SEVIRI measurements with an historical threshold computed from the analysis of 5 years of satellite data.
The VPTHs, estimated by a simplified procedure based on the brightness temperature at 10.8 μm, indicates that more than the 60% of the VPTH’s are between 8 and 12 km with a height mean error of about 0.5 km.
The TADR results show the big uncertainties due to the unknown lava temperature and confirm the short-term but quite intense events occurred from 2011 to 2015. SEVIRI TADR estimates have been improved using the higher resolution AVHRR data, considering five cloud-free images collected during the 6–8 December 2015 event. The AVHRR TADR retrieved reduces the uncertainties in SEVIRI estimates by 40% with a mean value of 12 m3/s which is in good agreement with the effusion rates measured by Corsaro et al. [16].
As expected, the main limitation for all the procedures is due to the presence of the meteorological clouds over the volcanic area that can partially or completely mask the eruption signal.
The start and duration of eruption and fountaining activities have been compared with ground-based observations. The results indicate that, for the most of the eruption, SEVIRI is able to detect the start of the lava emission about 3 h before the ground measurements, while there is a good agreement for both the start and duration of the lava fountains with a mean difference of about 1 h and 50 min respectively.
VPTH has been compared with the results obtained with a procedure based on the combination of an algorithm based on the volcanic cloud center of mass tracking and the HYSPLIT back-trajectories. The results indicate a general good agreement with a mean difference of about 1 km. For the 2015 December events, the differences are greater because the volcanic plume reached the tropopause where the temperature profile is almost constant.

Acknowledgments

The work was part of the Conv. Allegato B2 INGV-DPC 2017 funded by the Italian Civil Protection. The authors gratefully acknowledge the NOAA Air Resources Laboratory (ARL) for the provision of the HYSPLIT transport and dispersion model and/or READY website (http://www.ready.noaa.gov) used in this publication.

Author Contributions

Stefano Corradini conceived and coordinated the work; Lorenzo Guerrieri analyzed the SEVIRI data for the computation of the volcanic cloud top height using CM-HYSPLIT procedures; Valerio Lombardo processed the SEVIRI 3.9 μm data for the TADR estimations; Luca Merucci and Dario Stelitano took part in the discussion of the presented work and prepared the SEVIRI data needed for the different processing; Massimo Musacchio and Malvina Silvestri processed the SEVIRI 3.9 μm data for the estimation of start/end of the eruptions and lava fountains; Michele Prestifilippo, Simona Scollo and Gaetano Spata processed the SEVIRI 10.8 μm data for the volcanic plume top height estimation using DP procedure.

Conflicts of Interest

The authors declare no conflict of interest.

References

  1. Corradini, S.; Montopoli, M.; Guerrieri, L.; Ricci, M.; Scollo, S.; Merucci, L.; Marzano, F.S.; Pugnaghi, S.; Prestifilippo, M.; Ventress, L.J.; et al. Multi-Sensor Approach for Volcanic Ash Cloud Retrieval and Eruption Characterization: The 23 November 2013 Etna Lava Fountain. Remote Sens. 2016, 8. [Google Scholar] [CrossRef]
  2. Merucci, L.; Zakšek, K.; Carboni, E.; Corradini, S. Stereoscopic estimation of volcanic cloud-top height from two geostationary satellites. Remote Sens. 2016, 8, 206. [Google Scholar] [CrossRef]
  3. Prata, A.J.; Kerkmann, J. Simultaneous retrieval of volcanic ash and SO2 using MSG-SEVIRI measurements. Geophys. Res. Lett. 2007, 34, L05813. [Google Scholar] [CrossRef]
  4. Corradini, S.; Merucci, L.; Prata, A.J. Retrieval of SO2 from Thermal Infrared Satellite Measurements: Correction Procedures for the Effects of Volcanic Ash. Atmos. Meas. Tech. 2009, 2, 177–191. [Google Scholar] [CrossRef]
  5. Merucci, L.; Burton, M.; Corradini, S.; Salerno, G. Reconstruction of SO2 flux emission chronology from space-based measurements. J. Volcanol. Geotherm. Res. 2011. [Google Scholar] [CrossRef]
  6. Harris, A.J.L.; Blake, S.; Rothery, D.A.; Stevens, N.F. A chronology of the 1991 to 1993 Etna eruption using AVHRR data: Implications for real time thermal volcano monitoring. J. Geophys. Res. 1997, 102, 7985–8003. [Google Scholar] [CrossRef]
  7. Wooster, M.J.; Rothery, D.A. Time series analysis of effusive volcanic activity using the ERS along track scanning radiometer: The 1995 eruption of Fernandina volcano, Galapagos Island. Remote Sens. Environ. 1997, 69, 109–117. [Google Scholar] [CrossRef]
  8. Ganci, G.; Harris, A.J.L.; Del Negro, C.; Guehenneux, Y.; Cappello, A.; Labazuy, P.; Calvari, S.; Gouhier, M. A year of lava fountaining at Etna: Volumes from SEVIRI. Geophys. Res. Lett. 2012, 39, L06305. [Google Scholar] [CrossRef]
  9. Scollo, S.; Boselli, A.; Coltelli, M.; Leto, G.; Pisani, G.; Prestifilippo, M.; Spinelli, N.; Wang, X. Volcanic ash concentration during the 12 August 2011 Etna eruption. Geophys. Res. Lett. 2015, 42. [Google Scholar] [CrossRef]
  10. Behncke, B.; Branca, S.; Corsaro, R.A.; De Beni, E.; Miraglia, L.; Proietti, C. The 2011–2012 summit activity of Mount Etna: Birth, growth and products of the new SE crater. J. Volcanol. Geotherm. Res. 2014, 270, 10–21. [Google Scholar] [CrossRef]
  11. Scollo, S.; Prestifilippo, M.; Pecora, E.; Corradini, S.; Merucci, L.; Spata, G.; Coltelli, M. Eruption column height estimation of the 2011–2013 Etna lava fountains. Ann. Geophys. 2014, 57. [Google Scholar] [CrossRef] [Green Version]
  12. International Civil Aviation Organization (ICAO). Volcanic Ash Contingency Plan—Eur and Nat Regions; EUR Doc 019–NAT Doc 006, Part II; International Civil Aviation Authority: Montreal, QC, Canada, 2010. [Google Scholar]
  13. Andronico, D.; Scollo, S.; Cristaldi, A. Unexpected hazards from tephra fallouts at Mt Etna: The 23 November 2013 lava fountain. J. Volcanol. Geotherm. Res. 2015, 304, 118–125. [Google Scholar] [CrossRef]
  14. Bonaccorso, S.; Calvari, S.; Linde, A.; Sacks, S. Eruptive processes leading to the most explosive lava fountain at Etna volcano: The 23 November 2013 episode. Geophys. Res. Lett. 2014, 41, 4912–4919. [Google Scholar] [CrossRef]
  15. Vulpiani, G.; Ripepe, M.; Valade, S. Mass discharge rate retrieval combining weather radar and thermal camera observations. J. Geophys. Res. Solid Earth 2016, 121, 5679–5695. [Google Scholar] [CrossRef]
  16. Corsaro, R.A.; Andronico, D.; Behncke, B.; Branca, S.; Caltabiano, T.; Ciancitto, F.; Cristaldi, A.; De Beni, E.; La Spina, A.; Lodato, L.; et al. Monitoring the December 2015 summit eruptions of Mt. Etna (Italy): Implications on eruptive dynamics. J. Volcanol. Geotherm. Res. 2017. [Google Scholar] [CrossRef]
  17. Matson, M.; Dozier, J. Identification of subresolution high temperature sources using a thermal IR sensor. Photogramm. Eng. Remote Sens. 1981, 47, 1311–1318. [Google Scholar]
  18. Dozier, J. A method for satellite identification of surface temperature fields of subpixel resolution. Remote Sens. Environ. 1981, 11, 221–229. [Google Scholar] [CrossRef]
  19. Rothery, D.A.; Francis, P.; Wood, W. Volcano monitoring using short wavelength infrared data from satellite. J. Geophys. Res. 1988, 93, 7993–8008. [Google Scholar] [CrossRef]
  20. Sobrino, J.A.; Romaguera, M. Land surface temperature retrieval from MSG1-SEVIRI data. Remote Sens. Environ. 2004, 92, 247–254. [Google Scholar] [CrossRef]
  21. Musacchio, M.; Silvestri, M.; Buongiorno, M.F. Use of radiance value from MSG SEVIRI and MTSAT data: Application for the monitoring on volcanic area. In Proceedings of the 2011 EUMETSAT Meteorological Satellite Conference, Oslo, Norway, 5–9 September 2011. [Google Scholar]
  22. Musacchio, M.; Silvestri, M.; Buongiorno, M.F. RT Monitoring of active volcanoes: MT Etna. In Proceedings of the Sea Space International Remote Sensing Conference, Seaspace Corporation, San Diego, CA, USA, 21–24 October 2012. [Google Scholar]
  23. Gouhier, M.; Harris, A.J.L.; Calvari, S.; Labazuy, P.; Guéhenneux, Y.; Donnadieu, F.; Valade, S. Erratum to: Lava discharge during Etna’s January 2011 fire fountain tracked using MSG-SEVIRI. Bull. Volcanol. 2012, 74, 1261. [Google Scholar] [CrossRef]
  24. Wright, R.; Blake, S.; Harris, A.J.L.; Rothery, D. A Simple explanation for the space-based calculation of lava eruptions rates. Earth Planet. Sci. Lett. 2001, 192, 223–233. [Google Scholar] [CrossRef]
  25. Lombardo, V. AVHotRR: Near-real time routine for volcano monitoring using IR satellite data. Geol. Soc. Lond. 2015, 426. [Google Scholar] [CrossRef]
  26. Harris, A.J.L.; Baloga, S.M. Lava discharge rates from satellite measured heat flux. Geophys. Res. Lett. 2009, 36, L19302. [Google Scholar] [CrossRef]
  27. Harris, A.J.L.; Favalli, M.; Steffke, A.; Fornaciai, A.; Boschi, E. A relation between lava discharge rate, thermal insulation, and flow area set using Lidar data. Geophys. Res. Lett. 2010, 37, L20308. [Google Scholar] [CrossRef]
  28. Ganci, G.; Vicari, A.; Fortuna, L.; Del Negro, C. The HOTSAT volcano monitoring system based on a combined use of SEVIRI and MODIS multispectral data. Ann. Geophys. 2011, 54. [Google Scholar] [CrossRef]
  29. Hirn, B.; Ferrucci, F.; Di Bartola, C. Near-tactical eruption rate monitoring of Pu’u O’o (Hawaii) 2000–2005 by synergetic merge of payloads ASTER and MODIS. In Proceedings of the IEEE International Geoscience and Remote Sensing Symposium, IGARSS 2007, Barcelona, Spain, 23–28 July 2007; pp. 3744–3747. [Google Scholar] [CrossRef]
  30. Govaerts, Y.; Arriaga, A.; Schmetz, J. Operational vicarious calibration of the MSG/SEVIRI solar channels. Adv. Space Res. 2001, 28, 21–30. [Google Scholar] [CrossRef]
  31. Prata, A.J.; Grant, I.F. Retrieval of microphysical and morphological properties of volcanic ash plumes from satellite data: Application to Mt Ruapehu, New Zealand. Q. J. R. Meteorol. Soc. 2001, 127, 2153–2179. [Google Scholar] [CrossRef]
  32. Corradini, S.; Spinetti, C.; Carboni, E.; Tirelli, C.; Buongiorno, M.F.; Pugnaghi, S.; Gangale, G. Mt. Etna tropospheric ash retrieval and sensitivity analysis using Moderate Resolution Imaging Spectroradiometer measurements. J. Appl. Remote Sens. 2008, 2, 023550. [Google Scholar] [CrossRef]
  33. De Beni, E.; Behncke, B.; Branca, S.; Nicolosi, I.; Carluccio, R.; D’Ajello Caracciolo, F.; Chiappini, M. The continuing story of Etna’s New Southeast Crater (2012–2014): Evolution and volume calculations based on field surveys and aerophotogrammetry. J. Volcanol. Geotherm. Res. 2015, 303, 175–186. [Google Scholar] [CrossRef]
  34. Guerrieri, L.; Merucci, L.; Corradini, S.; Pugnaghi, S. Evolution of the 2011 Mt. Etna ash and SO2 lava fountain episodes using SEVIRI data and VPR retrieval approach. J. Volcanol. Geotherm. Res. 2015, 291, 63–71. [Google Scholar] [CrossRef]
  35. The NCEP/NCAR Reanalysis Project at the NOAA/ESRL Physical Sciences Division. Available online: http://www.esrl.noaa.gov/psd/data/reanalysis/reanalysis.shtml (accessed on 1 December 2017).
  36. Pardini, F.; Burton, M.; de’ Michieli Vitturi, M.; Corradini, S.; Salerno, G.; Merucci, L.; Di Grazia, G. Retrieval and intercomparison of volcanic SO2 injection height and eruption time from satellite maps and ground-based observations. J. Volcanol. Geotherm. Res. 2016. [Google Scholar] [CrossRef]
  37. Draxler, R.R. HYSPLIT4 User’s Guide; NOAA Tech. Memo. ERL ARL-230; NOAA Air Resources Laboratory: Silver Spring, MD, USA, 1999.
  38. Stein, A.F.; Draxler, R.R.; Rolph, G.D.; Stunder, B.J.B.; Cohen, M.D.; Ngan, F. NOAA’s HYSPLIT atmospheric transport and dispersion modeling system. Bull. Am. Meteorol. Soc. 2015, 96, 2059–2077. [Google Scholar] [CrossRef]
  39. Rolph, G.; Stein, A.; Stunder, B. Real-time Environmental Applications and Display sYstem: READY. Environ. Model. Softw. 2017, 95, 210–228. [Google Scholar] [CrossRef]
Figure 1. On the left: Spinning Enhanced Visible and InfraRed Imager (SEVIRI) image at 3.9 μm and zoom on Etna area. On the right: details of the pixels centered on Etna craters (red) and the surrounding 5 × 5 pixels (blue) considered for the start and duration eruption computation.
Geosciences 08 00140 g001
Figure 2. Data for 17 April 2013 (a) and 5 January 2012 (b) test cases. In these plots, the dashed, solid and dotted lines represent the Dynamic Threshold (DT(t)), the radiance at 3.9 μm of the pixel centered on Etna summit craters, and the Differences of Radiance (DR(t)) respectively.
Geosciences 08 00140 g002aGeosciences 08 00140 g002b
Figure 3. Atmospheric temperature profile derived from the ARPA-SIM model at 10:00 UTC the 23 November 2013. The dashed vertical line represents the Tb,10.8 of the most opaque pixels obtained from the SEVIRI image collected at 10:00 UTC (−53 °C). The horizontal dashed line represents the estimated VPTH (11.1 km). The vertical and horizontal dotted gray lines represent the uncertainty on Tb,10.8 and VPTH respectively.
Geosciences 08 00140 g003
Figure 4. The 3.9 μm radiance from 2 to 5 December 2015. Different characteristics of the eruption are shown: start, end, saturation, presence of volcanic plume and meteorological clouds. The satellite images displayed on the top highlight the different plot signatures.
Geosciences 08 00140 g004
Figure 5. Time Averaged Discharge Rate (TADR) time series derived from SEVIRI 3.9 μm images during 2011–2015 Etna’s lava fountains. Blue and red values are maximum and minimum derived TADR respectively.
Geosciences 08 00140 g005aGeosciences 08 00140 g005b
Figure 6. Time differences between the eruption start retrieved from SEVIRI (ES) data and the lava emission start time as derived from ground-based observations (SL). The blue and red bars represent the time differences (SL-ES) and (ES-SL) respectively.
Geosciences 08 00140 g006
Figure 7. Fountaining starts retrieved from SEVIRI (red bars) and from ground-based observations (blue bars).
Geosciences 08 00140 g007
Figure 8. Lava fountains durations retrieved from SEVIRI (red bars) and from ground-based visible (VIS) to Thermal InfraRed (TIR) (VIS/TIR) observations (blue bars).
Geosciences 08 00140 g008
Figure 9. TADR estimated from 5 advanced very-high-resolution radiometer (AVHRR) images collected from 6 to 8 December 2015 (yellow and black values are maximum and minimum TADR respectively). The green line shows the maximum SEVIRI derived TADR constrained using the maximum AVHRR derived TADR.
Geosciences 08 00140 g009
Figure 10. Example of the CM and HYSPLIT procedures combination for the 25 July 2011 event. (a): distance (yellow) and direction (magenta) of the cloud center of mass referring to the Etna position. (b): comparison between the volcanic cloud speed (yellow vertical line) and direction (magenta vertical line) with the wind speed (orange profile) and direction (red profile) extracted from NCEP. (c): HYSPLIT backtrajectories for different altitudes (the yellow star indicates the Etna position).
Geosciences 08 00140 g010
Figure 11. Comparison between the VPTH estimated from DP and CM-HYSPLIT procedures. Also, the ground based radar VPTH estimation, for the December 2015 events, have been considered.
Geosciences 08 00140 g011
Table 1. Timing of the different phases and duration recognized for all the 2011–2015 events for both the eruption and lava fountains derived from the MS2RWS procedure applied to the 3.9 μm SEVIRI measurements. The last column indicates the Volcanic Plume Top Height (VPTH) estimated by considering the DP approach. In grey the date with a complete meteorological cloud cover. All start and end times are in UTC.
Reference DateEpisode NumberStart EruptionStart FountainingEnd FountainingEnd EruptionDuration Lava EmissionDuration FountainingVPTH [Km]
12/01/2011112/01/2011 19:3012/01/2011 22:0012/01/2011 22:3013/01/2011 03:007:3000:309.0 +/− 0.4
18/02/20112//////
10/04/2011309/04/2011 19:0010/04/2011 11:0010/04/2011 15:4011/04/2011 23:5052:5004:406.7 +/− 0.3
12/05/2011411/05/2011 18:35//12/05/2011 23:5029:15/5.2 +/− 0.3
09/07/2011509/07/2011 09:2509/07/2011 14:4009/07/2011 15:0010/07/2011 11:2526:0000:209.6 +/− 0.3
19/07/2011618/07/2011 20:45//20/07/2011 04:0031:15//
25/07/2011724/07/2011 20:50//26/07/2011 02:4529:55/5.2 +/− 0.3
30/07/2011830/07/2011 07.25//31/07/2011 10:4027:15//
05/08/2011905/08/2011 19:45//06/08/2011 10:3514:50/13.1 +/− 1.0
12/08/20111012/08/2011 05:50//13/08/2011 08:2026:30/8.2 +/− 0.3
20/08/20111120/08/2011 03:4020/08/2011 07:1020/08/2011 07:5021/08/2011 05:3525:5500:4011.2 +/− 0.3
29/08/20111228/08/2011 23:25//29/08/2011 16:2016:55/9.6 +/− 0.3
08/09/20111308/09/2011 06:15//09/09/2011 09:1527:00/11.0 +/− 0.3
19/09/201114///////
28/09/201115///////
08/10/20111608/10/2011 12:2508/10/2011 13:2508/10/2011 14:5009/10/2011 03:4015:1501:25/
23/10/20111723/10/2011 17:40//24/10/2011 04:3010:50/5.5 +/− 0.3
15/11/20111815/11/2011 10:15//15/11/2011 20:4510:30/9.9 +/− 0.4
05/01/20121905/01/2012 01:1005/01/2012 05:5005/01/2012 06:5505/01/2012 20:1519:0501:0516.2 +/− 1.7
09/02/20122008/02/2012 19:0009/02/2012 03:1509/02/2012 06:4509/02/2012 06:1511:1503:308.8 +/− 0.6
04/03/201221///////
18/03/20122218/03/2012 04:50//19/03/2012 04:1523:25/11.0 +/− 0.4
01/04/20122331/03/2012 22:40//02/04/2012 01:3526:55/10.8 +/− 0.4
12/04/20122412/04/2012 11:45//12/04/2012 23:3011:45//
24/04/20122523/04/2012 03:30//24/04/2012 12:5033:20/10.7 +/− 0.2
19/02/20132619/02/2013 02:30/////7.8 +/− 0.3
20/02/201327///////
20/02/201328///////
21/02/201329/21/02/2013 04:0021/02/2013 06:00//02:00/
23/02/201330/23/02/2013 19:0023/02/2013 20:1523/02/2013 18:45/01:156.7 +/− 0.3
28/02/20133128/02/2013 08:45//28/02/2013 23:3013:45/9.3 +/− 0.9
05/03/20133205/03/2013 20:0005/03/2013 23:0005/03/2013 23:2007/03/2013 03:0531:0500:20/
16/03/20133316/03/2013 11:20//17/03/2013 04:4517:25//
03/04/20133403/04/2013 10:40//04/04/2013 04:4017:59/5.8 +/− 0.3
12/04/20133511/04/2013 11:15//13/04/2013 04:0040:45/7.3 +/− 0.3
18/04/20133618/04/2013 07:2518/04/2013 11:3518/04/2013 12:0519/04/2013 04:3021:0500:306.6 +/− 0.3
20/04/20133719/04/2013 23:00//21/04/2013 03:0528:05/11.7 +/− 0.4
27/04/20133827/04/2013 13:35//28/04/2013 07:3017:55/5.2 +/− 0.4
26/10/20133925/10/2013 19:20//27/10/2013 21:5050:30/8.1 +/− 0.3
11/11/20134011/11/2013 08:0011/11/2013 01:0511/11/2013 0 7:3012/11/2013 04:4020:4006:25
17/11/20134116/11/2013 15:15//18/11/2013 03:2036:05/10.5 +/− 0.8
23/11/20134223/11/2013 05:15//24/11/2013 01:0019:45/11.1 +/− 0.7
28/11/20134328/11/2013 16:50//29/11/2013 10:3017:40//
02/12/20134402/12/2013 17:0002/12/2013 19:2002/12/2013 20:2003/12/2013 17:0524:0501:00/
28/12/20144528/12/2014 18:1528/12/2014 20:5028/12/2014 21:5029/12/2014 16:2022:0501:00/
03/12/20154602/02/2015 16:4003/12/2015 02:5503/12/2015 03:4003/12/2015 09:5517:2000:4512.5 +/− 0.3
04/12/20154704/12/2015 07:5504/12/2015 09:2004/12/2015 11:10//01:5017.6 +/− 1.1
04/12/201548/04/12/2015 20:5504/12/2015 21:10//00:1516.1 +/− 0.8
05/12/201549/05/12/2015 15:1005/12/2015 16:4508/02/2015 18:05/01:3514.1 +/− 2.0

