Abstract
The Tampomas Volcano is a Quaternary volcano located on Java Island and controlled by a west-northwest–east-southeast (WNW-ESE) regional fault trend. This regional structure acts as conduits for the hydrothermal fluids to ascend from a deeper system toward the surface and, in the end, mix with groundwater. In this research, water geochemistry, gas chemistry and isotopes 2H, 18O and 13C were used to explore the subsurface fluid characteristics and mixing mechanisms of the hydrothermal fluids with groundwater. In addition to those geochemical methods, soil-gas and dissolved 222Rn observations were performed to understand the geological control of fluid chemistry. Based on the analytical results, the hydrothermal system of Tampomas is only developed at the northeastern flank of the volcano, which is mainly controlled by NE-SW structures as deep fluid conduits, while the Cimalaka Caldera Rim around Sekarwangi act as the boundary flow of the system. This system is also categorized as an “intermediate temperature system” wherein fluid is derived from the interaction between the volcanic host-rock at 170 ± 10 °C mixed with trace organic gas input from sedimentary formation; afterwards, the fluid flows laterally and is diluted with groundwater near the surface. Soil-gas and dissolved 222Rn confirm that these permeable zones are effective conduits for the ascending thermal fluids. It is found that NE faults carry higher trace elements from the deeper system, while the circular feature of the Caldera Rim acts as the boundary of the hydrothermal system.
1. Introduction
Hydrogeology and hydrogeochemical conditions in volcanic areas with tropical climate conditions come with their own challenges, and these are to be discussed in the field of environmental geology with regards to the exploration of Earth resources, such as geothermal energy. The geochemical composition of groundwater in the volcanic area is the result of mixing between water-related volcanic activity and meteoric-recharge water [1,2]. Some dissolved ions from volcanic activities could pose environmental issues due to geogenic contamination, e.g., As, F, Li, B, Hg and Cs. The presence of these elements is also an indicator of the existence and potential of geothermal reservoirs [3]. The existence of volcanoes on Java Island, Indonesia, is very interesting in the investigation of the geothermal potential. However, a dense and growing population leads to the increased need for water, which can cause environmental issues.
This paper discusses the subsurface mixing mechanism between deep geothermal fluids and the recharge of meteoric water using the hydrochemistry of springs and radon (222Rn) analysis at the Tampomas Volcano on West Java, Indonesia. With this study, the presence of geothermal fluid source locations can be identified, as well as the subsurface geological structures that control groundwater chemistry in the area can be clarified. Hypothetically, this enormous meteoric water contribution, which flows through to the deep zone through permeability fractures and fluid density, may affect the deep hydrogeological thermal fluid characteristics through the dilution-mixing process. This process leaves only the conservative species to act as the trace fluid, except for the reactive elements remaining due to non-conservative exchange or redox reactions [4]. Therefore, geological controls (such as a permeable fault) can act as a conduit for geothermal fluids to ascend and as a mixing zone for the fluids with the shallow groundwater. This results in different water characteristics in the surface around the area.
Research about identifying permeable zones using soil-gas 222Rn has been conducted in many geothermal fields worldwide. In the Mahanagdong geothermal field of the Philippines, 222Rn measurements in soil-gas have been conducted to evaluate permeability. It was concluded that concentrations of soil-gas radon in the permeable zone, which were relatively higher than the surrounding area, caused the gas to migrate vertically very quickly from the subsurface to the surface over time [5]. According to [6], high radon concentrations are caused by the convection process, which is more dominant in gas movements than diffusion. Another study concluded that radon emanation from four active fault zones in California was greater than the concentration of the background radon in the area [7]. This greater concentration is due to the higher outgassing rates in the anomaly zones caused by high permeability.
Radon concentrations in water have also been studied by [7] in a geothermal area; it was found that high dissolved 222Rn concentrations are associated with high concentrations of sulfate, fluoride and total dissolved solids related to geothermal water. In contrast to [7], 222Rn concentrations from thermal manifestation in some fields in New Zealand, such as Wairakei, Waiora, Spa and Rotokaua, show that water temperature does not correlate with 222Rn concentrations in water [8].
2. Material and Methods
2.1. Geology of the Research Area
West Java has been recognized to have many Quaternary volcanoes, both active and dormant, associated with volcanic lines produced by the subduction activity of the Indian-Australian plates beneath the Eurasia continental plates [9,10,11] (Figure 1). These volcanic products are controlled by regional structures that provide conduits for magma to ascend into the shallower zone of crust. Furthermore, the regional structures provide secondary permeability for the hydrothermal fluid pathway and for the meteoric water to migrate, interact and accumulate in the geothermal reservoir [11].
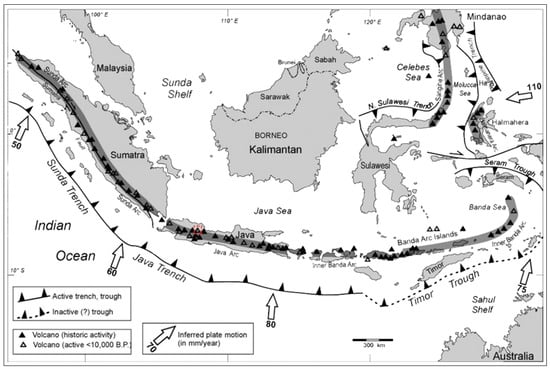
Figure 1.
The geographical map shows the regional tectonic setting and presence of active volcanoes in Indonesia [12], as well as the location of the research area, indicated by the red dashed polygon.
The Tampomas Volcano in West Java Province is associated with Quaternary volcanism along an active margin tectonic system [12]. This small dormant stratovolcano, with peak at 1685 m above sea level, has no record of historic eruptions since the Dutch colonization of Indonesia. It is categorized as a type C volcano, but does not have fumarolic fields [9]. Reconnaissance surveys have been done by the Volcanological Survey of Indonesia (VSI) and Pertamina at the beginning of the 1980s, but it was not considered attractive for exploration drilling. This is probably because there is no manifestation of a high temperature system present at Tampomas Volcano, such as fumaroles, solfataras, boiling springs, hot-warm ground and steam vents.
Unlike other high-terrain geothermal systems located in Indonesia, which generally have a high temperature system, the Tampomas Volcano is categorized into an “intermediate temperature system over volcanic-arc” based on the presence of the manifestation type, which was only hot/warm springs [13]. The intermediate temperature of the Tampomas system is contrary to the geothermal system present in West Java, which has a high temperature of more than 225 °C [13]. The fumaroles discharged at the peak have ceased long ago, as reported from geochemical research by the Volcanological Survey of Indonesia (VSI) in 1983 [14]. This intermediate temperature of around 150–200 °C also has been confirmed from previous research [14,15,16]. There are several aspects that control the hydrogeochemical composition of water at the Tampomas Volcano: (1) deep fluid discharging product at Tampomas, (2) high rainfall intensity at tropical regions and (3) geological features, such as a permeable fault, that act as conduits for ascending geothermal fluids.
Physiographically, the Tampomas Volcano is located at the northern part of the West Java Basin, which is composed by Tertiary sedimentary clastic rocks [10]. These Tertiary sedimentary rocks have experienced a tectonic event and have folded and faulted along with volcanic activities during the age of the Plio-Pleistocene. This is believed to control the movement of Tampomas Volcano’s magma [17]. Regionally, the Tampomas area is comprised of six stratigraphic units (Figure 2), which are discussed from the oldest to youngest based on [17]. (1) The Subang Formation consists of two subdivisions: the claystone formation and sandstone formation [18]; another is the (2) Kaliwangu Formation, which is composed of tuffaceous sandstone, conglomerate and, rarely, limestone and claystone; (3) the Citalang Formation is composed of tuffaceous marl intercalated by tuffaceous sandstone, breccia and conglomerate; (4) old volcanic product and igneous rocks are other formations, which are mainly composed of volcanic breccia, lahar and lava; the igneous rocks are composed of both andesite and basalt; (5) young volcanic product is composed of tuffaceous sand, lapilli, lava, agglomerate and pumiceous tuff distributed at the west and southwest parts of Tampomas; (6) the last formation, alluvium, is clay, silt, sand and gravel mainly deposited in the Holocene streams.
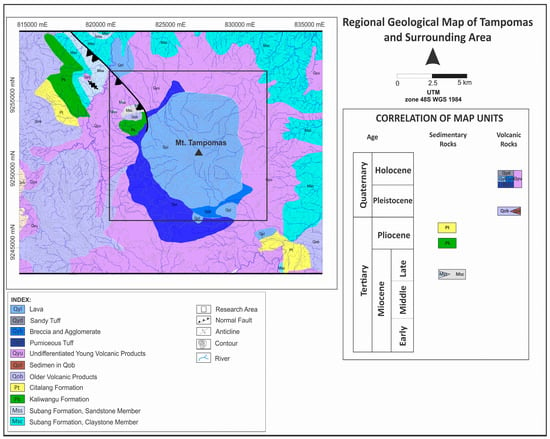
Figure 2.
The regional geology of the recent Tampomas Volcano area and surroundings. It is comprised of Tertiary sedimentary rock in the outer circle zone and covered by Quaternary volcanic product in the inner circle zone (modification from [19,20]).
Prior research has been conducted to investigate the geological condition of the Tampomas Volcano. The result shows that volcanic activity at the Tampomas Volcano started during the Plio-Pleistocene, which was followed by a regional fault in West Java [17] (Figure 2). The geothermal system of the Tampomas Volcano was formed during active tectonic activity in the Middle Pleistocene, which produced pumiceous breccia (most likely from the latest Tampomas eruption). It was stated that the geothermal fluid could interact with the Tertiary sediment of the Subang Formation [17].
Evolution of the Tampomas Volcano started after the Tertiary basement sediment formed [17] and occurred more than two times [21]. Furthermore, remote sensing analysis and field work were conducted to define the volcanostratigraphy of Tampomas. Based on those analyses, the evolution of the Tampomas Volcano was determined. The first phase is the formation of Sumedang Volcano; this is the construction phase of early volcanic activity. The second phase is the destruction phase of the Sumedang Volcano and formation of the Sumedang Caldera. In the third phase, the Old Tampomas Volcano was formed as the new volcano within the Sumedang Caldera. The Old Tampomas Volcano entered the destruction phase and formed the Cimalaka Caldera, with the Young Tampomas Volcano within the caldera. Figure 3 shows the caldera features resulting from the Young Tampomas Volcano evolution. The manifestations around the Tampomas area are associated with the existence of the Young Tampomas Volcano, with the Cimalaka Caldera rim as the boundary.
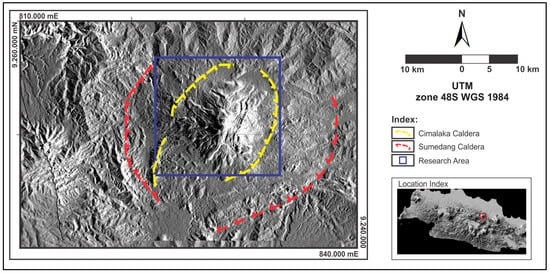
Figure 3.
Morphological features of the recent Tampomas Volcano show two parts of the circular caldera rim. The outer caldera rim was formed during the first to second stage, and the inner circular caldera rim is the result of the second and third stage of volcanic activities.
In this research, local geological structure analysis at the Tampomas Volcano was focused on lineament analysis based on the interpretation of satellite images, drainage patterns and fault indicators such as waterfalls, rock alteration and the lineament of springs. Based on those analyses, some fault lineament (F) and circular features (CF) were interpreted. The presence of the structures can act as a fluid path or boundary of the flow system. Furthermore, those interpreted geological features were used to determine the location of 222Rn measurement and water sampling (Figure 4).
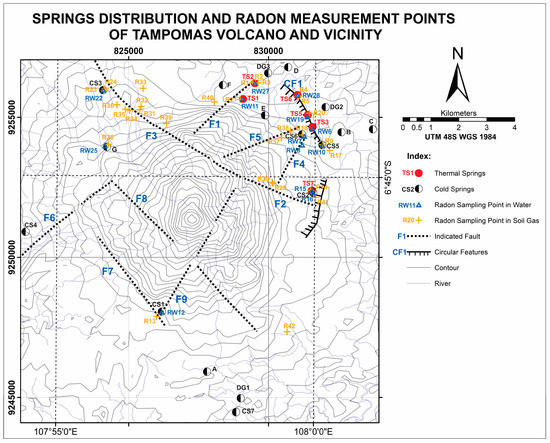
Figure 4.
Interpreted geological structure map of Tampomas based on remote sensing, surface geological mapping and thermal springs’ distribution. This is overlaid with soil-gas, dissolved 222Rn and water sample measurement point locations.
2.2. Hydrogeological Setting
Generally, the rainy season in the Tampomas area occurs from November–March, while the dry season occurs from April–October. The average temperature of the Tampomas area is 25.9 °C. The highest temperature is 30.6 °C, and the lowest is 21.4 °C. Rainfall intensity in the Tampomas area from 2010–2015 is around 2036–3772 mm/year, while average annual rainfall is 2684 mm/year [22,23]. The Tampomas area belongs to two groundwater basins, namely the Sukamantri groundwater basin (at the northern side) and Sumedang groundwater basins (at the southern side). Those basins divide the groundwater system of Tampomas right at the center of the volcano in the E-W direction. Both basins are mainly composed of volcanic materials from the eruption of the Tangkuban Perahu Volcano and Tampomas Volcano. The aquifer of the groundwater basin of Sumedang is comprised of young and old volcanic product, such as tuffaceous sandstone and volcanic breccia. These form an unconfined aquifer [24].
There are at least three main categories of aquifers productivity types at Tampomas: (1) regions without exploitable or any groundwater, which are located at the summit of Tampomas or the central facies; (2) locally productive aquifers, in which flow is both through fissures and interstices at proximal facies of Tampomas; and (3) extensive, moderately productive aquifers, which mainly are overlain at the distal and medial facies of the Tampomas Volcano [23]. The aquifer boundary of the Sukamantri groundwater basin, especially at the northeastern side of Tampomas where the thermal springs are present, has the same direction with a circular feature of the caldera rim (CF1), trending NW-SE.
2.3. Collection and Analysis of Samples
Hydrogeochemical characteristics such as major ion composition, minor and trace ions and water isotope compositions can be used to explain the genesis, sources of water and sub-surface geological conditions. Some trace elements (e.g., Li, F, B, Cl, As and Hg) are related to geothermal sources [25]. In this research, water geochemistry from 17 water samples from 7 thermal springs, 7 cold springs and 3 dug wells were analyzed (Table 1, Figure 4). To strengthen the interpretation, 2H and 18O analysis for 16 samples and 13C analysis for 5 samples of water from thermal springs, cold springs and rain water were performed to explore subsurface fluid conditions and the mixing mechanism of geothermal fluids with shallow groundwater.

Table 1.
Physico-chemical composition of water samples in springs and dug wells in the Tampomas area. DG represents dug well; CS represents cold spring; and TS represents thermal spring. TDS and concentration of ions are in mg/L unit.
The collection of water samples for chemical analysis is the first activity in a long process, which eventually yields significant information about a geothermal system. Sampling activities were performed within several months (April–August 2017) during the dry season in Indonesia. Water sampling occurred in April 2017; soil-gas sampling was carried out from June–August 2017; and dissolved 222Rn in water was sampled for from July–August 2017. The physical properties of thermal and cold springs, such as temperature, total dissolved solids (TDS), conductivity and pH, were determined in the field during sampling activities.
Water sampling techniques follow the international standard, which refers to “Geothermal Fluids” by [3], “Geothermal Sampling and Analysis” by [26] and “Groundwater Geochemistry and Isotopes” by [4]. Before sampling activity was conducted, all the bottles were rinsed with water from each manifestation point in order to eliminate any contamination (Figure 5). Water sampling treatment for anion elements was raw-unacidified, while it was filtered for cation elements and SiO2 (using a 0.45-µm filter) and acidified with nitric acid until the pH was less than 2. When the SiO2 concentration is very high, the dilution process was done directly on site. For the ammonia sample, fluid preservation was performed using H2SO4. A sample of stable isotopes and δ13C were filtered, but no acidification process was needed. For isotope sampling, there should be no bubble or a minor head-space (less than 50% of the sample volume) in a tightly-capped bottle [1].
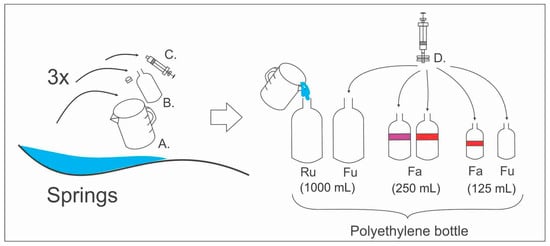
Figure 5.
Overview of the collection of a sample from springs for chemical analysis. The equipment from the picture is a (A) bucket, (B) sample bottle, (C) syringe and (D) filter (0.45 μm). Ru is stands for raw unacidified, and Fu/Fa is filtered unacidified/acidified. The sample with a purple label is a sample that was preserved using H2SO4, while that with a red label was preserved using HNO3.
Ion chromatography (930 Compact IC Flex (Metrohm, Herisau, Switzerland)) was performed to analyze for Na+, K+, Ca2+, Mg2+, SO42− and Cl−, while a titration method was performed to analyze total HCO3− and CO32−. Inductively-coupled plasma mass spectrometry (Agilent 7800 series (Agilent, Santa Clara, CA, USA)) was used to analyze minor and trace elements in the water samples. There is no direct gas discharge manifestation found at Tampomas. However, at some thermal springs, ebullient characteristics were found.
In addition to the hydrogeochemistry method, soil-gas and dissolved 222Rn measurements were performed at 42 points to interpret geological structures that control the fluid chemistry (Figure 4). Faults, as the secondary permeability, control the primary fluid path of the system; each fault and/or fracture can produce different discharged fluid types and characteristics. This condition may be affected by the shallow and deep process during the lateral flow of deep thermal fluid into the surface. This can be found from several geochemical and isotope analyses of the water samples. In this research, soil-gas and dissolved 222Rn analyses were performed to find and analyze subsurface permeable structures that may act as an effective conduit for ascending geothermal fluids. This method is a powerful technique for discovering permeable fractures for the deep fluid path to the surface and the path of recharged meteoric water into the deep system. This is because radon is an inert gas and not related to atmospheric gasses [27].
In this research, soil-gas and dissolved 222Rn concentration measurements were performed at the Tampomas Volcano and in some cold and thermal springs using RAD7. When analyzing dissolved 222Rn, RADH20 was attached to the machine. There were 29 measurement points for 222Rn concentration in soil-gas (Figure 4). Each point has a hole of 1.5 m in depth. Every measurement was run for 5 cycles, and each cycle was 5 minutes long. Prior to measurement, RAD7 was run in purge mode until the radon concentration was less than <100 Bq/m3. After the purging process, the measurement was run in normal mode for 222Rn and 220Rn measurements (Figure 6a).
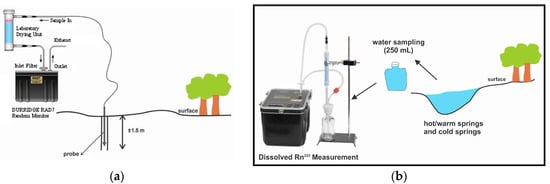
Figure 6.
In situ radon measurement methods. (a) Schematic model of radon measurement in soil; (b) dissolved radon measurement using a 250-mL glass bottle.
The measurement of dissolved 222Rn concentration in water was conducted for 13 water samples. This consisted of 6 samples from thermal springs, 6 samples from cold springs and 1 sample from river water. Each sample contained 250 mL of water in the absence of a bubble. The purging procedure was performed before normal WAT250 mode was run for measuring the dissolved 222Rn. The measurements were also run for 5 cycles for each sample. This was conducted directly after the water was sampled in a glass bottle (Figure 6b).
3. Results and Discussion
3.1. Water Analysis
3.1.1. Physico-Chemical Characteristics of Water Samples
The water temperatures of cold springs and dug wells fall into the category of cold springs in the tropical region, with temperatures ranging from 20 –30 °C. Thermal springs have temperatures above 30 °C. In this study area, cold springs have temperatures ranging from 24.1–29.1 °C, while the thermal springs have slightly higher temperatures ranging from 34.2–50.5 °C (Table 1). CS6 is an anomaly cold spring, which has a higher temperature than what is classified as the cold spring category (29.1 °C). This spring is allegedly an example of a ceased thermal manifestation with intensive iron oxide and travertine deposit characteristics. Measured in situ pH values for cold springs and dug wells are categorized as neutral pH water (from 7.07–8.11, except at CS6, where it was 6.47). Thermal springs are categorized to have near-neutral pH values ranging from 6.49–6.63. These slightly acidic thermal springs are probably affected by the reaction and condensation of carbon dioxide, i.e., the carbonate equilibrium process [3,28]. Based on the total dissolved solid concentration, cold springs and dug wells are mainly categorized as the fresh water type. Their TDS concentrations range from 173.2–416 mg/L, except at CS7 (where it is 11,498 mg/L) in Ciuyah, located at the southern part of the Tampomas Volcano. This brackish anomaly of the CS7 spring may originate from trapped sediment water. Thermal springs have a higher TDS concentration than cold springs. Thermal springs’ TDS ranged from 751 mg/L (TS7) to 2220 mg/L (TS1).
Most of the thermal springs have ebullient characteristics, except TS2 and TS4. The highest ebullient conditions were found at TS1, TS3 and TS6, while medium bubbling charge was found at TS7. The lowest was at TS5. H2S gas smell was not detected in all the thermal springs’ discharge. Travertine terrace and intensive iron oxide deposit was found at TS6, and this spring is categorized as a soda spring with soda taste. Calcite and iron oxide deposits were commonly found around the thermal springs in the research area.
3.1.2. Water Type
The chemical and isotopic composition of water samples in the Tampomas area are summarized in Table 1 and Table 2. Major cation-anion analysis was performed as the traditional method in water chemistry analysis. Major cation and anions were analyzed using the Piper diagram. All water data showed distinction in chemical characteristics (Figure 7a). Cold water and dug well data were characterized by rich bicarbonate elements under anion analysis and Ca-Mg elements under cation analysis. These characteristics mainly belong to groundwater and water of meteoric origin. However, the CS7 spring shows an anomaly characteristic in that it is rich in Cl and Na–K elements. All thermal springs show different patterns compared to cold springs and dug wells that show gaining pattern in Na–K and Cl elements. TS6 and TS7 have the lowest amount of Na–K and Cl elements, which indicates an outflow characteristic of the system, which has experienced an intensive dilution process with shallow groundwater. As the thermal springs discharge toward the flank of the Tampomas Volcano, the deep fluid trace elements (such as Cl and Na–K) become higher. The highest concentration of Cl and Na–K is at the TS1 spring, and it can be concluded that F1 structure may contribute as a deep fluid conduit, while F5 acts as the fluid path for the remaining deep thermal fluid.

Table 2.
Solute geoindicators for fluid origin analysis based on [19].
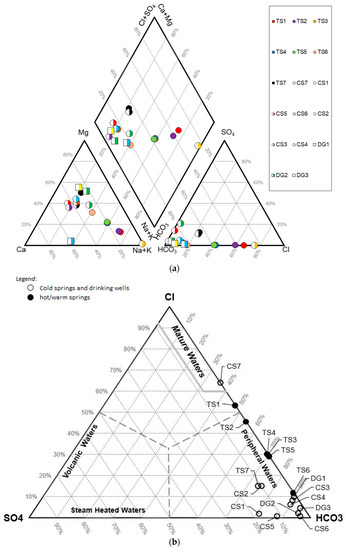
Figure 7.
(a) Data plot of thermal springs, cold springs and dug wells in a Piper diagram. Cold spring and dug well data are distributed at the same cluster. The Ca/Mg–HCO3 type is an indicator of meteoric water product, while thermal waters show enrichment patterns toward anion and cation elements, i.e., Na–K and Cl. (b) Data plot of thermal springs, cold springs and dug wells into anion Cl–SO4–HCO3 ternary diagrams. There is only one cold spring (CS7) that belongs to chloride water, while all the thermal springs are Cl–HCO3, and cold springs are HCO3-type waters.
Mainly in the volcanic geothermal system, there are three major anion types: Cl−, HCO3− and SO42−. These anion types have mostly been used to identify several typical groups of thermal waters [25]. These anion elements are also useful in indicating a basic process of fluids during lateral flow towards the surface (Figure 7b). Based on the diagram, there are at least four water anion types present in the Tampomas area, as follows:
- Chloride water: Based on chloride composition encountered from several springs in the Tampomas field, there is only one spring that has high chloride content. This is the CS7 cold spring (4630 mg/L). Besides chloride, bicarbonate is the next highest concentration for anion elements. For this sample, sodium is the highest cation element (3910 mg/L) however, the potassium concentration is very low (83.6 mg/L). Low concentrations of potassium may indicate element uptake by clays in near-surface or sedimentary rock, which are marked by high bicarbonate concentrations. There was no thermal water in the Tampomas area that was categorized as the chloride water type.
- Dilute Cl–HCO3 as peripheral water: TS1 and TS2 thermal springs at the F1 fault are plotted between chloride and bicarbonate elements. This water is formed by dilution/mixing of chloride during lateral flow by either groundwater or bicarbonate water [3]. This water type is an indication of the margin of major upflow zone and outflow zone structures in high-terrain systems. Higher chloride concentrations at TS1 compared to TS2 indicate the proximity towards the upflow zone.
- HCO3 water with a small Cl concentration: Most of this water type is discharged along CF1 (TS3, TS4 and TS5). There is only a slight difference between the TS3 and TS5 springs; however, the soluble elements such as chloride, sodium, potassium and silica at TS3 are higher than at TS5. It can be concluded during lateral flow through the permeable zone that the deep fluid undergoes steam condensation and the mixing process with near-surface water as it grows further away from the upflow. The work in Reference [29] stated that this water type was likely to have formed from CO2-charged Cl waters during lateral flow and had undergone dilution and interaction with rock.
- Bicarbonate water: TS6 and TS7 springs are thermal waters plotted near bicarbonate corners. Besides bicarbonate, magnesium and calcium have the highest concentration. This spring has undergone a dilution process, with groundwater much higher than thermal water during lateral flow. All cold springs, except CS7, belong to the bicarbonate water type.
Based on the chemical composition of cation-anion elements, the thermal springs can be distinguished as two groups. These are the Cileungsing-Ciledre group and Sekarwangi group (Table 1). These four anion types are discharged along faults and circular structures (Figure 4). These structures also control the thermal water product. The water along Cileungsing structure (F1) has higher chloride content, while Sekarwangi (CF1) is dominated by the steam condensation water type. F1 may allegedly contribute directly towards the reservoir, which is shown by high chloride elements at both TS1 and TS2 springs. Low silica concentrations from TS1 and TS2 thermal springs are the outcome of the dilution process and mineral precipitation during fluid flow towards the surface. CF1 structure-produced steam condensate water has probably leached the silica from host rock near-surface and hypothetically contributes as a boundary of the system. Based on the water type, the system was mainly bicarbonate.
3.1.3. Thermal Fluid Origin
In order to determine the common source of Tampomas deep fluid origin, several geoindicator analyses were conducted on the solute samples. The Cl–Li–B ternary diagram is one of the most famous methods for interpreting deep fluid process, maturity and identifying fluid origin resemblance [25]. All thermal water data were plotted relatively close to each other and were located relatively near the Cl− corner, as evident in Figure 8. The distribution of data points may be explained by (1) the fact there is one deep fluid origin and, therefore, one source condition or by (2) the admixture of high temperature and pressure magmatic vapors with deep circulating groundwater inside geothermal systems associated with a volcanic-magmatic equilibrium state [25]. Low B/Cl ratios are likely to reflect the maturity of a geothermal system. Tampomas is classified as an “old or mature hydrothermal system”.
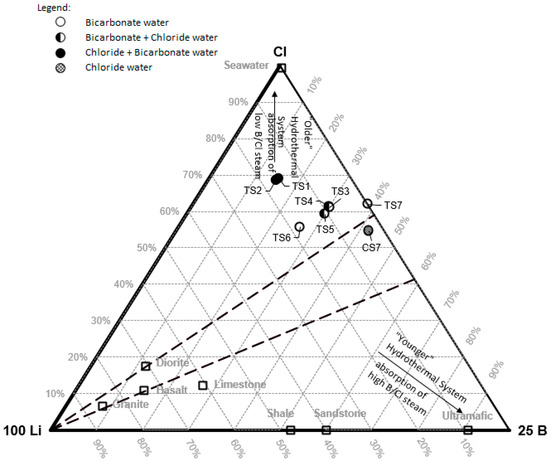
Figure 8.
Relative Cl, Li and B contents (in mg/L) of Tampomas thermal springs and one chloride-type cold spring. All the thermal springs discharged at the Tampomas Volcano are distributed at the same cluster. CS7 springs show the same characteristics as thermal springs.
Thermal springs along F1 and CF1 have a slightly distinct characteristic where some of them are relatively indented towards the boron corner. This condition indicates the influence of steam-condensate processes between steam fluids that are produced by boiling at a shallow depth and are mixed with groundwater near-surface, which is characterized by the enrichment of boron elements. This boron trend is mainly found at thermal springs discharged along CF1, such as TS3, TS4, TS5, TS6 and TS7; while the thermal springs discharged at F1 have higher chloride concentrations. It can be assumed that the deep reservoir fluid path is mainly from this fault.
Ciuyah cold spring (CS7) showed similar characteristics with the thermal springs wherein it plotted near the cluster area. There are either two possibilities that can explain this condition: (1) CS7 may correspond to a high chloride spring that discharged from the outflow zone of the Tampomas Volcano or (2) it is originated from another system, such as the geopressured system with sedimentary host rock. These possibilities are later supported by the physical-chemical condition of the spring and the geo-indicator analysis of several inert chemical elements in order to determine CS7 spring’s origin.
Several chemical indicators of physical-chemical processes were analyzed in order to diagnose features of water chemistry (Table 2). Cl/B, Cl/Li and Cl/Cs ratios were applied at all thermal springs and one cold spring (CS7). The Cl/B ratio showed similarities in value for all thermal springs and the CS7 cold spring, though there are slight differences in the characteristics between the thermal water discharged along F1 and CF1. Thermal water discharged at F1 was relatively higher in terms of Cl/B ratio, while the opposite was true at CF1. This condition attests that F1 may penetrate deeper towards the reservoir of the system.
Other solute geoindicator ratios for determining common reservoir origins were Cl/Li and Cl/Cs, which showed very different values between the CS7 spring and all thermal springs. The ratios showed relatively high values compared to the thermal springs. This could indicate a different fluid origin for the CS7 spring. This interpretation was also supported by the geoindicator of rock type analysis, which expressed sedimentary host rock origin for the CS7 spring (Table 3). High levels of boron, iodine and ammonia are the main indicators of old water from sedimentary host rock [3]. CS7 is interpreted as stagnant water trapped in the Subang and/or Kaliwangu sediment formation and discharged along the permeable zone towards the surface.

Table 3.
Natural stable isotope composition of some water samples in the Tampomas area.
In general, Br− concentrations in geothermal systems are relatively small (less than 60 mg/L), while the high concentration of dissolved Br is derived from marine sediments [3,30]. The Br concentration is relatively high in some thermal springs. This may be due to deep sedimentary rock origin and being carried through the F1 fracture. These sedimentary rocks were intruded by batholith where its trace fluid was carried through the permeable fractures or faults to the geothermal reservoir and interacted with volcanic host-rock. Unlike the case in CS7, this cold spring is interpreted as stagnant water trapped in the Subang and/or Kaliwangu sediment formation and discharged along the permeable zone towards the surface.
3.1.4. Geothermometer Analysis
Some geothermometers are used in determining the deep fluid temperature of the Tampomas system in order to strengthen the interpretation of subsurface conditions (Table 4 and Table 5). Each geothermometer analysis has advantages and disadvantages towards their own element characteristics and passage environmental condition. Silica group minerals are one of the commonly-used temperature indicators to discover subsurface conditions.

Table 4.
The result of silica geothermometer calculation based on various types of silica minerals. The red box is a reference geothermometer type for the research area.

Table 5.
The results of geothermometer calculations based on several pieces of literature on the reactive cation elements of thermal manifestations. The red box is a reference to the interpreted deep fluid temperature system.
The physical conditions of the manifestations found in the field are categorized into warm and hot springs (34.2–50.5 °C), with the absence of near or boiling temperatures. A quartz conductive geothermometer is a suitable geothermometer, as the deep circulated fluid flows from the system at a slow rate. Thus, it experiences a conductive cooling process. Unfortunately, however, rock-water reactions, both with primary minerals and secondary alteration products, are likely altered by the reactive elements [3]. Based on silica geothermometer analysis, the deep circulated fluid temperature of the system ranges from 160–175 °C.
Other geothermometer calculations use reactive elements such as Na, K, Mg and Ca, as these elements can record the last conditions of the equilibrium process. The most commonly-used geothermometer is Na–K due to the fact that its rate of re-equilibration exchange is slower than both the silica dissolution-precipitation and the K–Mg exchange equilibrium [3].
Some Na–K geothermometers’ calculations were conducted based on the literature, which produced different values where the Fournier, Tonani and Arnorsson equations were believed suitable for the system. The calculated reservoir temperature is about 170 ± 10 °C based on two thermal manifestations of TS1 and TS2 (Table 5). Other thermal springs such as TS3–TS7 have low validity levels because of the condensation origin process, and the calculated temperature value is also over-estimated (ranging from 200–230 °C). A high temperature reservoir (>225 °C) is characteristic of the steam phase manifestation due to boiling processes in the system. Therefore, temperature values from TS3–TS7 are incompatible with the Tampomas geothermal system. The Na–K–Ca geothermometer calculations reinforce the interpretation of Na–K and silica geothermometers analysis, where the deep fluid temperature is ±160 °C. The Na–K–Ca geothermometer is suitable for low to moderate temperature system conditions, which have high calcium concentrations in its thermal manifestations [3]. In this condition, Ca, Na and K elements compete in ion exchange reactions with silica minerals, thus affecting the Na–K equilibrium process.
Overall, based on geothermometer calculation towards dissolved and reactive elements, the deep circulated fluid temperature of the Tampomas geothermal system is about 170 ± 10 °C. The large temperature error range is due to the high uncertainty of the deep circulated temperature due to the influence of near surface processes such as mixing and dilution with meteoric water.
3.1.5. Deep Fluid Hydrogeology
The morphology of the high-terrain system already helps in determining the upflow zone and outflow zone of the geothermal system, wherein the volcanic center is parallel with the heat source, although the deep circulated thermal fluid zone typically stretches to the flank of the volcano. Based on all the thermal manifestations, the deep circulated thermal zone is located at the northeast flank of the volcano. Solute geoindicator analysis work was conducted in amplifying the hydrogeochemistry interpretation of the thermal fluid path pattern zone.
In general, solute geoindicator analyses are implemented successfully for low-terrain systems where the fluid is discharged directly from the reservoir to the surface. However, selection and modification in analysis were carefully done in order to achieve a valid hydrogeochemistry analysis and interpretation at the high-terrain geothermal system (Table 6). F1 and CF1 segments are very influential in controlling the hydrogeochemistry pattern of the Tampomas system.

Table 6.
Solute geoindicators for upflow, permeability, boiling process and high temperature zones.
Thermal springs discharged along the F1 structure have higher soluble elements than thermal springs at CF1. However, the silica concentration is higher at CF1. The Na/K ratio is a very powerful geoindicator for low-terrain systems in order to discover the upflow zone by indicating values below 15. However, the result at the Tampomas system was not compatible. There are at least four geoindicators that were not compatible with the Tampomas system: Na/K, Na/Rb, SiO2 and HCO3/SO4. The low potassium and rubidium concentrations in some springs were probably affected by secondary mineral absorption. Low silica concentrations at F1 may indicate conductive cooling processes towards the surface that caused high temperature silica to precipitate, and small concentrations of sulfate elements are the result of a rather old geothermal system.
These geoindicators depict a hydrogeological pattern of the system wherein deep circulated thermal fluid flows through the permeable structures and partly discharged at the TS1 spring, while the rest of the fluid is diluted and discharged at the TS2 spring. The thermal springs other than TS1 and TS2 are the product of shallow boiling and are mixed with shallow groundwater, which was not the actual composition of the system. Very low Na/Ca and Na/Mg values are the main geoindicators of the groundwater dilution effect. The farther the fluid flows, the higher the concentrations of magnesium and calcium in water.
Based on this interpretation, the deep circulated thermal fluid or upflow zone of the Tampomas Volcano is located between the F1 and F5 fault zones. The fluid flows through these faults and discharges to the surface as a thermal manifestation. The fluid has been through an intensive mixing process with shallow groundwater towards the surface. In order to define the actual composition of the thermal fluid’s solution, chloride, silica, 18O and 2H composition analysis was used. Other elements are less reliable due to non-conservative exchange or redox reaction [4]. A simple mass balance equation was used to predict the mixing fraction and deep fluid concentration as follows:
fDTF + fCS = 1 = hot spring (TS)
fDTF = 1 − fCS,
fDTF = 1 − fCS,
The fraction of each water sample is expressed as f, while TS, CS and DTF stand for hot spring, cold groundwater and deep circulated thermal fluid or geothermal water, respectively. The mass balance calculation for chloride and silica elements was applied to TS1 data, as it resembles the deep fluid characteristics. The calculated cold groundwater fraction was found to be much higher than the reservoir fluid, wherein the TS1 spring is a mix of 57% shallow groundwater and 43% deep circulated thermal fluid. The chloride content in the fluid source is 1598 mg/L. A very low concentration of chloride in the source can be affected by three possibilities: (1) intensive mixing processes by meteoric water towards the system, (2) the fact that the Tampomas system is overly mature or (3) that there is no presence of a geothermal reservoir.
3.2. Isotope Analysis
3.2.1. Oxygen-18 and Deuterium Isotope Analysis
In order to discover the local meteoric water line (LMWL), several samples of rain water were collected at different elevations, i.e., 100 m, 300 m, 525 m and 743 m above sea level. Based on the δ18O and δ2H data of the rain water in the Tampomas area, the linear regression line equation of LMWL at Tampomas volcano is:
δ2H = 7.87 δ 18O + 12.8
Figure 9 shows the difference of the local meteoric water line (Equation (3)) against the global meteoric water line; it can be seen that there are deuterium excess (DE) values (Figure 9). The global DE value is 10, while Tampomas’ local meteoric water line DE value is 12.8. The deuterium excess value of each site will always vary depending on local geographical factors [31]. For example, Wayang Windu and Kamojang have different values of DE, being 12.98 and 16.48, respectively [32].
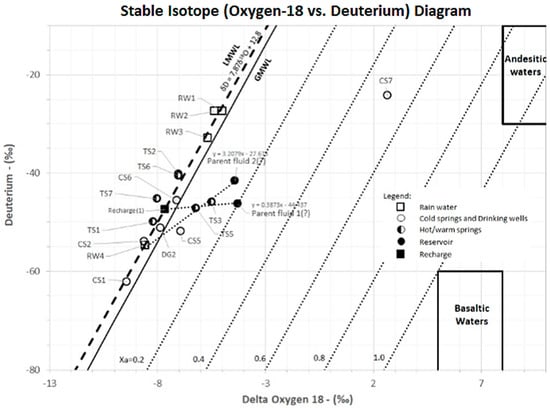
Figure 9.
The relationship between δ18O and δ2H in cold and thermal waters toward the local meteoric water line (LMWL) of the Tampomas area. The LMWL line from the research area is relatively lighter than the global meteoric water line (GMWL) [33]. Full circles are an interpretation of the reservoir fluid from Equation (2).
Water stable isotopes from the springs and dug wells are plotted along the LMWL (Figure 9). This condition may indicate meteoric or near-surface water mixed with thermal water during fluid flow. TS1 springs have been through dilution and yield stable isotopes plotted near the LMWL. However, some thermal springs and cold springs are shifted towards oxygen-18 gaining, i.e., TS3, TS5 and CS5. These springs may carry the heavy stable isotopes during lateral flow in the F5 fault and are discharged along CF1, which acts as a flow boundary. The oxygen-18 shift at the CS5 cold spring is due to the mixing process of remnant deep fluid isotopes with groundwater in the high permeability zone.
In order to interpret the actual δ18O and δ2H composition of the deep circulated thermal fluid, TS3 thermal spring water stable isotope composition was applied in Equation (2) due to the isotope deep fluid trace. Hypothetically, this calculation was done using two mixing process potentials, i.e., the TS3 dilution with CS5 or CS6, which produces two interpreted parent fluids (Figure 9). The first parent fluid hypothesis (dilution with CS6) is more acceptable than the second hypothesis, which has a gradient slope of around 3.2. Mainly, the geothermal reservoir fluid only experiences oxygen-18 shift due to the rock-water reaction with the host rock at the reservoir zone [3,33,34,35,36,37], and the first parent fluid match has a small gradient slope, i.e., 0.38. The rate of oxygen-18 shift in the first parent fluid is quite minor compared to other productive geothermal fields (e.g., the Kamojang, Wayang Windu and Dieng geothermal fields), which is 20% andesitic water [32]. The small oxygen-18 shift observed in Tampomas deep fluid is generally interpreted as large amounts of local meteoric water having passed through the system.
3.2.2. Carbon-13 Isotope Analysis
The composition of δ13CCO2 in various conditions shows large variations due to the impact of different environmental parameters. δ13CCO2 values of magmatic CO2 gases range between −5 ‰ and −8‰ [38], whereas [39] defines them as between −5‰ and −10‰ for geothermal and volcanic systems. In his research, [40] found the most δ13CCO2 in geothermal fluids, ranging between −1‰ and −5‰. The general δ13CCO2 in the atmosphere is between −2‰ and −8‰ [4]. Other δ13CCO2 values such as soil CO2, groundwater [4], coal and crude oil [41], etc., are summarized in Figure 10.
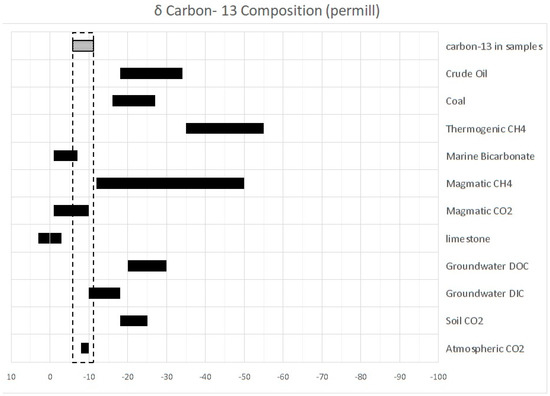
Figure 10.
Variation in δ13CCO2 levels of different origins. Relative concentration of δ13CCO2 in thermal fluid from all thermal manifestations located at Tampomas Volcano. All thermal manifestations originate from four sources: atmospheric CO2, groundwater dissolved inorganic carbon (DIC), magmatic CO2 and marine bicarbonate.
The composition of δ13CCO2 from thermal springs varies between −5.91‰ and −11.21‰. This range of values shows overlap of δ13CCO2 values from several sources, i.e., atmospheric CO2, magmatic CO2, marine bicarbonate and dissolved inorganic carbon (DIC) groundwater [4,38,39,40,42]. This finding is also in agreement with the geological settings of the Tampomas and previous analysis. The meteoric water, which penetrates into the deeper system, may experience equilibrium processes with the trace magmatic fluid through the rock-water reaction. This magmatic fluid carried some trace marine bicarbonate levels because the parent igneous rock (i.e., Tampomas’ heat source) intruded the sediment formation (i.e., the Subang marine sediment formation). Thus, reservoir deep fluid conveys those trace δ13CCO2 levels to the surface, and this is later diluted with the groundwater.
3.3. Dry-Gas and Dissolved-Gas Analysis
Gas chemistry was obtained through a dry gas sampling method from the ebullient characteristics and soluble gases throughout the thermal springs. Thermal springs with massive ebullient characteristics are the TS1, TS3 and TS6 thermal springs. The characteristics of ebullient gas encountered at the field have no odor, which may indicate CO2 as the dominant gas.
Based on laboratory analysis, dry-gas and dissolved gas samples have very striking differences in characteristics (Table 7 and Table 8). CO2 is the dominant gas contained in dry-gas samples, whereas H2S is the dominant gas in dissolved gas samples. This is in harmony with the gas characteristic regarding gas solubility, where CO2 is relatively more volatile than H2S gas in geothermal systems [3]. High concentrations of CH4 gas in dry-gas and dissolved gas samples indicate the contribution of deep fluid, which flows through the permeable zone, or indicate a relatively shallow origin from organic materials. The concentration of dissolved CH4 gas in cold springs is very low compared to thermal springs, which indicates a deeper origin. The high CH4 gas is distributed at the F1 and CF1 structures in which thermal manifestations discharge. The high oxygen concentration in Sekarwangi springs may originate from the oxygen influx during sampling or due to high oxygen levels accumulated in the thermal pool.

Table 7.
The non-condensable gas (NCG) concentration of dry-gas samples in some springs with ebullient characteristics.

Table 8.
The concentration of NCG from the dissolved gas sample.
The dissolved gas elements in thermal springs show significant differences where H2S is the dominant gas (Table 8). It can be concluded that CO2 gas is relatively easily detached from the liquid phase compared to H2S. The concentration of CO2, H2S and CH4 gas in TS1 indicates that the F1 fault is relatively the main fracture zone of the system.
3.3.1. Gas Origin
The N2–CO2–Ar and N2–He–Ar triangular diagrams are commonly used as indicators of fluid origin in the geothermal system [25,43]. Apart from acting as fluid origin indicators, these diagrams also indicate the hydrogeology of the system. Figure 11 shows the results of the data plot from dry-gas samples from three thermal springs, namely TS1, TS3 and TS6.
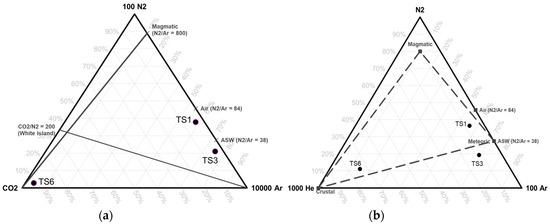
Figure 11.
(a) The results of the N2–CO2–Ar diagram show the origin of hydrothermal fluid from meteoric water. (b) The same result is also found from the analysis of the N2–He–Ar diagram.
The results of the diagram plots show that the main thermal fluid origin is from meteoric water. Meteoric water is the main source of hydrothermal fluid systems that undergo a deep water-rock reaction process and is also frequently mixed with some magmatic fluids [13]. Meteoric fluids are also interpreted to have a dominant contribution to the Tampomas system, which is demonstrated by the physical characteristics of thermal manifestations. There is an anomaly data point plotted in both ternary diagrams, i.e., TS6, which had a high CO2 and He value. The high CO2 is the result of the residual gas dissolved in the fluid during the lateral flow, while the other gases are released and/or undergo oxidation-reduction processes into the solute element. Further analysis of the helium values using noble gas isotope analyses is required to strengthen the analysis of the crust-originating fluids. These triangle diagram analyses are also strengthened by the ratio analysis method of CO2/CH4 and N2/Ar (Figure 12).
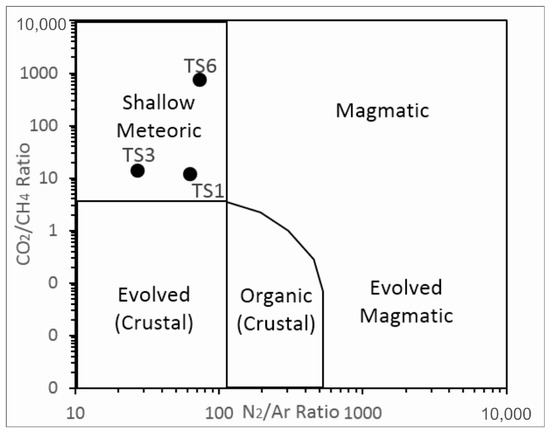
Figure 12.
The ratio diagrams of CO2/CH4 versus N2/Ar show the origin of the fluid system from meteoric water.
3.3.2. Geoindicator Gas Analysis
The dry-gas geoindicator data are presented in Table 9. Several parameters, such as permeability geoindicator, fluid flow direction and high temperature zones, are applied in interpreting the fluid characteristics of the system. It is known that TS1, which is discharged at the F1 fault, contains the remnant of reservoir elements more dominant than in other thermal springs. The F1 fracture is strongly suspected to be a reservoir fluid conduit and is relatively close to the upflow zone of the Tampomas hydrothermal system. This interpretation is based on H2S/CH4, CO2/H2S and CO2/H2 ratios as permeable zone geoindicators. This condition is also supported by the ternary diagram of three common non-condensable gas (NCG) elements, i.e., CO2–H2S–NH3, where TS1 has a higher H2S concentration as an indicator of reservoir fluid contribution (Figure 13).

Table 9.
Geoindicator analysis of gas fluid from dry-gas samples in order to identify the Tampomas fluid characteristics.
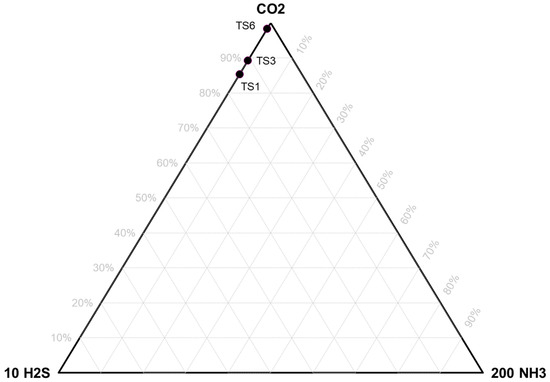
Figure 13.
The ratio of the three main gases commonly present in the system shows that the TS1 thermal spring is relatively close to the reservoir.
As with TS1, the TS3 springs are a lateral flow product characterized by increased CO2 concentrations and reduced reactive gas elements, such as H2S and H2. The lateral flow is characterized by an increase in the CO2/H2S ratio; H2S gas is oxidized to H2SO4, whereas H2 is a highly reactive gas that has interacted with rocks around the upflow zone first [3]. The use of geoindicators against dissolved gas data is relatively difficult due to the unsuitable characteristic ratios for the commonly-used analyses. The relatively large concentrations of CH4 in both types of samples indicates a deep permeable zone of the system.
3.4. Soil Gas and Dissolved Radon
The classification of soil-gas 222Rn concentration is defined by the background concentration of 222Rn in Tampomas and the surrounding area. The background area is Legok (R42) in the southeastern area and Licin (R13) in the southern part of Tampomas, with 222Rn concentrations of 25.9 Bq/m3 and 152 Bq/m3, respectively (Table 10). This area is determined as the background area because there are no geological structures found in the area to interfere with the 222Rn concentration, even based on the geological regional map or field work.

Table 10.
Soil-gas 222Rn concentration in Tampomas and the surrounding area.
222Rn in the soil-gas concentration map of Tampomas shows the differences in the concentration between the northern part and the southern part (Figure 14a). Overall, the southern part of Tampomas has lower 222Rn concentrations than the northern part. The high 222Rn concentration was focused at the northeast flank of Tampomas Volcano. 222Rn in the soil-gas in this area ranged from 640 Bq/m3 in the Cihaseum area (R5) to 30,475 Bq/m3 in the Ciputrawangi Waterfall (R30) (Figure 14b). The relatively higher 222Rn concentration lies over interpreted structures, especially CF1, F1, F2 and F5. Those faults are expected to control the ascent of deep thermal fluids, i.e., gas and liquid from the deeper zone to the surface (Figure 14). In this research, it can be confirmed that the soil-gas 222Rn analysis is an effective method to delineate the permeable conduit of the geothermal system of the Tampomas area.
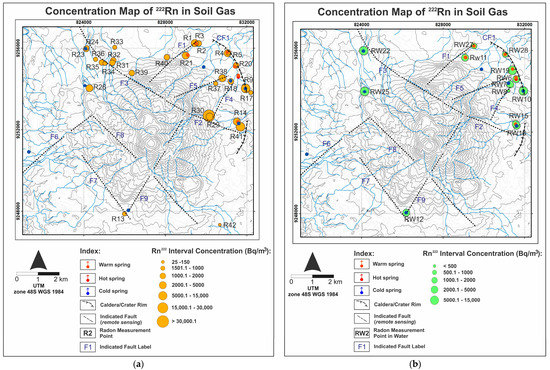
Figure 14.
(a) 222Rn concentration map for soil-gas. (b) Dissolved 222Rn concentration map for water.
Because the study area is located in an area with wet conditions where the groundwater is very shallow and springs are present in many places, dissolved 222Rn analysis from spring water was performed to find out whether some gasses (e.g., 222Rn) were dissolved in the groundwater. Dissolved 222Rn analysis can strengthen the interpretation that 222Rn presence is associated with the ascent of deeper fluid along the faults. The result of dissolved 222Rn measurements in water samples and sample locations can be seen in Table 11 and Figure 14b.

Table 11.
Dissolved 222Rn concentration based on in situ measurements of Tampomas and the surrounding area. RW, river water.
222Rn concentration measurements were conducted on water sampled from hot springs, warm springs, cold springs and rivers. There is no need to do the time correction for dissolved 222Rn because the measurement was conducted directly in the field. Slightly differing from the results of 222Rn in soil-gas, dissolved 222Rn measurements showed more erratic results and could not show the 222Rn concentration pattern at particularly high trends in a location. 222Rn’s background concentration in river water (RW8) showed a value of 489 Bq/m3. Dissolved 222Rn in cold springs has a higher concentration than dissolved 222Rn in hot water or warm water. The range of dissolved 222Rn concentrations in cold water is from 2878–10,336 Bq/m3 with an average value of 5626 Bq/m3. The concentration of dissolved 222Rn in thermal water ranges between 1015 and 6352 Bq/m3, with an average value of 3477 Bq/m3.
The anomaly of dissolved 222Rn concentrations is obvious in the Cikurubuk cold spring (RW22), which has the highest dissolved 222Rn concentration among all measured cold and thermal springs. Mutan cold spring has the second highest dissolved 222Rn concentration (6442 Bq/m3). Both springs are located at the northwestern part of Tampomas and may be related to the groundwater flow along the F3 and F8 structures. This high anomaly is probably caused by accumulated dissolved 222Rn in the aquifer of that area through an advection process, alongside groundwater flow. Dissolved 222Rn concentration in groundwater could increase simultaneously because it may migrate over large distances when in contact with groundwater. Furthermore, Ref. [27] stated that dissolved 222Rn is a noble gas and does not react with solids, so most of the 222Rn released into the groundwater remains in the dissolved phase. Meanwhile, the concentration of dissolved 222Rn in thermal water is higher than in the background of river water, but lower than that in the cold springs. It seems that the effect of degassing is due to hot temperature [27]. The correlation of dissolved 222Rn concentrations with water temperature can be found in Figure 15.
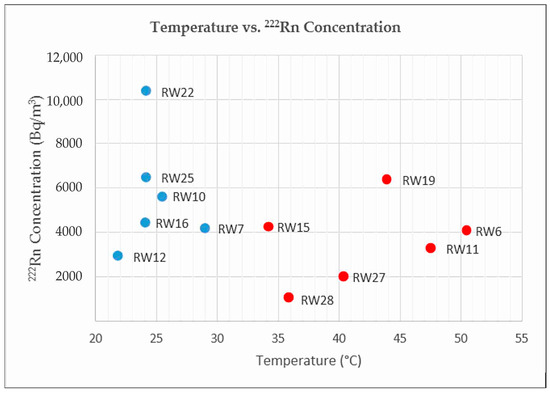
Figure 15.
Graphic of thermal and cold spring temperatures versus the 222Rn concentration. Red represents thermal springs, and blue represents cold springs.
3.5. Inferred Model of the Tampomas Geothermal System
The final analysis of the Tampomas system is presented as an inferred model of the Tampomas hydrothermal system (Figure 16). This inferred cross-section model is located at the northeastern flank of the Tampomas Volcano and stretches in an east to west direction. The cross-section model cuts through three main faults that control the fluid pattern of the system, i.e., F1, F5 and CF1. These structures do not only contribute as conduits for deep fluid flow towards the surface, but also act as the entry zone of meteoric water into the shallow part of the system. This results in a high amount of dilution and cooling processes [44]. This interpretation is supported by geoindicator and stable isotope analyses, which indicate meteoric water contribution. Groundwater dilution is prominent in controlling the hydrogeological system and yields rather small trace soluble elements from the deep circulated fluid. This leads to complexity in interpreting the actual condition and concentration of the deep thermal fluid.
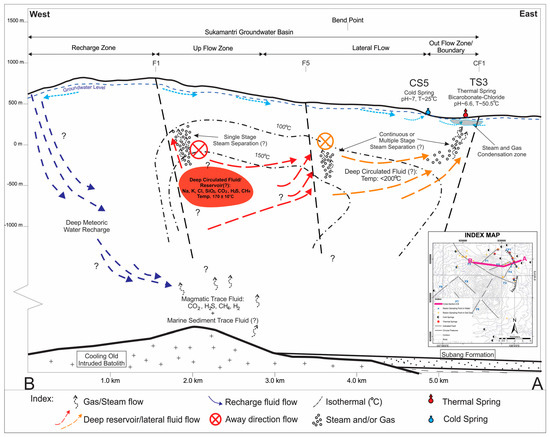
Figure 16.
A tentative deep hydrogeological model of the Tampomas geothermal system from an E-W section cutting across three main faults: F1, F5 and CF1. The deep circulated fluid temperature is based on geothermometer calculation.
The heat source of the Tampomas system is derived from a cooling pluton, which intruded in sediment formation during the Plio-Pleistocene [19] and carried sedimentary trace elements, i.e., CH4. This heat source subsequently heats the deep meteoric circulated water and introduces water-rock interaction into the system, followed by oxygen-18 gaining. The deep circulated temperature based on geothermometer calculation is around 170 ± 10 °C, and this is categorized as a medium temperature system [13]. Unfortunately, based on mass balance analysis of the chloride element, the reservoir of the system is not formed, as shown by low concentrations of chloride. This deep circulated fluid ascends through the F1 fault and flows laterally through it to the outflow zone, while the remnant thermal fluid flows through F5 to the northeast and accumulates along CF1 as the boundary system.
The F1 fault acts as the main conduit of deep circulated fluid onto the surface and mainly produces relatively deep fluid trace elements and high dissolved radon, whereas F5 and CF1 dominantly generate steam condensate water types with high radon gas and stable isotopes. CF1 acts as the boundary of the system which shows no thermal spring discharge at the outer caldera ring. This is also supported by the groundwater basin system in the Tampomas area, wherein the Sukamantri groundwater basin boundary distribution is parallel with the CF1 caldera rim.
4. Conclusions
Geothermal activities at the Tampomas Volcano occur only at the northeastern part of the volcano, and all manifestations, i.e., thermal springs, show dilution processes through meteoric water. This dilution process is clarified by geochemical and isotope analyses where the influence of shallow groundwater on the thermal fluid could be found from the geoindicator traces (i.e., high concentrations of Ca and Mg). The result of the mass balance calculation of stable isotopes δ2H and δ18O in thermal water samples shows that the meteoric shallow groundwater contribution is more than 50%, which is also supported by high magnesium concentration and δ13C composition.
The hydrogeochemical methods of spring water and soil-gas 222Rn analyses can be used to interpret the subsurface hydrogeological and hydrogeochemical conditions of Tampomas Volcano. The combination of both methods could show the ascending process of deep circulation thermal fluid through permeable structures at the northeastern part of Tampomas Volcano. Furthermore, the hydrogeochemical method combined with the stable isotope method could clarify the presence of dominantly meteoric water and the presence of mixing processes in the fault zone. However, the dissolved 222Rn method could not explain the phenomenon where dissolved 222Rn concentrations may change due to the advection process during groundwater flow or the presence of degassing in thermal water.
Acknowledgments
This research was financially supported by the Research Program, Community Service, and Innovation (P3MI), Bandung Institute of Technology (ITB) and supported by the Beneficial Advanced Geothermal Use System (BAGUS) in Science and Technology Research Partnership for Sustainable Development-Japan International Cooperation Agency (SATREPS-JICA) project. Sutikno Bronto and Rina Herdianita, Ph.D., are thanked for valuable discussion. Wijayanti Ashuri, Anwar Zulkhoiri, Musti’atin, Hifdzul Fikri, Putri Aprilia, Danny Daniel, Rully Tri Abdul Malik, Hibban Hamka, Lestari Apriani, Reza Syahputra, Teguh Rahat Prabowo, Cipto Purnandi Septianto, Abraham Paladan, Joshua Satriana, Mika Raymond Batubara, Herbert Manurung, Qodri Syahrur Ramadhan, Neli Ikla Iklima, Raiselia Agustina, Dian Simanjuntak and Betseba Sibarani are thanked for their assistance in the field and laboratory work.
Author Contributions
Irwan Iskandar contributed throughout the process including ideas, research work and article writing. Fikri Adam Dermawan participated in water sampling, hydrogeochemical and isotope data analyses and article writing. Juni Yesy Sianipar contributed in terms of geological structures, measurements of soil-gas and dissolved 222Rn analyses as well as article writing. Suryantini contributed in terms of geological analysis, geochemistry-geothermal systems and final draft article writing. Sudarto Notosiswoyo contributed in giving research ideas, hydrogeological and hydrogeochemical analyses, and final draft review.
Conflicts of Interest
The authors declare no conflict of interest.
References
- Bellomo, S.; Alessandro, W.D.; Longo, M. Volcanogenic fluorine in rainwater around active degassing volcanoes: Mt. Etna and Stromboli Island, Italy. Sci. Total Environ. 2003, 301, 175–185. [Google Scholar] [CrossRef]
- Rodriguez, R.; Ramos, J.A.; Armienta, A. Groundwater arsenic variations: The role of local geology and rainfall. Appl. Geochem. 2004, 19, 245–250. [Google Scholar] [CrossRef]
- Nicholson, K. Geothermal Fluids: Chemistry and Exploration Techniques, 1st ed.; Springer-Verlag: Berlin/Heidelberg, Germany, 1993; pp. 19–194. ISBN 3540560173. [Google Scholar]
- Clark, I. Groundwater Geochemistry and Isotopes; CRC Press: Boca Raton, FL, USA, 2015; pp. 153–173. [Google Scholar]
- Mismanos, J.W.; Vasquez, A.A. Scouting for Permeable Structures in Geothermal Systems using Soil Gas Radon. In Proceedings of the World Geothermal Congress 2015, Melbourne, Australia, 19–25 April 2015. [Google Scholar]
- Rodriguez, A.; Torres, Y.; Chavarría, L.; Molina, F. Soil Gas Radon Measurements as a Tool to Identify Permeable Zones at Las Pailas Geothermal Area, Costa Rica. In Proceedings of the 30th Anniversary Workshop of GTP-UNU Training, Reykjavík, Iceland, 26–27 August 2008. [Google Scholar]
- Villalobos, M.R.; Muños, A.C.; Álvarez, A.P.; Collado, G.M. Hydrochemistry and 222Rn Concentrations in Spring Waters in the Arid Zone El Granero, Chihuahua, Mexico. Geosciences 2017, 7, 12. [Google Scholar] [CrossRef]
- Belin, R.E. Radon in the New Zealand geothermal regions. Geochim. Cosmochim. Acta 1959, 16, 181–191. [Google Scholar] [CrossRef]
- Alzwar, M. Geothermal energy potential related to active volcanism in Indonesia. Geothermics 1986, 15, 601–607. [Google Scholar] [CrossRef]
- Hall, R. Plate Tectonic Reconstructions of the Indonesian Region. In Proceedings Indonesian Petroleum Association, Indonesia; Indonesian Petroleum Association: Jakarta, Indonesia, 1995. [Google Scholar]
- Fauzi, A.; Permana, H.; Indarto, S.; Gaffar, E.Z. Regional Structure Control on Geothermal Systems in West Java, Indonesia. In Proceedings of the World Geothermal Congress 2015, Melbourne, Australia, 19–25 April 2015. [Google Scholar]
- Hochstein, M.P.; Sudarman, S. History of geothermal exploration in Indonesia from 1970 to 2000. Geothermics 2008, 37, 220–266. [Google Scholar] [CrossRef]
- Hochstein, M.P.; Browne, P.R.L. Surface Manifestations of Geothermal Systems with Volcanic Heat Sources. In Encyclopedia of Volcanoes, 1st ed.; Sigurdsson, H., Houghton, B.F., McNutt, S.R., Rymer, H., Stix, J., Eds.; Academic Press: Cambridge, MA, USA, 2007; Volume 6, pp. 835–856. ISBN 9780080547985. [Google Scholar]
- Kartokusumo, W.S. Laporan Penelitian Kimia Panas Bumi Sekitar G. Tampomas dan G. Cireme Kab. Sumedang dan Kab. Cirebon Jawa Barat; Pusat Vulkanologi dan Mitigasi Bencana Geologi: Bandung, Indonesia, 1983.
- LPPM ITB-DINAS ESDM JABAR. Valuasi Pemanfaatan Sumberdaya Migas dan Panas Bumi Se-Jawa Barat di Kota Bandung; Lembaga Penelitian dan Pemberdayaan Masyarakat Institut Teknologi Bandung: Bandung, Indonesia, 2002; pp. 210–222. [Google Scholar]
- Srikandi, G.S. Geologi Daerah Conggeang dan Sekitarnya dan Manifestasi Permukaan Sistem Panas Bumi di Gunung Tampomas, Kabupaten Sumedang, Provinsi Jawa Barat. Bachelor’s Thesis, Engineering-Institut Teknologi Bandung, Bandung, Indonesia, 2010. [Google Scholar]
- Muhardjo, I.; Nasution, A.B.; Yusup, R.B.; Yuhan, B. Laporan Penyelidikan Geologi Daerah Panasbumi Gunung Tampomas Kabupaten Sumedang Jawa Barat; Unpublished Report; Sub Direktorat Panasbumi Direktorat Vulkanologi: Bandung, Indonesia, 1983.
- Martodjodjo, S.; Djuhaeni. Sandi Stratigrafi Indonesia. Komisi Sandi Stratigrafi Indonesia, 1996; Indonesian Association of Geologist (IAGI): Jakarta, Indonesia, 1996. [Google Scholar]
- Silitonga, P.H. Geological Map of the Bandung Quadrangle, Jawa; Geological Research and Development Center: Bandung, Indonesia, 1994. [Google Scholar]
- Djuri. Geological Map of the Arjawinangun Quadrangle, Jawa, 2nd ed.; Geological Research and Development Centre: Bandung, Indonesia, 1994. [Google Scholar]
- Bronto, S.; Dirk, M.H.J.; Achnan, K. Laporan Akhir Penelitian Geologi Gunung Api di Daerah G. Tampomas-Kareumbi-Mandalawangi dan Sekitarnya, Tepi Timur Cekungan Bandung, Jawa Barat; Unpublished Report; Ministry of Energy and Mineral Resources: Bandung, Indonesia, October 2005.
- BPS. Curah Hujan Menurut Kecamatan Selama Tahun 2010–2013. In Sumedang Regency in 2014; Central Berau of Statistic (BPS): Bandung, Indonesia, 2014; pp. 7–10. [Google Scholar]
- Soetrisno, S. Hydrogeological Map of Indonesia, Cirebon Sheet; Directorate of Environmental Geology: Bandung, Indonesia, 1985.
- Wardhana, Y.A.W.; Rengganis, H.; Prasetya, D. Groundwater Typology on the Several Groundwater Basin in Java. In Proceedings of the 1st Annual Scientific Meeting of the Association of Indonesian Groundwater Expert (PIT PAAI ke-1), Bandung, Indonesia, 16–17 November 2016; pp. 134–145, ISBN 978-602-7861-77-0. [Google Scholar]
- Giggenbach, W.F.; D’Amore, F. Chemical Techniques in Geothermal Exploration. In Application of Geochemistry in Geothermal Reservoir Development, 1st ed.; UNITAR/UNDP Center of Small Energy Resources: Rome, Italy, 1991; Volume 5, pp. 119–144. ISBN 9211571782. [Google Scholar]
- Armannsson, H.; Olafsson, M. Geothermal Sampling and Analysis. In Proceedings of the Short Course II on Surface Exploration for Geothermal Resources, Lake Naivasha, Kenya, 2–17 November 2007. [Google Scholar]
- Baskaran, M. Radon: A Tracer for Geological, Geophysical and Geochemical Studies; Springer International Publishing: Cham, Switzerland, 2016; pp. 167–187. ISBN 978-3-319-21329-3. [Google Scholar]
- Henley, R.W. Chemical Structure of Geothermal Systems. In Fluid-Mineral Equilibria in Hydrothermal Systems; Henley, R.W., Truesdell, A.H., Barton, P.B., Jr., Eds.; Society of Economic Geologist: Littleton, CO, USA, 1984; pp. 9–30. ISBN 9781629495590. [Google Scholar]
- Giggenbach, W.F.; Soto, R.C. Isotopic and chemical composition of water and steam discharges from volcanic-magmatic-hydrothermal systems of the Guanacaste Geothermal Province, Costa Rica. Appl. Geochem. 1992, 7, 309–332. [Google Scholar] [CrossRef]
- Magazinovic, R.S.; Nicholson, B.C.; Mulcahy, D.E.; Davey, D.E. Bromide levels in natural waters: Its relationship to levels of both chloride and total dissolved solids and the implications for water treatment. Chemosphere 2004, 57, 329–335. [Google Scholar] [CrossRef] [PubMed]
- Dansgaard, W. Stable isotopes in precipitation. Tellus 1964, 16, 436–468. [Google Scholar] [CrossRef]
- Hendrasto, F. Penentuan Daerah Resapan Sistem PanasBumi Gunung Wayang Windu, Jawa Barat. Master’s Thesis, Geological Engineering-Institut Teknologi Bandung, Bandung, Indonesia, 2005. [Google Scholar]
- Craig, H. The Isotopic Geochemistry of Water and Carbon in Geothermal Area. In Nuclear Geology Ini Geothermal Areas, Spoleto, 1st ed.; Tongiorgi, E., Ed.; Consiglio Nazional delle Ricerche, Laboratorio di Geologia Nucleare: Pisa, Italy, 1963; pp. 17–53. [Google Scholar]
- Giggenbach, W.F.; D’Amore, F. Isotopic composition of geothermal water and steam discharges. In Application of Geochemistry in Geothermal Reservoir Development, 1st ed.; UNITAR/UNDP Center of Small Energy Resources: Rome, Italy, 1991; Volume 5, pp. 119–144. ISBN 9211571782. [Google Scholar]
- Nuti, S.; D’Amore, F. Isotope techniques in geothermal studies. In Application of Geochemistry in Geothermal Reservoir Development, 1st ed.; UNITAR/UNDP Center of Small Energy Resources: Rome, Italy, 1991; Volume 5, pp. 119–144. ISBN 9211571782. [Google Scholar]
- Giggenbach, W.F. Isotopic shifts in waters from geothermal and volcanic systems along convergent plate boundaries and their origin. Earth Planet. Sci. Lett. 1992, 113, 495–510. [Google Scholar] [CrossRef]
- Abidin, Z.; Wandowo. Isotope study in geothermal fields in Java Island. In Isotope and Geochemical Techniques Applied to Geothermal Investigations; IAEA: Vienna, Austria, 1995; Volume 5, pp. 83–92. ISSN 1011-4289. [Google Scholar]
- Taylor, B.E. Magmatic volatiles: Isotopic variation of C, H, and S. Rev. Miner. Geochem. 1986, 16, 185–226. [Google Scholar]
- Giggenbach, W.F.; Gonfiantini, R.; Panichi, C. Geothermal systems. In Agency Guidebook on Nuclear Techniques in Hydrology; International Atomic Energy Agency: Vienna, Austria, 1983; Volume 24, pp. 359–380. ISBN 9201450834. [Google Scholar]
- Craig, H. The geochemistry of the stable carbon isotopes. Geochim. Cosmochim. Acta 1953, 3, 53–92. [Google Scholar] [CrossRef]
- Stahl, W.J. Carbon Isotopes in Petroleum Geochemistry. In Lectures in Isotopes Geology; Jager, E., Hunziker, J.C., Eds.; Springer-Verlag: Berlin/Heidelberg, Germany, 1979; pp. 274–282. ISBN 9783642671616. [Google Scholar]
- Birkle, P.; Merkel, B.; Portugal, E.; Torres-Alvarado, I.S. The origin of reservoir fluids in the geothermal field of Los Azufres, Mexico—Isotopical and hydrological indications. Appl. Geochem. 2001, 16, 1595–1610. [Google Scholar] [CrossRef]
- Giggenbach, W.F. Redox process governing the chemistry of fumarolic gas dishcarges from White Island, New Zealand. Appl. Geochem. 1987, 2, 143–161. [Google Scholar] [CrossRef]
- Reyes, A.G. Petrology of Philippine geothermal systems and the application of alteration mineralogy to their assessment. J. Volcanol. Geotherm. Res. 1990, 43, 279–309. [Google Scholar] [CrossRef]
© 2018 by the authors. Licensee MDPI, Basel, Switzerland. This article is an open access article distributed under the terms and conditions of the Creative Commons Attribution (CC BY) license (http://creativecommons.org/licenses/by/4.0/).