Article

Combined Use of Remote Sensing Data, Mineralogical Analyses, Microstructure Studies and Geographic Information System for Geological Mapping of Antiparos Island (Greece)

by
Konstantinos G. Nikolakopoulos
*,
Paraskevi Lampropoulou
,
Dimitrios Papoulis
,
Aikaterini Rogkala
,
Panagiota P. Giannakopoulou
and
Petros Petrounias
Department of Geology, University of Patras, 265 04 Patras, Greece
*
Author to whom correspondence should be addressed.
Geosciences 2018, 8(3), 96; https://doi.org/10.3390/geosciences8030096
Submission received: 22 December 2017 / Revised: 2 March 2018 / Accepted: 5 March 2018 / Published: 12 March 2018

Abstract

:
This study presents the combined use of field mapping, remote sensing data analysis, mineralogy, spectroscopy and GIS techniques for the geological mapping of Antiparos Island. Antiparos is part of the Cyclades Blueschist Belt located in central Aegean, where gneisses, schists and Pliocene volcanic rocks occurred. During the extended field work, a number of volcanic rock samples were collected from the southern part of Antiparos. The sampling strategy was to collect samples from the primary as well as the altered rocks in specific areas in which they were previously located from the remote sensing data processing. In this study, high resolution satellite images have been carried out in order to detect, allocate and separate the different geological formations. Furthermore, the existing geological map was georeferenced and all the tectonic lines and boundaries were digitized. All these features were implemented in a Mobile Mapper CE GPS using Arcpad GIS and checked in situ. The collected samples were analyzed in the laboratory using various techniques including XRD, Petrographic Microscopy and SEM. The qualitative mineralogical analyses were conducted by using XRD. The study was supplemented by the petrographic observations providing a detailed characterization of rock textures. In addition, SEM study and SEM-EDS analyses of the samples were emphasized on the genetic relations of the minerals. The laboratory results revealed that specific corrections should be made in the previous geological map of Antiparos concerning the volcanic rocks, especially at the southern part of the island. A significant conclusion is that the rock described as volcanic in the previous map proved to be a fossiliferous limestone which includes micritic matrix of calcite with an insignificant amount of fossils. All the analogical and digital data and the results of the petrographic analysis were imported in a geodatabase specially designed for geological data. After the necessary topological control and corrections, the data were unified and processed in order to create the final layout at 1/25.000 scale.

1. Introduction

From the late 1970s, remote sensing data is continuously used for geological mapping. Landsat MultiSpectral Scanner (MSS) was deployed for the first time to produce iron oxide maps [1]. With the launch of the Landsat Thematic Mapper (TM), band ratios were used to separate argillic from non-argillic materials (using TM bands 5/7) and for mapping ferric/ferrous oxides (using TM bands 3/1). The launch of the multispectral sensor ASTER in 2000 on board Terra satellite and of the first hyperspectral sensor Hyperion on board Earth Observing-1 gave a new impulse to geological remote sensing [2,3,4]. In 2002 several ASTER band ratios that serve as proxies for mineralogy were published [5]. In another study, Principal Component Analysis (PCA) method and Geographical Information System (GIS) techniques have been applied to different multispectral data, one Landsat MSS image, three Landsat Thematic Mapper (TM) images, two Landsat Enhanced Thematic Mapper (ETM) images, and one Terra ASTER image in order to detect and map geomorphologic changes in the Alfios River channel [6]. The possibilities of Hyperion hypespectral data for mineral mapping have been evaluated [7] and the results were compared to the respective results derived from multispectral sensors like Landsat 7 ETM and Advanced Land Imager (ALI). Optical and radar data from the Advanced Land Observing Satellite (ALOS) was tested in Tunisia and according to the authors [8], it has been proven that ALOS sensors are suitable for geological mapping. The combined use of field mapping and measurements, remote sensing data analysis, marine geology data, GPS measurements and GIS techniques for the geological mapping of KEA Island at a 1/50.000 scale was presented in [9]. Digital processing techniques like Principal Component Analysis (PCA), Independent Component Analysis (ICA), and Kernel Independent Component Analysis (KICA) were evaluated on Quickbird data in order to detect changes [10]. Hyperspectral data from Hyperion, as well as multispectral data from EO-1 Advanced Land Imager and the Landsat 7 ETM+ were evaluated, for open quarry detection in Milos Island [11]. In order to better constrain the utility of multispectral datasets in the characterization of surface materials, Landsat TM data was evaluated in the discrimination of geological classes in the Cape Smith Belt of Quebec, a greenstone belt that hosts Early Proterozoic units including also ophiolites [12]. Limitations of Landsat TM data in the mapping of igneous and metamorphic lithologies were marked. ASTER ratio images, alteration indices and false color composites were used to select ground-training areas for sample collection and field spectrometry prior to the classification procedure. Using a support vector machine classification (SVM) algorithm on ASTER data, different types and intensities of alteration, along with unaltered ignimbrite and lava flows with an accuracy of 80% were mapped [13]. Mielke et al. [14] evaluated several current and next-generation satellite sensors, including Sentinel-2A MSI, for mapping the iron absorption feature depth in a band-ratio approach. They concluded that sensors like Sentinel-2A MSI are suitable for detection of Gossan with their method, and that they potentially can save costs when used for target detection prior to hyperspectral data acquisition. Van derWerff and van der Meer [15] demonstrated the capabilities of Sentinel-2A MSI for geological remote sensing by mapping iron oxide mineralogy. This was done by introducing a modelling approach on the 0.9 µm iron absorption feature using Sentinel-2A MSI’s near-infrared (NIR) bands 6–9. This was, however, all done prior to the availability of real Sentinel-2A MSI data. Combined use of middle resolution satellite data (Landsat ETM and ASTER), high resolution satellite data (Quickbird and Geo-Eye), aerial photographs, DTM, and geological data were implemented in a GIS in order to update the geological map in northern Morocco [16]. The combined processing of Landsat-8 data, airphotos and LIDAR data for the discrimination of lava age in Santorini Volcano was performed by [17]. A decade of remote sensing geothermal exploration in Nevada using multispectral and thermal data is presented in [18]. Multispectral data from Terra ASTER and SPOT sensors were processed in order to map hydrothermal alteration zones that could be associated with gold deposits [19]. The initial processing of satellite data has conducted to the field mapping and samples collection. The selected samples were examined using Scanning Electron Microscopy (SEM). Samples with higher gold were further analysed using the Fire Assay method [19]. Different processing techniques like Principal Component Analysis (PCA), Intensity Hue Saturation (IHS) transformation and band ratio were applied on Landsat 7 ETM and Landsat 8 Operational Land Imager (OLI) data for geological mapping in Kenya [20]. ASTER multispectral data were used, in conjunction with airborne geophysical data, Digital Elevation Model (DEM) and geological maps, in order to porphyry Cu mineralization at the south-east of Iran [21]. The application of different band ratio initially designed for the Landsat Thematic Mapper sensors to Sentinel-2 and Landsat-8 OLI data was presented by [22]. These band ratios are sensitive on mineral or hydrothermal anomalies detection and it was proved that they can be satisfactory applied on Sentinel-2 and Landsat 8 OLI data. In another study, ASTER and Landsat 8 OLI data was combined for Hydrothermal Alteration Mineral Mapping [23]. In a more recent study, the suitability of WorldView-3 data for lithological mapping was examined. Furthermore, a detailed comparison of different data types for lithological classification with ASTER and OLI/Landsat-8 data was performed [24].
Most of the above-mentioned papers and many more that were not possible to include in the current study focus on the detection and mapping of mineral deposits and/or on the distinguishing of different formations by mapping surface alteration mineralogy. This is quite an interesting task, however, its added value and contribution to geological research are not always evident. Furthermore, in geologic remote sensing, there is a lack of multidisciplinary studies paying attention to the synergy of remote sensing technology and classical petrographical or mineralogical analyses. Cross-linking of remote sensing with laboratory should deserve more attention and may pay off as being scientifically very fruitful in producing or updating geological maps. In that frame, the current paper is proposing a synergistic methodology that ameliorates the geological mapping and decreases the total cost. The initial processing of remote sensing data has detected and determined the areas where in situ investigation and sampling should be performed. The implementation of digital orthophotos produced from remote sensing data n Mobile GIS (ArcPad) and the use of differential GPS have reduced the in situ survey time to only one week. A well-known limitation of remote sensing is that it maps only the Earth’s surface, whereas geologic structures are three-dimensional and quite complex. The chemistry, formation conditions and the depth of the formations are also necessary in order to produce a detailed geological map. That information was provided by the petrographic and mineralogical analyses. The GIS technology has facilitated the field work and was necessary for the digitization of the previous geological map, correction and harmonisation of data, and production of the final map. The above described concept was evaluated on the updating of the Geological Map of Antiparos Island (Greece).
Antiparos Island is one of the many islands found in the central Aegean Sea and belongs to the Cyclades Blueschist Belt [25]. Several geological studies have been conducted in Antiparos island [25,26,27,28]) over the last 60 years. The geological mapping of the island was conducted more than half a century ago by Anastopoulos [26] who found that the dominant rocks of the island are volcanic rock, gneises, schists and marbles. The volcanic activity as well as the rocks of the island have also been investigated by studies focusing on tectonics, geochemistry or petrology [27,28,29,30,31,32]. Recently, archaeometrical studies presented by several investigators focused on volcanic rock [33,34]. Despite the abovementioned studies, the geological map of the Antiparos island presented by Anastopoulos [26] has not been modified even though many years have passed and new techniques and methods can now be applied and combined with the old ones, providing these improvements in the existing geological map.
The remainder of the current paper is structured as follows: In the next section, the geology of the study area is described. Section three presents the remote sensing data processing and the sampling procedure during the field work. Section four contains the analytical methods. In the fifth section, the results from of the mineralogical composition and microstructure are exposed and discussed and finally the conclusions are presented.

2. Geological Setting

The island of Antiparos is part of the Cyclades Blueschist Belt located in central Aegean [25]. The Cyclades Blueschist Belt is a succession of Alpine nappes, overlying a Hercynian meta-igneous basement which consists of gneisses and schists which are intercalated with marbles. In the southernmost part of Antiparos Pliocene, volcanic rocks such as rhyolitic domes, lava flows and pyroclastic are presented [32]. The lava flows are often vesiculated and comprise lenses of obsidian [30]. In the area of Agios Georgios, veins of quartz are observed, which are hosted in biotite-muscovite schists and marbles. There are two types of quartz veins, the NE-trending milky quartz and the NW- trending clear quartz veins [35].

3. Remote Sensing Data, Processing and Field Sampling

Diverse multispectral remote sensing data was processed in the frame of the current study in order to locate areas that should be checked in the field and collect samples. As described in the next sections, in the areas determined by the initial remote sensing data processing (areas 1, 2, 3, 4 and 5 in Figure 1) many samples were collected and analysed in the laboratory The main goal was to decrease the field survey time and thus decrease the total cost of updating the geological map.
The first dataset consists of an EO-1 ALI image acquired on 21 September 2001. ALI instrument acquires simultaneously a panchromatic band with a spatial resolution of 10 m and nine multispectral bands with a spatial resolution of 30 m. The panchromatic band and the nine multispectral bands were fused creating a new multispectral image with a pixel size of 10 m. The Pansharp algorithm was used for the fusion as it gives the best results among the fusion algorithms as presented in [36].
The second data set consists of an ALOS Prism panchromatic image with 2.5 m spatial resolution and an ALOS Vnir multispectral image with a spatial resolution of 10 m. Both images were acquired on 12 May 2009. The images were fused delivering a final multispectral image with a spatial resolution of 2.5 m.
A quickbird bundle image with a spatial resolution of 0.6 m was also used in order to provide the necessary updated topographic basemap for the in situ mapping.
The previous geological map of IGME (Figure 1) was scanned; georeferenced and the boundaries of the geological formations were digitized. All the remote sensing data were also georeferenced in the Greek Geodetic Reference System (EGSA 87) and further processed using ERDAS Imagine software. Different processing techniques like Principal Components Analysis (PCA), Independent Components Analysis (ICA) and Tasseled Cap were applied ALI, ALOS and Quickbird data.
Principal Components Analysis (PCA) was originally used as a method of data compression. It allows redundant data to be compacted into fewer bands and thus the dimensionality of the data is reduced. PCA is a linear transformation which exploits image data second order statistics to extract orthogonal components ordered according to decreasing variances. The transformation can be based on eigenvector analysis of the correlation or of the co-variance matrix. The transformed components are globally uncorrelated under Gaussian hypothesis and thus they are more interpretable than the source data.
Independent Components Analysis (ICA) is a feature extraction technique which aims to decorrelate the spectral bands in order to recover the original features in the image. It performs a linear transformation of the spectral bands such that the resulting components are decorrelated. Each component contains information corresponding to a specific feature in the original image.
Tasseled Cap transformation offers a way to optimize data viewing for many studies. For example, a geologist and a botanist are interested in different absorption features, which means that their research focuses on distinguishing different data structures and therefore, different data structure axes. Both would benefit from viewing the data in a way that could maximize the visibility of the data structure of interest.
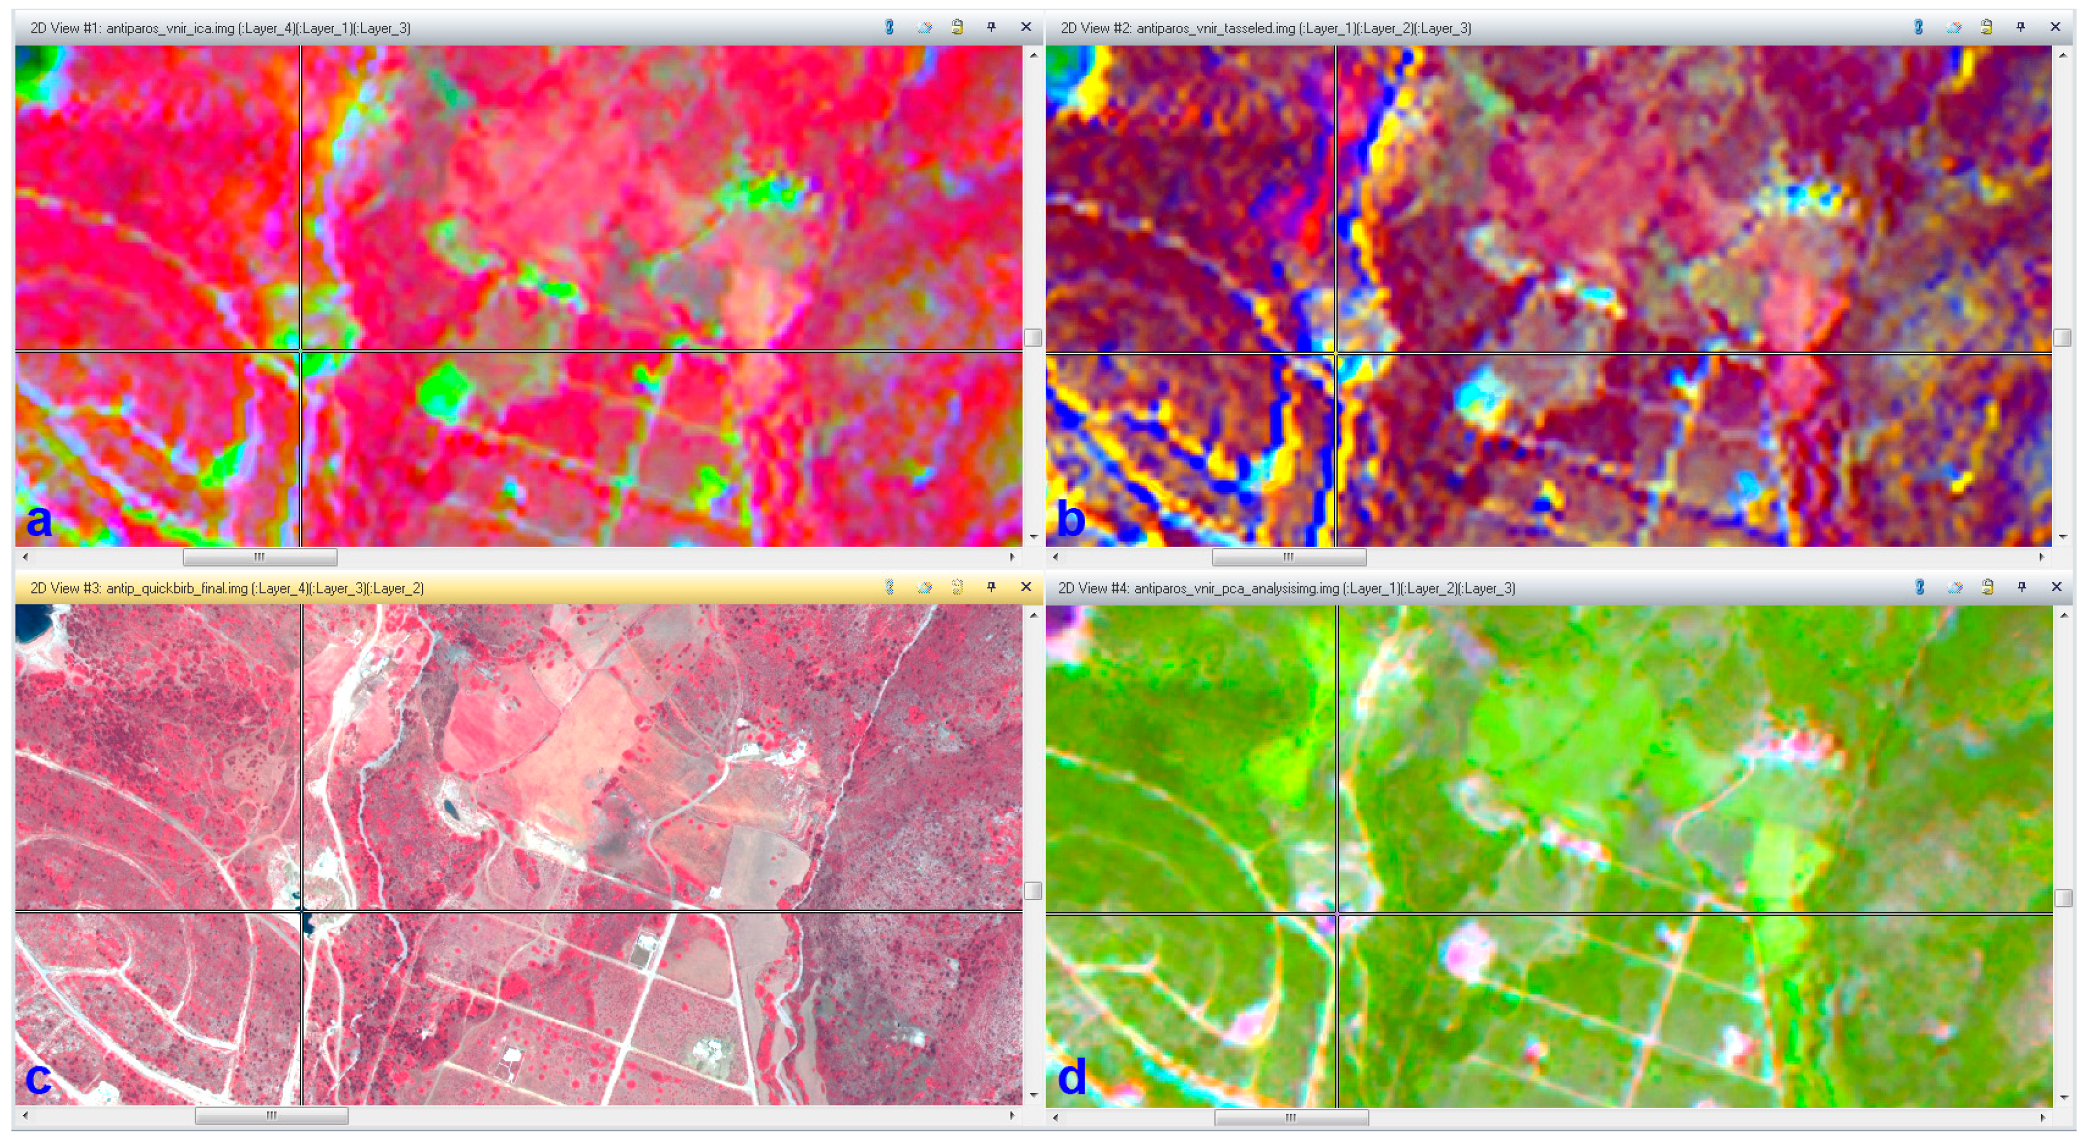
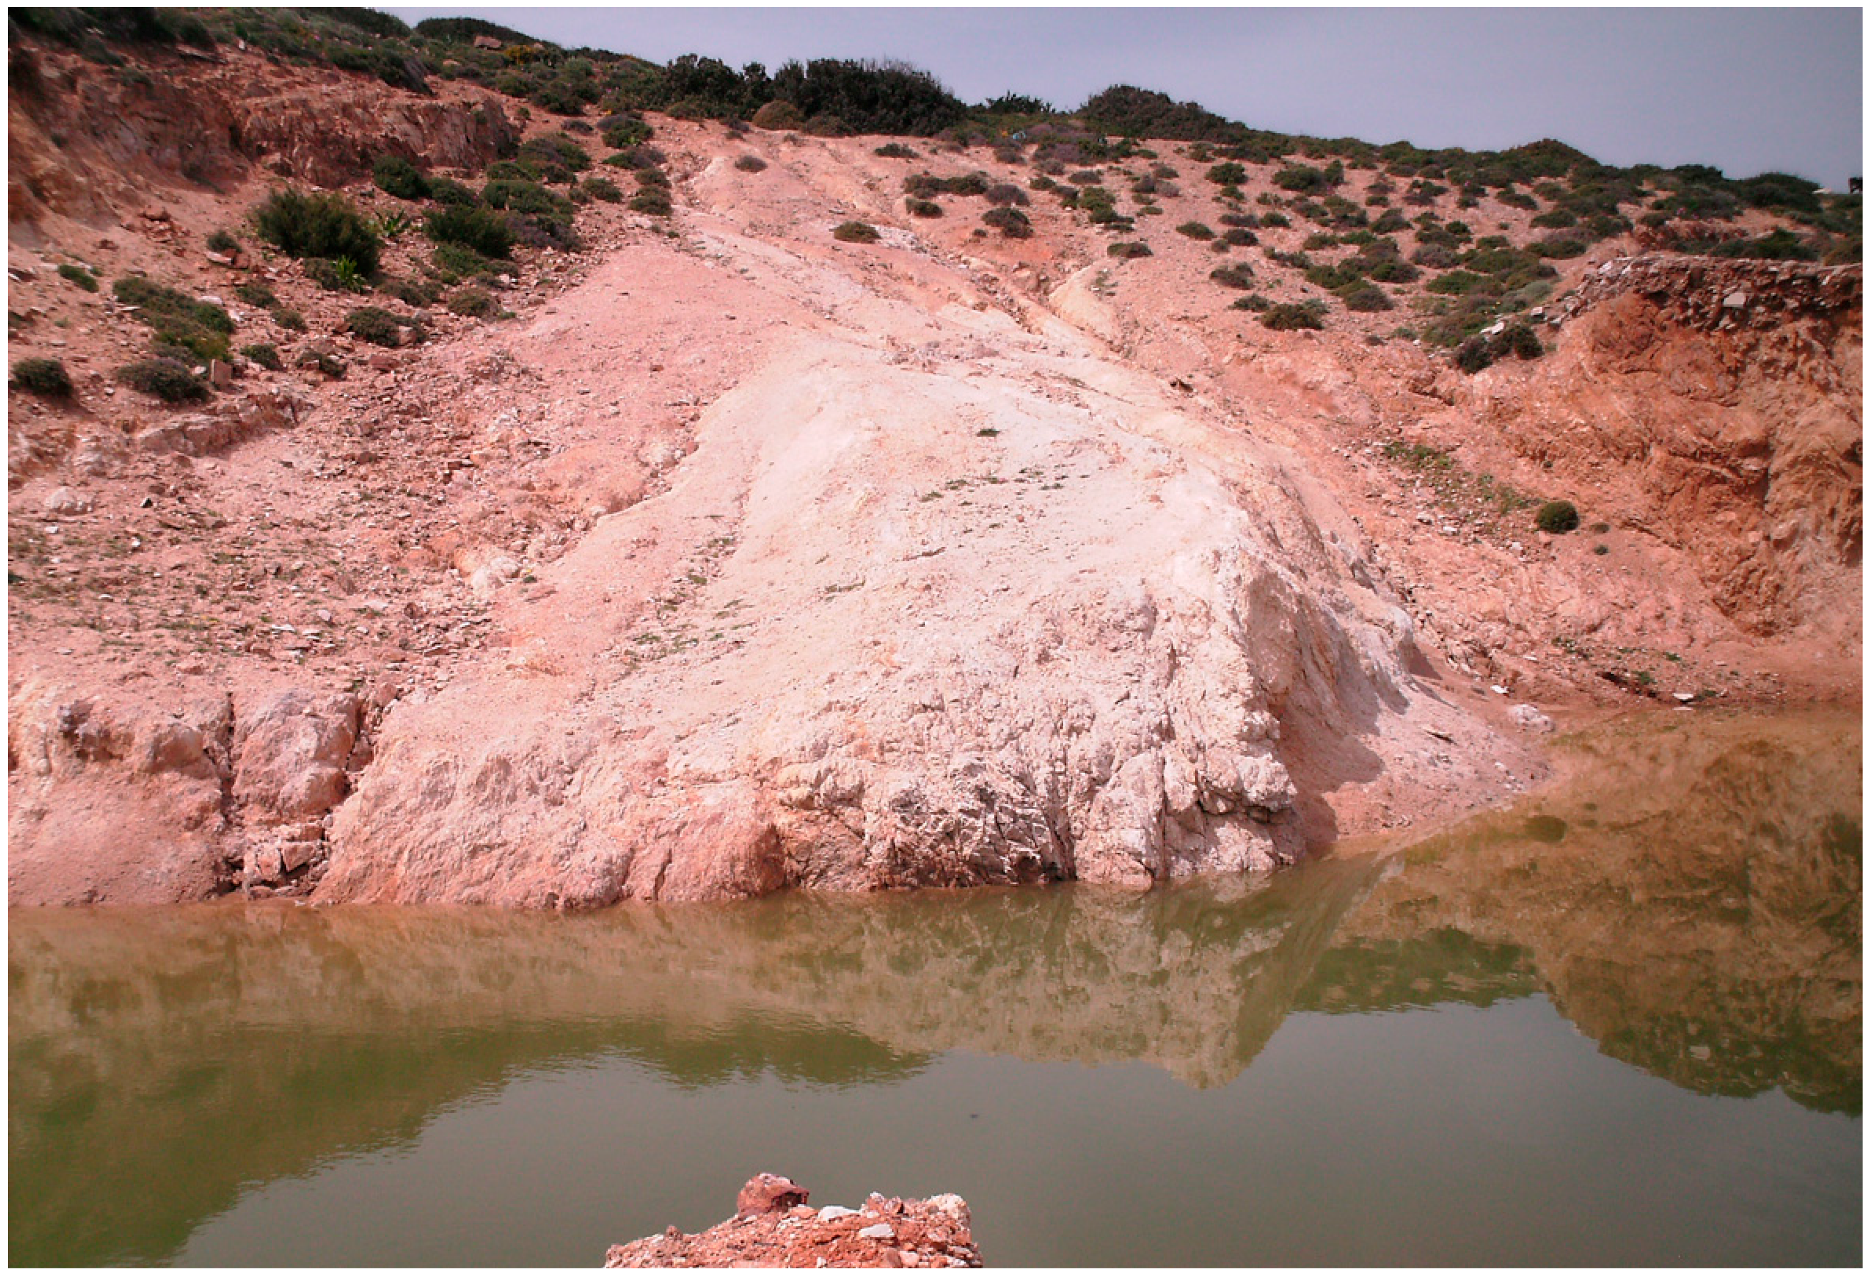
The application of the PCA, ICA and Tasseled Cap techniques on remote sensing data has allocated areas (area 4) where further field investigation was necessary to be performed. As it can be observed in Figure 2, areas of hydrothermal alterations were detected in Quickbird image (Figure 2c). Those areas were very well detected and mapped on the processed remote sensing data. The hydrothermal alterations are presented with green color in the ALOS VNIR ICA image (Figure 2a), with cyan color in the ALOS VNIR Tasseld Cap image (Figure 2b) and with red color in the ALOS VNIR PCA image (Figure 2d). A picture of the specific area was acquired in the field (Figure 3).
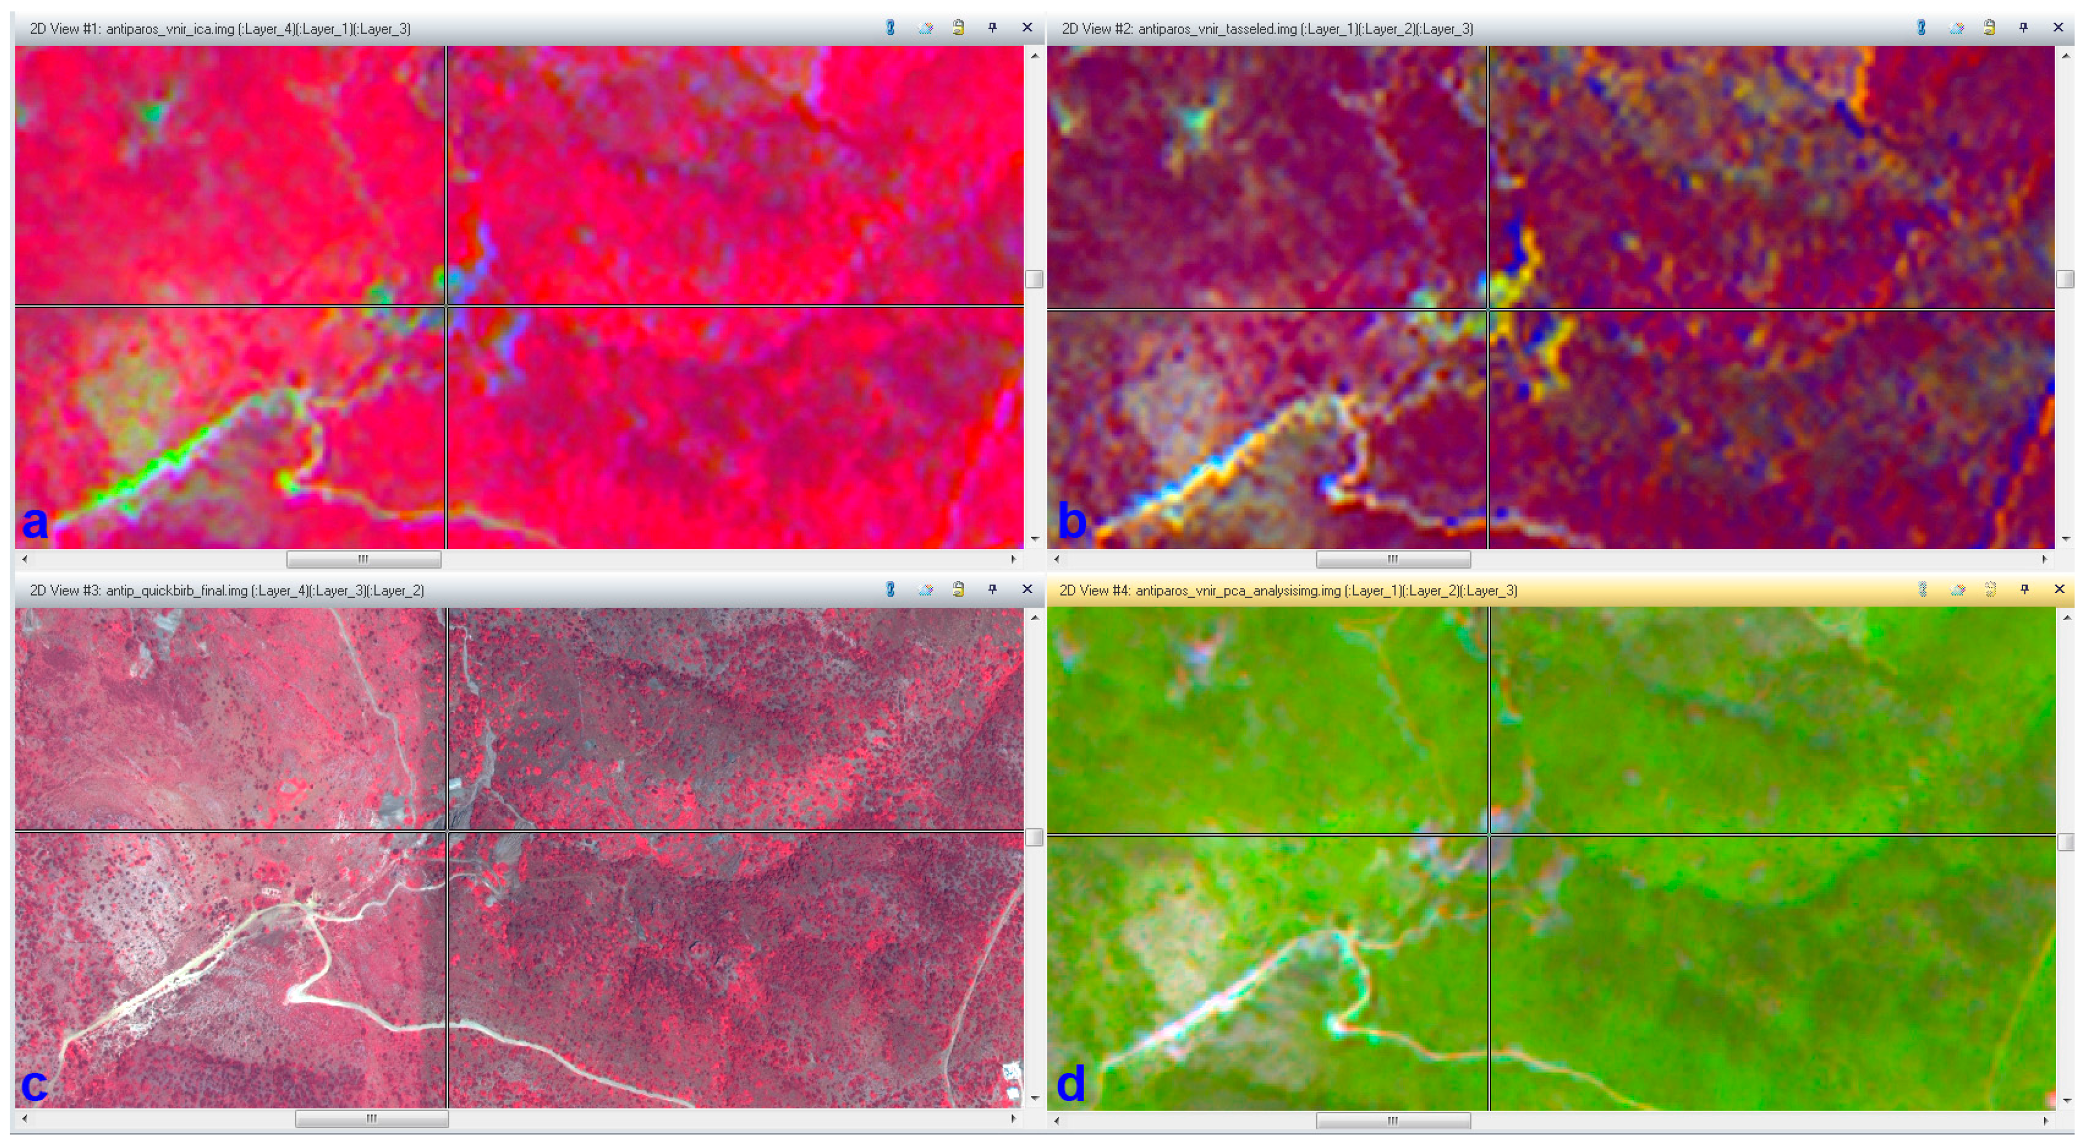
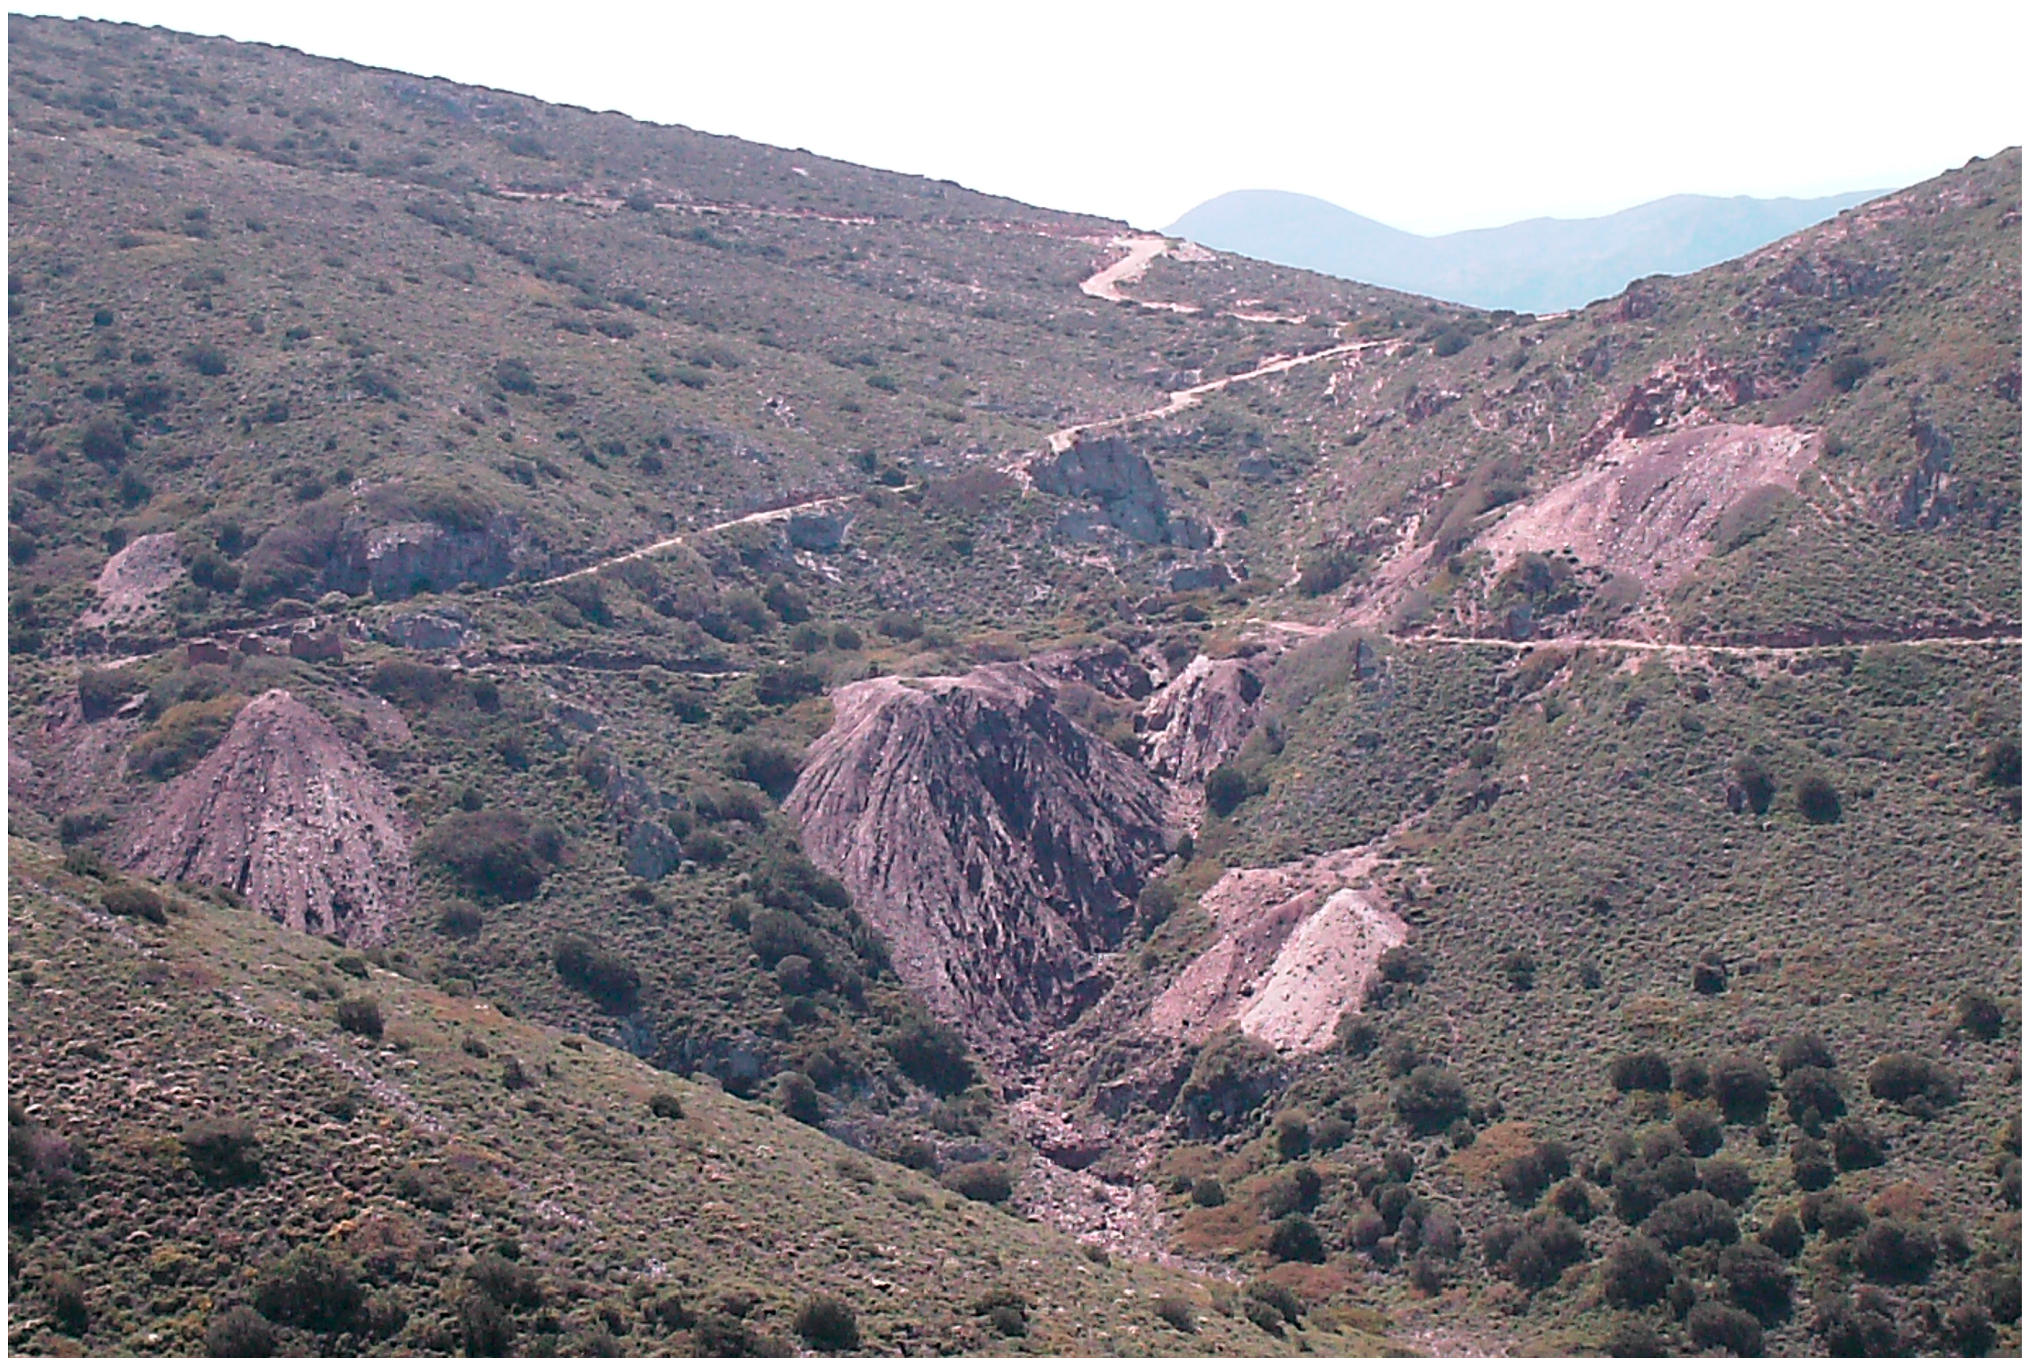
Detection of talus cones (area 5) that were not present in the previous geological map is presented in Figure 4 and Figure 5. As it can be observed in Figure 4, extended talus cones were detected in Quickbird image (Figure 4c). Those areas were very well detected and mapped on the processed remote sensing data. They can be detected with blue color in the ALOS VNIR ICA image (Figure 4a), with green colour in ALOS VNIR Tasseld Cap image (Figure 4b) and with brown color in the ALOS VNIR PCA image (Figure 4d). A picture of the specific area was acquired in the field (Figure 5).
As described in the previous paragraphs, the digital processing of the remote sensing data has determined areas where field surveys should be performed. All the formation boundaries and the tectonic lines from the previous geological map were digitized and implemented in a Mobile Mapper CE GPS using Arcpad GIS. The accuracy of the GPS measurements was better than 1 m (DGPS mode using EGNOS). Extended field work, including geological survey—mapping, GPS measurements and field data collection took place [37]. The total time spent in the field was only one week. All these features were examined and verified in situ. All formations and geological boundaries were checked during the geological survey and any change to their boundaries was recorded digitally using the ESRI Arcpad GIS software. In the specific areas determined by the initial remote sensing data processing, many samples were collected and analysed in the laboratory as described in the next session.

4. Analytical Methods

The mineralogical composition of bulk samples and of the clay fraction (<2 μm) separated by sedimentation were determined by powder X-ray diffraction (XRD), using a Bruker D8 Advance diffractometer, with Ni-filtered CuKα radiation. Powders from oriented samples were prepared by the dropper method and were scanned at 1° 2θ/min from 3 to 30° 2θ. Random powder mounts were prepared by gently pressing the powder into the cavity holder. For each <2 μm fraction, the clay minerals were identified from three XRD patterns (after air-drying at 25 °C, ethylene glycol solvation and heated at 490 °C for 2 h). The mineral phases determined using the DIFFRACplus EVA version 12, Release 2006software (Bruker-AXS, GmbH, Karlsruhe, Germany) based on the ICDD Powder Diffraction File of PDF-2 2006.
Petrographic study was performed using a LEITZ ORTHOLUX II POL-BK microscope (Ernst Leitz (Canada) Ltd., Midland, Ontario). Morphology of clay minerals and chemical composition of coexisting minerals were examined using a scanning electron microscope (SEM) JEOL 6300 (JEOL, Tokyo, Japan) equipped with an Energy Dispersive Spectrometer (EDS). The chemical composition of the minerals was determined using natural and synthetic standards and 20 kV accelerating voltage with 10 mA beam current. Microanalyses were performed on epoxy resin-impregnated, gold or carbon coated polished-thin sections and sample powders mounted directly on the sample holder. Morphology of clay minerals was also examined with a SEM LEO SUPRA 35VP (Carl-Zeiss Company, Jena, Germany).

5. Results and Discussion

Mineralogical Composition and Microstructure

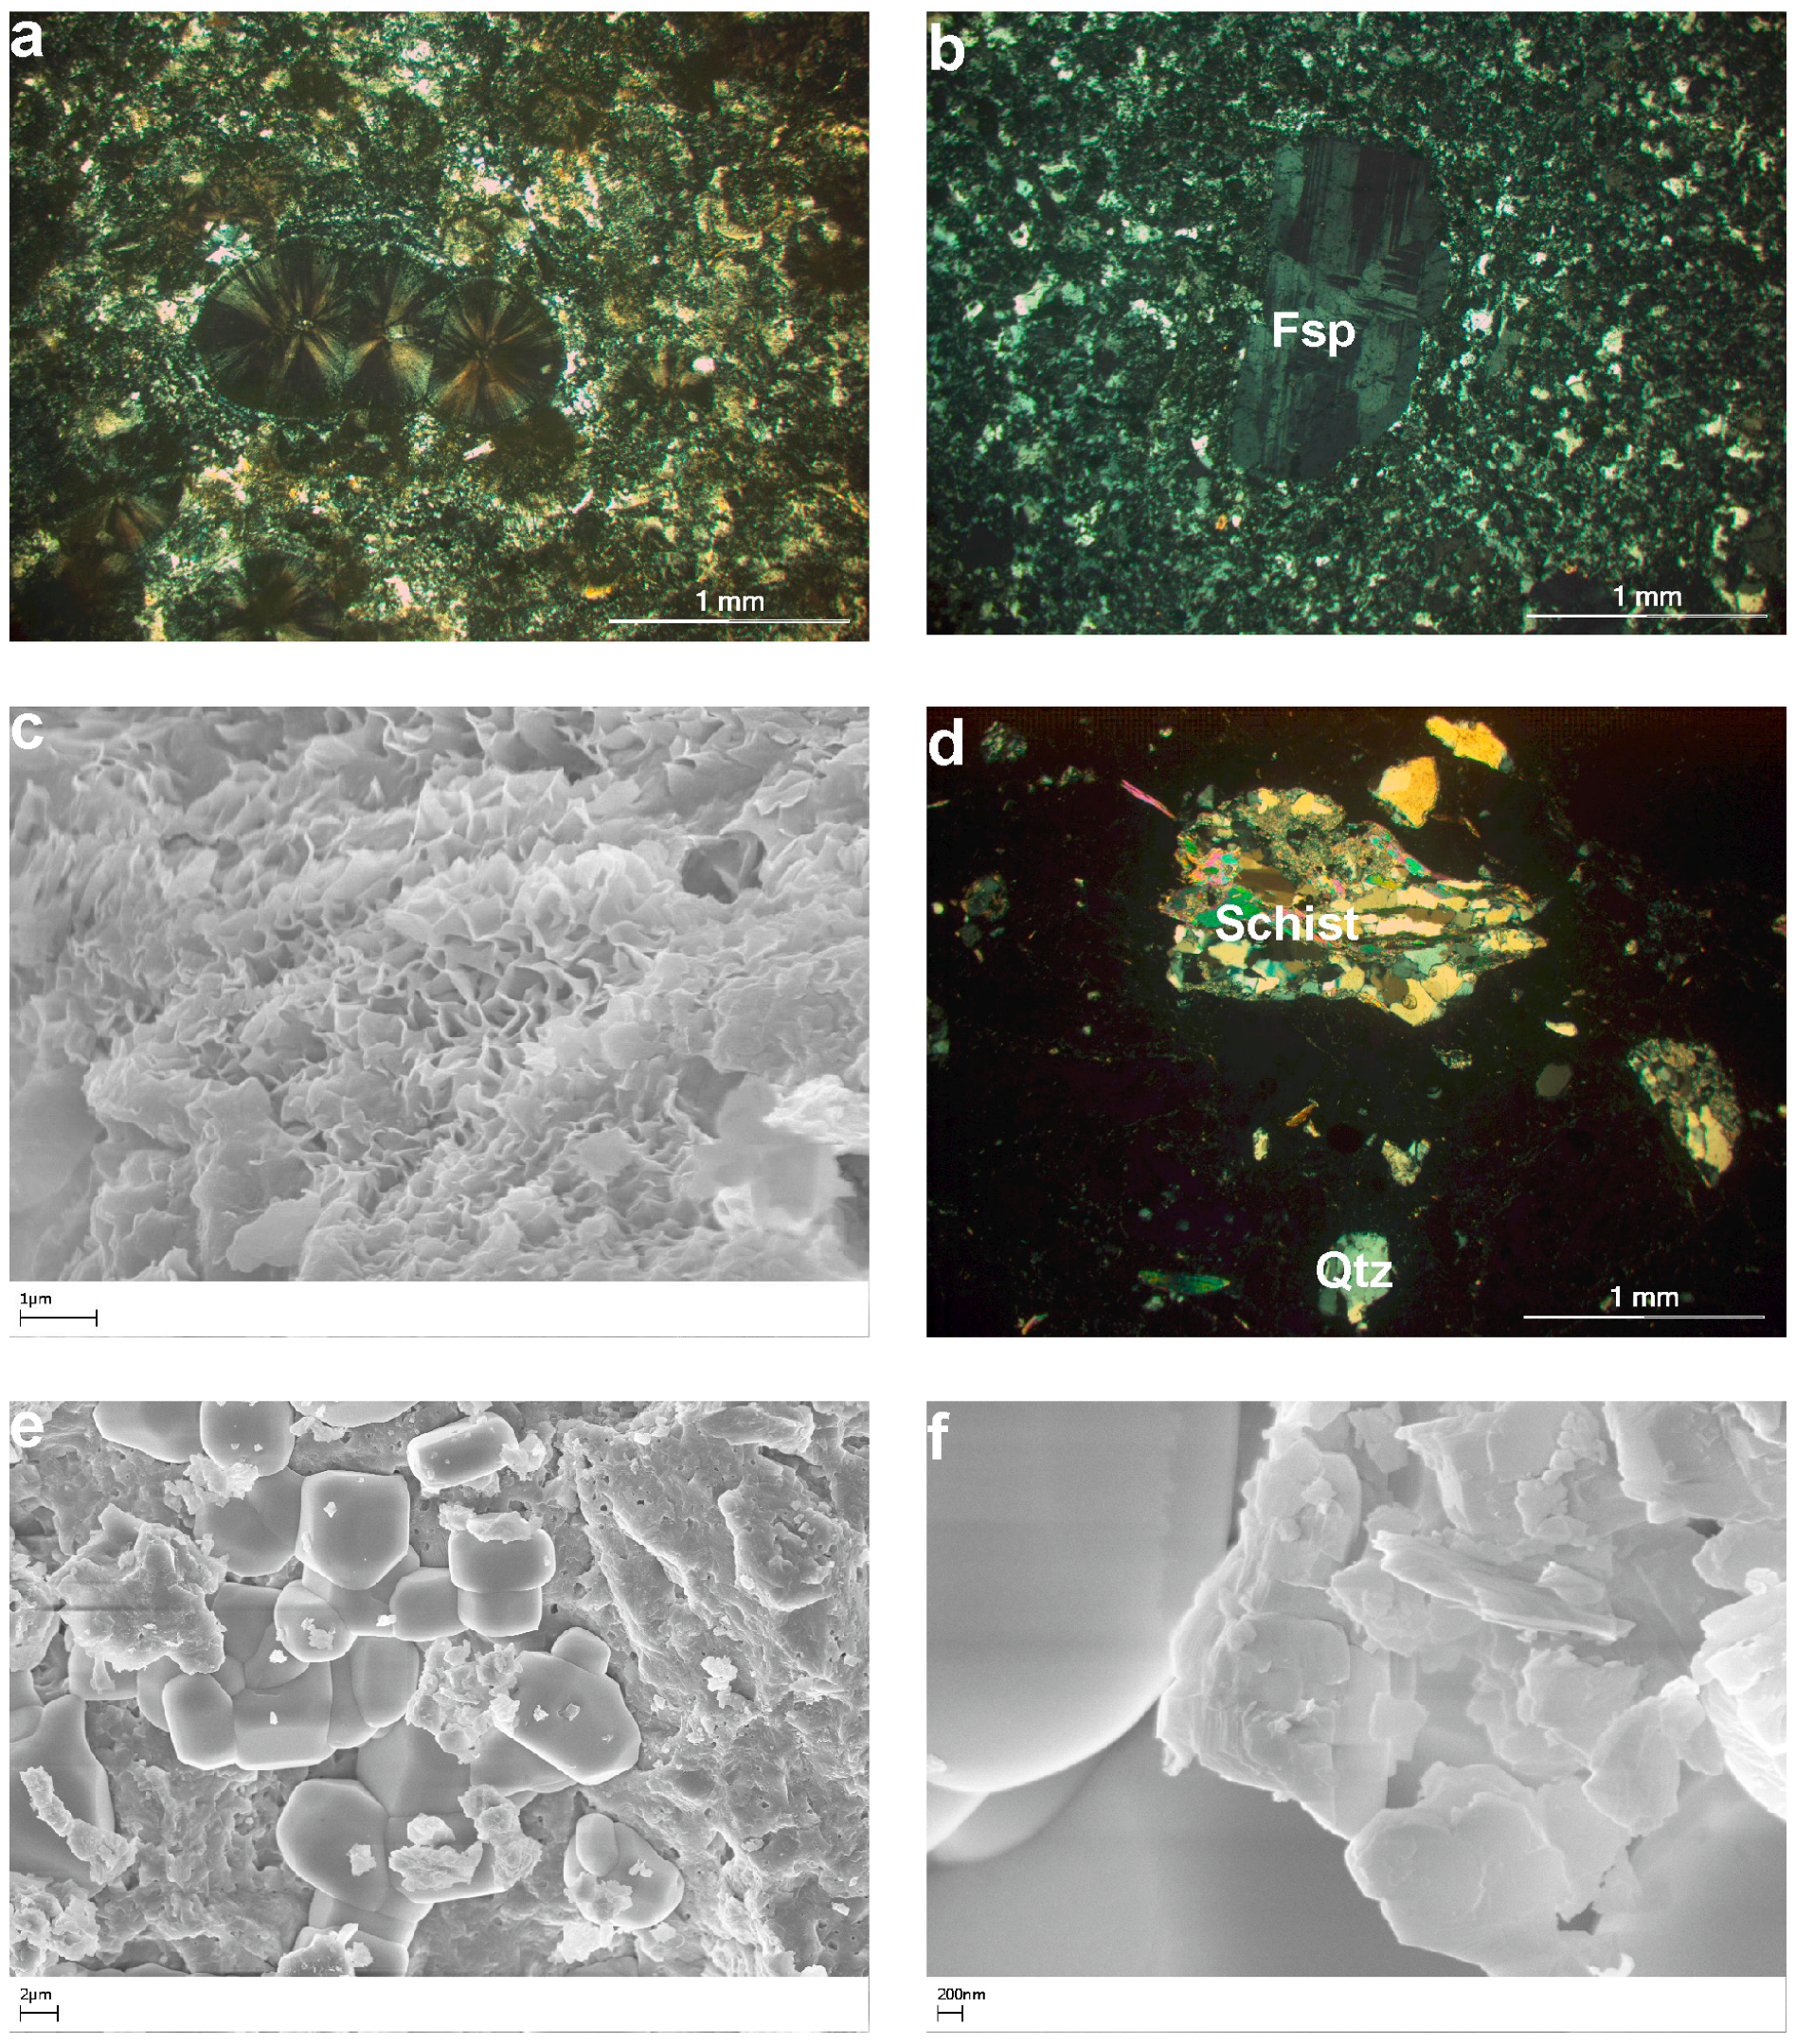
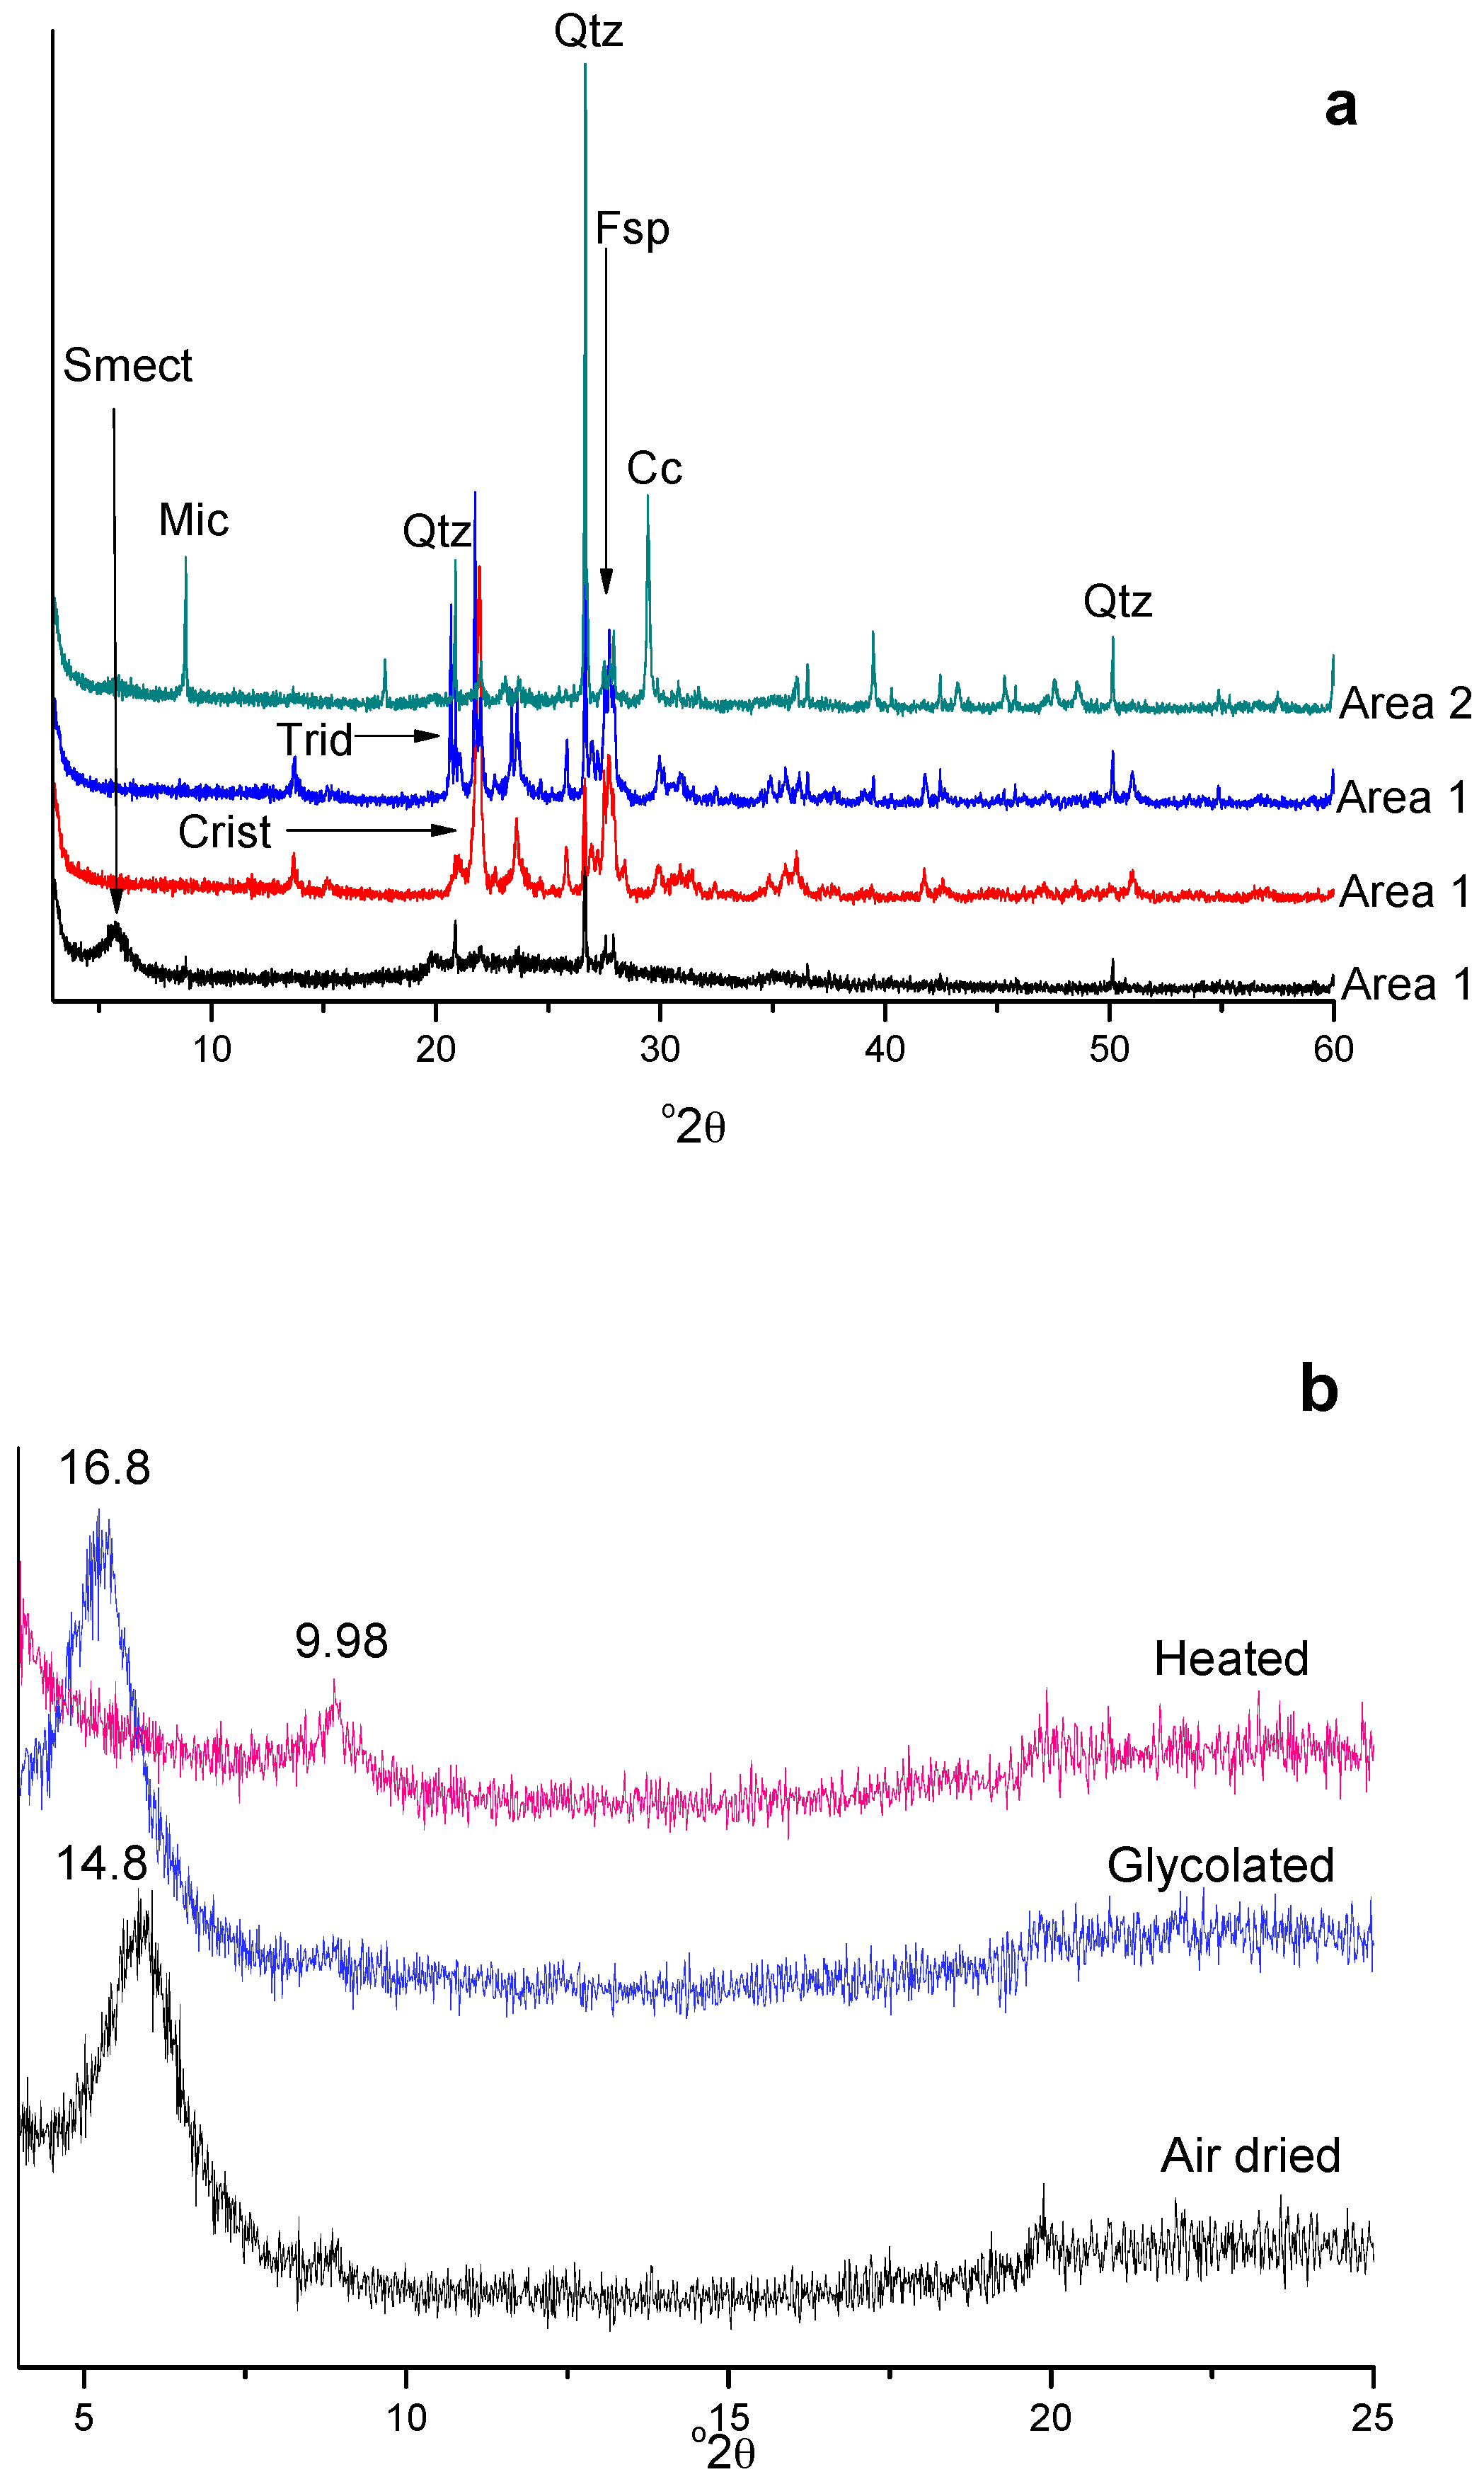
Map description (Figure 1) and this study classifies the samples from area 1 as rhyolitic tuffs. After macroscopic observation, they are characterized by a clastic texture. Under petrographic microscopy the rhyolitic tuffs present porphyritic and sferolitic texture (Figure 6a). Volcanic glass was observed by isotropic areas under petrographic microscopy and verified by the high background of XRD patterns (at low angles) and low intensity of all minerals peaks. The volcanic glass is dominated while the alteration to clay minerals (smectite) is evident mostly in feldspars and secondary in micas (Figure 6b,c). The presence of smectite in these rocks indicates a secondary, weathering formation. Fragments of mica schist are also observed in small amounts (Figure 6d). Assemblage includes silicon oxide phases (quartz, cristobalite or tridymite), feldspars and micas (muscovite and biotite), (Figure 6 and Figure 7) while infrequent opaque minerals are present, too.
The petrographic study of the collected sample from area 2 revealed that it is a volcanic rock, especially rhyolite, instead of rhyolitic tuff described in the map. Macroscopically, it is characterized by a bubbly texture, while the polarizing images of thin sections present mainly porphyritic and locally microlitic texture (Figure 6e). Moreover, the groundmass is mostly microcrystallic, porphyritic and locally spherulitic. The primary assemblage includes porphyritic feldspars (sanidine, microcline and albite), muscovite, illite and quartz, while apatite, hydroxides-oxides and calcite were also found as accessories minerals. Feldspars are partially altered to clay minerals (illite, Figure 6f and Figure 7).
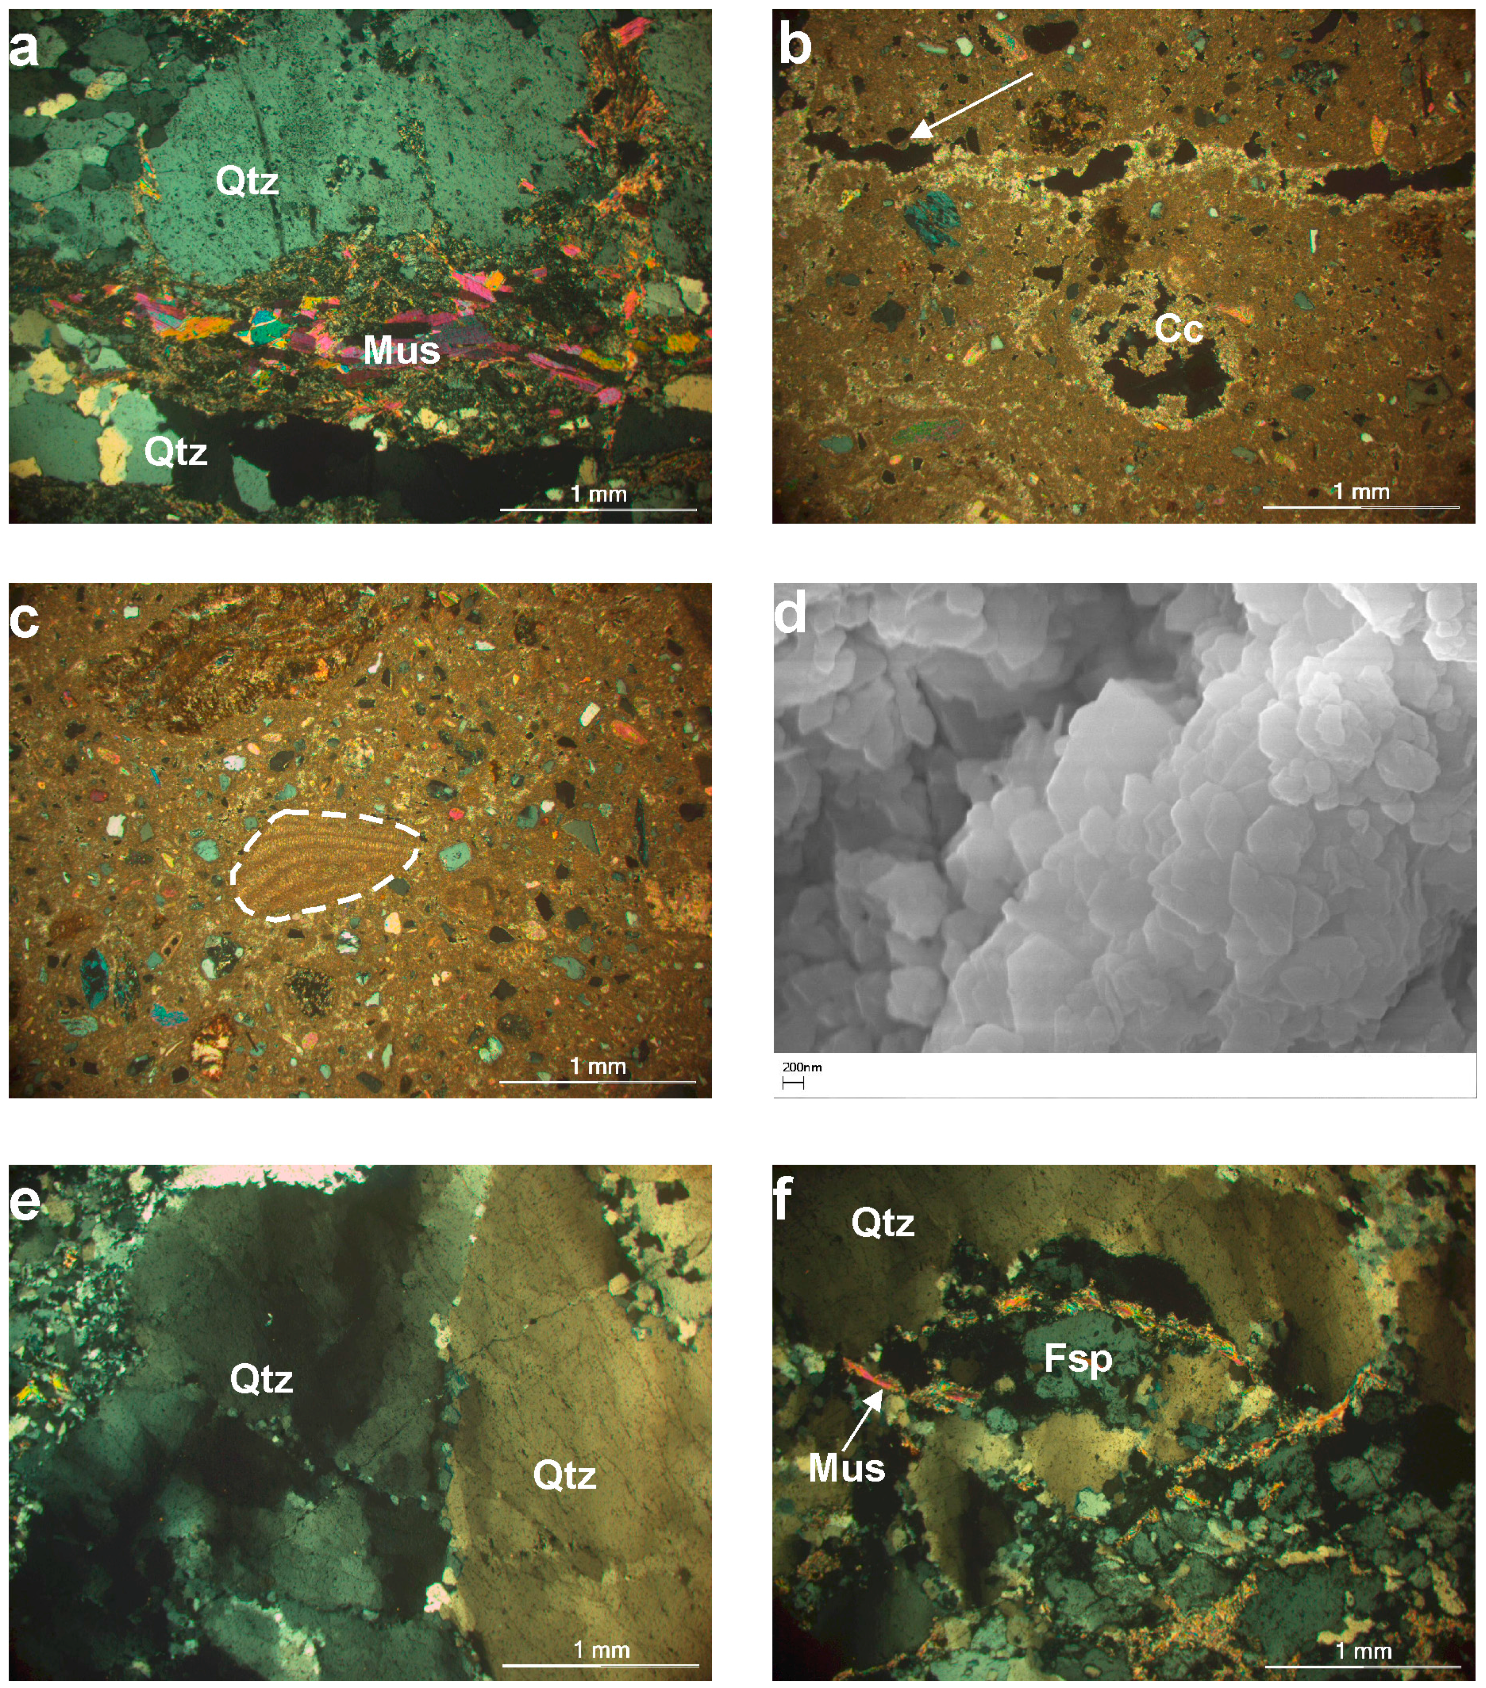
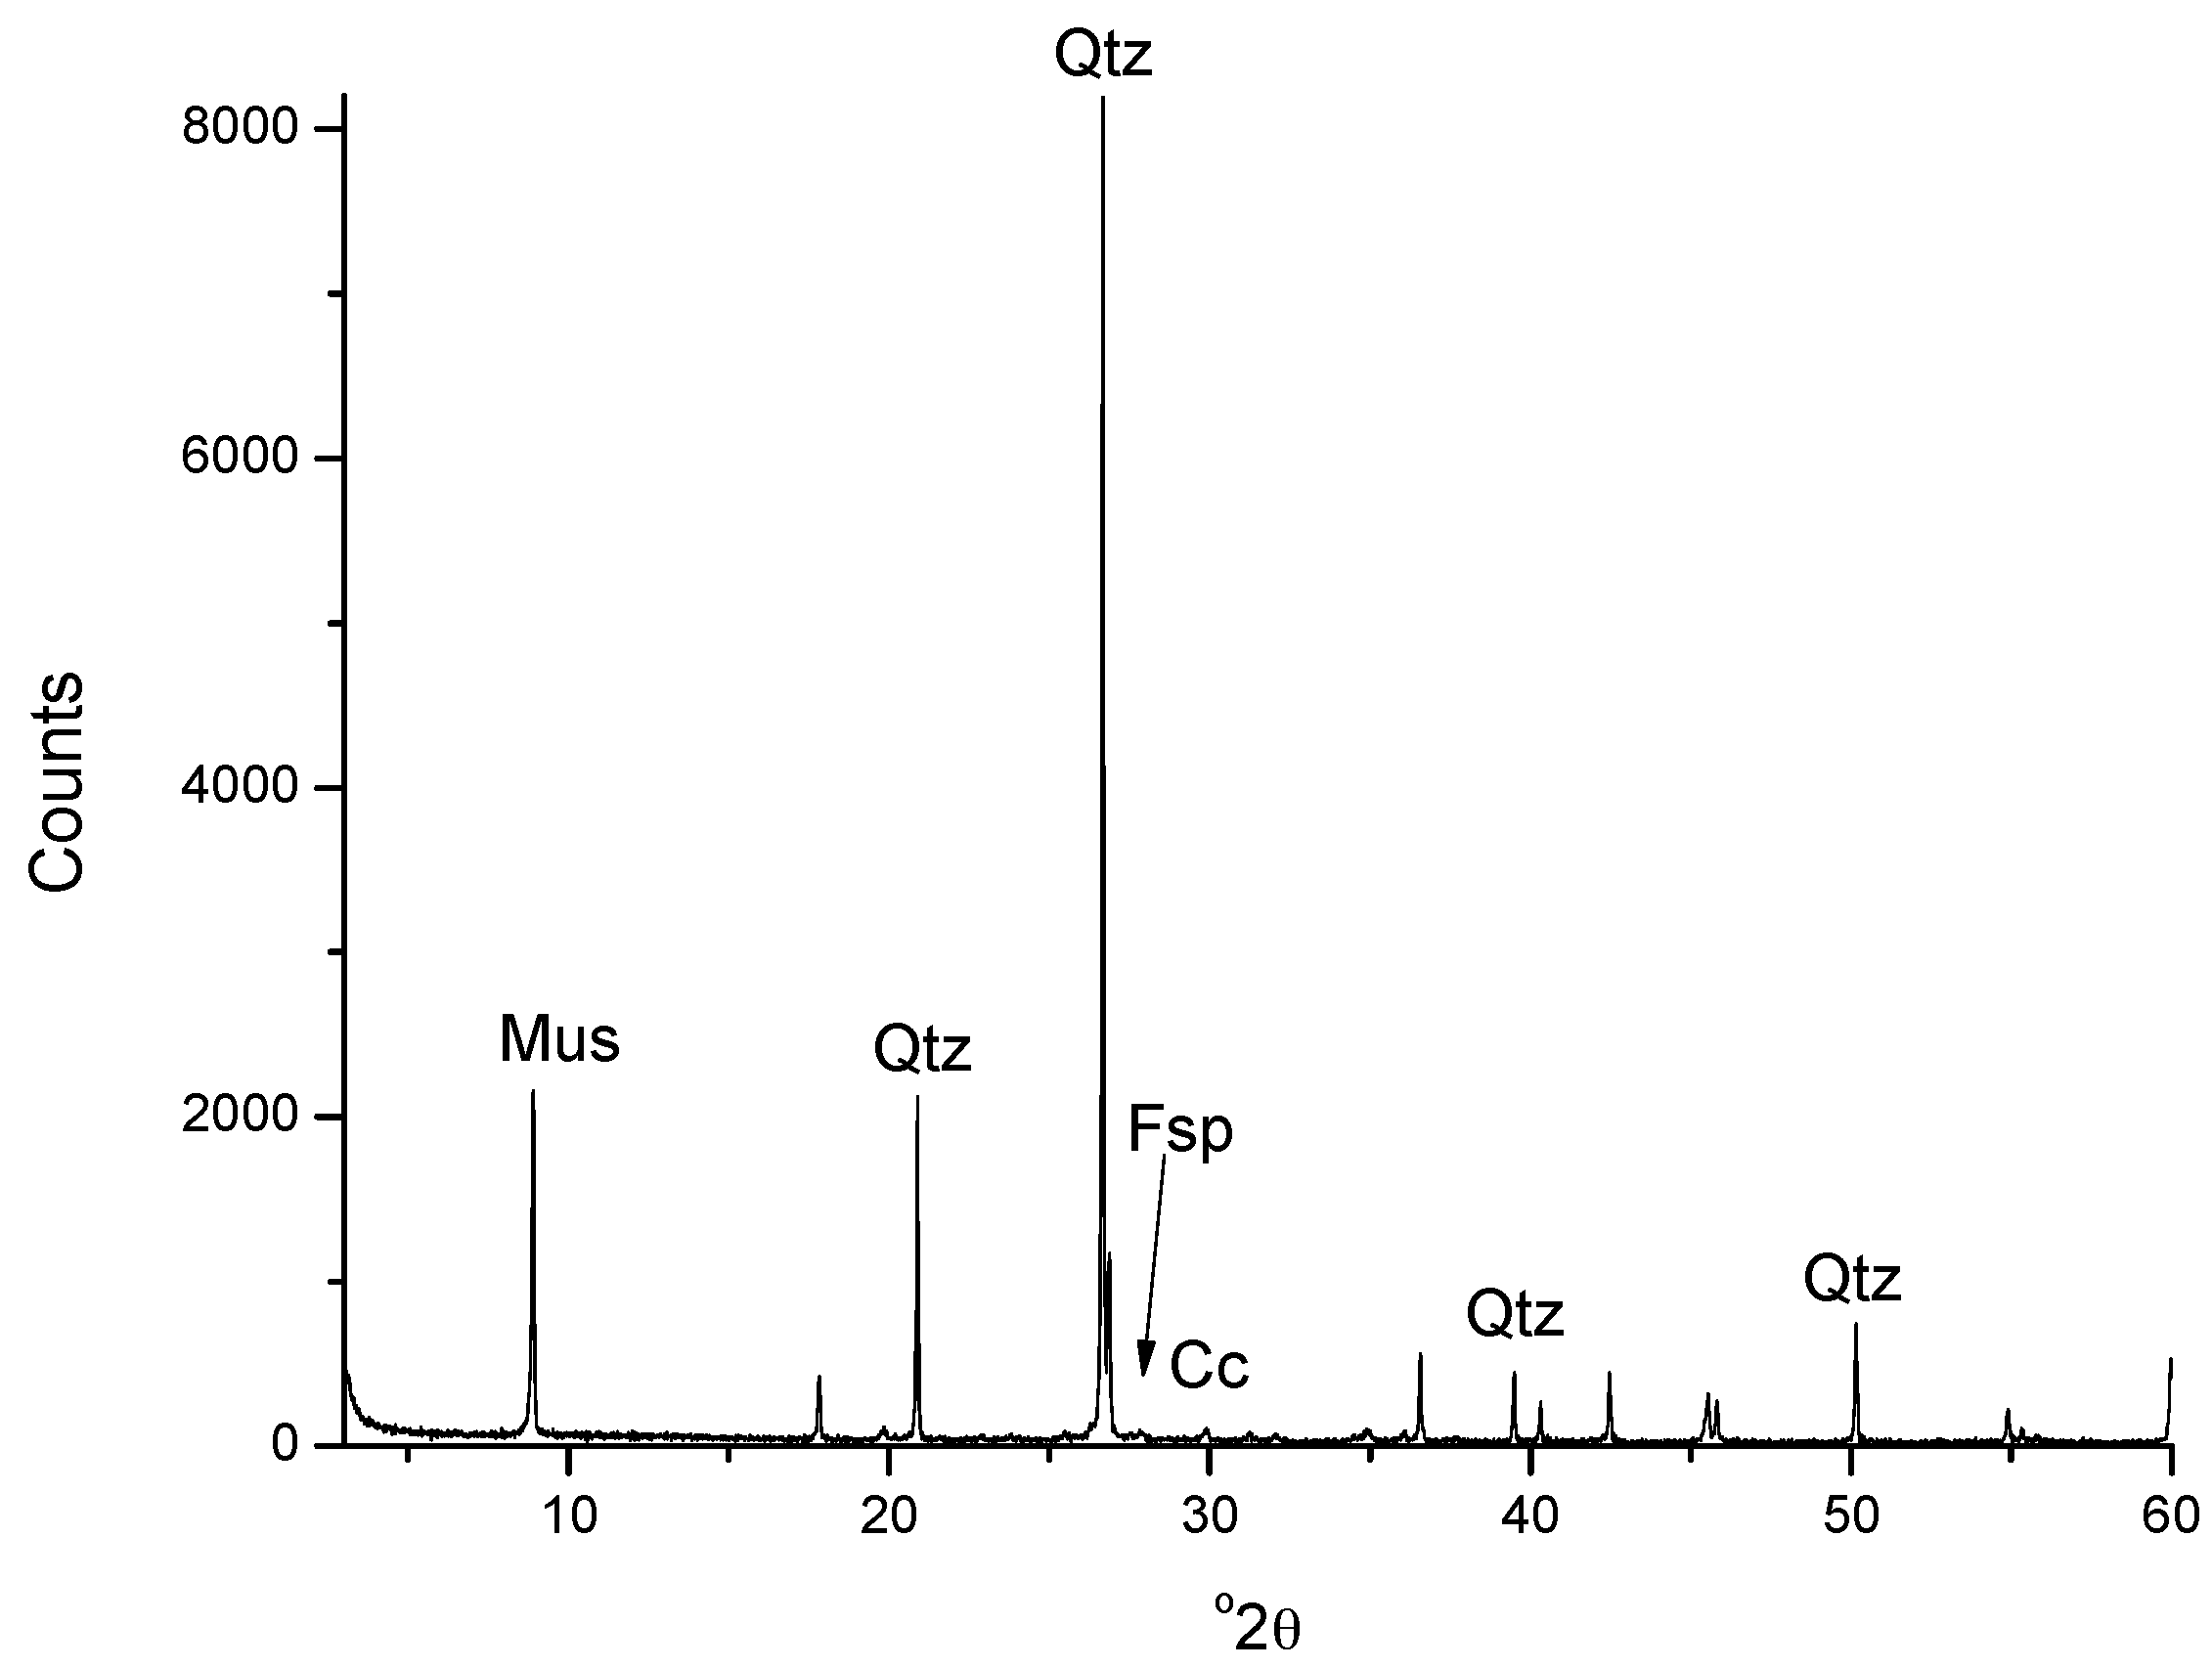
The collected sample from area 3 is a foliated metamorphic rock, more specifically mica schist, as it is classified in the field study and has been described in the map. It presents compact texture. Concerning the microscopic study, the schist presents granoblastic, lepidoblastic and locally nematoblastic texture. The primary assemblage includes quartz, muscovite, calcite and feldspars (Figure 8a and Figure 9). Infrequent opaque minerals and apatite are also observed in small amounts. Muscovite is generally oriented parallel to the foliation of the rock. As described in the previous paragraphs, although the field work in areas 1, 2 and 3, led to the collection of samples, the laboratory analysis revealed minor differences compared to the previous map.
Area 4 was detected from the satellite image processing as a zone of possible hydrothermal alteration (Figure 2 and Figure 3). All the digital processing techniques (ICA, PCA and Tasseled Cap) applied on Quickbird and ALOS VNIR data allocated the exact same regions as field areas where mapping and sampling should be performed. However, as mentioned in [38] the geological materials detected using remote sensing techniques need to be confirmed through a vigorous campaign of ground-based field investigations. Samples from the specific zone were collected and analyzed in the lab in order to define precisely the composition of the mineral. This is a usual synergy in geological remote sensing. In a similar study [13], digital processing of ASTER data (ratio images, alteration indices and false color composites) were combined with lab geochemical analysis and especially with X-ray fluorescence spectrometry (XRF), Electron microprobe analyses (EMPA) and X-ray diffraction (XRD). Collected samples from the alteration zone were analyzed using XRD, Scanning Electronic Microscope (SEM) and atomic absorption analysis (using ICPMS) after the initial processing of remote sensing data (band rationing, PCA and Crósta technique) as described in [19]. Samples used for spectral analysis and other selected samples were further analyzed using the X-ray powder diffraction method for identification of minerals [39]. Moreover, thin sections of selected samples were prepared to study the petrological characters of minerals and to confirm their occurrences in the study region [39]. Classification of ASTER data using the JPL and USGS spectral libraries was also combined with laboratory analysis (Scanning Electron Microscope (SEM), Flame Atomic Absorption Spectroscopy (FAAS) and Graphite Furnace Atomic Absorption Spectroscopy (GFAAS) in another study [40]. The macroscopic examination of the samples collected in area 4 predicated the impact of metamorphic or volcanic activity and it was obvious that the characterization of these rocks was not in accordance with the map description, as schist. Thus, the further analysis in the lab was necessary.
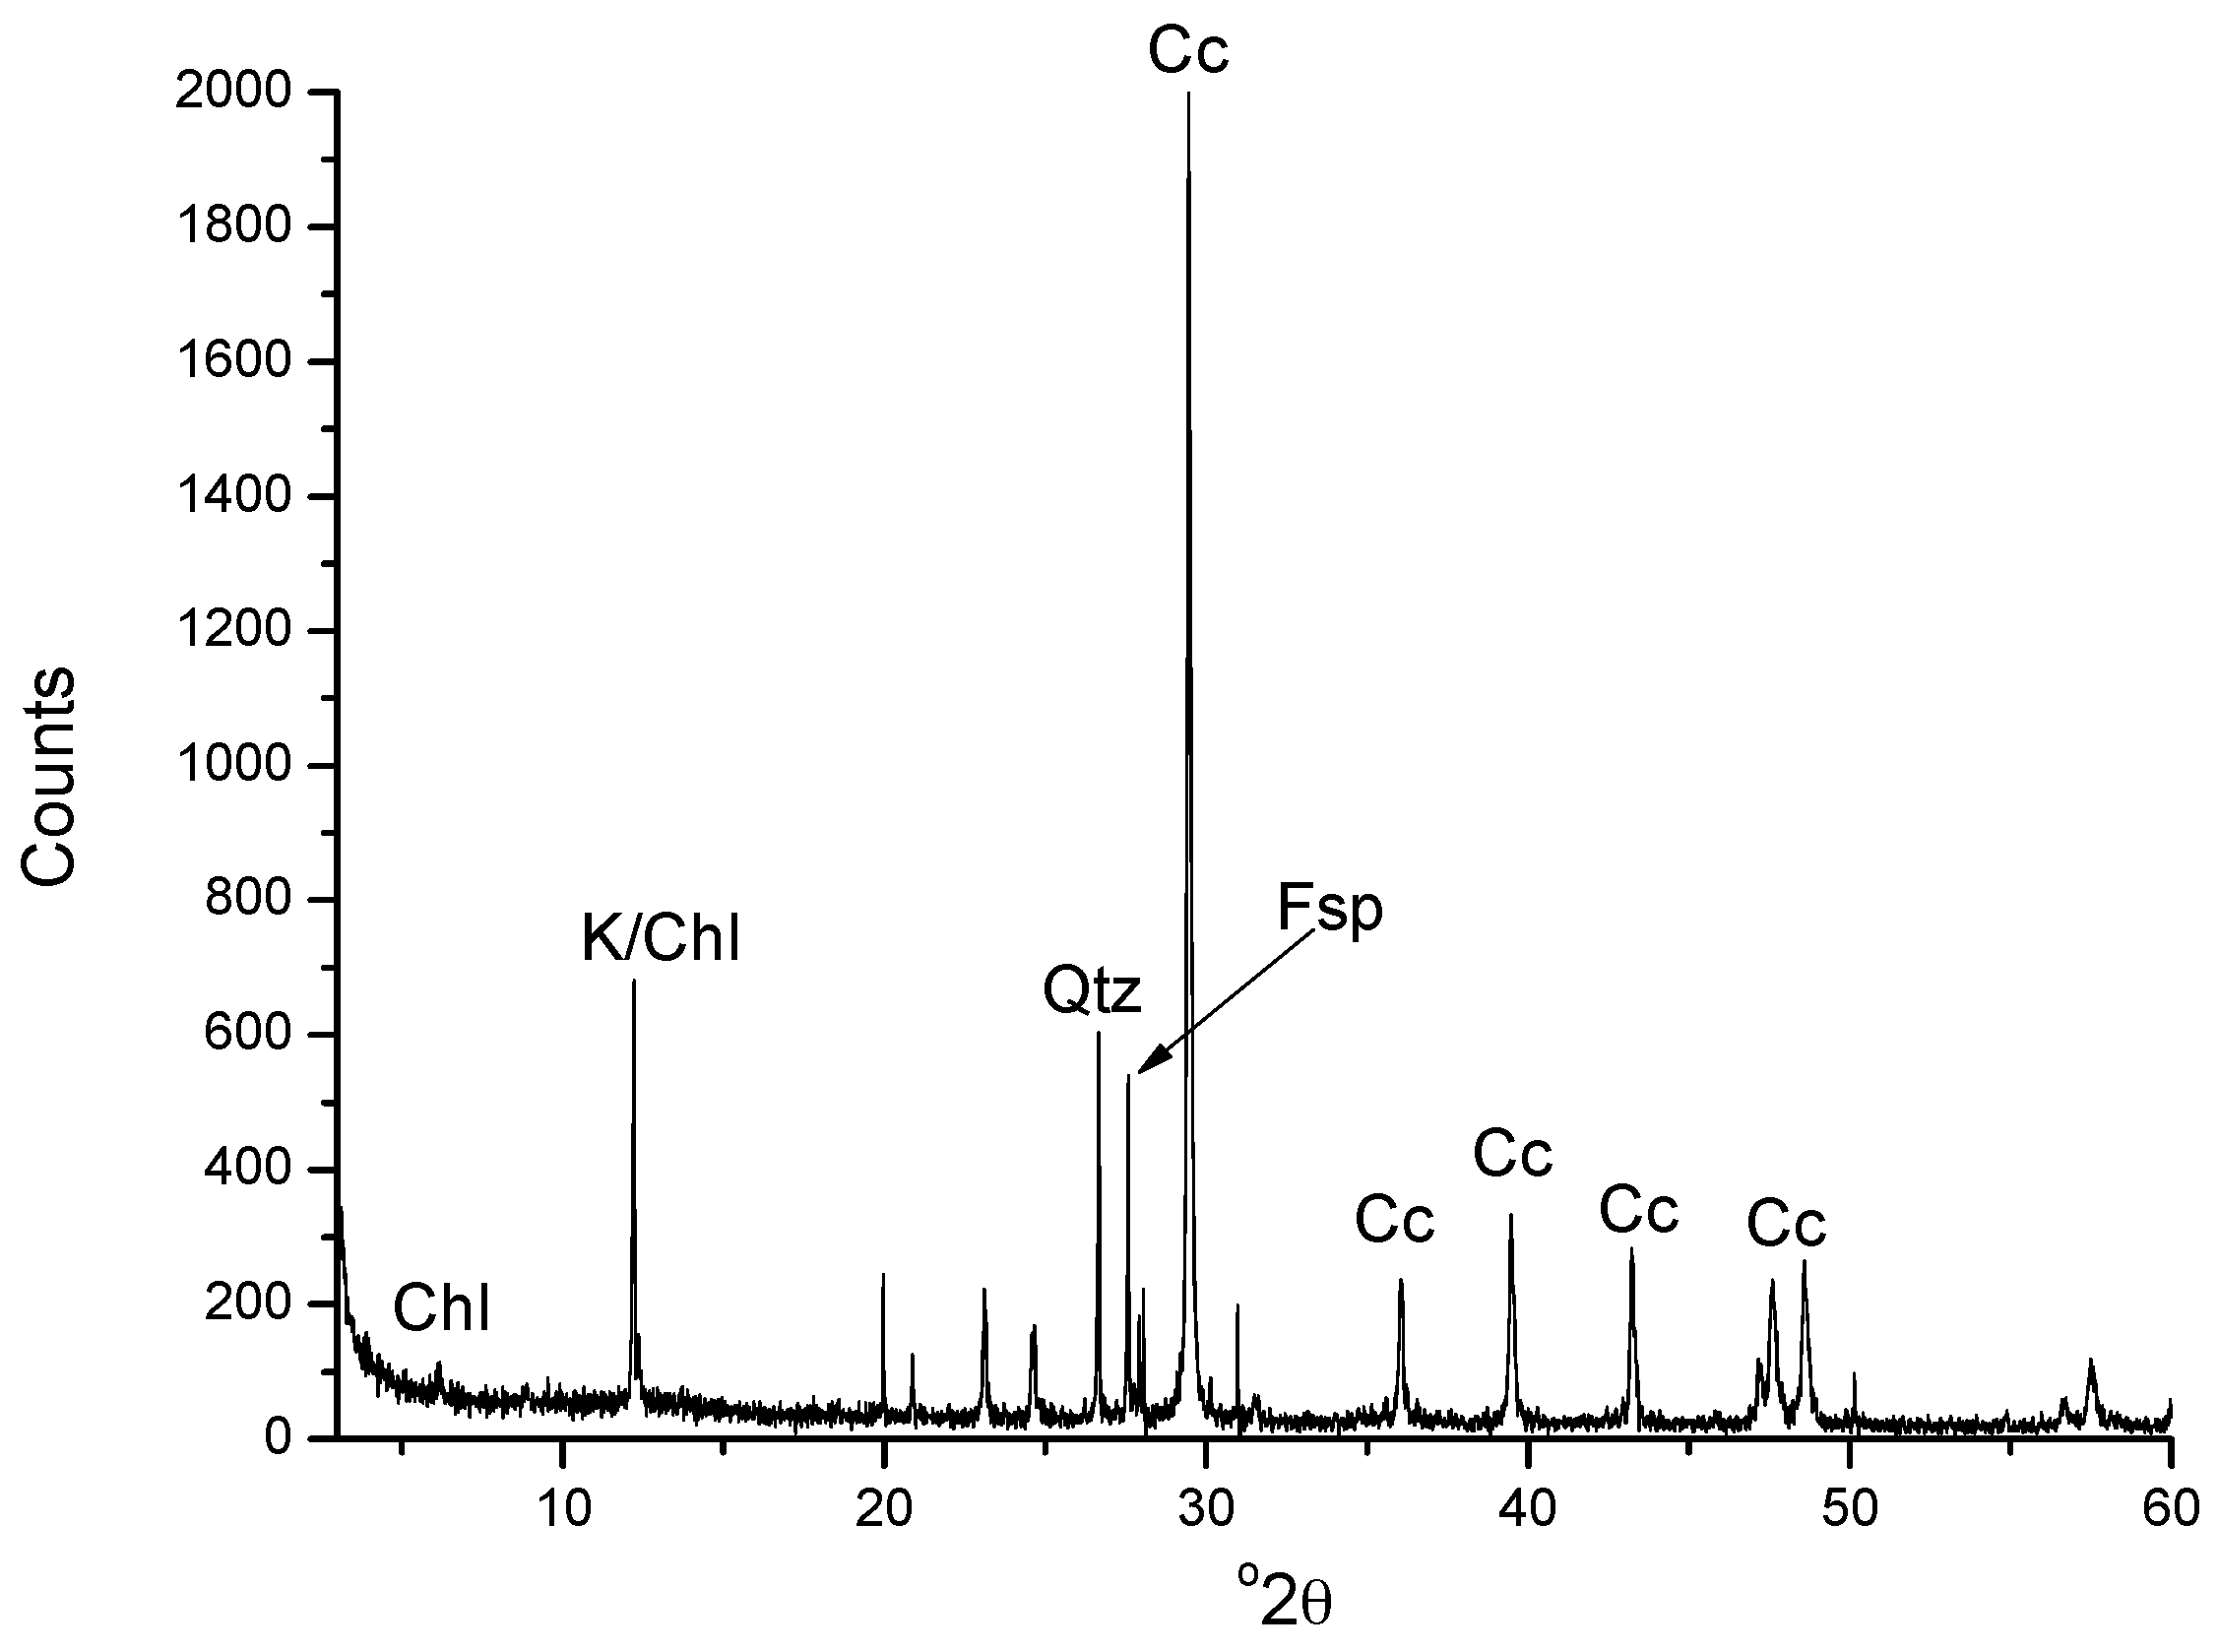
The collected sample from area 4 is a fossiliferous limestone which includes micritic matrix of calcite with an insignificant amount of fossils (Figure 8b,c and Figure 10). Endoclasts of feldspars, pyroxene, quartz and micas (muscovite and biotite) were also observed. Moreover, areas with channel porosity, filled with clay minerals (chlorite and traces of kaolinite) and recrystallized calcite occurred in small percentages (Figure 8d). Crystals of relatively small size (usually less than 1 μm) and of pseudohexagonal shape where detected that are probably Kaolinite.
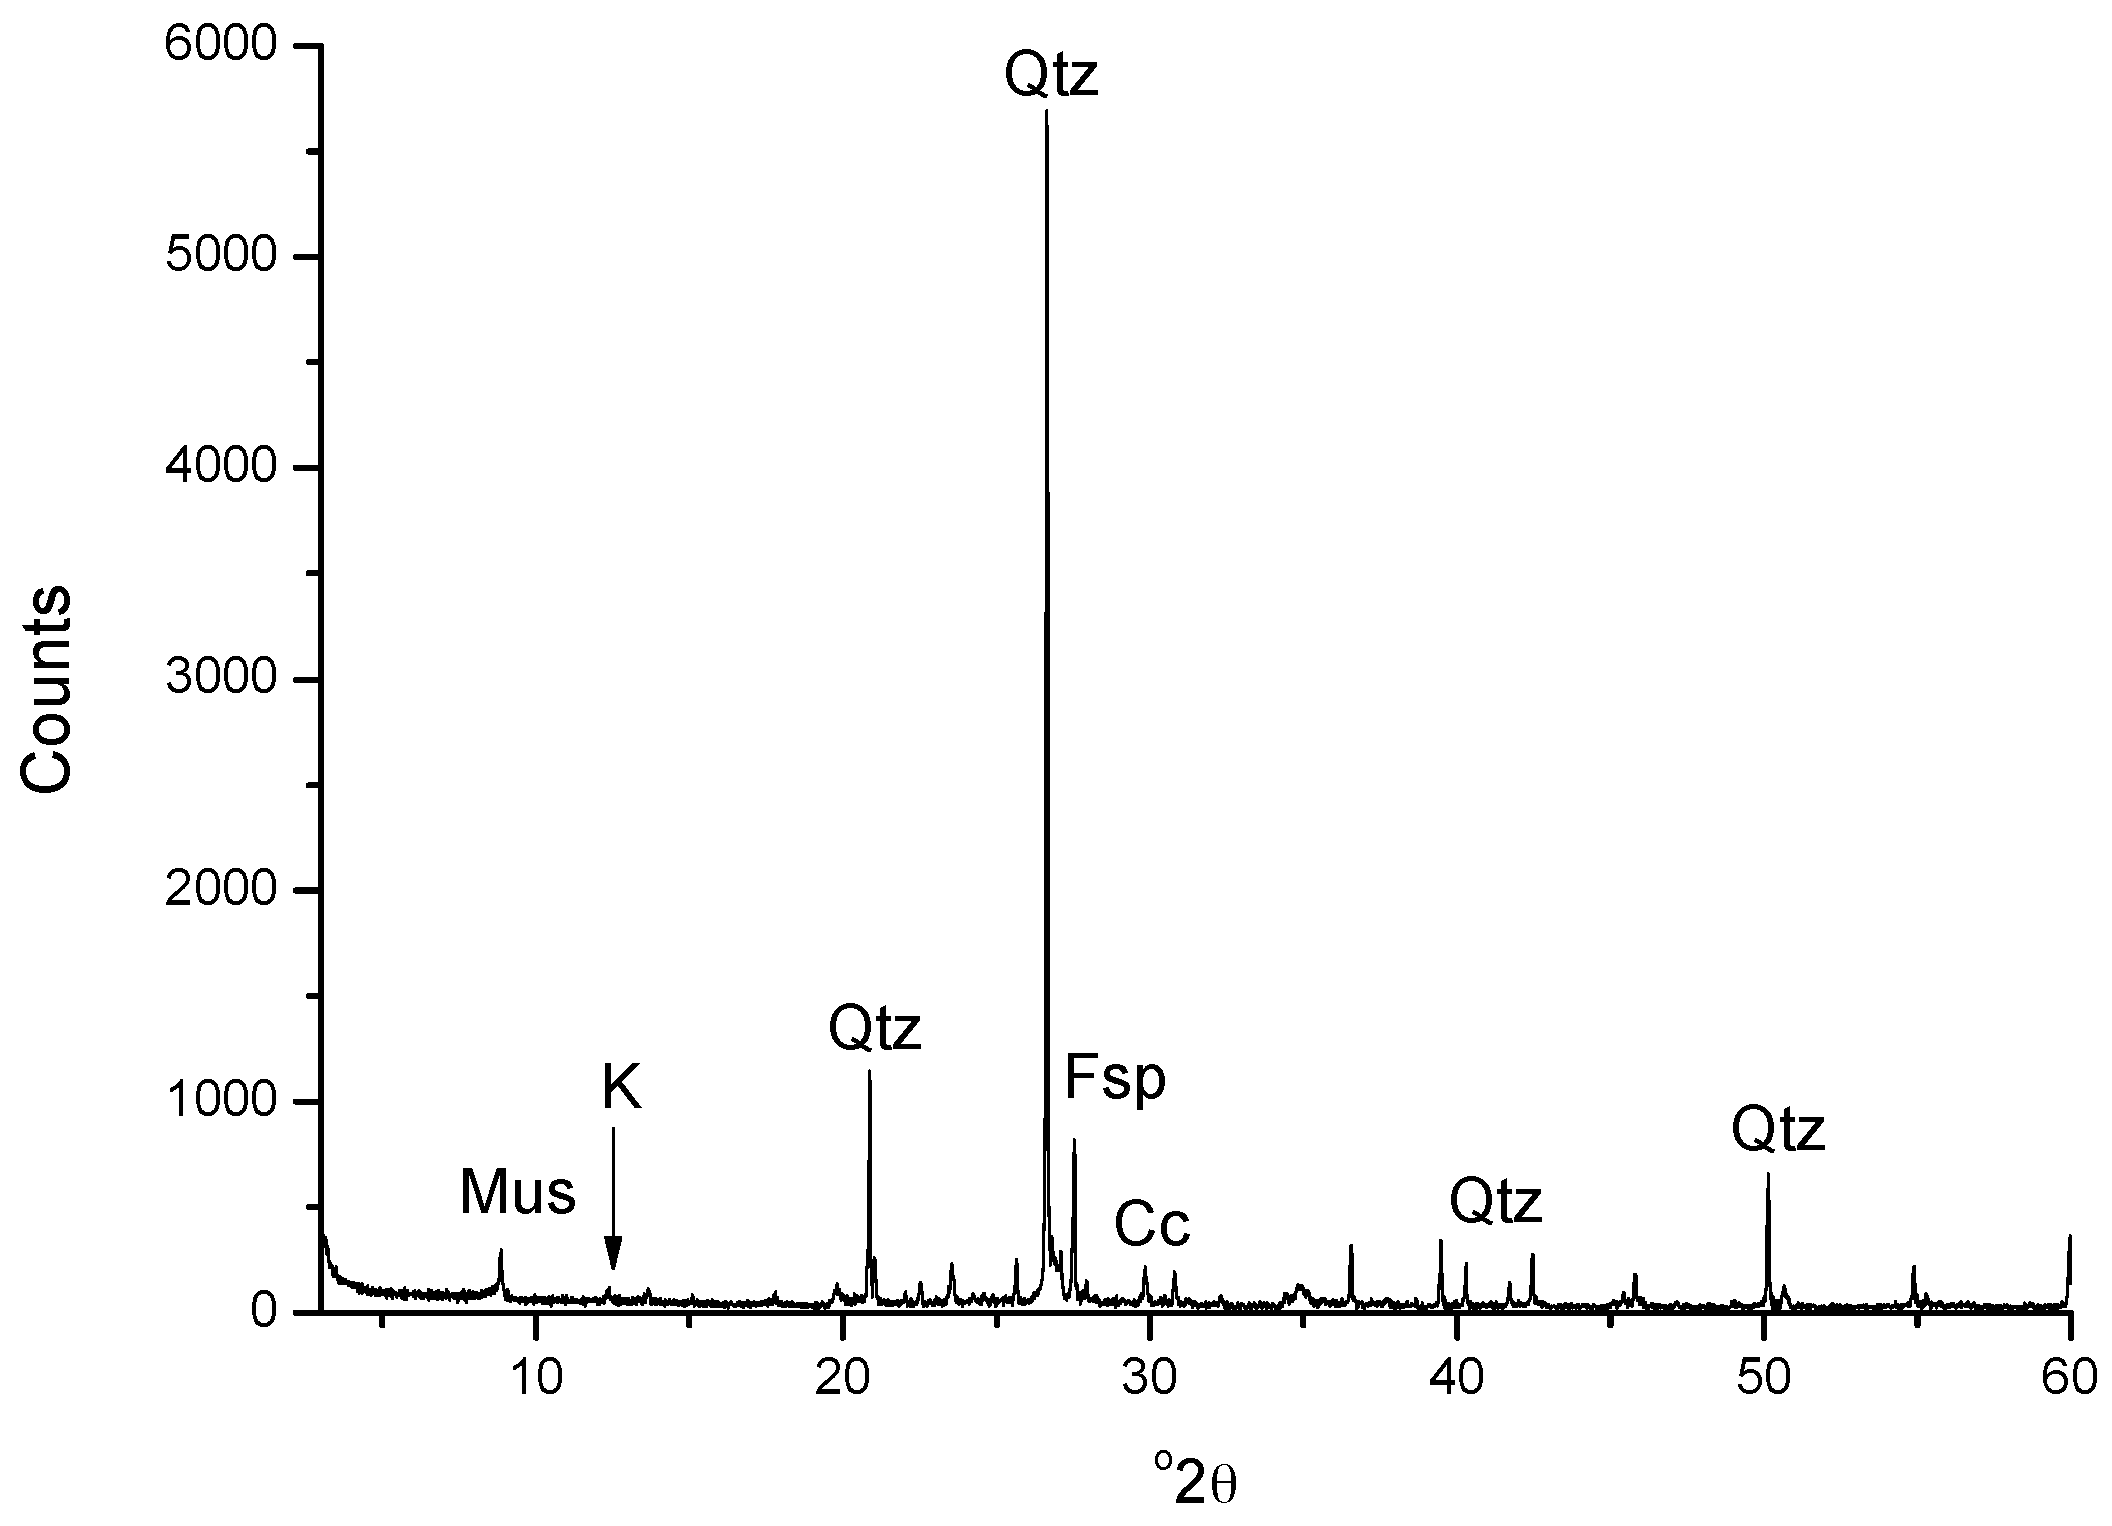
The laboratory study in field area 5 (Figure 1) confirmed the remote sensing data revealing a plutonic exposure in the metamorphic rocks, which is absent from the initial map. The laboratory study classified this rock as pegmatite and not as marble, as it was named initially after the macroscopic observation. Concerning the microscopic study, the collected sample presents granular texture. The mineral composition consists mainly of quartz and low amounts of feldspars, calcite, fine grained muscovite and kaolinite traces ( Figure 8e,f and Figure 11). Infrequent opaque minerals and apatite are also observed. The coarse quartz crystals are characterized by intense undulate extinction, while the rims of them are surrounded by fine grained recrystallized quartz (Figure 8e,f).
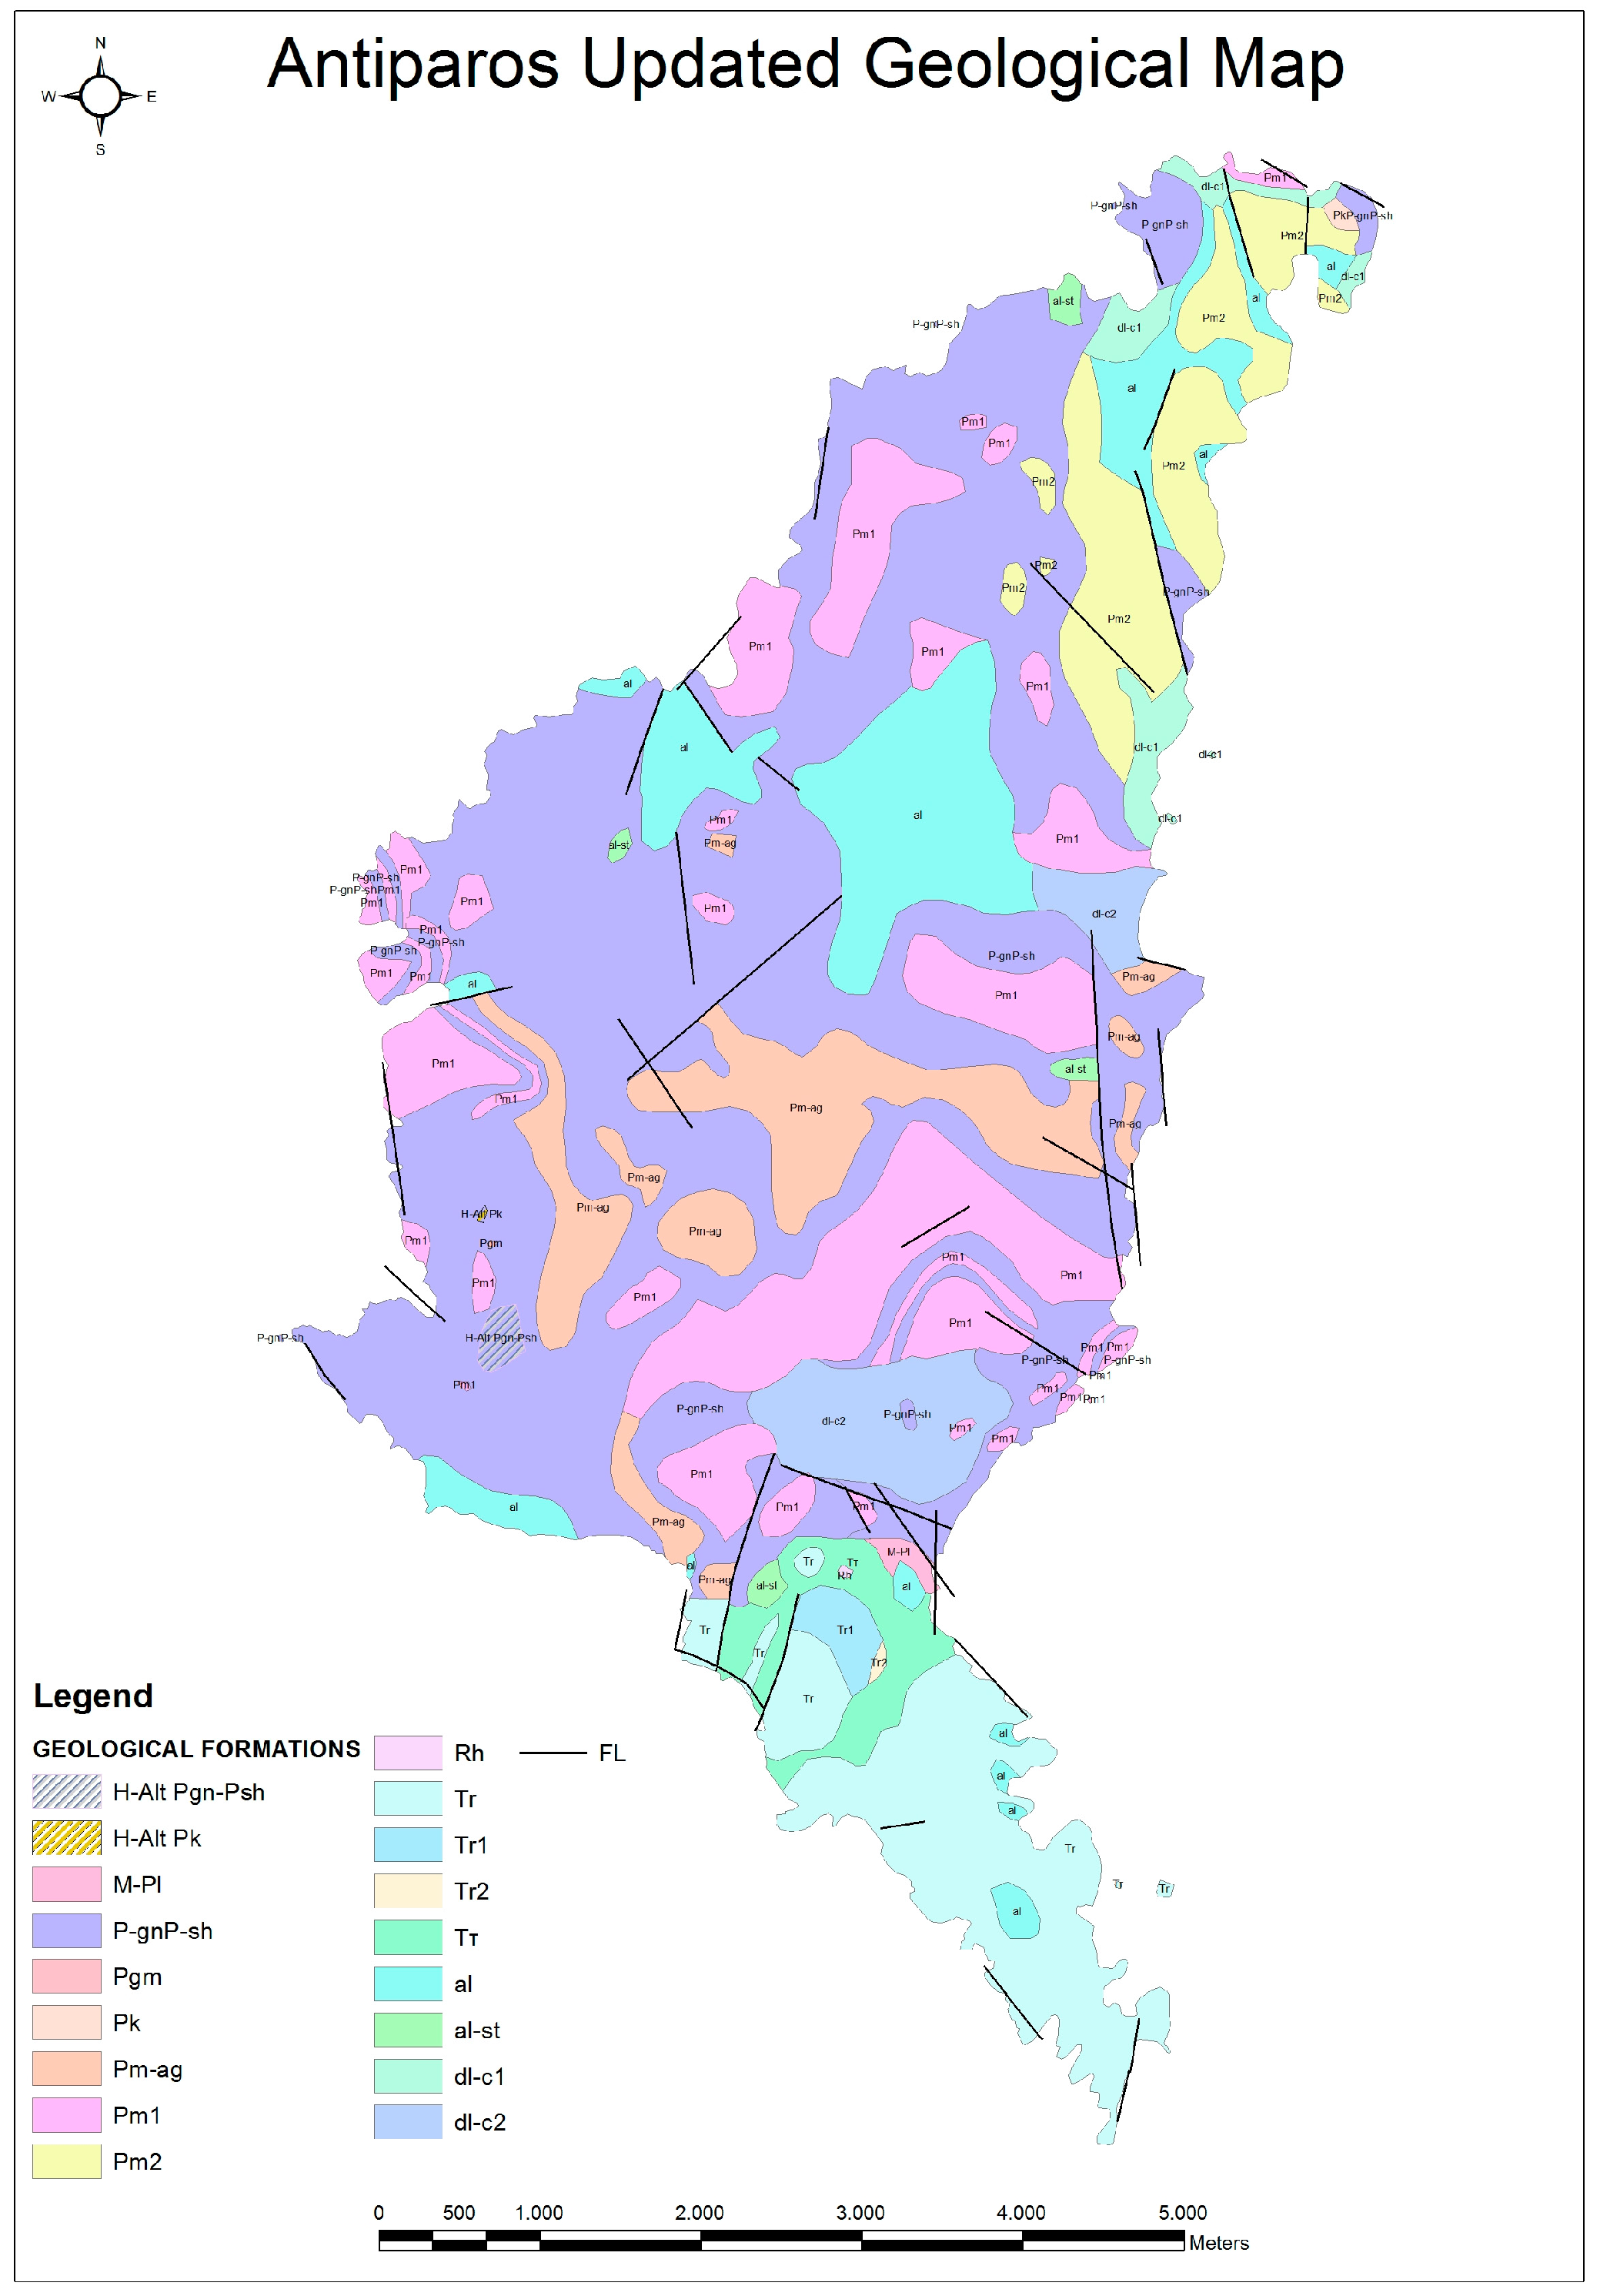
All the above results have been implemented in the GIS database and a new geological map of the study area at 1/25.000 scale was created (Figure 12). The spatial information (changes to the formation boundaries) was retrieved from the orthorectified satellite images while the non-spatial information (new formation type) was revealed from the petrographic analysis. The synergy of remote sensing data processing, GIS and mineralogical analyses produced a digitally updated geological map with minimum cost.

6. Conclusions

In this study remote sensing data, mineralogical analyses, microstructure studies and Geographic Information System were combined and provided the update of the Geological Map of Antiparos Island (Greece) at 1/25.000 scale. It was proven that the processing of remote sensing data determines specific areas where field survey should focus and thus decreases the required time in the field and reduces the total cost. Furthermore, the synergy of the petrography and mineralogy with remote sensing reveals not only the surface location of each formation but also the chemistry, the formation conditions and its depth. GIS technology proved very useful both in the field work and in the production of the final map.
In the case of Antiparos Island, new data revealed that two major corrections should be made in the geological map of Antiparos concerning the volcanic rocks of the island. Additionally, significant alterations were detected in the studied volcanic rocks that were not previously reported, including smectite formation.

Acknowledgments

The authors wish to thank A.K. Seferlis of the laboratory of Electron Microscopy and Microanalysis, University of Patras and V. Drakopoulos for their help with the Microanalyses and SEM photomicrographs.

Author Contributions

Konstantinos G. Nikolakopoulos has performed the field measurements and sampling, the remote sensing data processing, the implementation of the spatial data in GIS and the production of the updated map. He wrote the respective parts in the current paper. Paraskevi Lampropoulou carried on the XRD analyses and contributes to the mineralogical analyses and she wrote the respective parts of the current paper. Dimitrios Papoulis provided the SEM analyses and contribute to the mineralogical analyses especially concerning clay minerals and he wrote the respective parts of the current paper, Aikaterini Rogkala participated in the petrographic study of the collected rock samples and wrote the relevant part of this paper, Panagiota P. Giannakopoulou participated in the petrographic study of the collected rock samples and wrote the relevant part of this paper, and Petros Petrounias participated in the petrographic study of the collected rock samples and wrote the relevant part of this paper.

Conflicts of Interest

The authors declare no conflict of interest.

References

  1. Goetz, A.F.H.; Rowan, L.C. Geologic remote-sensing. Science 1981, 211, 781–791. [Google Scholar] [CrossRef] [PubMed]
  2. Abrams, M. The Advanced Spaceborne Thermal Emission and Reflection Radiometer (ASTER): Data products for the high spatial resolution imager on NASA’s Terra platform. Int. J. Remote Sens. 2000, 21, 847–859. [Google Scholar] [CrossRef]
  3. Yamaguchi, Y.; Kahle, A.B.; Tsu, H.; Kawakami, T.; Pniel, M. Overview of Advanced Spaceborne Thermal Emission and Reflection Radiometer (ASTER). IEEE Trans. Geosci. Remote Sens. 1998, 36, 1062–1071. [Google Scholar] [CrossRef]
  4. Abrams, M.; Hook, S.J. Simulated ASTER data for geologic studies. IEEE Trans. Geosci. Remote Sens. 1995, 33, 692–699. [Google Scholar] [CrossRef]
  5. Cudahy, T.; Hewson, R. ASTER geological case histories: Porphyry-skarn-epithermal, iron oxide Cu-Au and Broken Hill Pb-Zn-Ag. In Proceedings of the Annual General Meeting of the Geological Remote Sensing Group (ASTER Unveiled), London, UK, 5–7 December 2002. [Google Scholar]
  6. Nikolakopoulos, K.G.; Vaiopoulos, D.A.; Skianis, G.A. Use of multitemporal remote sensing data for mapping the Alfios River network changes from 1977 to 2000. Geocarto Int. 2007, 22, 251–271. [Google Scholar] [CrossRef]
  7. Nikolakopoulos, K.G.; Tsombos, P.I.; Skianis Aim, G.; Vaiopoulos, D.A. EO-1 Hyperion and ALI bands simulation to Landat 7 ETM+ bands for mineral mapping in Milos Island. In Proceedings of the SPIE Remote Sensing, Cardiff, Wales, UK, 15–18 September 2008; Volume 7110, p. 711010. [Google Scholar] [CrossRef]
  8. Deroin, J.P.; Dhont, D.; Jabbour, M.; Chorowicz, J.; Fruneau, B. Geological mapping in the zone of Chotts, Tunisia, using ALOS sensors. In Proceedings of the 2009 IEEE International Geoscience and Remote Sensing Symposium, Cape Town, South Africa, 12–17 July 2009. [Google Scholar]
  9. Nikolakopoulos, K.G.; Tsombos, P.I.; Mitropoulos, D.; Zervakou, A.; Grasemann, B.; Iglseder, C.; Petrakakis, K.; Müller, M.; Hugh, A.N.; Voit, K.R.; et al. Updating the 1/50.000 geological maps of IGME with remote sensing data, marine geology data, GPS measurements and GIS techniques: The case of KEA Island. In Proceedings of the SPIE Remote Sensing, Berlin, Germany, 31 August–3 September 2009; Volume 7478, p. 747800. [Google Scholar] [CrossRef]
  10. Marchesi, S.; Bruzzone, L. ICA and KERNEL ICA for change detection in multispectral remote sensing images. In Proceedings of the 2009 IEEE International Geoscience and Remote Sensing Symposium, Cape Town, South Africa, 12–17 July 2009. [Google Scholar]
  11. Nikolakopoulos, K.G.; Gioti, E. Open Quarry Detection Using Multispectral and Hyperspectral Data. In Proceedings of the 31st EARSeL Symposium “Remote Sensing and Geoinformation Not Only for Scientific Cooperation”, Prague, Czech Republic, 30 May–2 June 2011; pp. 152–159. [Google Scholar]
  12. Leverington, D.W.; Moon, W.M. Landsat-TM-Based Discrimination of Lithological Units Associated with the Purtuniq Ophiolite, Quebec, Canada. Remote Sens. 2012, 4, 1208–1231. [Google Scholar] [CrossRef]
  13. Brandmeier, M.; Erasmi, S.; Hansen, C.; Höweling, A.; Nitzsche, K.; Ohlendorf, T. Mapping patterns of mineral alteration in volcanic terrains using ASTER data and field spectrometry in Southern Peru. J. S. Am. Earth Sci. 2013, 48, 296–314. [Google Scholar] [CrossRef]
  14. Mielke, C.; Boesche, N.; Rogass, C.; Kaufmann, H.; Gauert, C.; de Wit, M. Spaceborne mine waste mineralogy monitoring in South Africa, applications for modern push-broom missions: Hyperion/OLI and EnMAP/Sentinel-2. Remote Sens. 2014, 6, 6790–6816. [Google Scholar] [CrossRef]
  15. Van der Werff, H.; van der Meer, F. Sentinel-2 for mapping iron absorption feature parameters. Remote Sens. 2015, 7, 12635–12653. [Google Scholar] [CrossRef]
  16. Deffontaines, B.; Tabyaoui, H.; El Hammichi, F.; Chaouni, A.; Mounadel, A.; Lahsaini, M.; Magalhaes, S.; Fortunato, G. Importance of Geological Map Updates in Engineering Geology, Application to the Rif-Chain and Its Foreland (Northern Morocco). Eng. Geol. 2015, 6, 101–105. [Google Scholar] [CrossRef]
  17. Oikonomidis, D.; Nikolakopoulos, K.G. Lava age discrimination of Kammenes islands, Santorini volcano, Greece, using remote sensing data. J. Appl. Remote Sens. 2015, 9, 096014. [Google Scholar] [CrossRef]
  18. Calvin, W.M.; Littlefield, E.F.; Kratt, C. Geothermics remote sensing of geothermal-related minerals for resource exploration in Nevada. Geothermics 2015, 53, 517–526. [Google Scholar] [CrossRef]
  19. Gabr, S.S.; Hassan, S.M.; Sadek, M.F. Prospecting for new gold-bearing alteration zones at El-Hoteib area, South Eastern Desert, Egypt, using remote sensing data analysis. Ore Geol. Rev. 2015, 71, 1–13. [Google Scholar] [CrossRef]
  20. Mwaniki, M.W.; Moeller, M.S.; Schellmann, G.; Hue, I. A comparison of Landsat 8 (OLI) and Landsat 7 (ETM+) in mapping geology and visualising lineaments: A case study of central region Kenya. In Proceedings of the ISPRS 36th International Symposium on Remote Sensing of Environment, Berlin, Germany, 11–15 May 2015; Volume 40, pp. 897–903. [Google Scholar] [CrossRef]
  21. Mohebi, A.; Mirnejad, H.; Lentz, D.; Behzadi, M.; Dolati, A.; Kani, A.; Taghizadeh, H. Controls on porphyry Cu mineralization around Hanza Mountain, south-east of Iran: An analysis of structural evolution from remote sensing, geophysical, geochemical and geological data. Ore Geol. Rev. 2015, 69, 187–198. [Google Scholar] [CrossRef]
  22. Nikolakopoulos, K.G.; Papoulis, D. A preliminary comparison between LANDSAT-8 OLI and Sentinel-2 MSI. In Proceedings of the ESA SP-740 ‘Living Planet Symposium 2016’, Prague, Czech Republic, 9–13 May 2016. [Google Scholar]
  23. Zhang, T.; Yi, G.; Li, H.; Wang, Z.; Tang, J.; Zhong, K. Integrating Data of ASTER and Landsat-8 OLI (AO) for Hydrothermal Alteration Mineral Mapping in Duolong Porphyry Cu-Au Deposit. Remote Sens. 2016, 8, 890. [Google Scholar] [CrossRef]
  24. Ye, B.; Tian, S.; Ge, J.; Sun, Y. Assessment of WorldView-3 Data for Lithological Mapping. Remote Sens. 2017, 9, 1132. [Google Scholar] [CrossRef]
  25. Blake, M.C.; Bonneau, M.; Geyssant, J.; Kienast, J.R.; Lepvrier, C.; Maluski, H.; Papanikolaou, D. A geological reconnaissance of the Cycladic blueschist belt. Geol. Soc. Am. Bull. 1981, 92, 247–254. [Google Scholar] [CrossRef]
  26. Anastopoulos, J. Geological study of the Antiparos island group. Geol. Geophys. Res. 1963, 7, 231–375. [Google Scholar]
  27. Pe, G.G.; Piper, D.J.W. Volcanism at subduction zones; The Aegean area. Bull. Geol. Soc. Greece 1972, 9, 133–144. [Google Scholar]
  28. Papanikolaou, D.J. On the structural geology and tectonics of Paros Island (Aegean Sea). Ann. Geol. Pays Hell. 1977, 28, 450–464. [Google Scholar]
  29. Cann, J.; Dixon, J.; Renfrew, C. The sources of Saliagos Obsidian. In Excavations at Saliagos near Antiparos; Evans, J.D., Renfrew, C., Eds.; British School of Archaeology at Athens; Thames & Hudson: London, UK, 1968. [Google Scholar]
  30. Innoncenti, F.; Kolios, N.; Manetti, P.; Villari, L. Acid and basic Late Neogene volcanism in Central Aegean Sea: Its nature and geotectonic significance. Bull. Volcanol. 1982, 45, 87–97. [Google Scholar] [CrossRef]
  31. Clapsopoulos, I. Origin of the Antiparos island rhyolites, Greece, by subduction-related anataxis of a granulitic source possibly located in the middle to lower continental crust. Bull. Geol. Soc. Greece 1998, 8, 355–366. [Google Scholar]
  32. Hannappel, A.; Reischemann, T. Rhyolitic dykes of Paros Island, Cyclades. In The Southern Aegean Active Volcanic Arc; Fytikas, M., Vougioukalakis, G.E., Eds.; Elsevier: San Diego, CA, USA, 2005; pp. 305–327. [Google Scholar]
  33. Carter, T.; Contreras, D.A. The character and use of the Soros Hill Obsidian source, Antiparos (Grecce). Comtes Rendus Palevol 2012, 11, 595–602. [Google Scholar] [CrossRef]
  34. Mavridis, F. Salvage excavation in the Cave of Antiparos, Cyclades: Prehistoric pottery and miscellaneous finds. A preliminary report. Aegean Archaeol. 2011, 9, 7–34. [Google Scholar]
  35. Kevrekidis, E.; Seymour, K.; Tombros, S.; Zhai, D.; Liu, J.; Zouzias, D. The Agios Georgios argentiferous galena deposit on Antiparos Island, Cyclades, Hellas and its relationship to the Paros leucogranite. J. Mineral. Geochem. 2015, 192, 239–261. [Google Scholar] [CrossRef]
  36. Nikolakopoulos, K.G. Spatial resolution enhancement of EO-1 ALI bands. In Proceedings of the SPIE Remote Sensing, Stockholm, Sweden, 11–14 September 2006. [Google Scholar]
  37. Nikolakopoulos, K.G.; Tsombos, P. Updating the 1/50.000 geological maps of IGME with Remote Sensing data, GPS measurements and GIS techniques. The case of Antiparos Island. In Proceedings of the 30th EARSeL Symposium: Remote Sensing for Science, Education and Culture, Paris, France, 31 May–4 June 2010; pp. 281–288. [Google Scholar]
  38. Ninomiya, Y.; Fu, B. Regional Lithological Mapping Using ASTER-TIR Data: Case Study for the Tibetan Plateau and the Surrounding Area. Geosciences 2016, 6, 39. [Google Scholar] [CrossRef]
  39. Rajendran, S.; Nasir, S.; Kusky, T.M.; Ghulam, A.; Gabr, S.; El-Ghali, M.A.K. Detection of hydrothermal mineralized zones associated with listwaenites in Central Oman using ASTER data. Ore Geol. Rev. 2013, 53, 470–488. [Google Scholar] [CrossRef]
  40. Amer, R.; Mezayen, A.E.; Hasanein, M. ASTER spectral analysis for alteration minerals associated with gold mineralization. Ore Geol. Rev. 2016, 75, 239–251. [Google Scholar] [CrossRef]
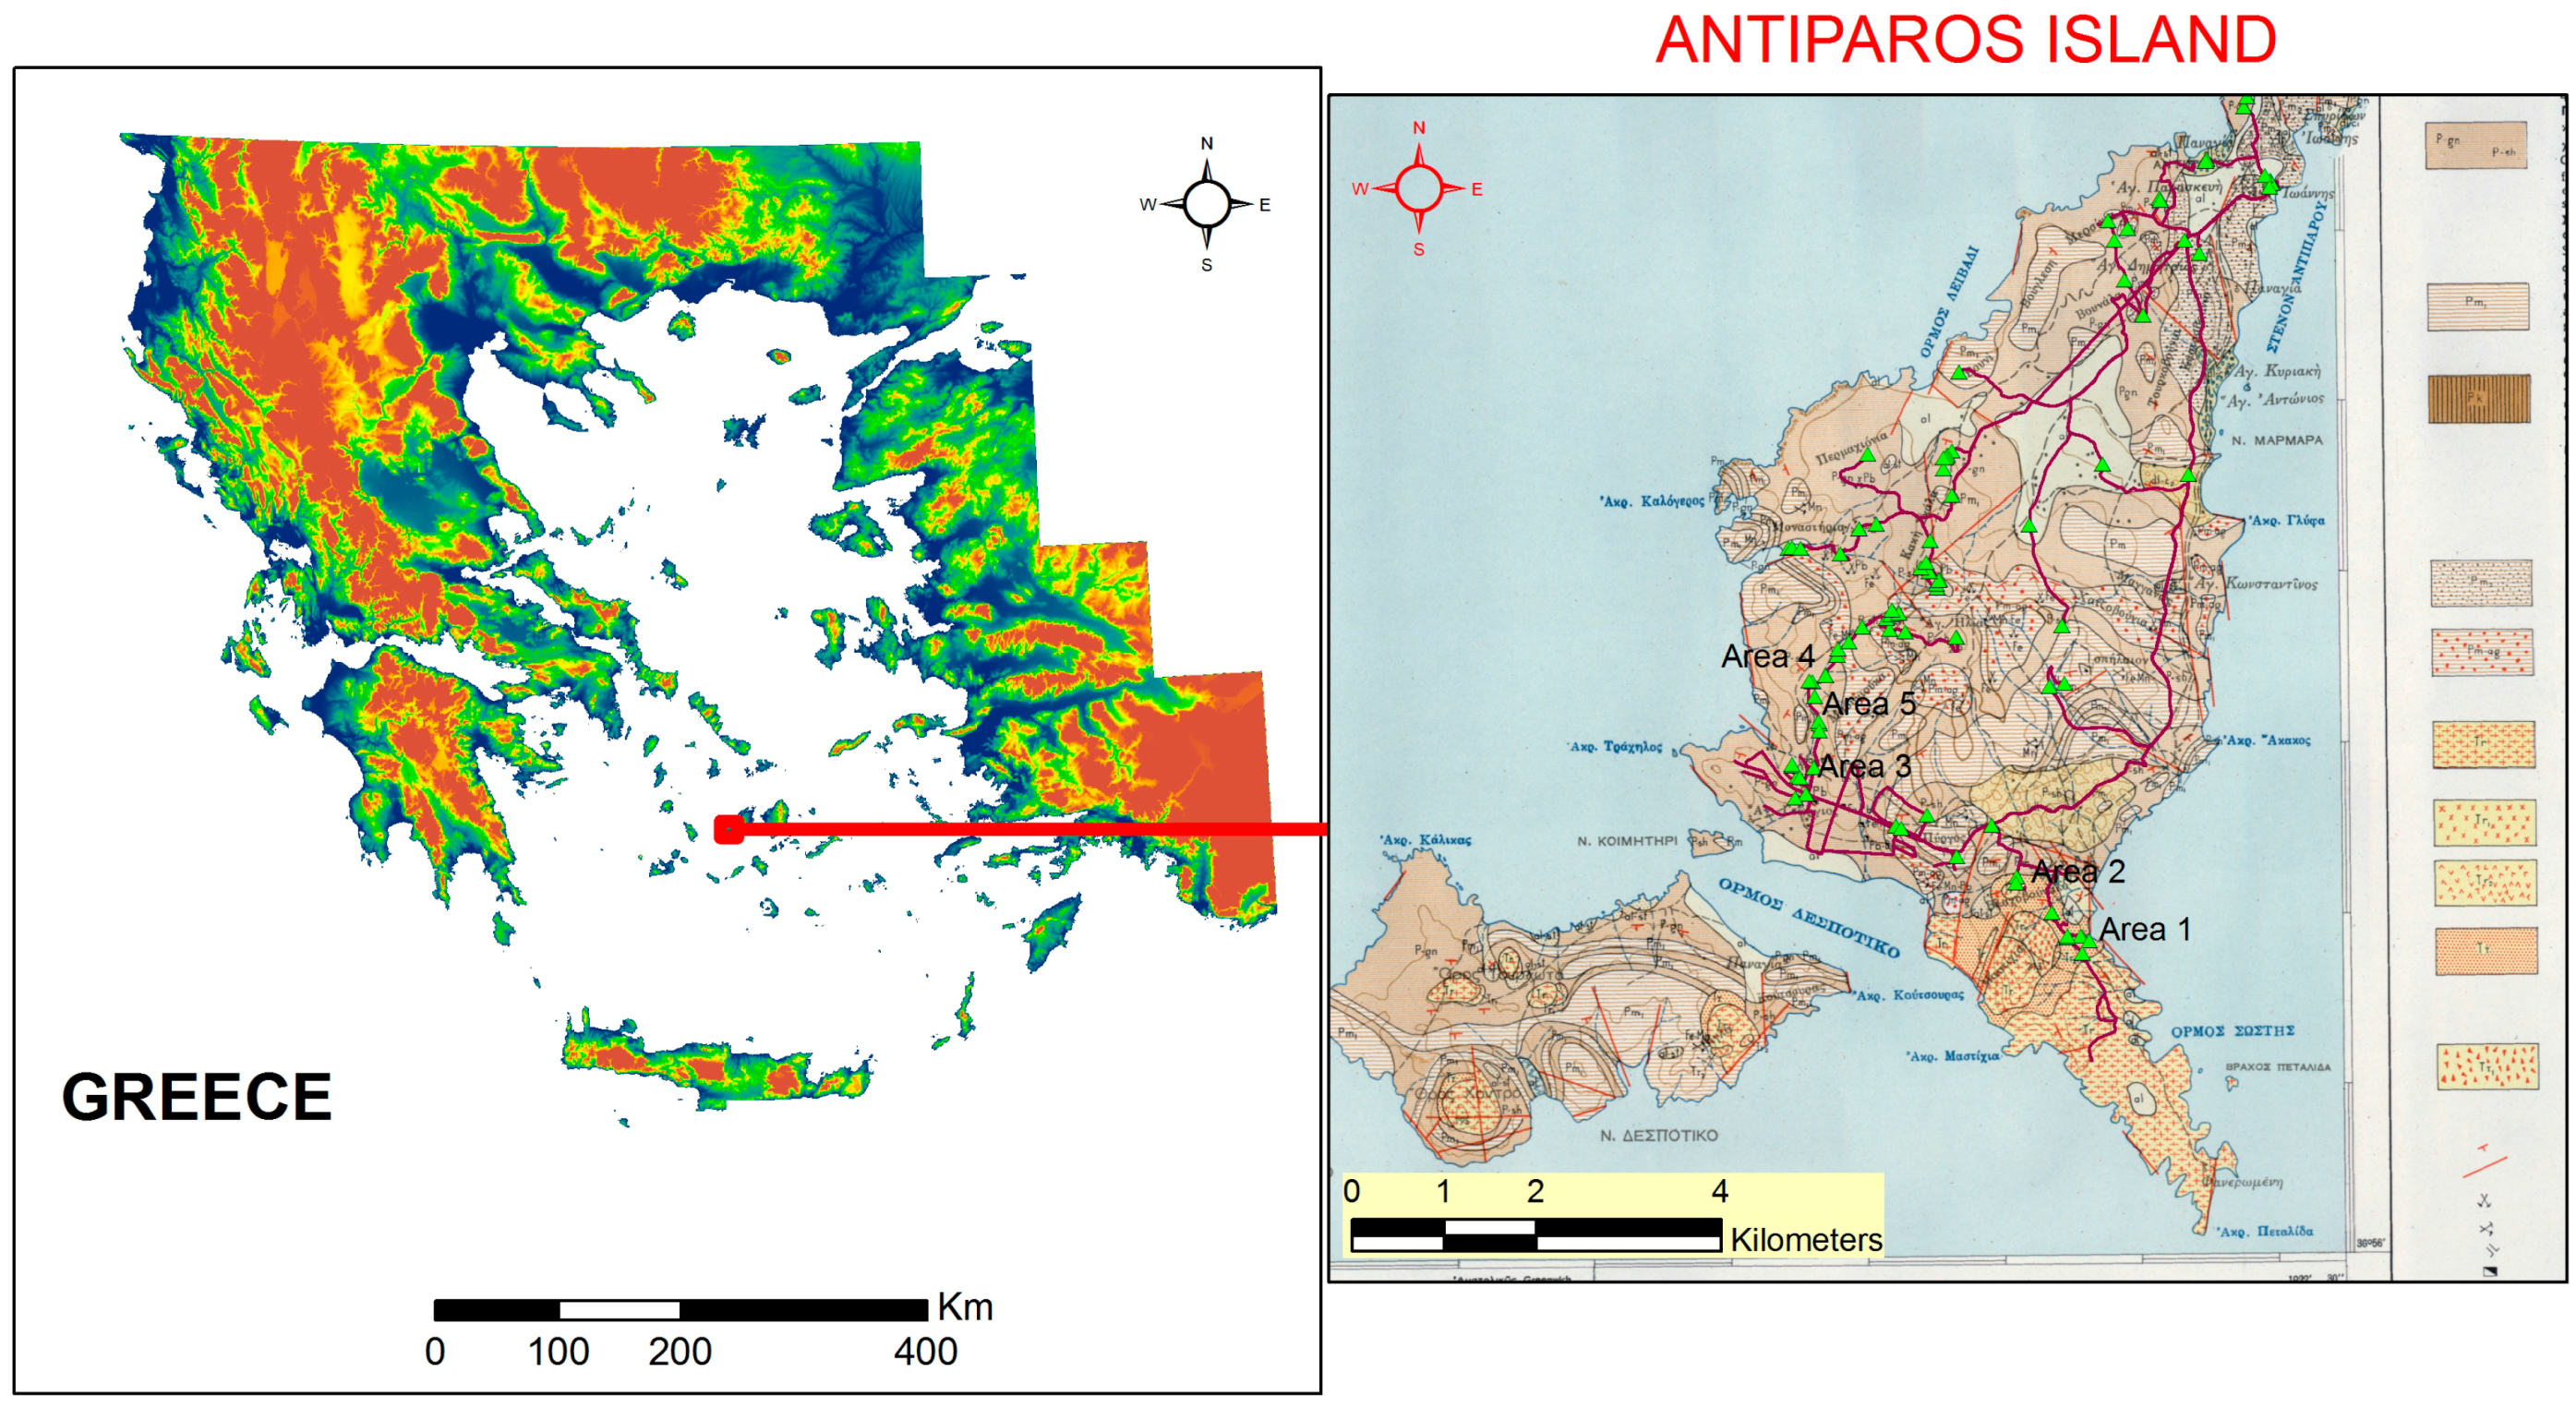
Figure 1. Location of the study area. At the right part, the previous analogue geological map of Antiparos georeferenced to Greek Geodetic Reference System (EGSA 87). The red line indicates some of the field trips and the green asterisk indicates some of the places where measurements and sampling took place.
Geosciences 08 00096 g001
Figure 2. Example of the application of the PCA, ICA and Tasseled Cap techniques on remote sensing data is presented (area 4). The hydrothermal alterations are presented with green color in the ALOS VNIR ICA image (a) and with cyan color in the ALOS VNIR Tasseld Cap image (b). The same area is presented in a 432 RGB combination of the Quickbird image (c) and with red color in the ALOS VNIR PCA image (d).
Geosciences 08 00096 g002
Figure 3. Field photo from the hydrothermal alteration zone presented in Figure 2 (area 4).
Geosciences 08 00096 g003
Figure 4. Detection of talus cones in area 5. They can be detected with blue color in the ALOS VNIR ICA image (a) and with green color in ALOS VNIR Tasseld Cap image (b) The same area is presented in a 432 RGB combination of the Quickbird image in (c) and with brown color in the ALOS VNIR PCA image (d).
Geosciences 08 00096 g004
Figure 5. The talus cones of area 5 as mapped in the field.
Geosciences 08 00096 g005
Figure 6. (a) Photomicrograph of rhyolitic tuff shows sferolites of quartz (sample of area 1, XPL); (b) Photomicrograph of rhyolite shows a porphyroclast of feldspar (Fsp) in a microcrystalic groundmass (sample of area 2, XPL); (c) SEM image of smectite flakes in a rhyolitic tuff (sample of area 1); (d) Photomicrograph of rhyolitic tuff shows a fragment of mica schist and quartz (Qtz) in the groundmass (sample of area 1, XPL); (e) SEM image of halite, presented as not well formed (sample of area 1); (f) SEM image of illite flakes on halite crystals (sample of area 1).
Geosciences 08 00096 g006
Figure 7. (a) XRD patterns of Samples of areas 1, 2 (Smect: smectite, Mic: Muscovite and illite, Trid: Tridymite, Crist; Cristobalite, Qtz: quartz, Fsp: feldspars, Cc: calcite); (b) XRD patterns of sample from area 1 air dried, glycolated and heated showing the presence of Smectite.
Geosciences 08 00096 g007
Figure 8. (a) Photomicrograph of mica schist shows granoblastic of quartz (Qtz) and lepidoblastic texture of muscovite (Mus) (sample of area 3, XPL); (b) Photomicrograph of fossiliferous limestone where endoclasts of quartz, muscovite and channel type of porosity locally filled with recrystallized calcite (Cc) are observed in a micritic matrix (sample of area 4, XPL); (c) Photomicrograph of fossiliferous limestone where fossils and endoclasts of quartz, muscovite and Fe oxides are observed in a micritic matrix (sample of area 4, XPL); (d) SEM image of kaolinite (or chlorite) showing the characterized pseudohexagonal shape of their crystals (sample of area 4); (e) Photomicrograph of quartz (Qtz) with intense undulate extinction in a pegmatite (sample of area 5, XPL); (f) Photomicrograph of large crystals of quartz (Qtz), feldspar (Fsp) and fine-grained muscovite (Mus) in a pegmatite (sample of area 5, XPL).
Geosciences 08 00096 g008
Figure 9. XRD pattern of sample area 3 (Mus: Musc ovite, Qtz: quartz, Fsp: feldspars, Cc: calcite).
Geosciences 08 00096 g009
Figure 10. XRD pattern of Sample of area 4 (Chl: chlorite, K, Kaolinite Qtz: quartz, Fsp: feldspars, Cc: calcite).
Geosciences 08 00096 g010
Figure 11. XRD pattern of Sample of area 5 (Mus muscovite, K: kaolinite, Qtz: quartz, Fsp: feldspars, Cc: calcite).
Geosciences 08 00096 g011
Figure 12. The updated geological map of Antiparos Island at 1/25.000 scale. Abbreviations: H- Alt Pgn-Psh: Hydrothermal altered gneiss to shcist-gneiss, H-Alt Pk: Hydrothermal altered black microcrystalline to cryptocrystalline fossifereus limestone, M-Pl: Sea’s formations, P-gn P-sh: Gneiss to shcist-gneiss, Pgm:Pegmatite, Pk: Black, Pm-ag: Ankeritizied marbles with oxides of iron and manganese, Pm1: Microcrystalline to coarse grain marbles, Pm2: Silicified marbles, Rh:Rhyolitic tuffs, Tr: Compact rhyolitic lavas, Tr1: Tuffic and brecciated rhyolitic lavas, Tr2: Perlite-Obsidian, TT: White rhyolitic bedded tuffs, al: Recent alluvial deposits, al-st: Lower Alluvium, dl-c1: Marine terrace, dl-c2: Fluvial formations, FL: Fault.
Geosciences 08 00096 g012