Assessment of Educational Methods for Improving Children’s Awareness of Tsunamis and Other Natural Disasters: Focusing on Changes in Awareness and Regional Characteristics in Japan


Abstract
:1. Introduction
1.1. Background
1.2. Previous Studies of Natural Disaster Education
1.3. Previous Studies of Threat Education
1.4. Previous Studies of Disaster-Prevention Education Using Active Learning Tools
1.5. Objective
2. Materials and Methods
2.1. Participants
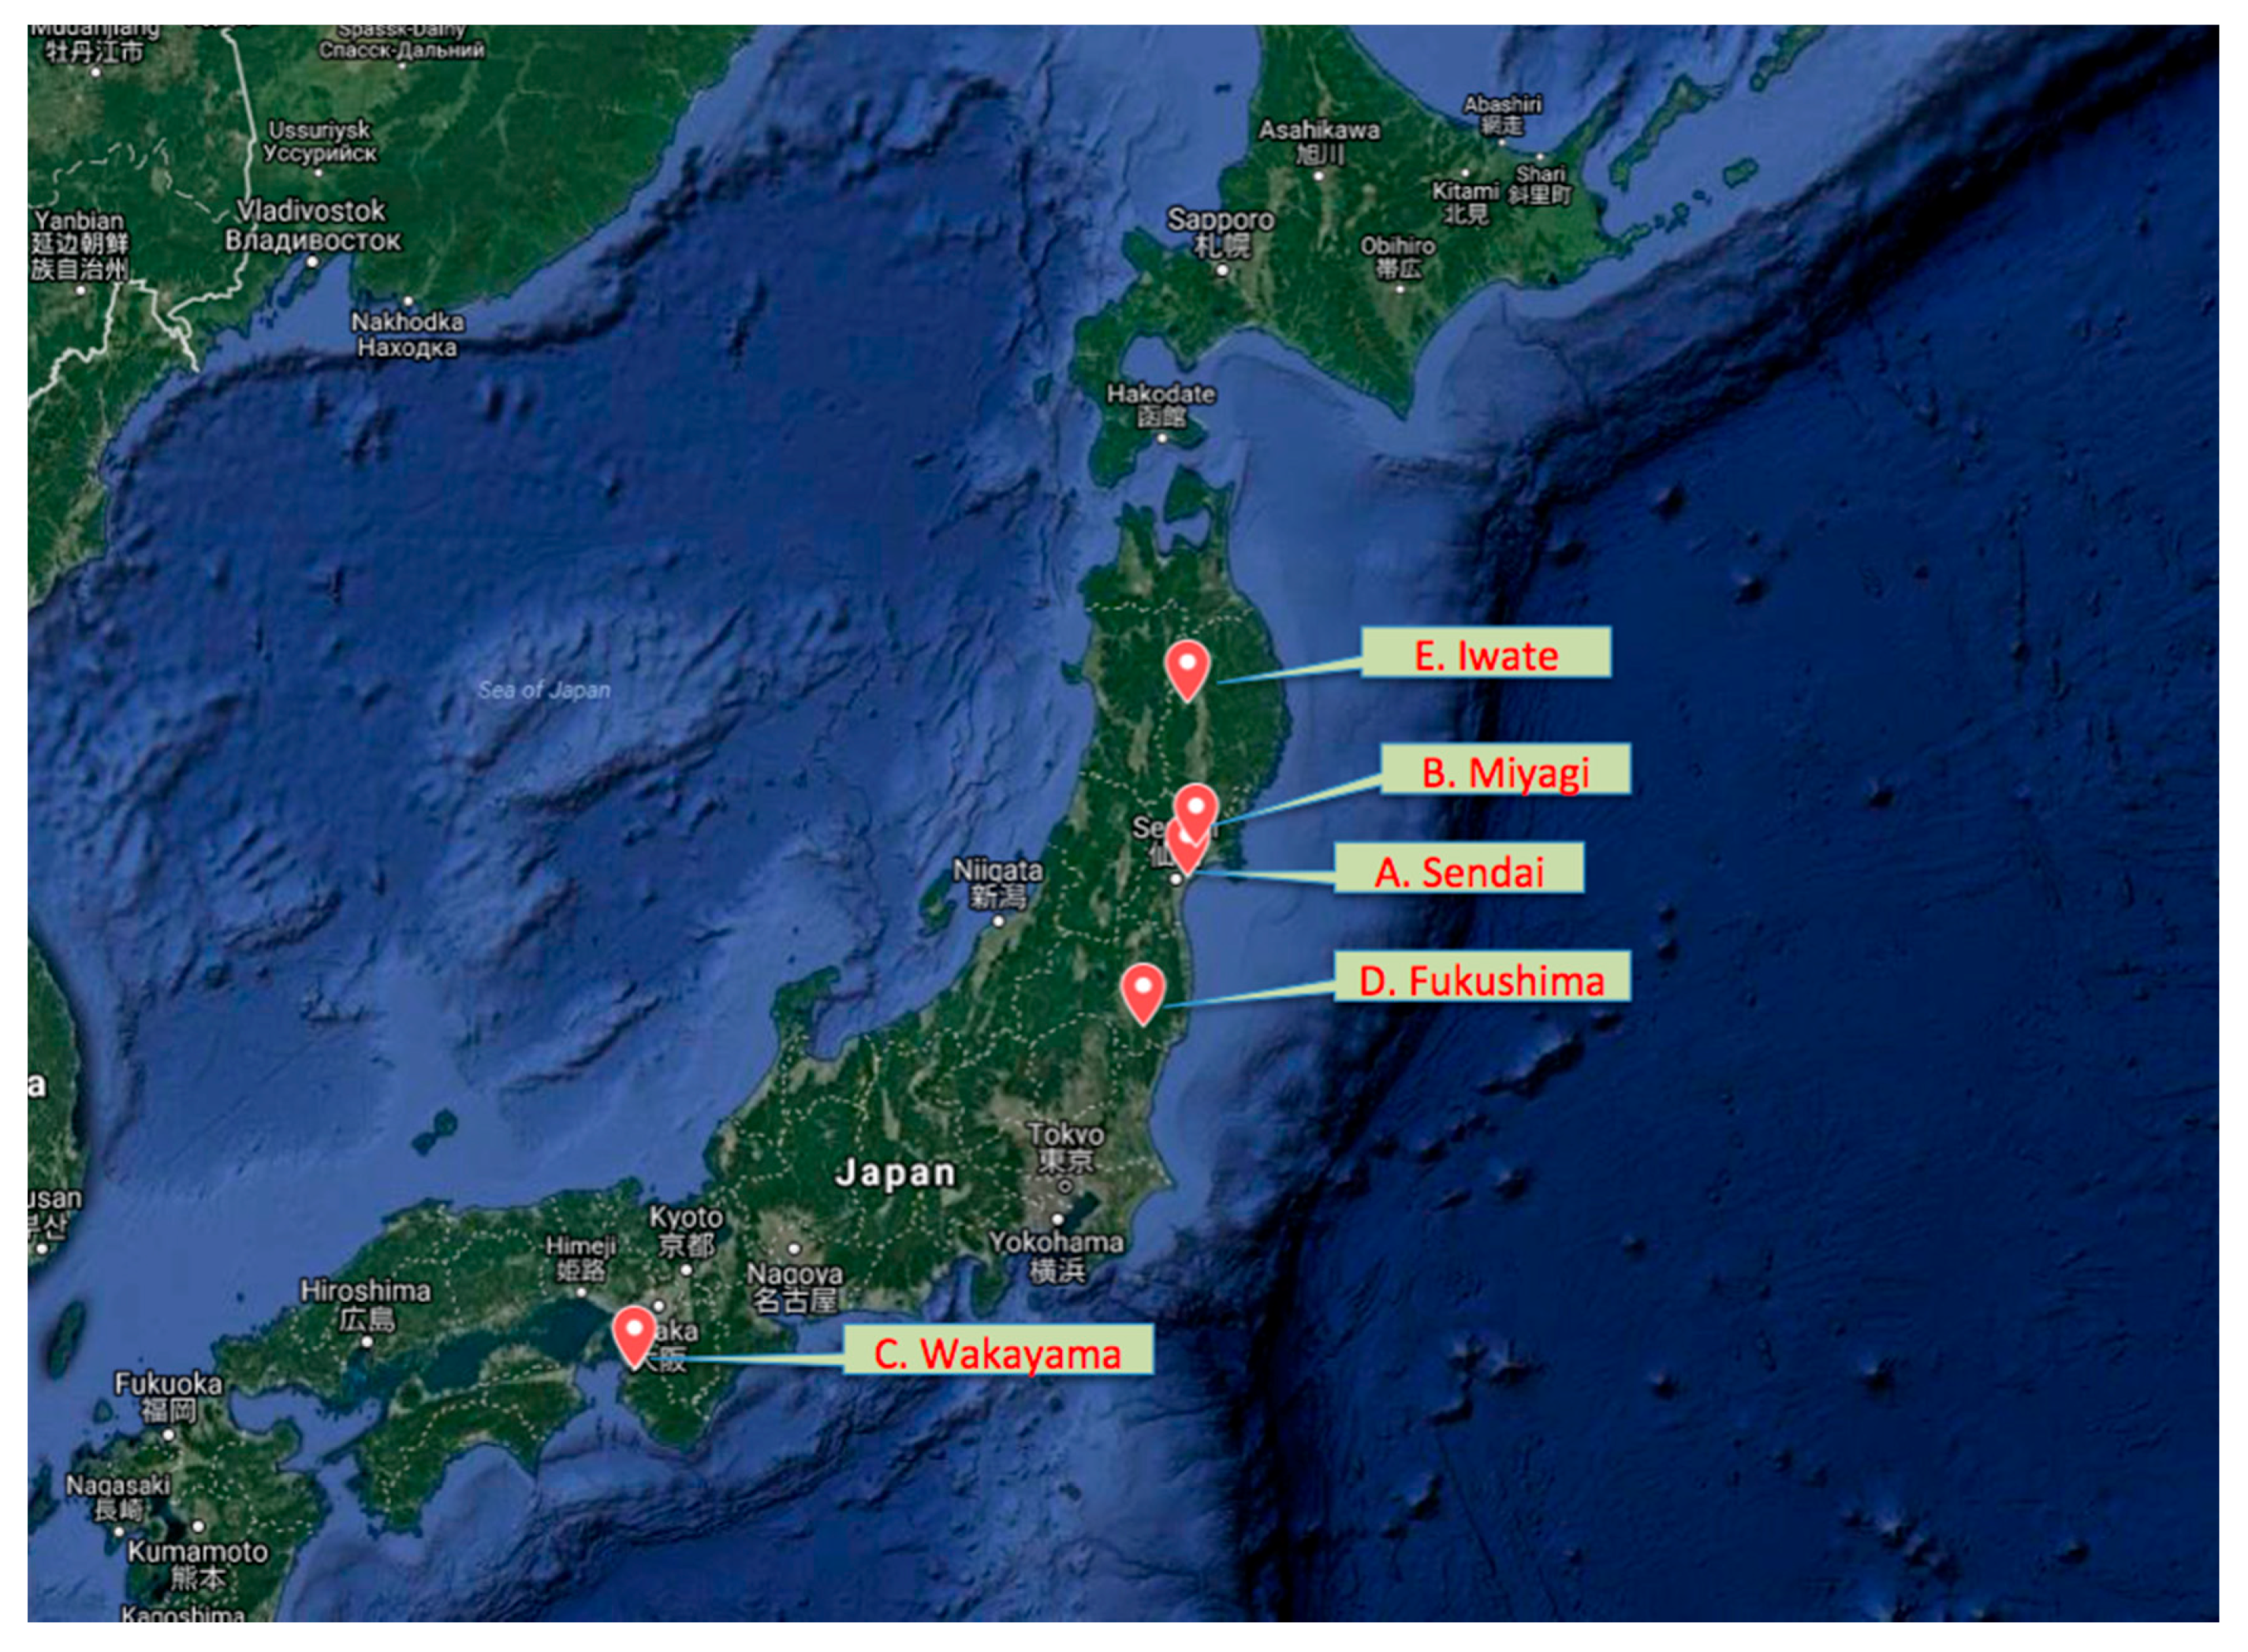
2.2. Schools’ Regional Characteristics
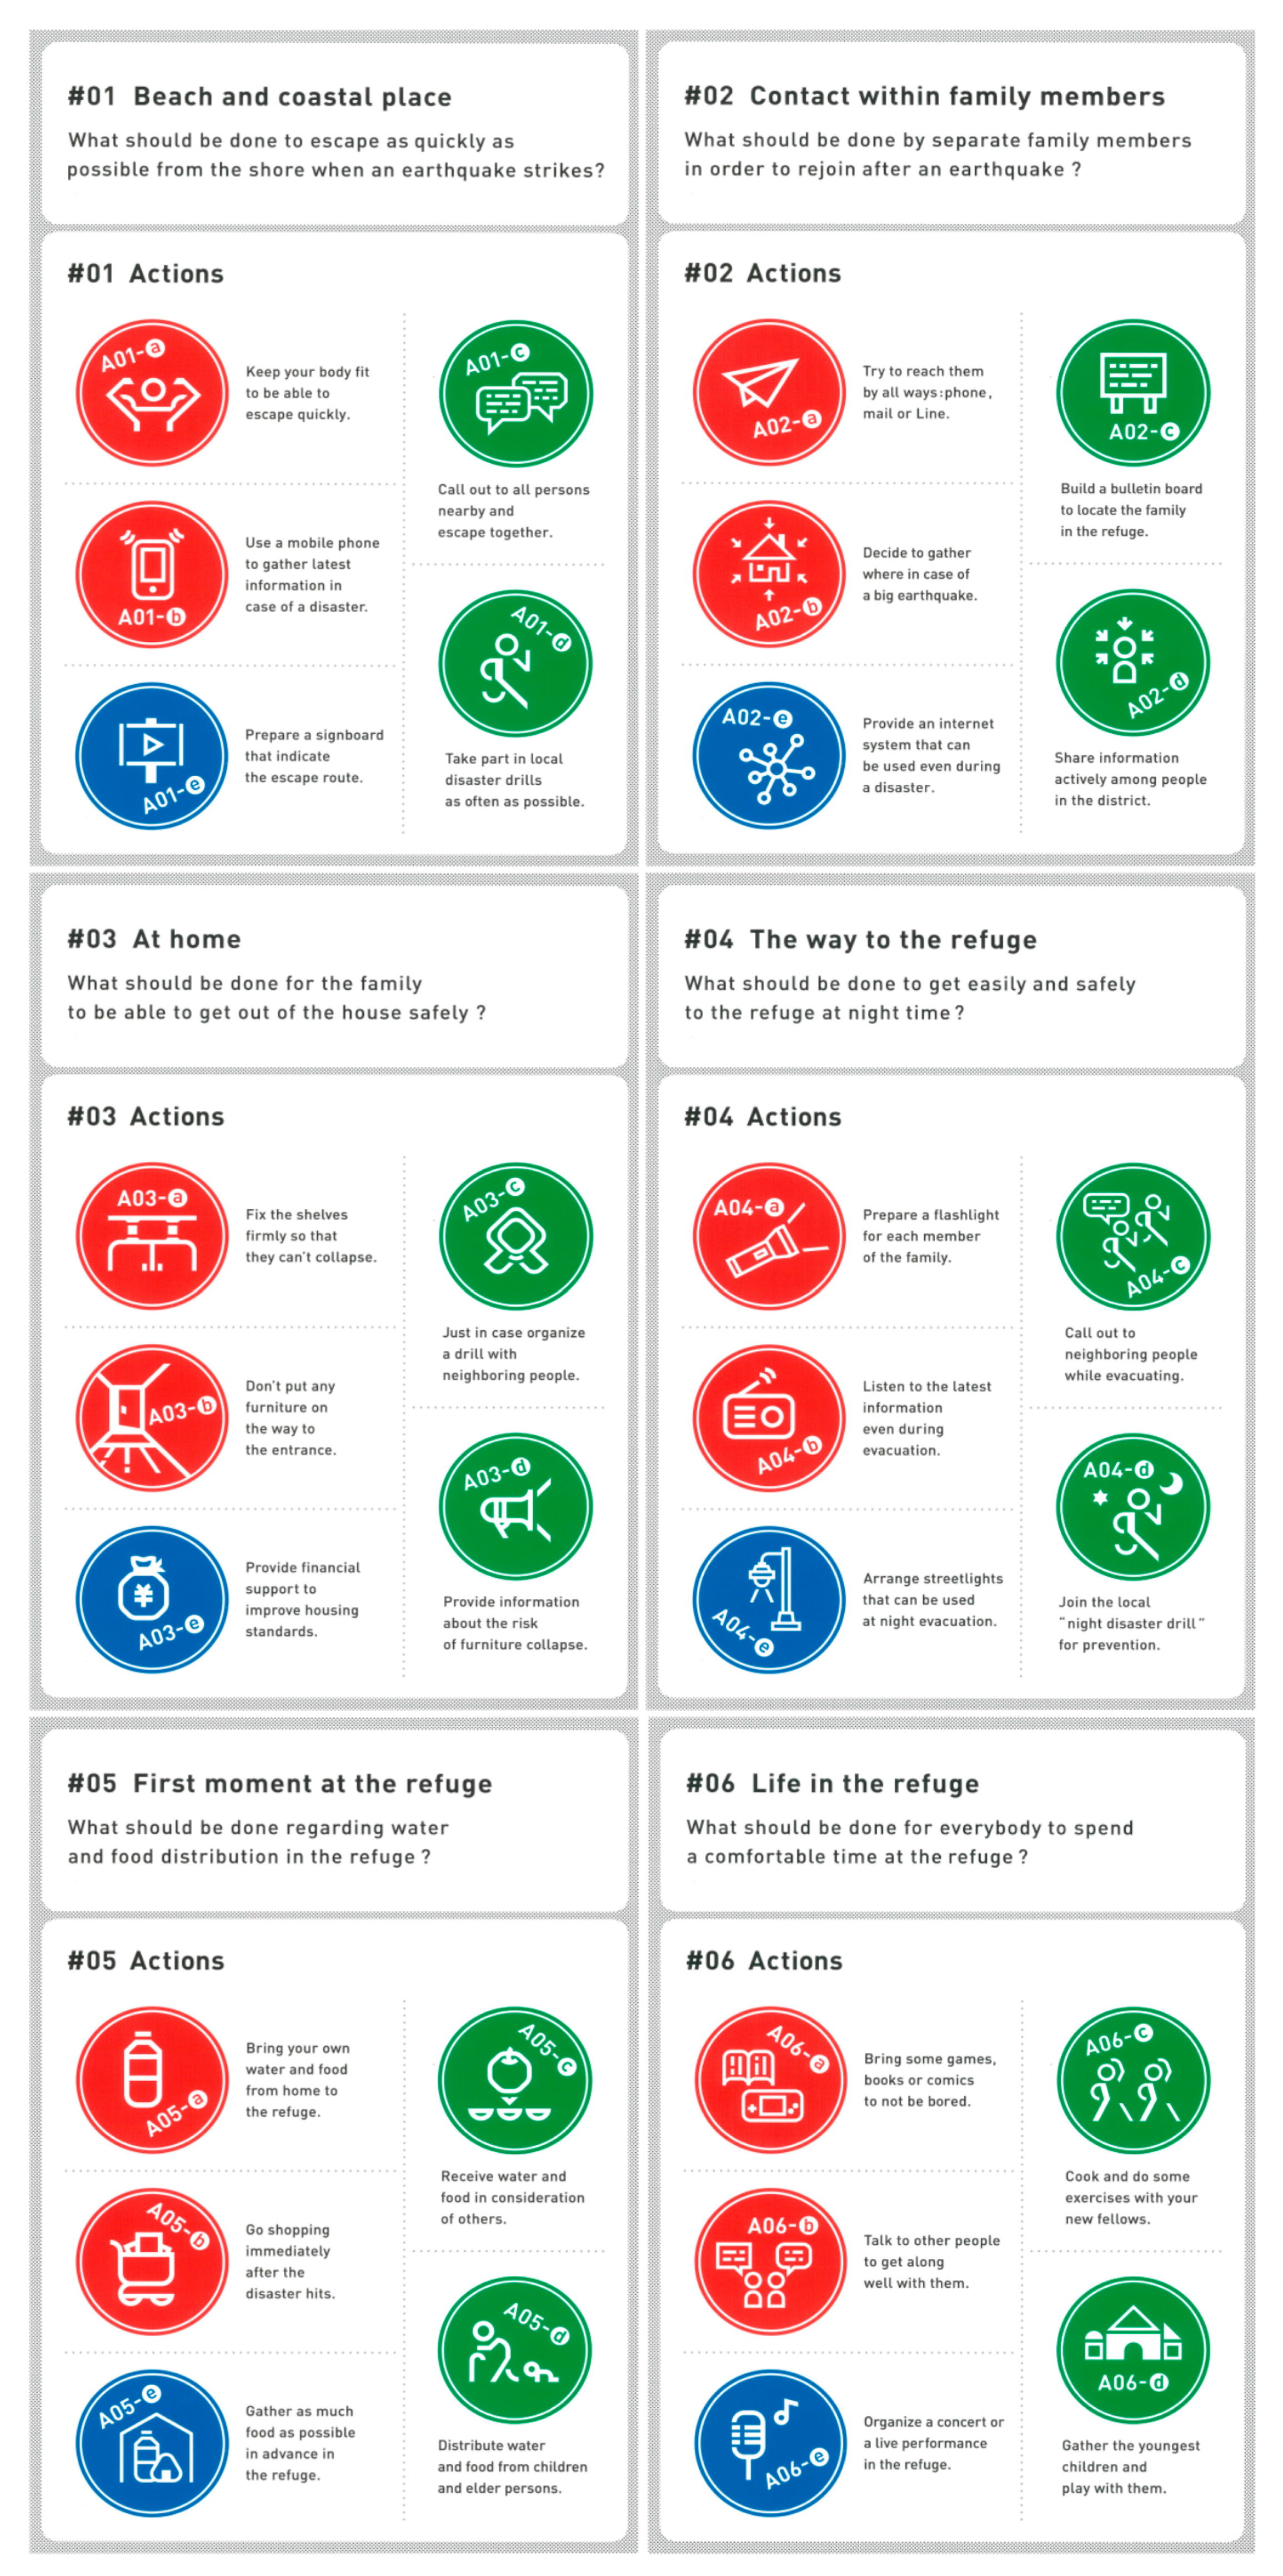
2.3. Class Content
2.3.1. Part 1
2.3.2. Part 2
2.3.3. Part 3
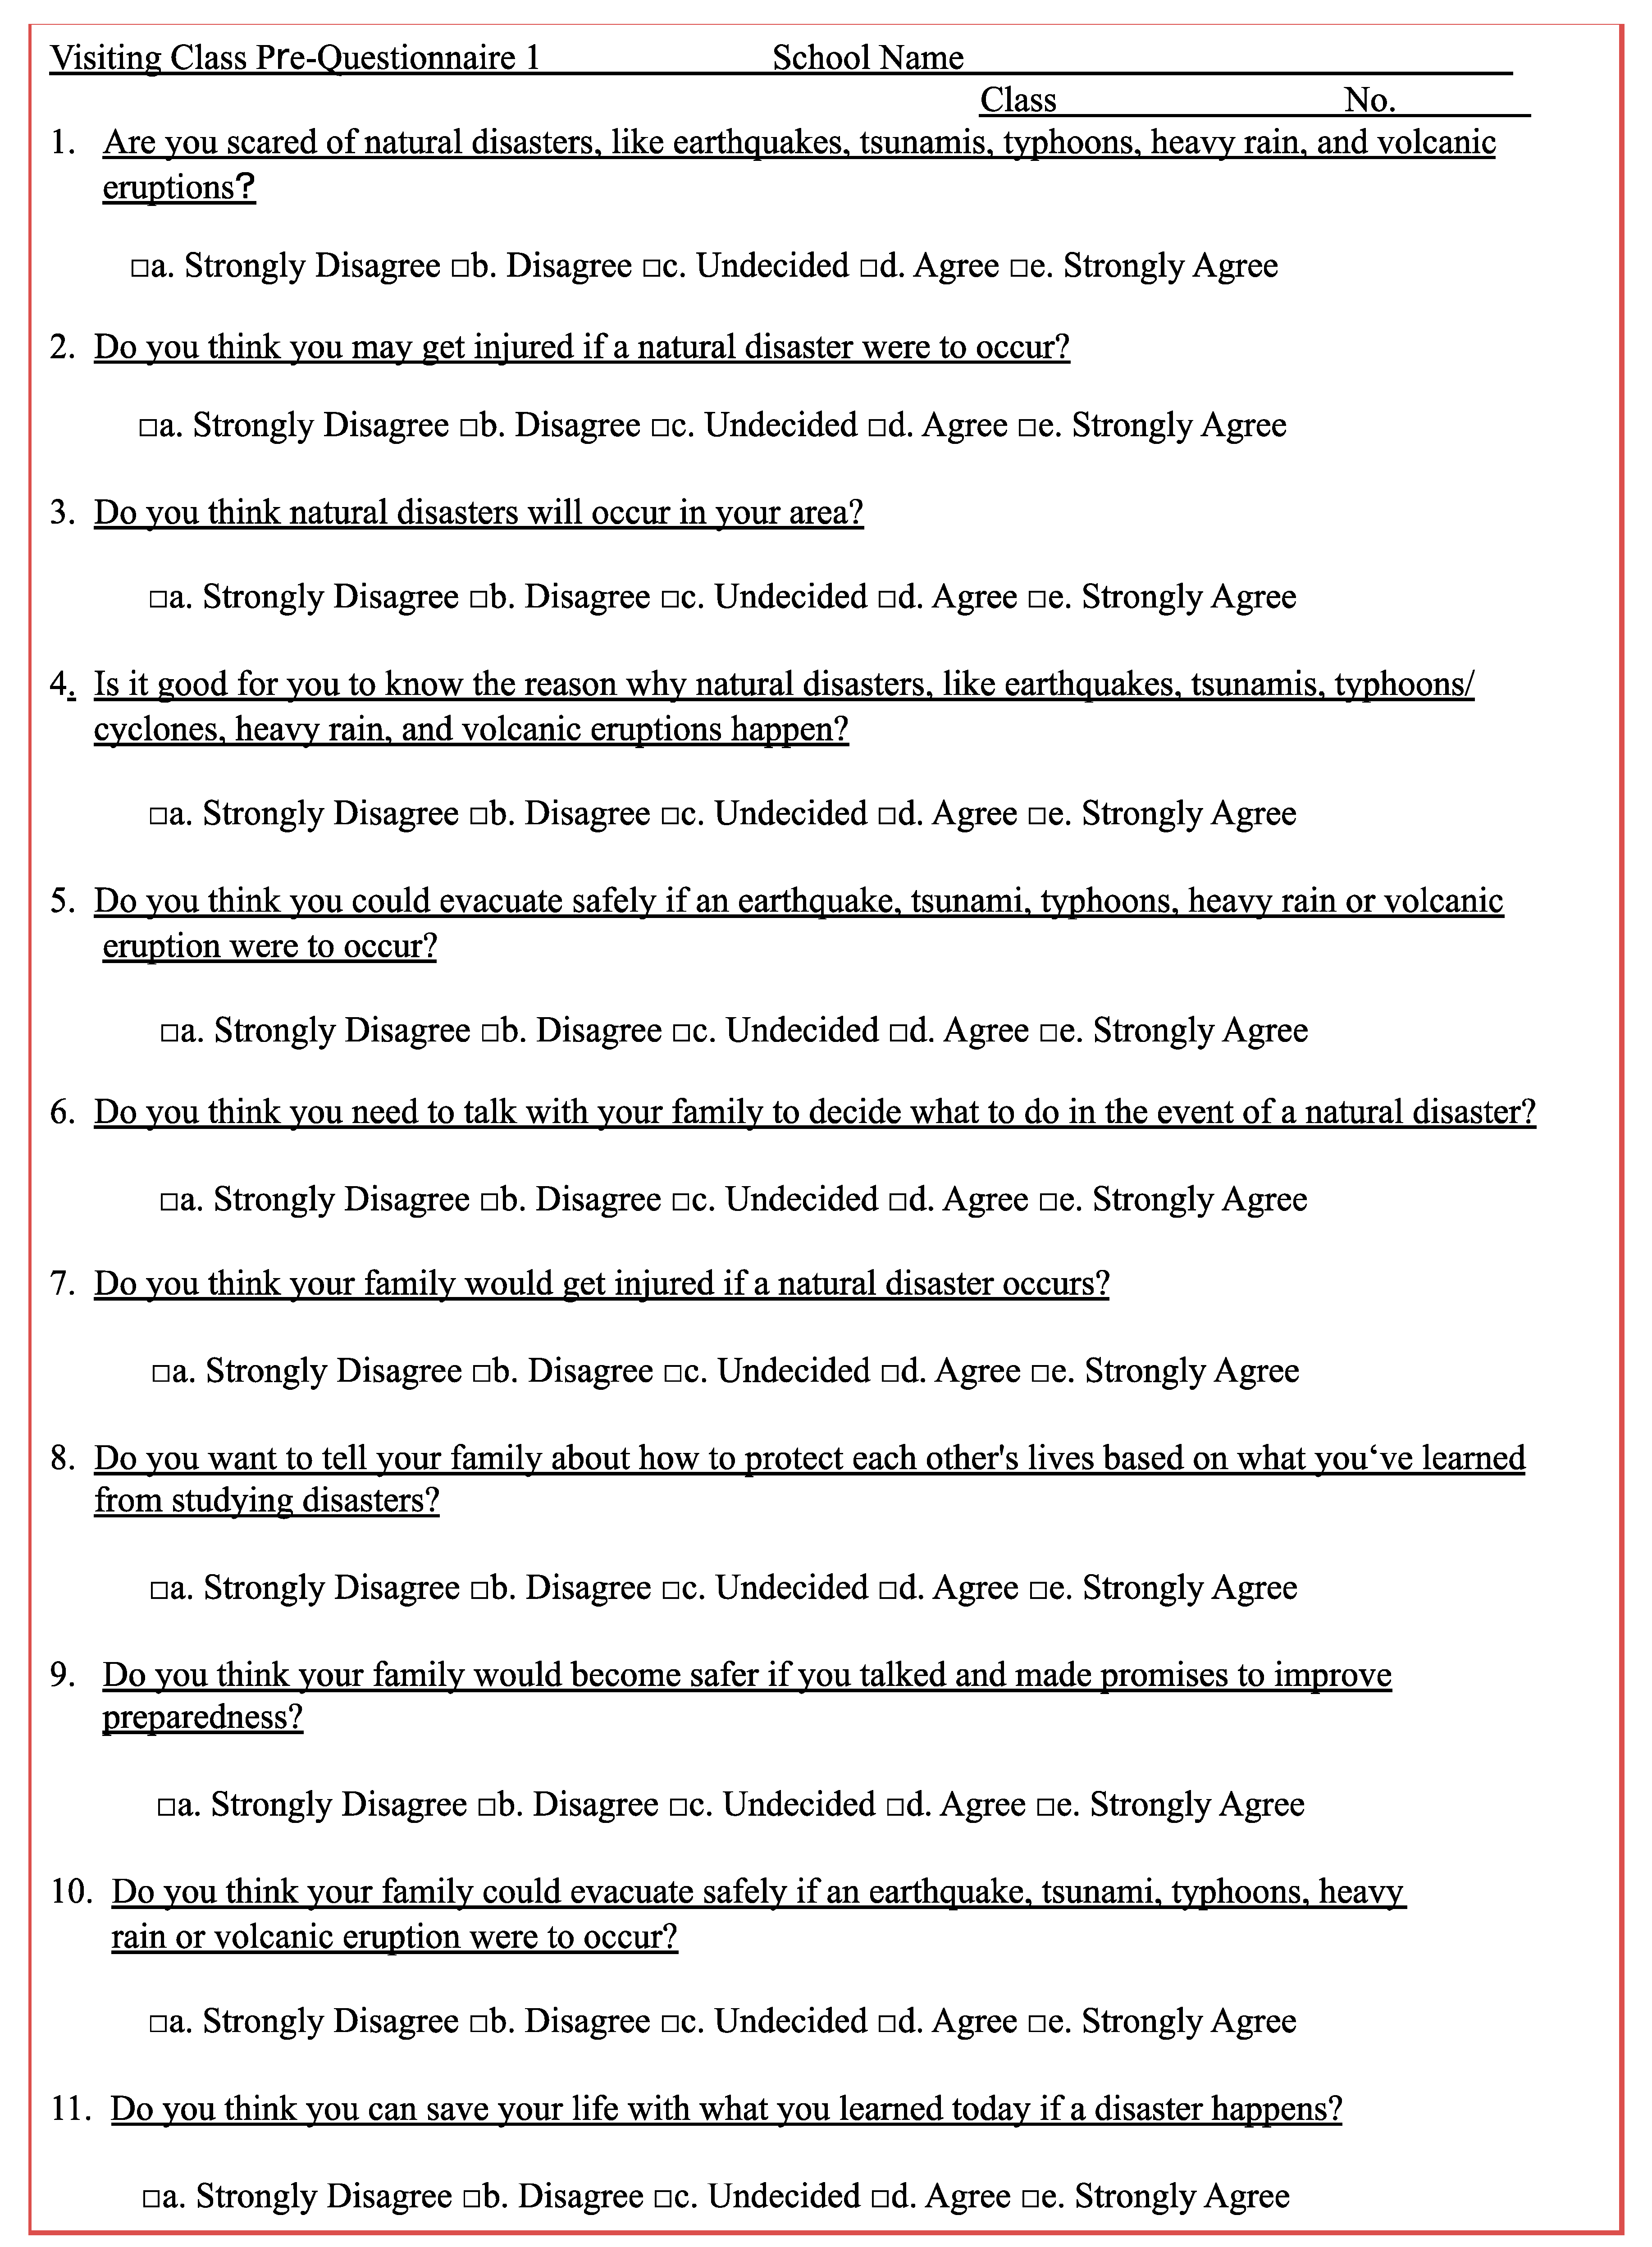
2.4. Questionnaire Survey Forms
2.5. Procedure
3. Results
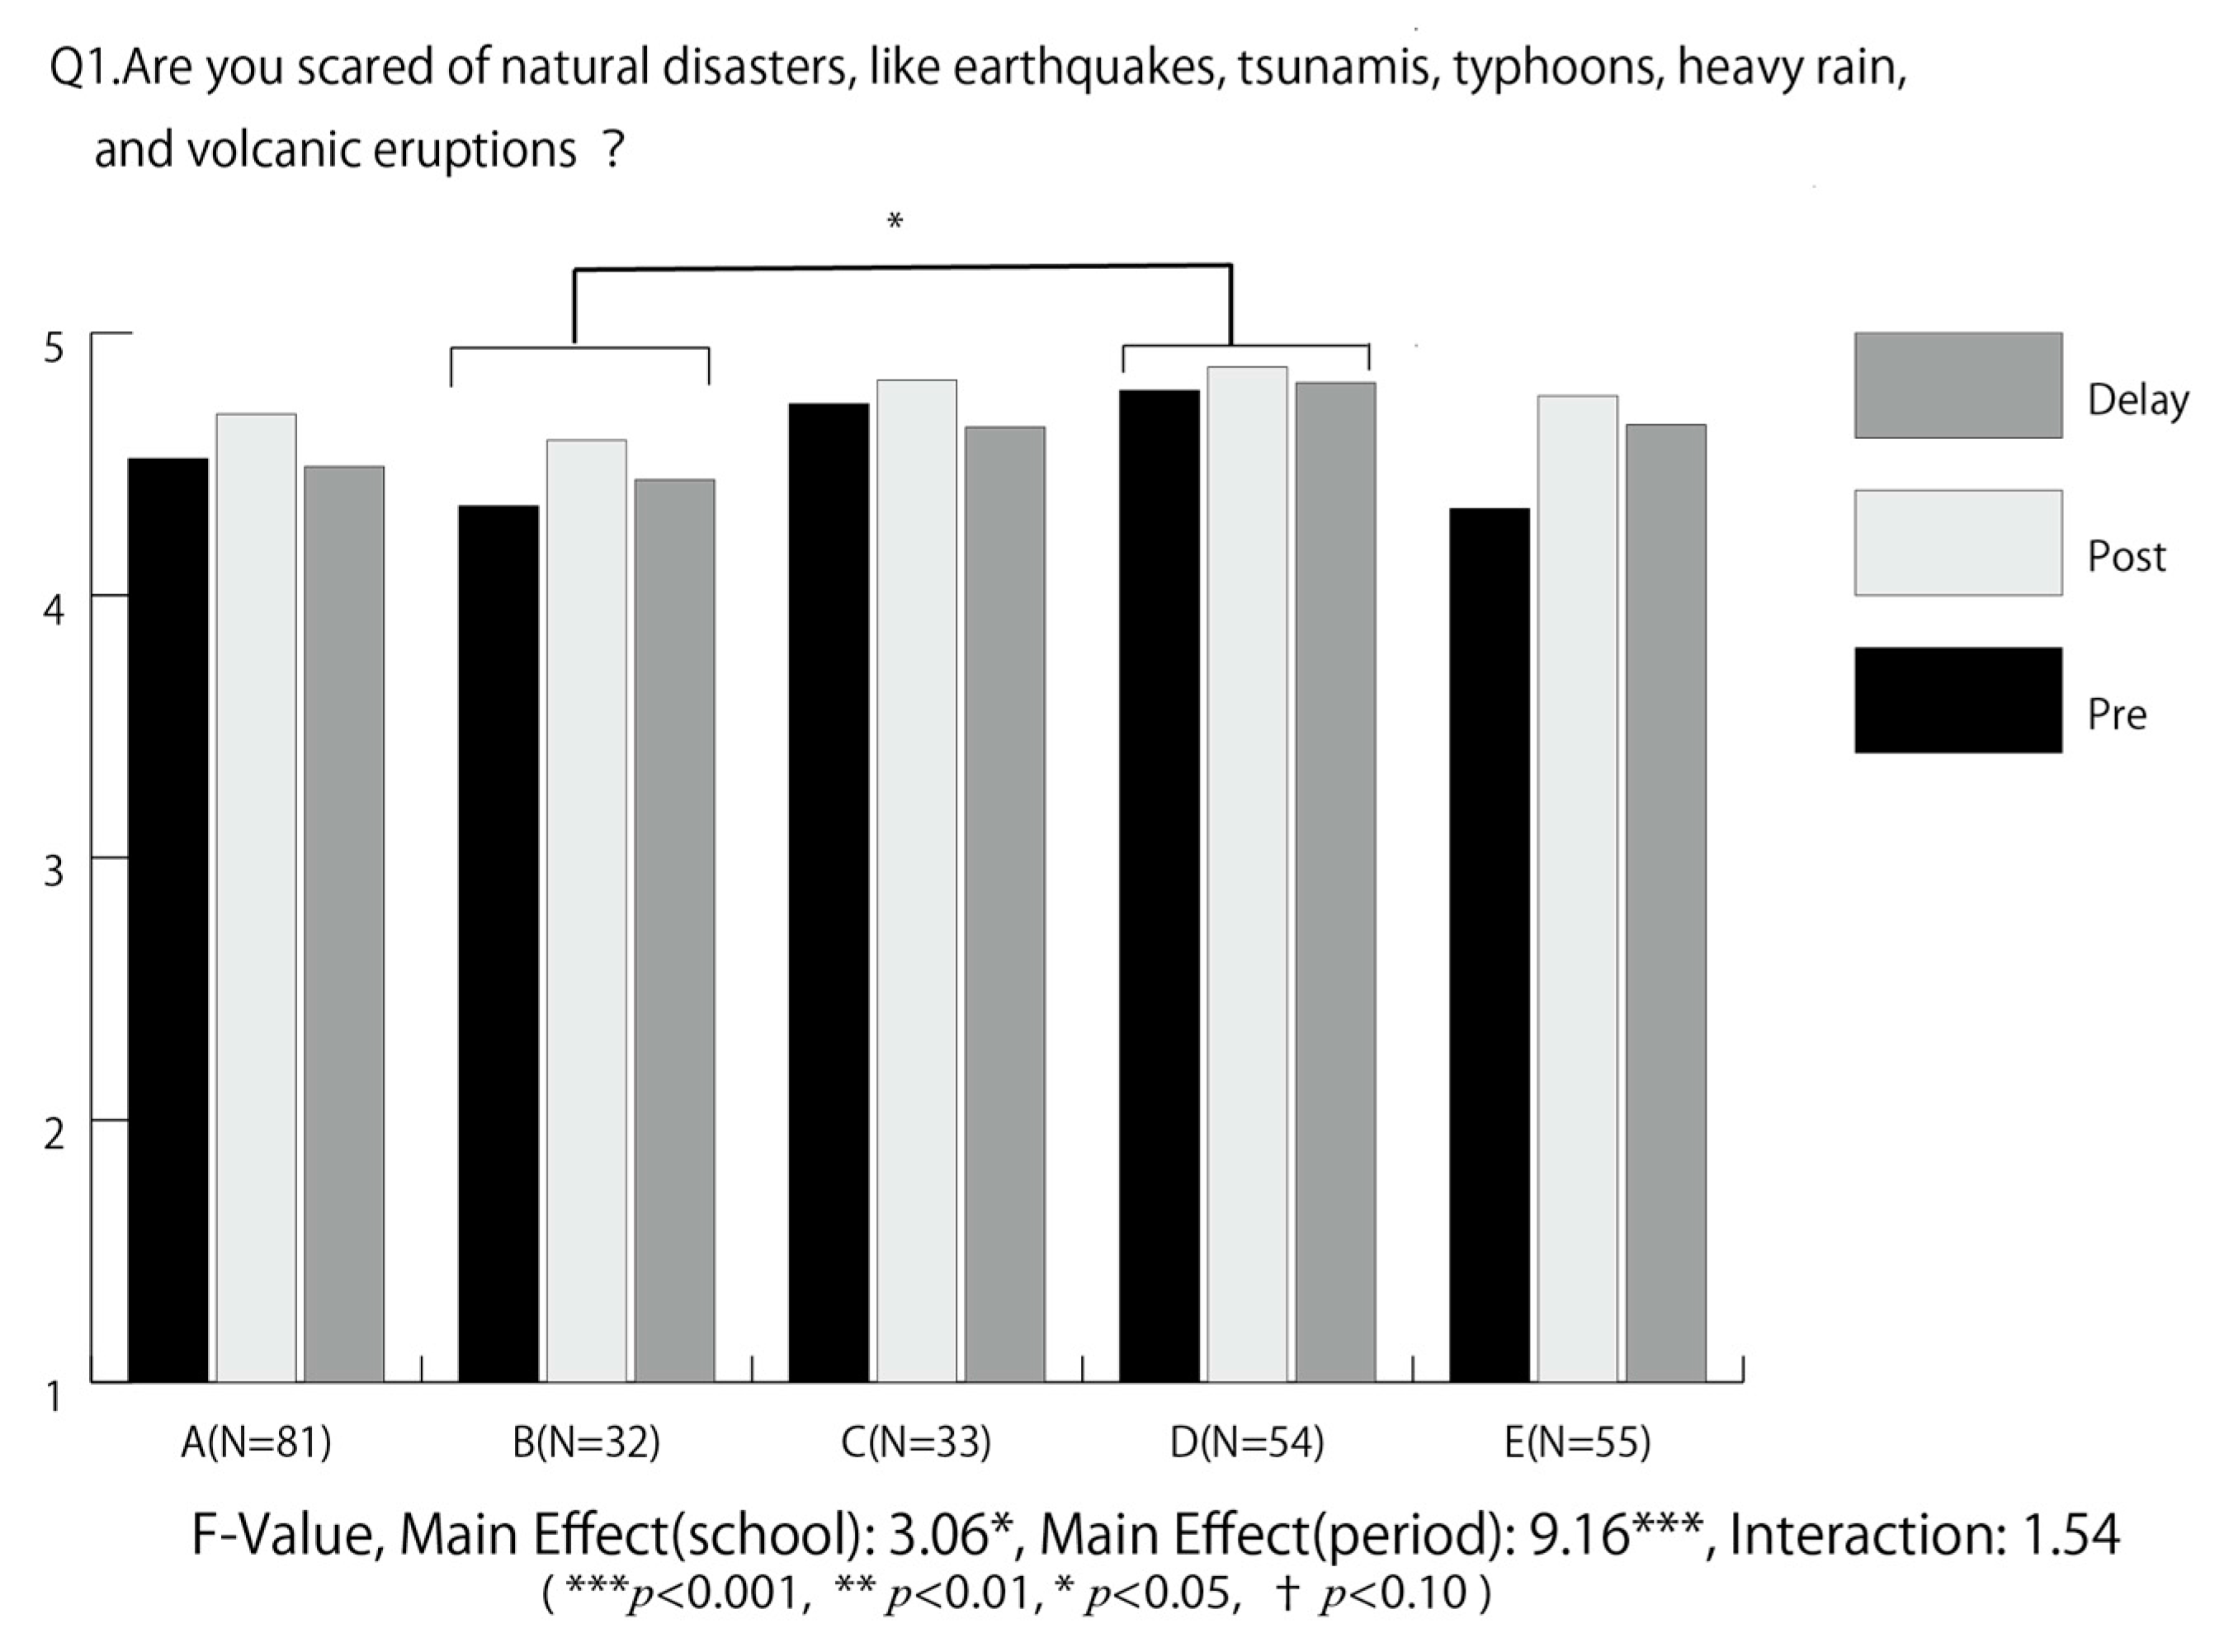
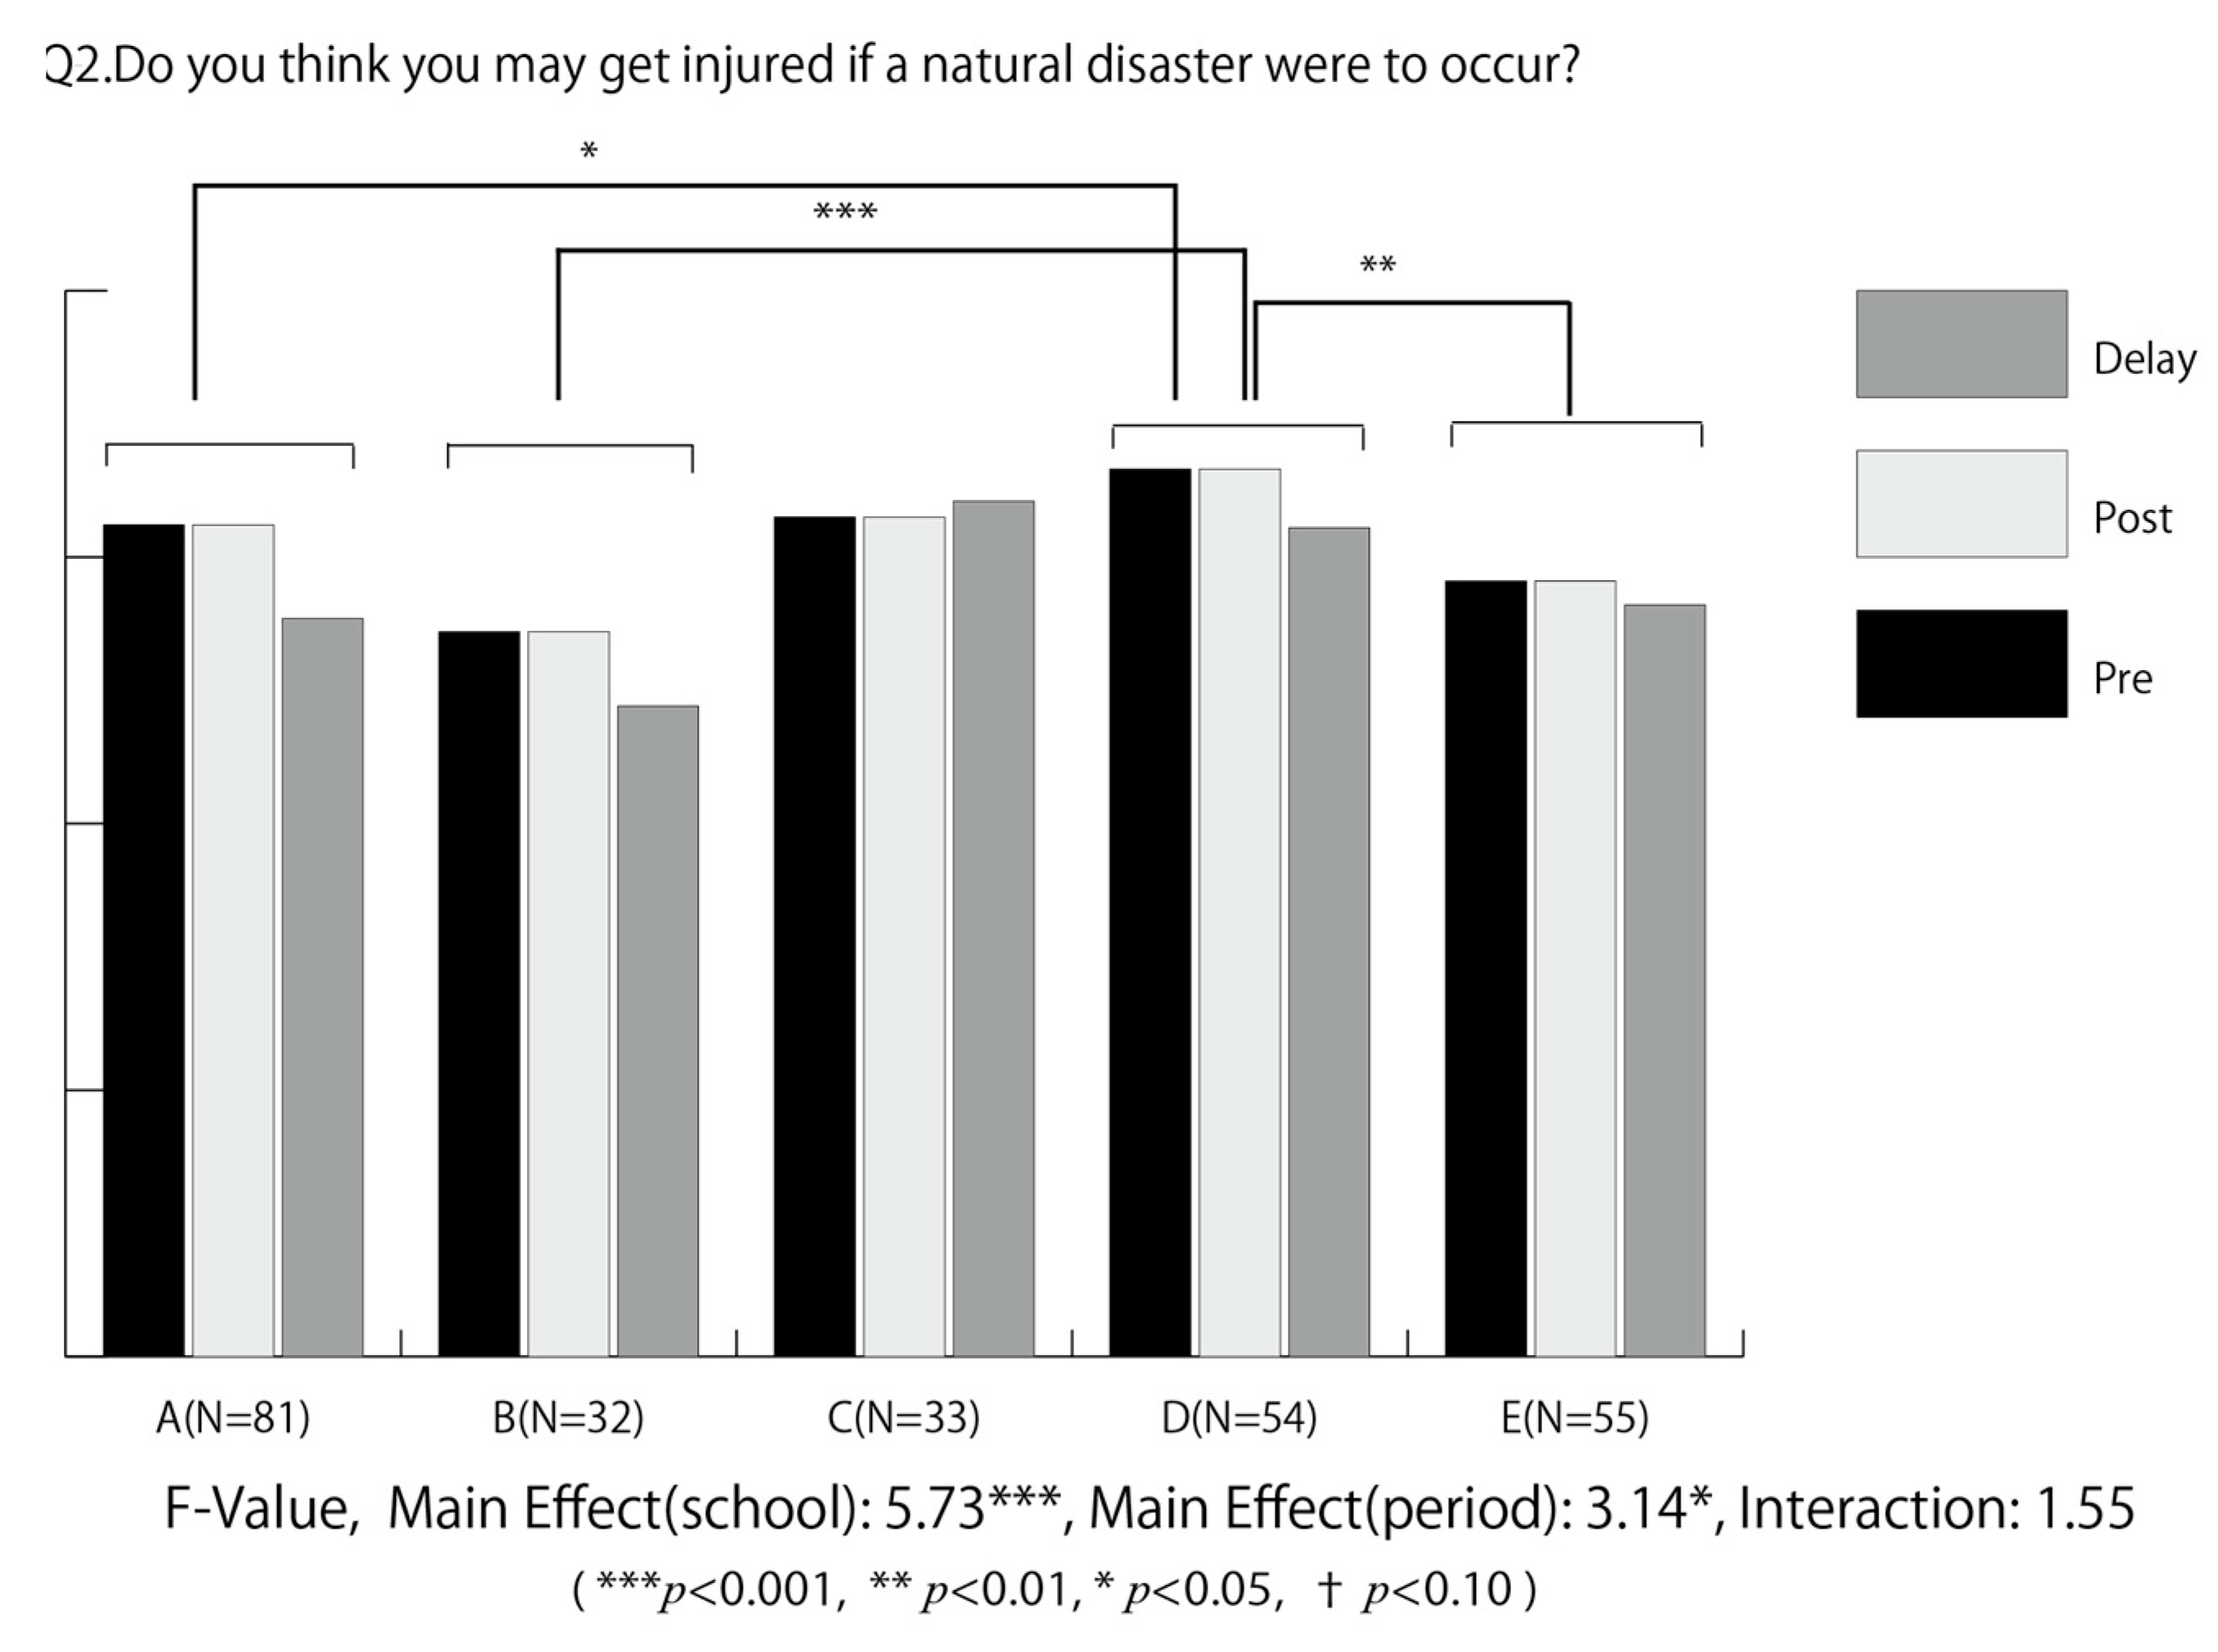
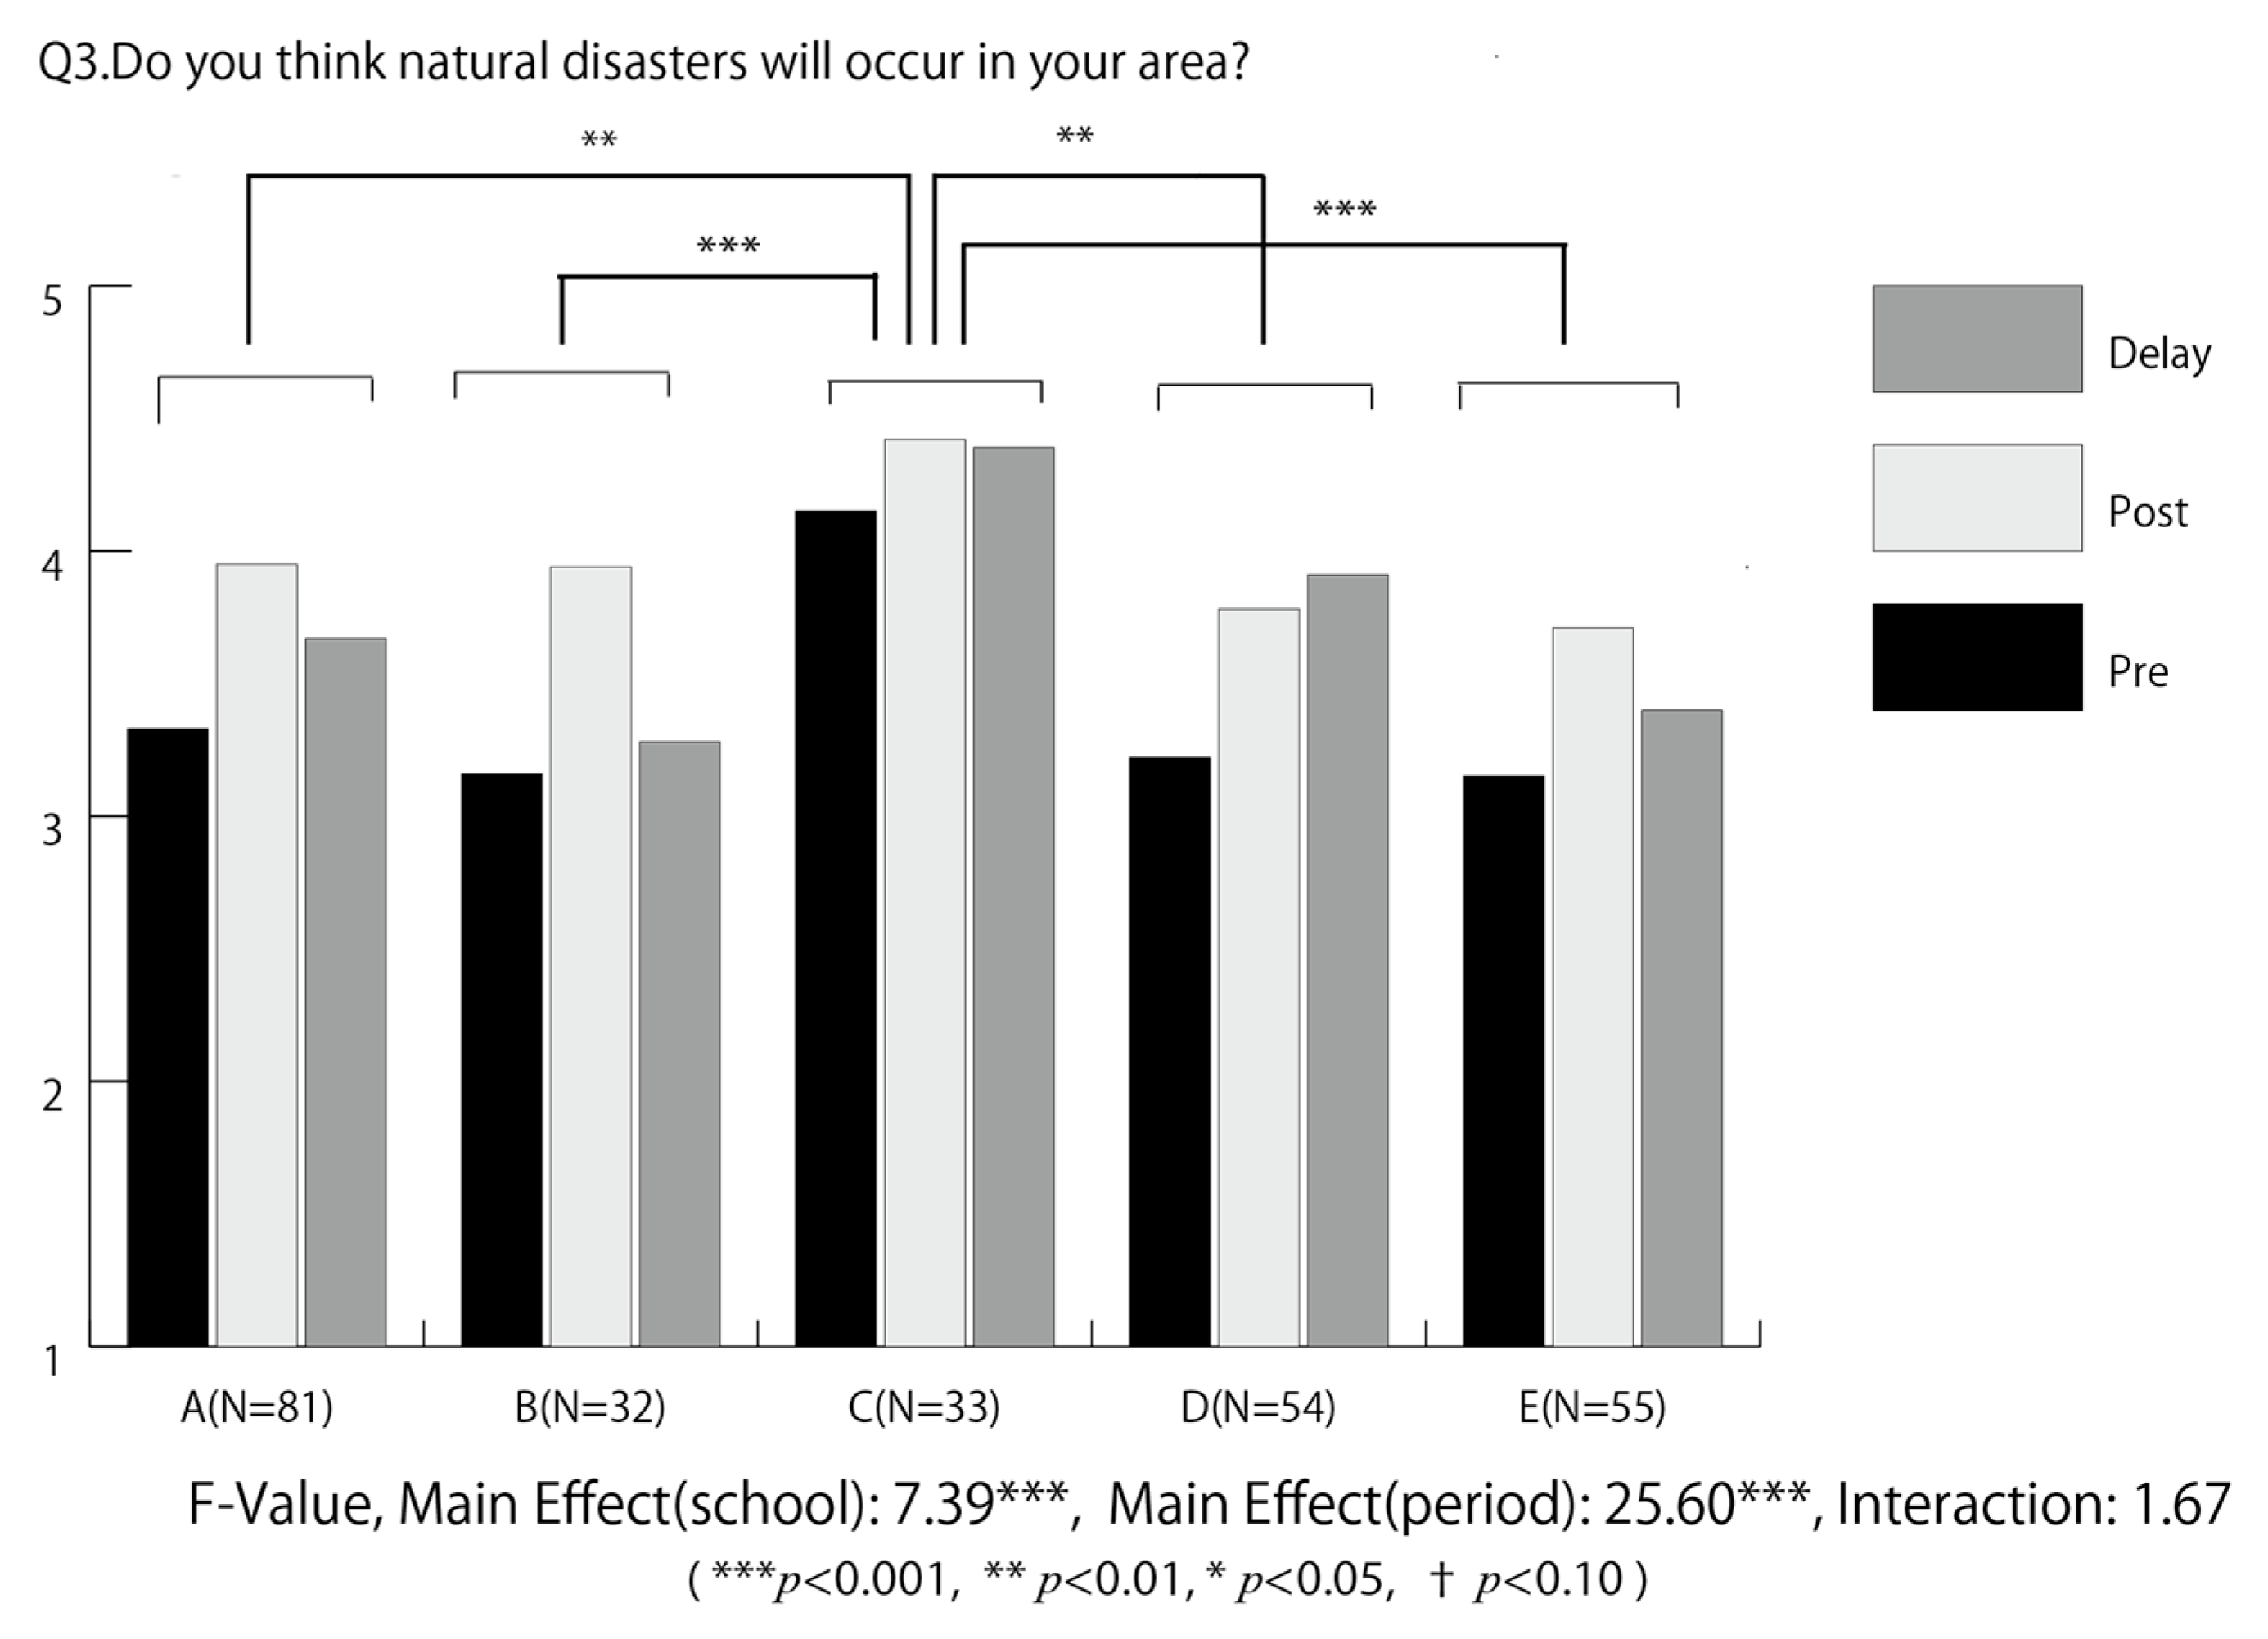
3.1. QI–Q3
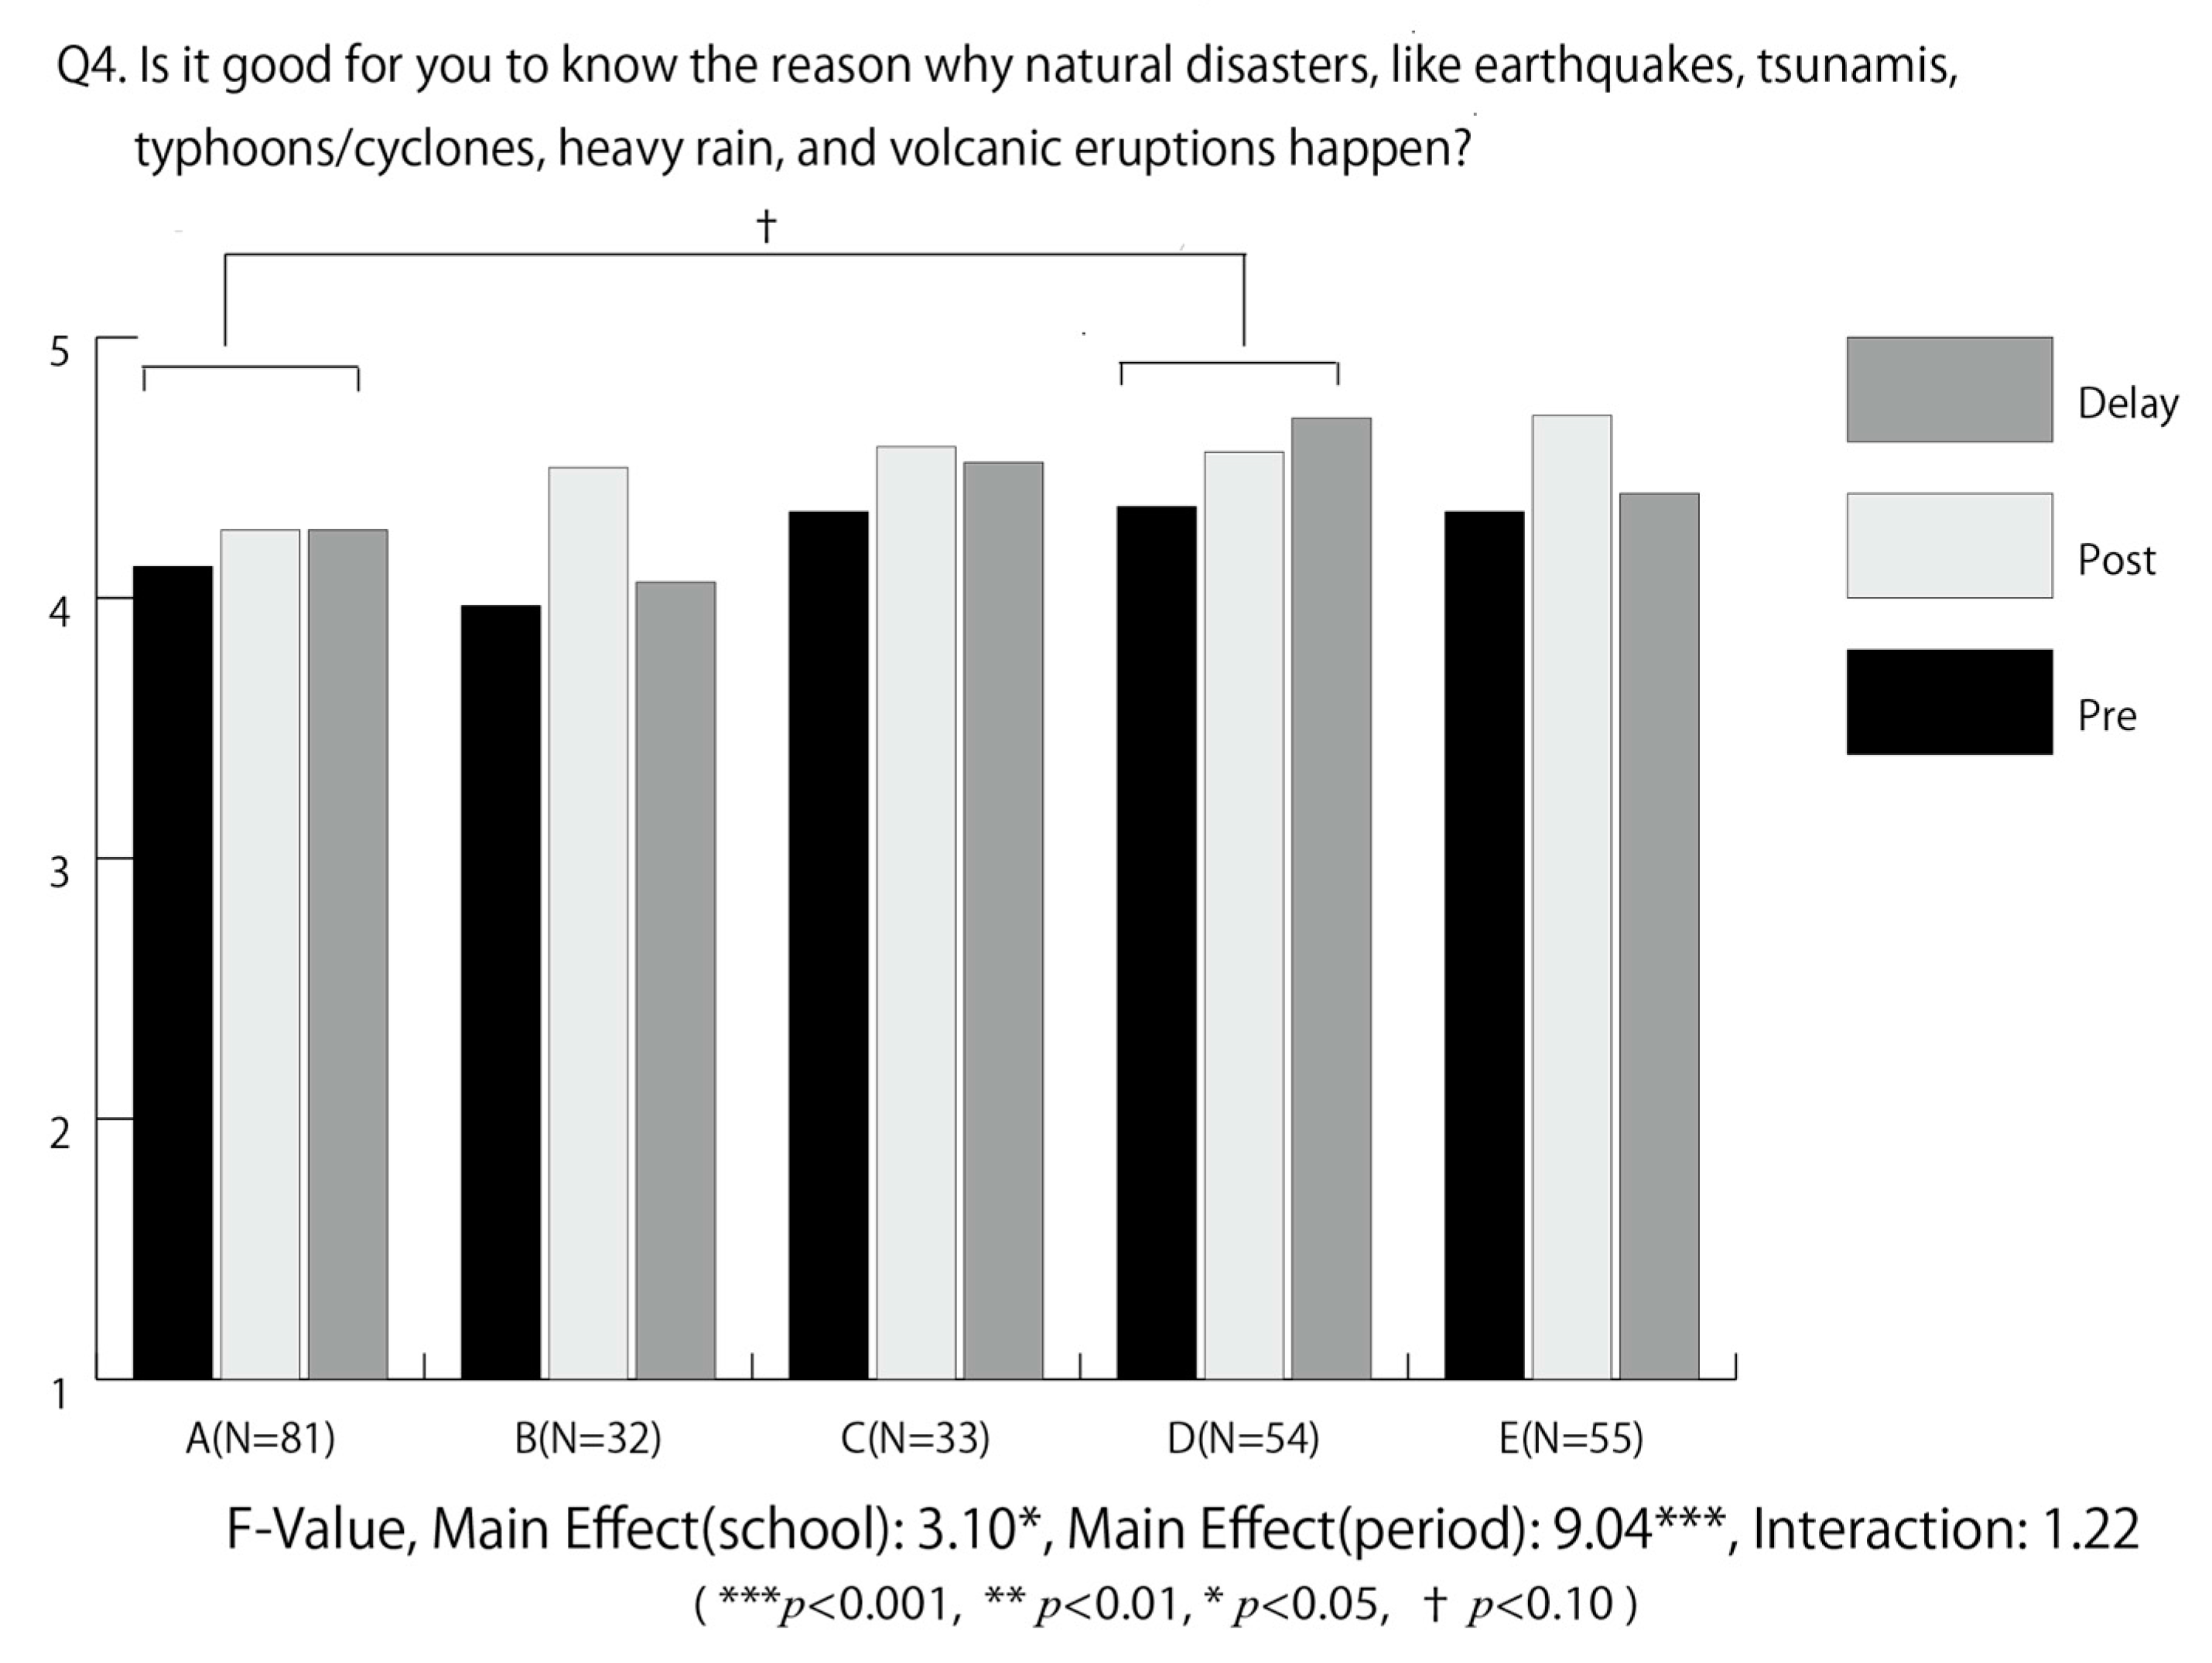
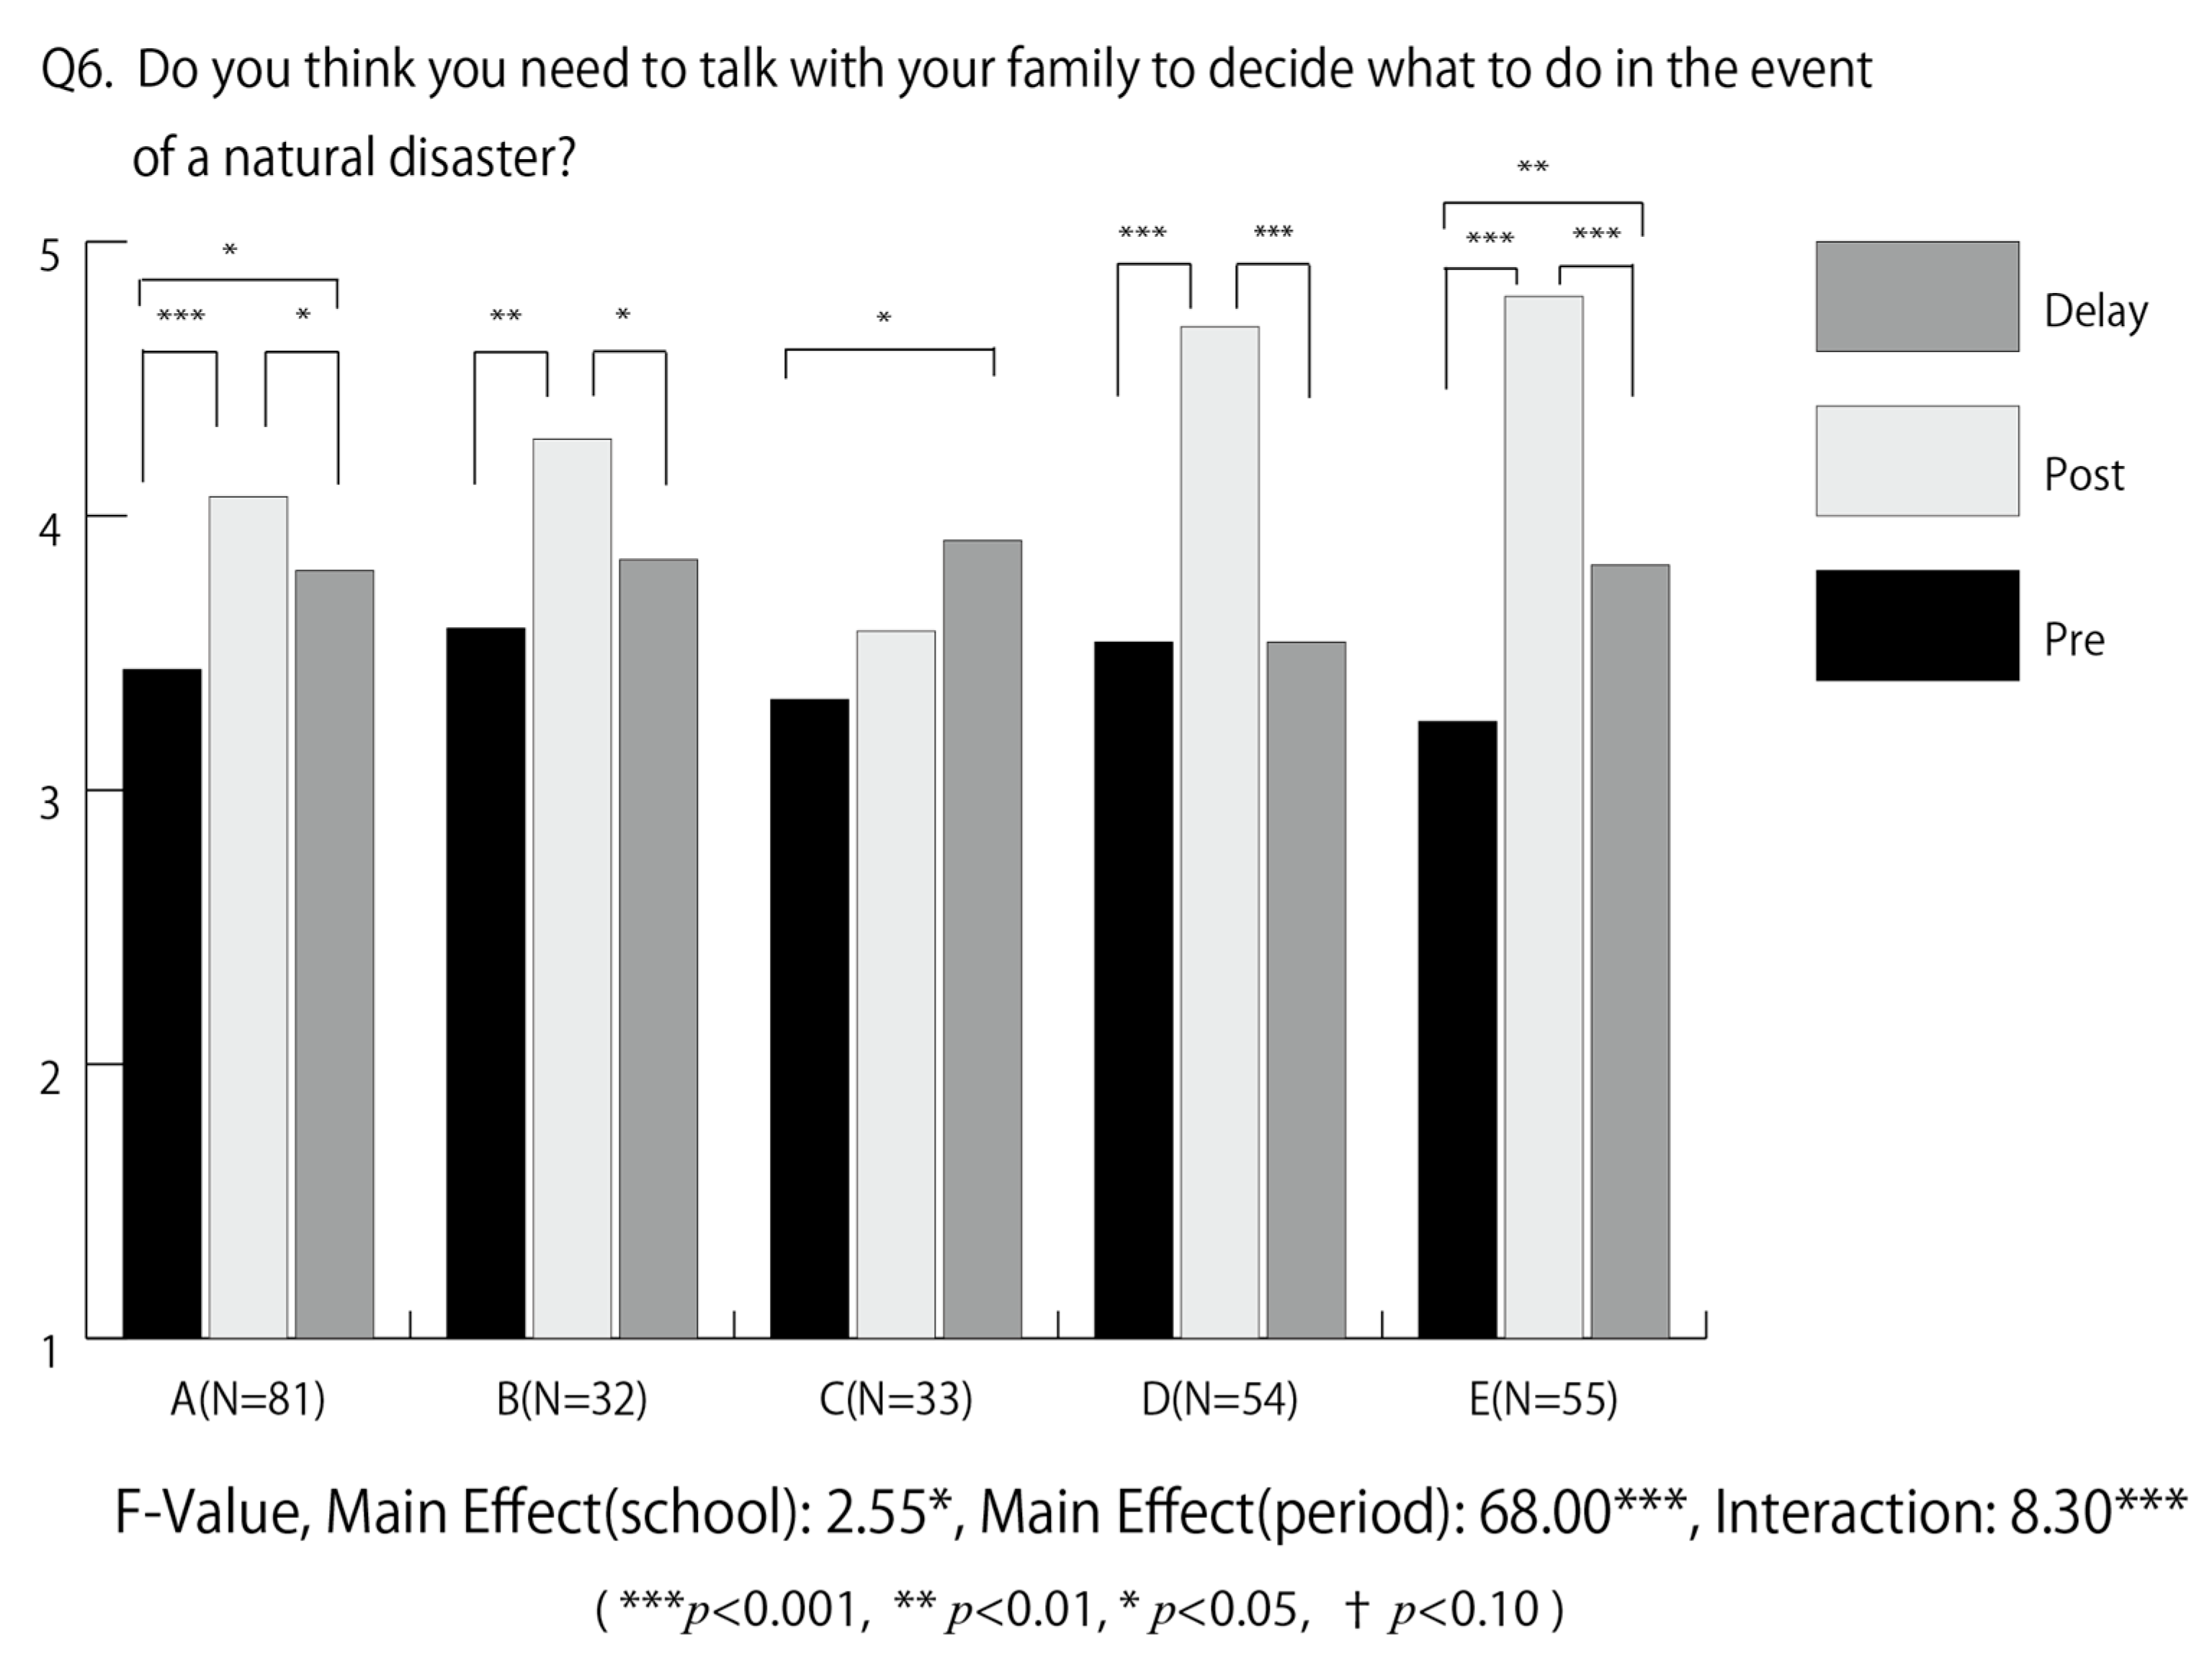
3.2. Q4–Q6
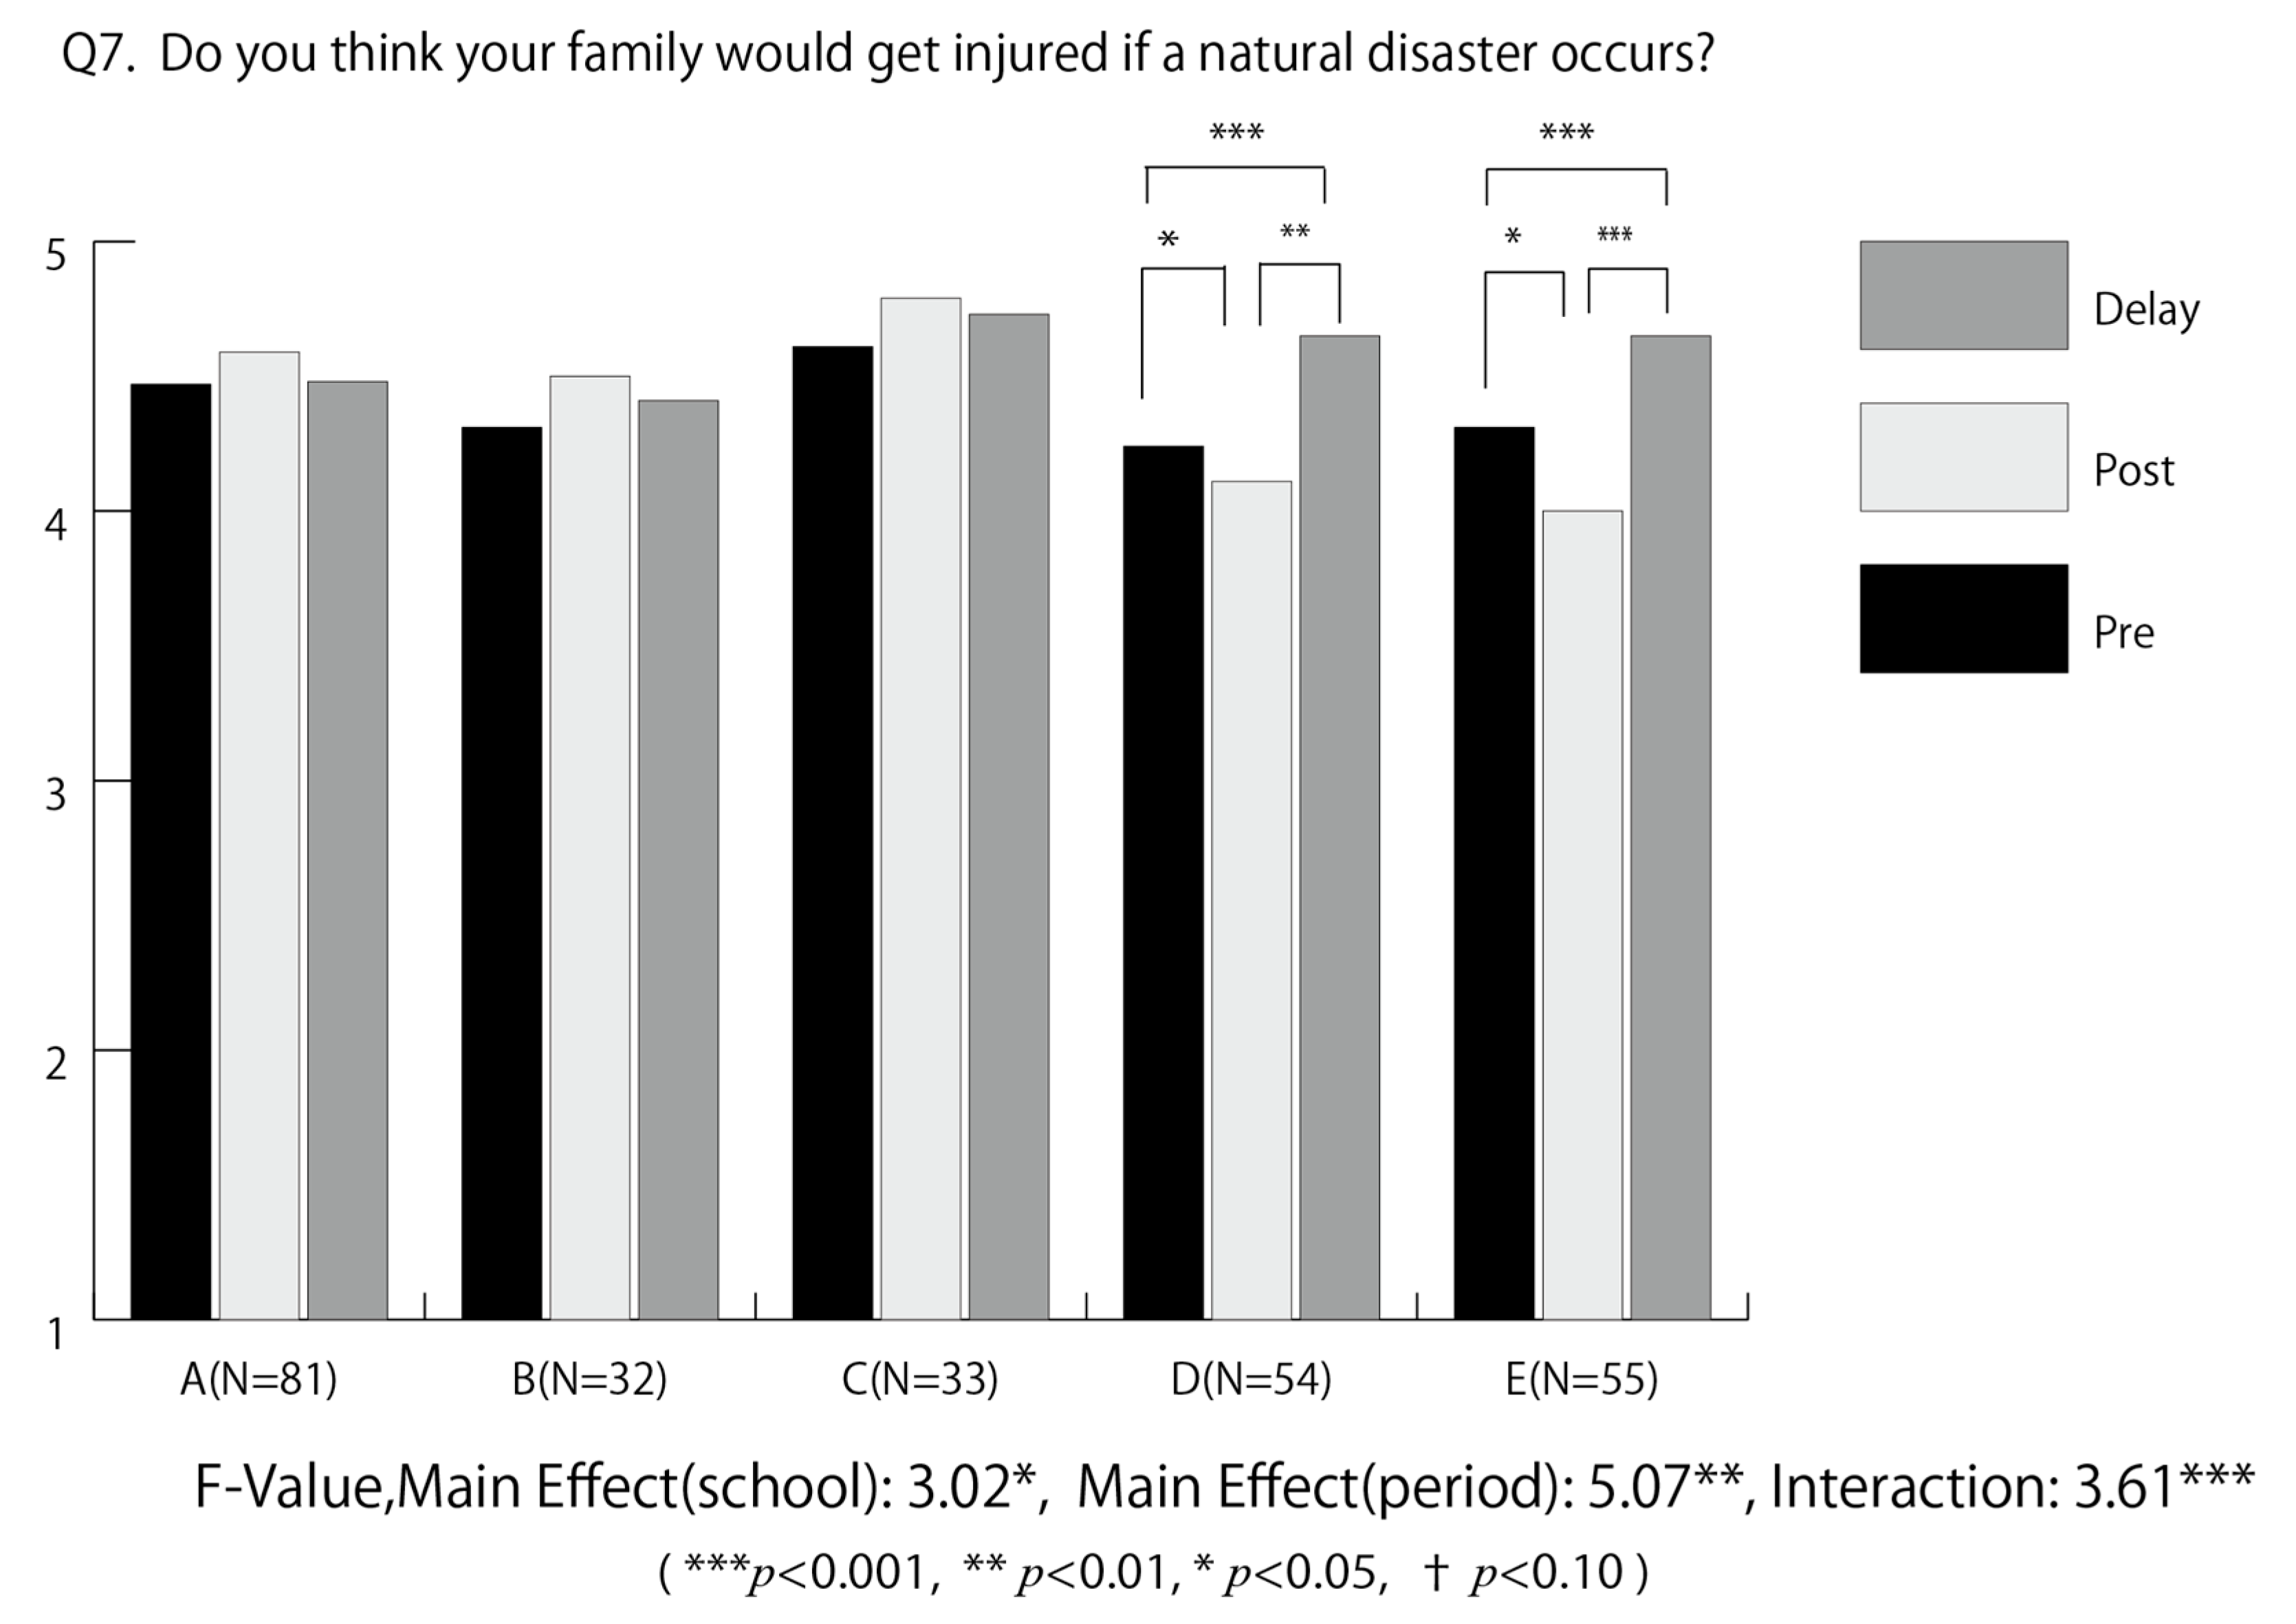
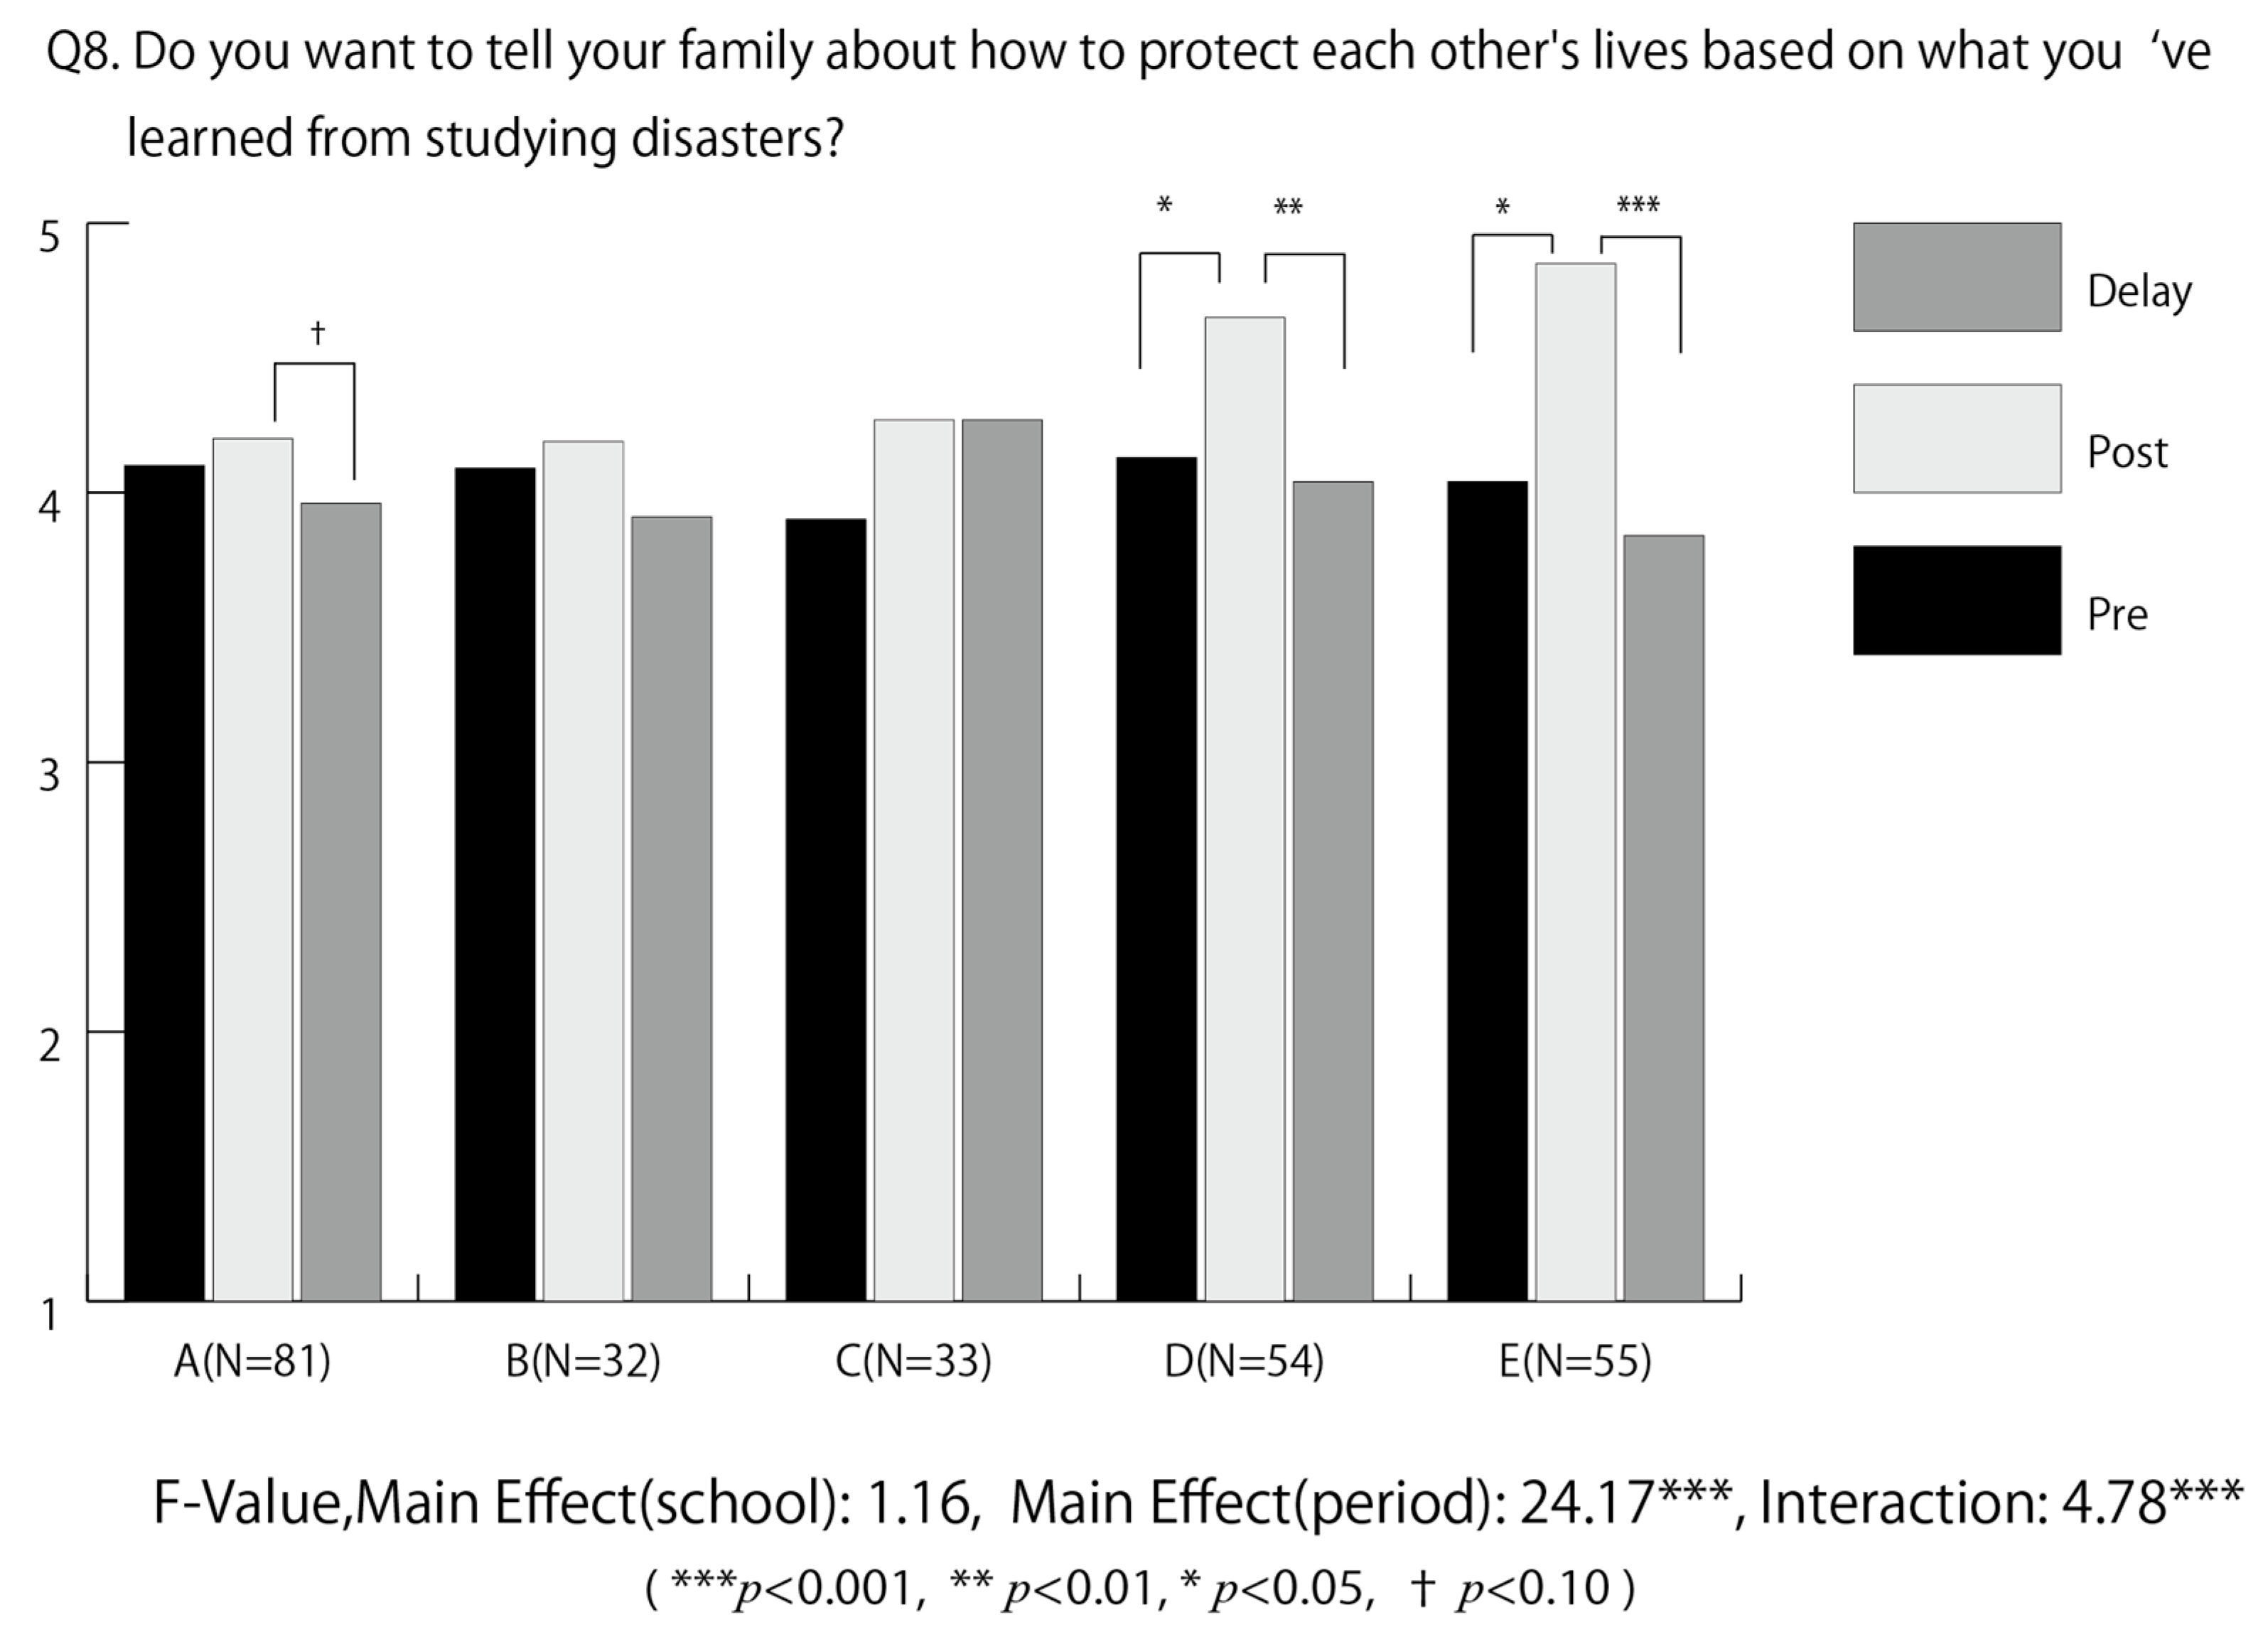
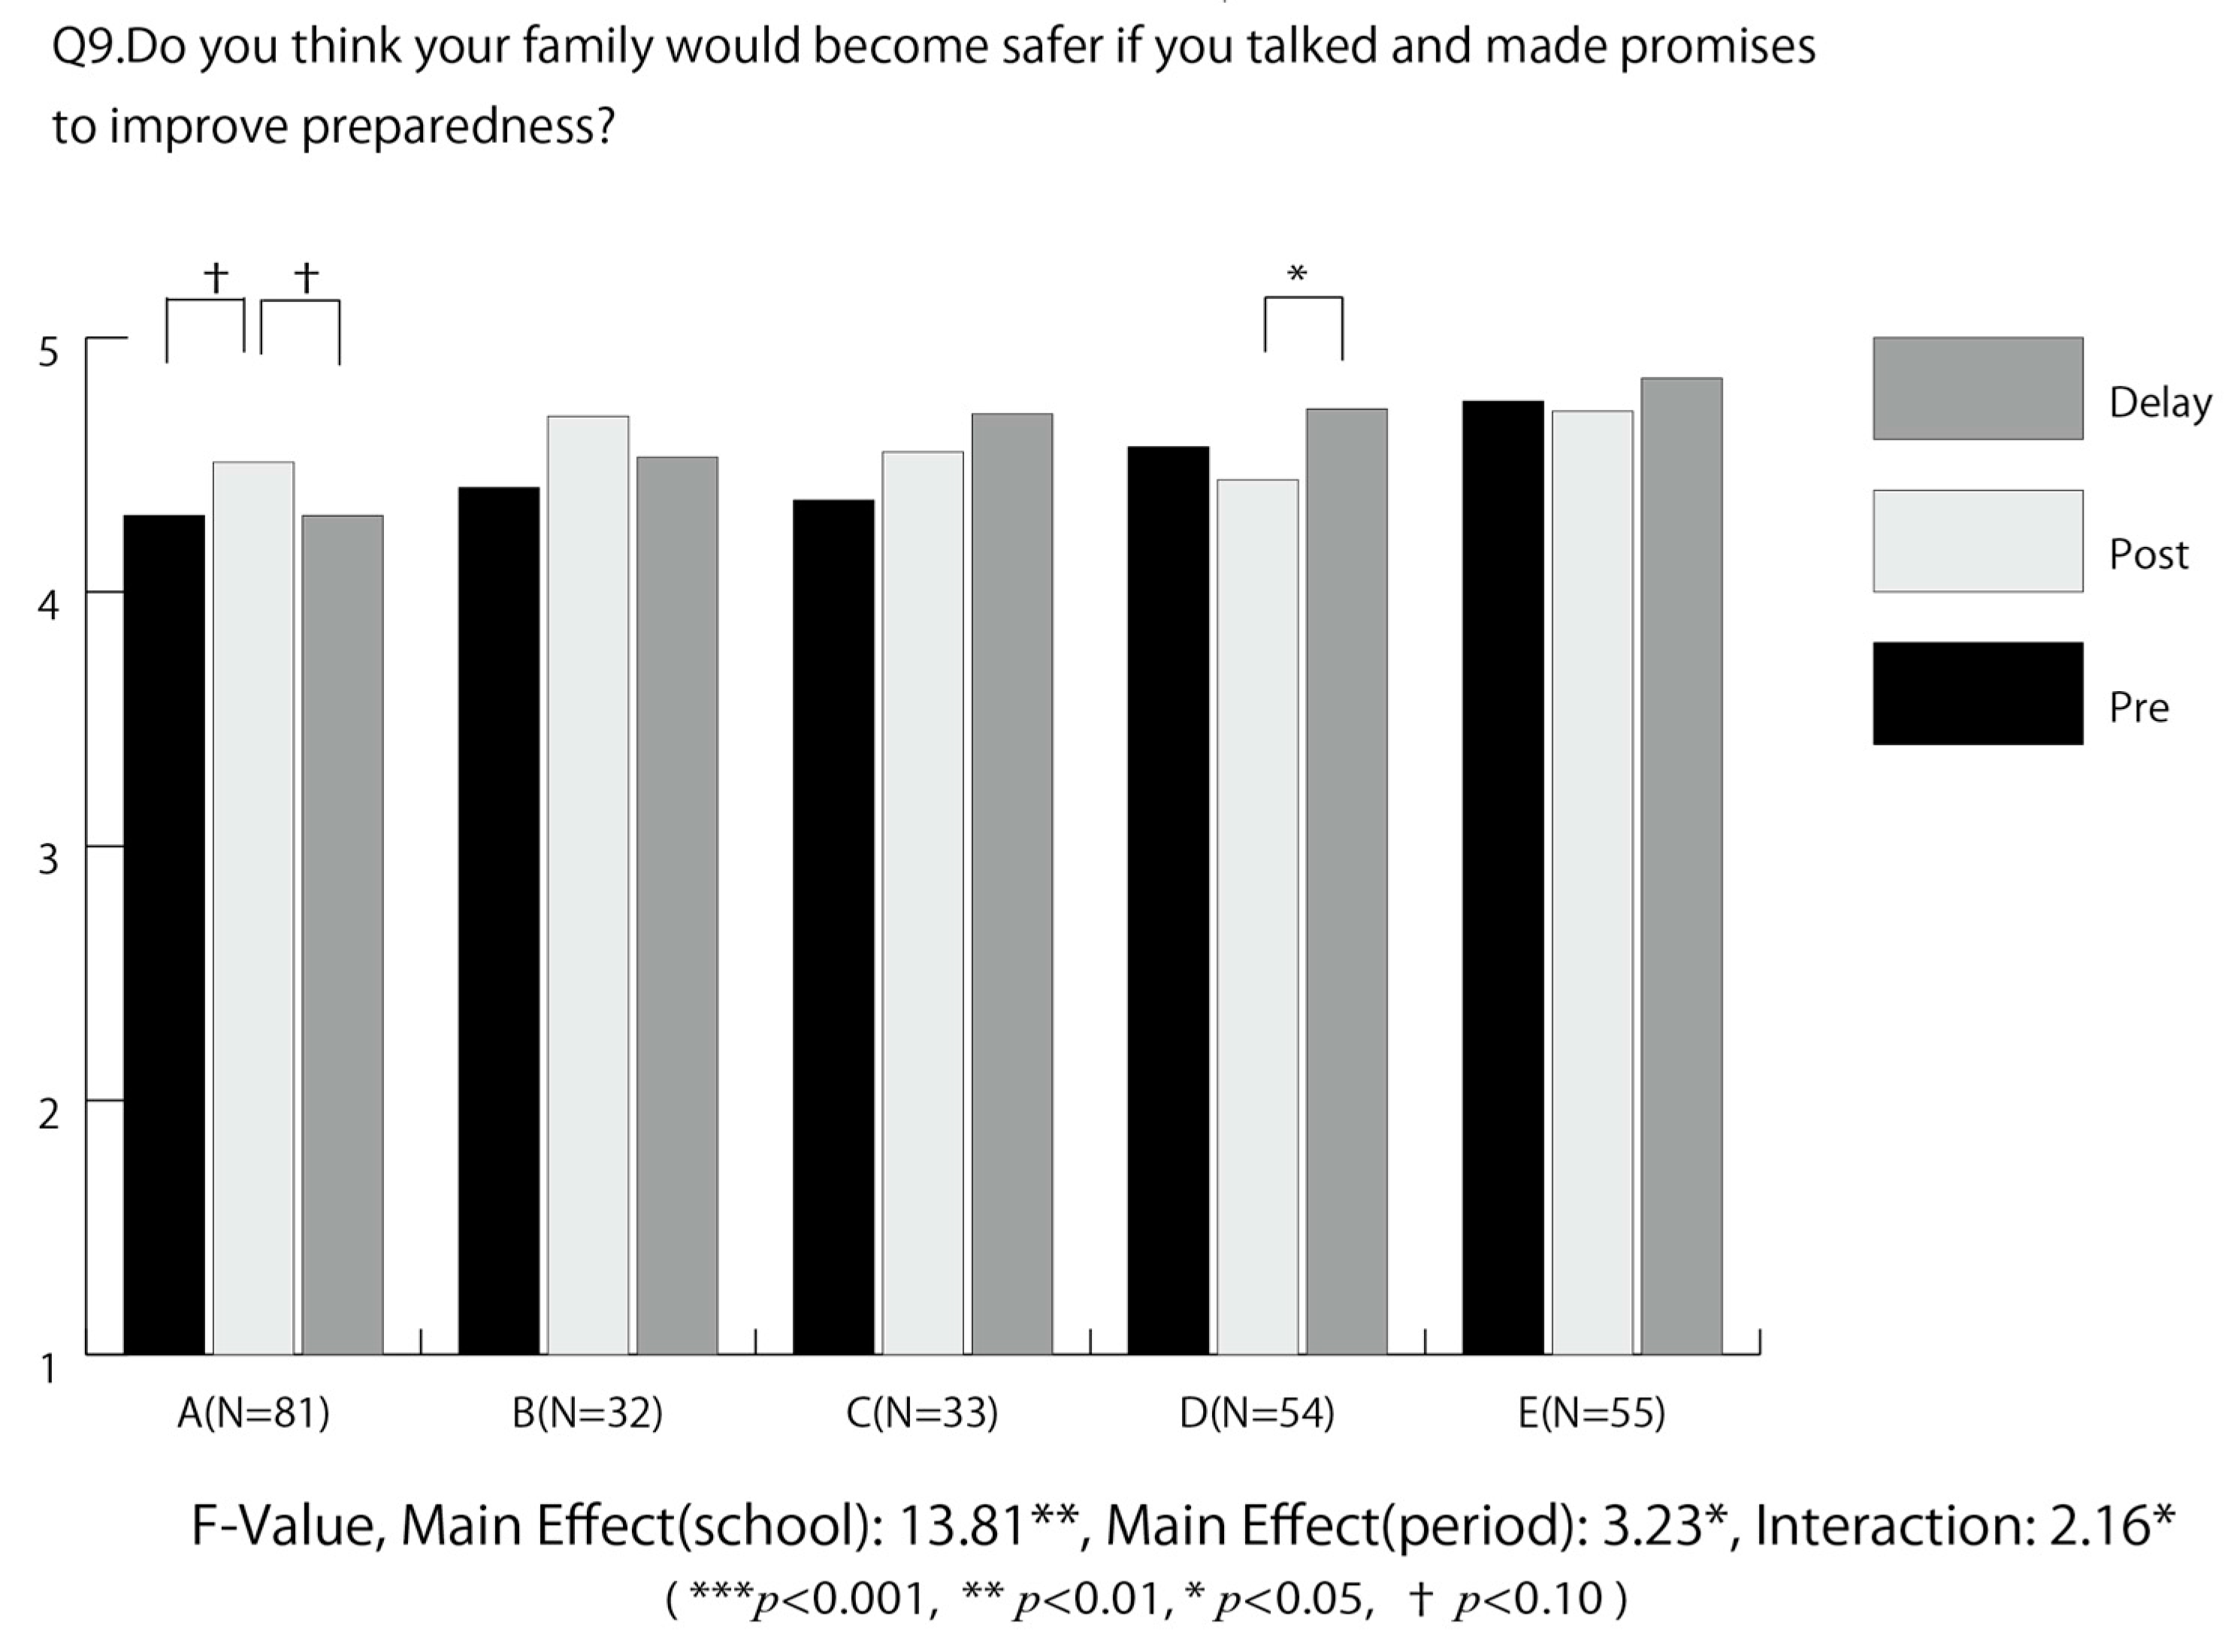
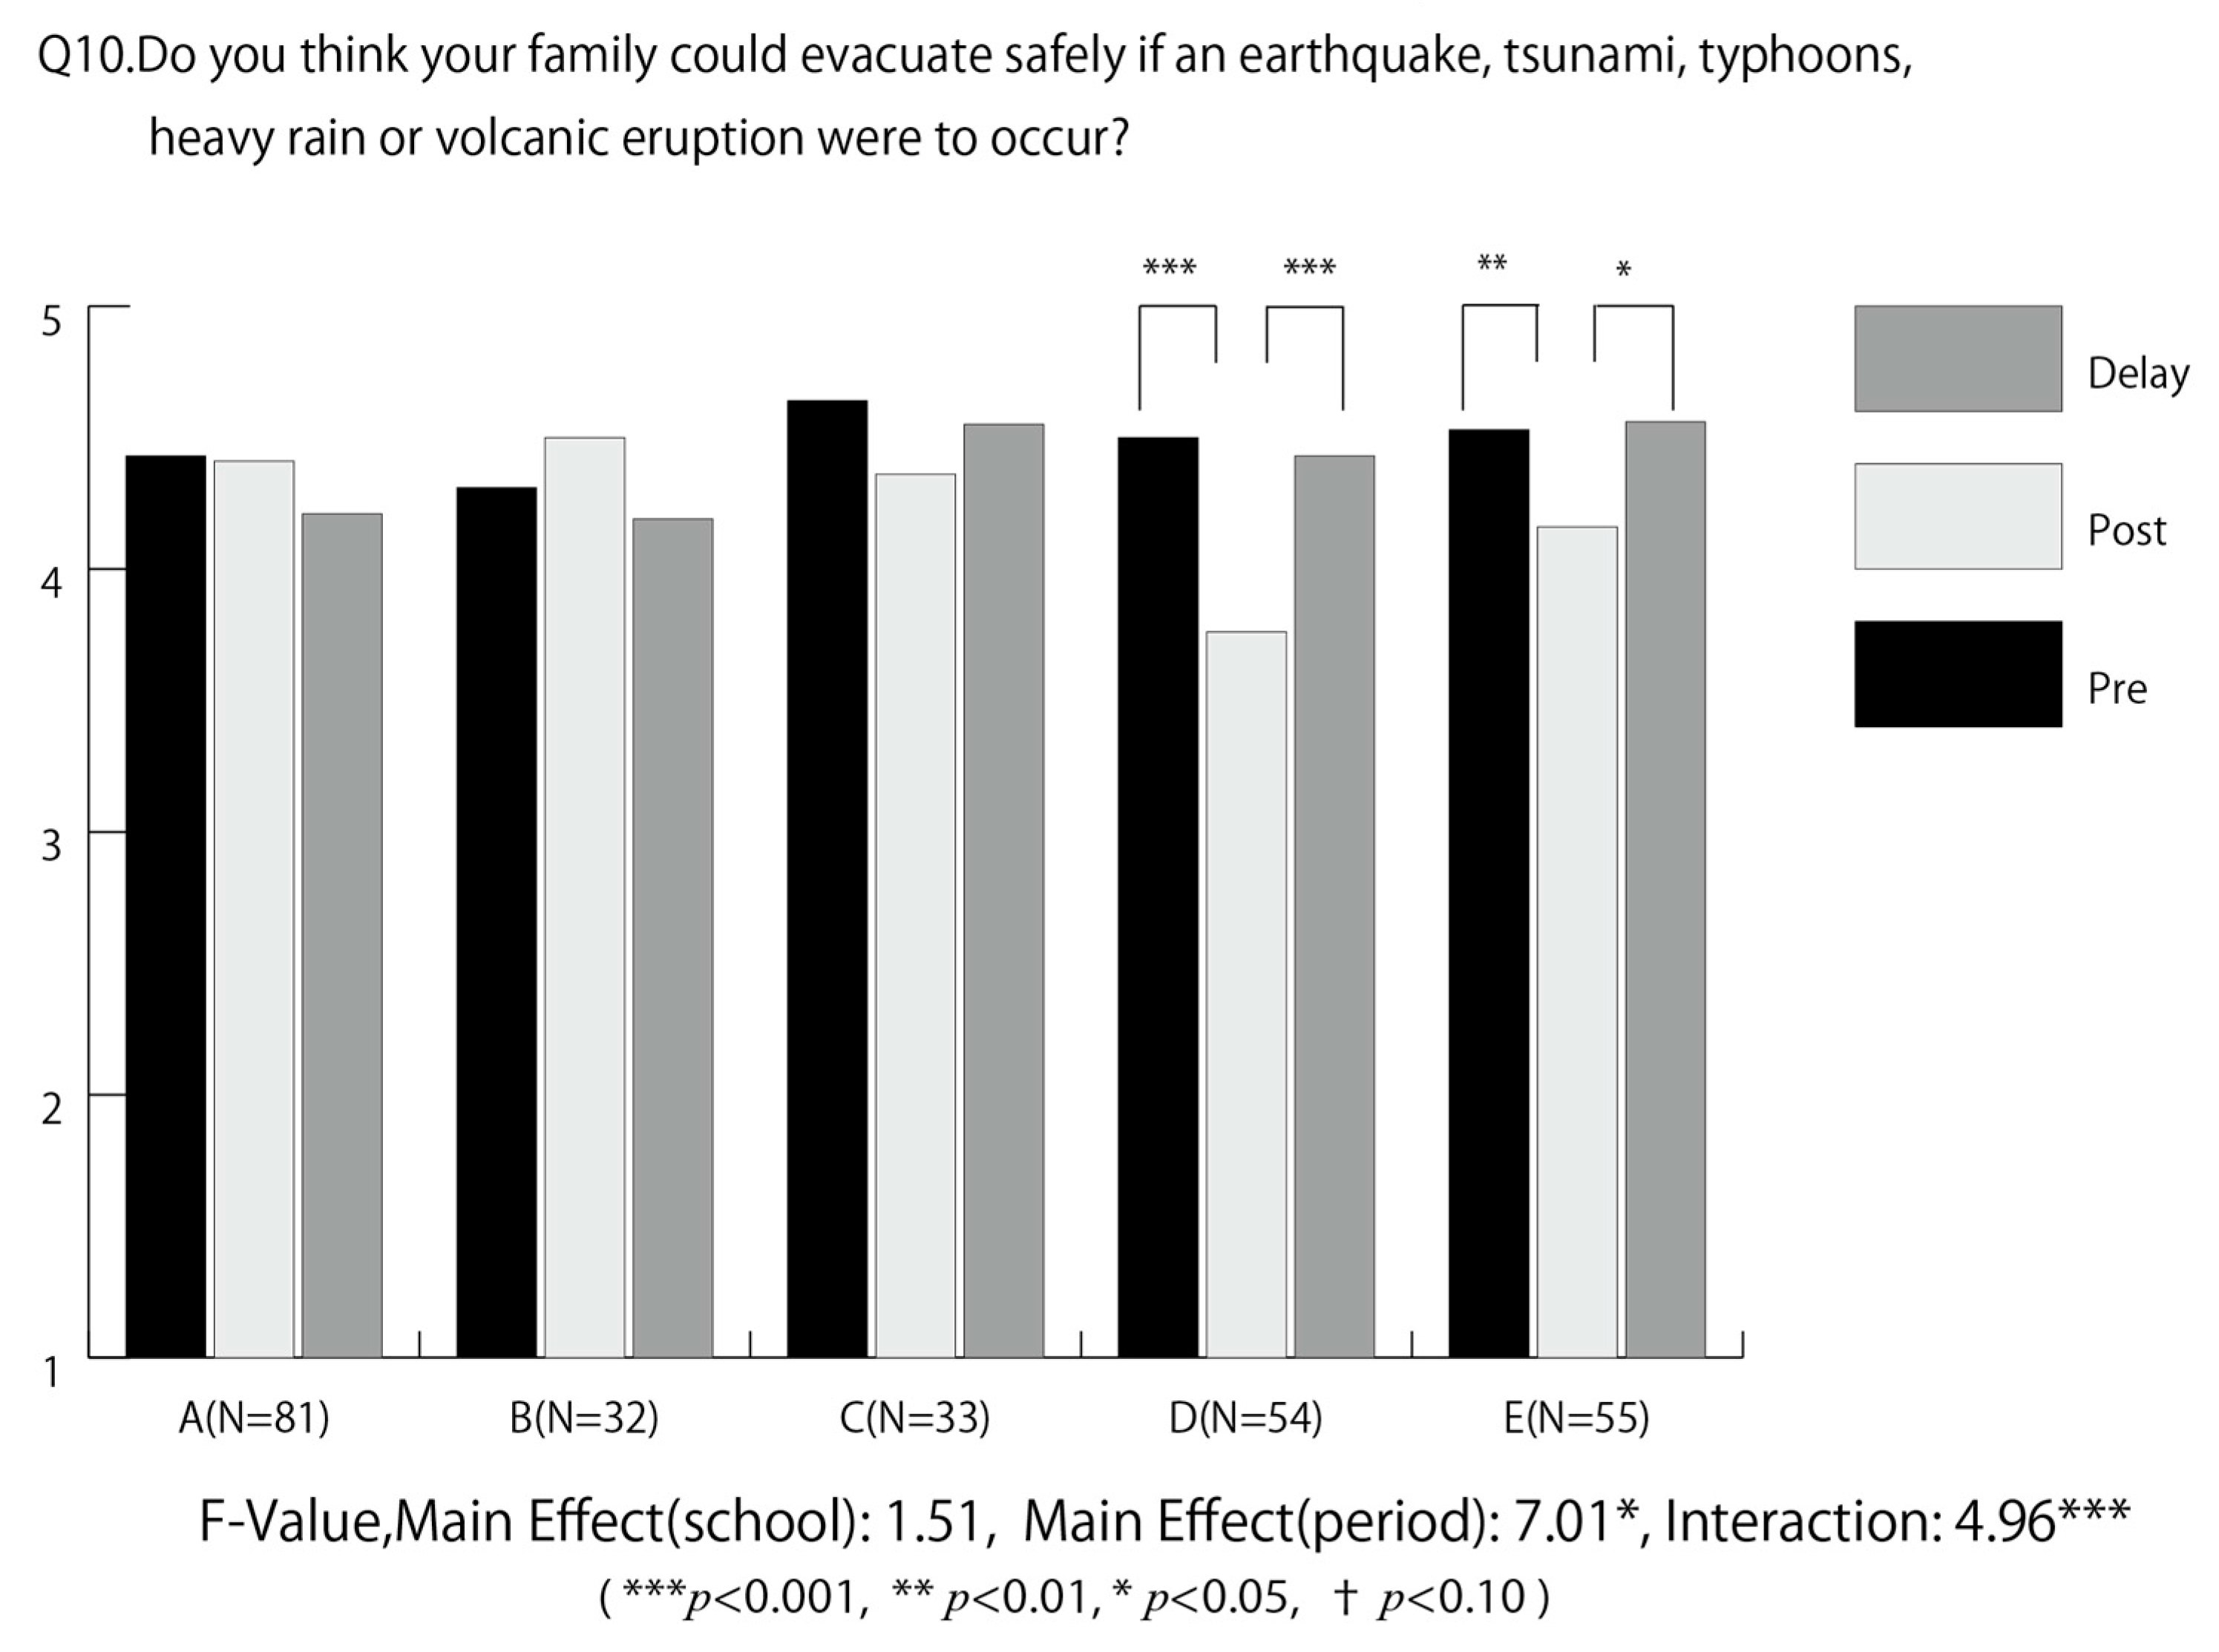
3.3. Q7–Q11
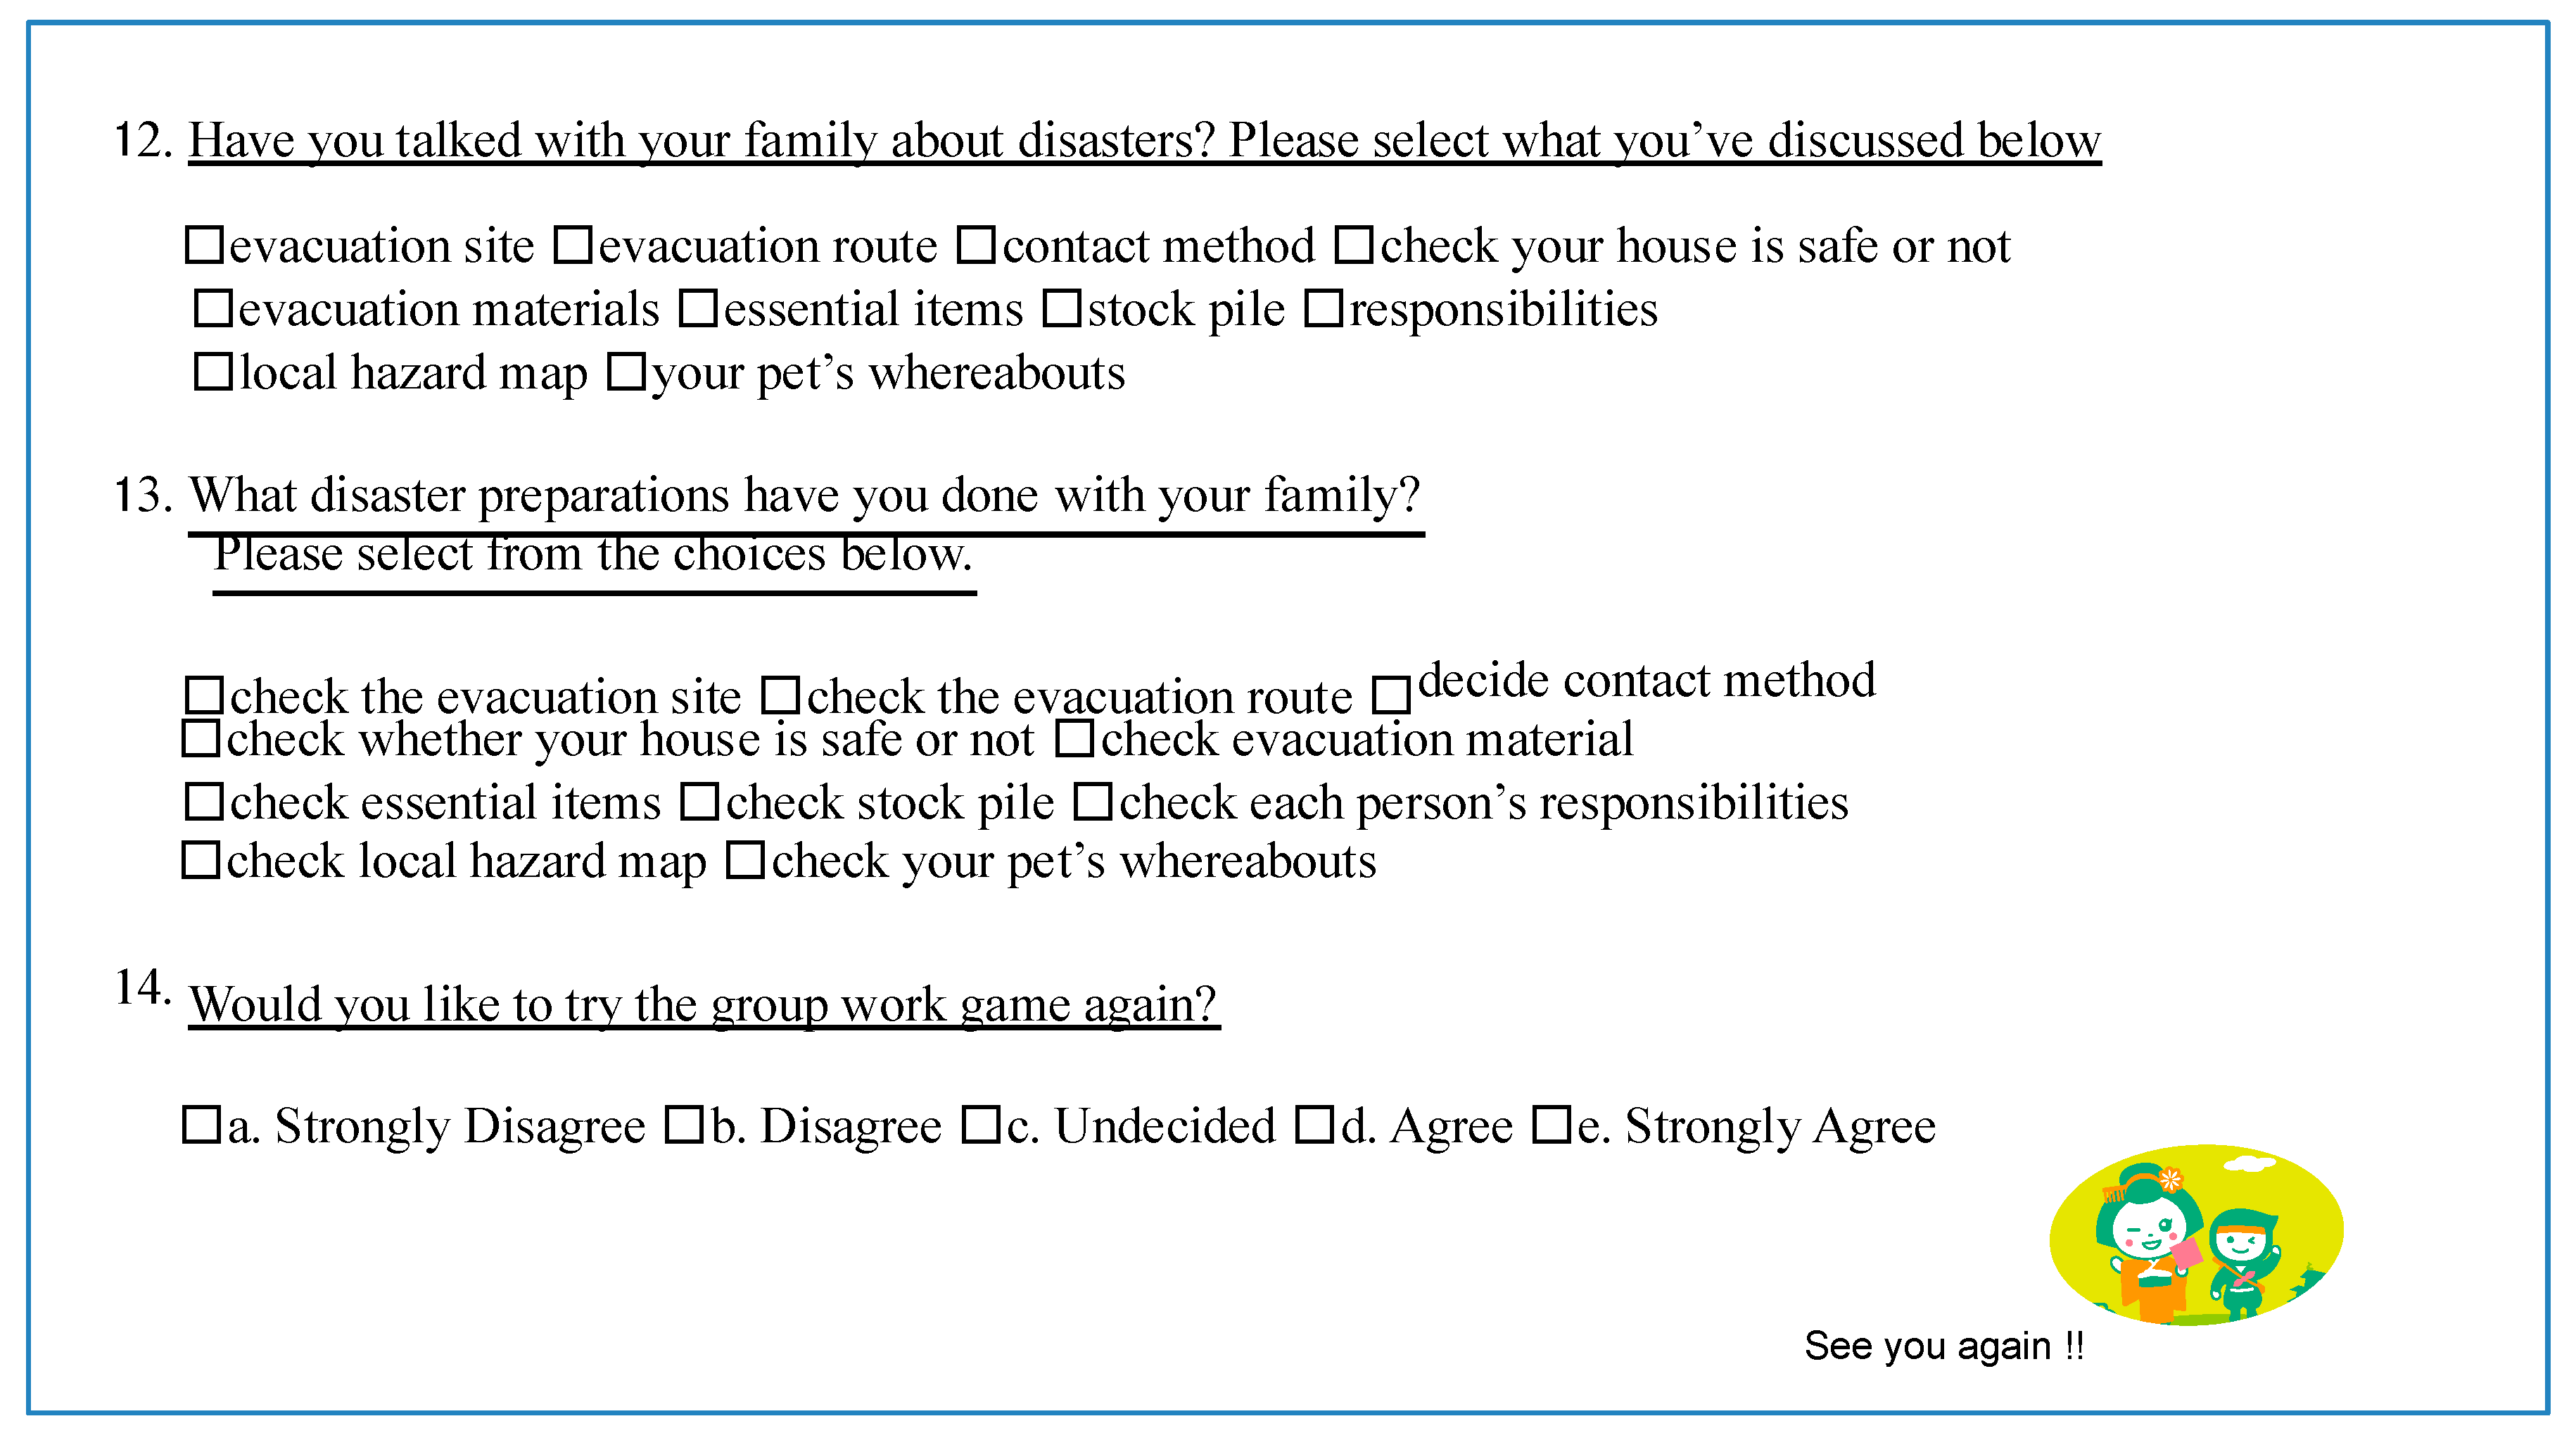
3.4. Q12–Q14
4. Discussion
4.1. Temporal and Regional Differences
4.2. Other Regional Differences
4.3. Indications for Future Studies
4.4. Recommendations for Future Studies
Acknowledgments
Author Contributions
Conflicts of Interest
References
- Shuto, N.; Imamura, F.; Koshimura, S.; Satake, K.; Matsutomi, H. Tsunami Dictionary; Asakura Publishing: Tokyo, Japan, 2007; ISBN 978-4-254-16060-4 C3544. [Google Scholar]
- Bernard, E.; Robinson, A. (Eds.) The Sea: Tsunamis (Ideas and Observations on Progress in the Study of the Seas); Harvard University Press: Cambridge, MA, USA, 2008; ISBN 9780674031739. [Google Scholar]
- Watanabe, T. Japan Damage Tsunami Review; Tokyo University Press: Tokyo, Japan, 1998; ISBN 4-13-061113-5 C3044. [Google Scholar]
- Surviving from Tsunami: What You Should Know by Then; Japan Society of Civil Engineers Tsunami Research Sub-Committee: Tokyo, Japan, 2009; ISBN 978-4-8106-0679-9 C3051.
- Tsunami: What You Should Know by Then to Survive the Tsunami; Coastal Technology Center Publication Editorial Committee: Tokyo, Japan, 2008; ISBN 978-4-86345-003-5 C0044.
- Day, S.; Fearnley, C. A classification of mitigation strategies for natural hazards: Implications for the understanding of interactions between mitigation strategies. Nat. Hazards 2015, 79, 1219–1238. [Google Scholar] [CrossRef]
- Suppasri, A.; Hasegawa, N.; Makinoshima, F.; Imamura, F.; Latcharote, P.; Day, S. An Analysis of Fatality Ratios and the Factors That Affected Human Fatalities in the 2011 Great East Japan Tsunami. Front. Built Environ. 2016, 2, 32. [Google Scholar] [CrossRef]
- Suppasri, A.; Latcharote, P.; Bricker, J.D.; Leelawat, N.; Hayashi, A.; Yamashita, K.; Imamura, F. Improvement of Tsunami Countermeasures Based on Lessons from The 2011 Great East Japan Earthquake and Tsunami—Situation After Five Years. Coast. Eng. J. 2016, 58, 1640011. [Google Scholar] [CrossRef]
- Latcharote, P.; Leelawat, N.; Suppasri, A.; Thamarux, P.; Imamura, F. Estimation of fatality ratios and investigation of influential factors in the 2011 Great East Japan Tsunami. Int. J. Disaster Risk Reduct. 2017. [Google Scholar] [CrossRef]
- Gyoba, E. Differences in Subjective Estimation of Risks and Assessment for the Modified Tsunami Warning System by the Japan Meteorological Agency Among University Students Located in Damaged and Non-damaged Prefectures Around the Period of the 2011 off Pacific Coast of Tohoku Earthquake. J. Disaster Res. 2014, 9, 571–578. [Google Scholar]
- Oki, S.; Nakayachi, K. Paradoxical effects of the record-high tsunamis caused by the 2011 Tohoku earthquake on public judgments of danger. Int. J. Disaster Risk Reduct. 2012, 2, 37–45. [Google Scholar] [CrossRef]
- Hirakawa, A.; Imamura, F. Analysis of the Great East Japan Earthquake: Mechanism of Earthquake and Tsunami and Actual Extent of Damage; International Research Institute of Disaster Science of Tohoku University: Sendai, Japan, 2013; ISBN 978-4-750 3-3823-1 C0336. [Google Scholar]
- Imamura, F. Deployment of Disaster Prevention Education; Toshindo Publishing: Tokyo, Japan, 2011; ISBN 978-4-7989-0055-1 C3337. [Google Scholar]
- Ando, M.; Ishida, M.; Hayashi, Y.; Mizuki, C.; Nishikawa, Y.; Tu, Y. Interviewing insights regarding the fatalities inflicted by the 2011 Great East Japan Earthquake. Nat. Hazards Earth Syst. 2013, 13, 2173–2187. [Google Scholar] [CrossRef]
- Ushiyama, M.; Yokomaku, S. Location Characteristics of Victims as a Result of Recent Heavy Rainfall Disasters. J. Disaster Inf. Stud. 2013, 11, 81–89. [Google Scholar]
- Ushiyama, M. Characteristics of Human Damage by Typhoon No. 0423 from October 20 to 21, 2004. J. Nat. Disaster Sci. 2005, 24, 257–265. [Google Scholar]
- Ushiyama, M. A Study of the Delay in Acknowledging Those Missing as a Result of the Heavy Rainfall Disaster in Northern Japan on October 6 to 9, 2006. J. Nat. Disaster Sci. 2007, 26, 279–289. [Google Scholar]
- Report of the Committee for Technical Investigation on Countermeasures for Earthquakes and Tsunamis Based on the Lessons Learned from the “2011 off the Pacific coast of Tohoku Earthquake” Central Disaster Management Council; Cabinet Office, Government of Japan: Tokyo, Japan, 28 September 2011.
- Disaster Management in Japan; White Paper; Cabinet Office: Tokyo, Japan, 2015.
- Disaster Management in Japan; Director General for Disaster Management, Cabinet Office, Government of Japan: Tokyo, Japan, March 2015.
- Irasawa, M.; Tagaya, T. Effect Evaluation by Practice of the Disaster Prevention Study Meeting for Elementary School Children; IWATE University: Morioka, Japan, 2013; Volume 44, pp. 103–117. [Google Scholar]
- Katada, T.; Kanai, M. The School Education to Improve the Disaster Response Capacity: A Case of “Kamaishi Miracle”. J. Disaster Res. 2016, 11, 845–856. [Google Scholar] [CrossRef]
- Katada, T.; Kanai, M. Implementation of tsunami disaster education for children and their parents at elementary school. In Solutions to Coastal Disasters 2008: Tsunamis; Fuji Technology Press: Tokyo, Japan, 2008; pp. 39–48. [Google Scholar]
- Toyosawa, J.; Karasawa, K.; Fukuwa, N. Effects of Disaster Education for Elementary School Children on Their Guardians’ Disaster Preparedness Action: Changes in Children’s Affect and Cognition. Jpn. Assoc. Educ. Psychol. 2010, 58, 480–490. [Google Scholar] [CrossRef]
- Lopes, R. Public Perception of Disaster Preparedness Presentations Using Disaster Damage Images; Working Paper #79; Natural Hazards Research and Applications Information Center: Boulder, CO, USA, 1992. [Google Scholar]
- Jones, A.M. Use of fear and threat-based messages to motivate preparedness: Costs, consequences and other choices: Part one. J. Bus. Contin. Emer. Plan. 2012, 6, 180–191. [Google Scholar] [PubMed]
- Nouchi, R.; Sato, S.; Imamura, F. Disaster Education for Elementary School Students Using Disaster Prevention Pocket Notebooks and Quizzes. J. Nat. Disaster Sci. 2015, 10, 1117–1125. [Google Scholar] [CrossRef]
- Nouchi, R.; Sugiura, M. Beneficial Effects of Learning with Game Books on Education for Disaster Prevention in Children. J. Disaster Res. 2014, 9, 1079–1087. [Google Scholar] [CrossRef]
- Clerveaux, V.; Spence, B. The Communication of Disaster Information and Knowledge to Children Using Game Technique: The disaster Awareness Game (DAG). Int. J. Environ. Resour. 2009, 3, 209–222. [Google Scholar]
- Vandiver, D.M.; Walsh, J.A. Assessing autonomous learning in research methods courses: Implementing the student—Driven research project. Act. Learn. High. Educ. 2010, 11, 31–42. [Google Scholar] [CrossRef]
- Sunaga, K. Several Understandings and Practical Tasks of Active Learning: Focusing on the Concept “Activeness”; Departmental Bulletin Paper; Kansai University Institutional Repository: Suita, Japan, 2010; Available online: http://hdl.handle.net/10112/2939 (accessed on 12 November 2017).
- Ohta, Y.; Ushiyama, M. A study of the relationship between regional characteristics and disaster education at school. J. Nat. Disaster Sci. 2009, 28, 249–257. [Google Scholar]
- Yahoo! Japan. Available online: https://crisis.yahoo.co.jp/shelter/map/?ac=03301&lat=39.69629050&lon=140.97578450 (accessed on 12 November 2017).
- Yahoo! Japan. Available online: https://crisis.yahoo.co.jp/shelter/map/?ac=07484&lat=37.04233030&lon=140.50967760 (accessed on 12 November 2017).
- Yahoo! Japan. Available online: https://crisis.yahoo.co.jp/shelter/map/?ac=04505&lat=38.54439440&lon=141.05670300 (accessed on 12 November 2017).
- Yahoo! Japan. Available online: https://crisis.yahoo.co.jp/shelter/map/?ac=04102&lat=38.26614220&lon=140.90984070 (accessed on 12 November 2017).
- Yahoo! Japan. Available online: https://crisis.yahoo.co.jp/shelter/map/?ac=30202&lat=34.15533890&lon=135.20923020 (accessed on 12 November 2017).
- Available online: http://www.mext.go.jp/b_menu/shingi/old_chukyo/old_chukyo_index/toushin/attach/1309597.htm (accessed on 15 June 2017).
- Sato, T.; Koizimu, Y.; Konno, T. Regional Characteristics of Occurrence including Transition of Refugees in Sendai City during The Great East Japan Earthquake. J. Jpn. Assoc. Earthq. Eng. 2012, 12, 278–287. [Google Scholar] [CrossRef]
- “Road to Recovery” Post-Disaster Reconstruction; Department City Planning Policy: Sendai, Japan, October 2017.
- Yasuda, T.; Mizobata, Y.; Okumura, Y.; Mase, H.; Mori, N.; Shimada, H. Magnitudes Variation in the Wakayama Prefecture. J. Jpn. Soc. Civ. Eng. 2012, 68, 156–161. [Google Scholar]
- Ministry of Land, Infrastructure, Transport and Tourism Japan. The first Report of the Great Earthquake Model Nankai-Trough. Available online: http://www.bousai.go.jp/jishin/chubou/nankai_trough/nankai_trough_top.html (accessed on 22 April 2012). (In Japanese)
- Coletti, M.; Hultquist, C.; Kennedy, G.W.; Cervone, G. Validating Safecast data by comparisons to a U. S. Department of Energy Fukushima Prefecture Aerial Survey. J. Environ. Radioact. 2017, 171, 9–20. [Google Scholar] [CrossRef] [PubMed]
- Aoki, T.; Imura, T. Some Remarks on Construction of Survey Questionnaire for Children and Youth, in the Case of Character Strengths Scales Called Shinayakasa. Bull. Grad. Sch. Educ. Hiroshima Univ. Part 1 Learn. Curric. Dev. 2012, 61, 9–14. Available online: https://ir.lib.hiroshima-u.ac.jp/files/public/3/33953/201412191442037435/BullGradSchEduc-HiroshimaUniv-Part1_61_9.pdf (accessed on 7 December 2017).
- Available online: https://www.tohoku.ac.jp/en/research/research_highlights/research_highlight_24.html (accessed on 7 December 2017).
- Haynes, K.; Barclay, J.; Pidgeon, N. Volcanic hazard communication using maps: An evaluation of their effectiveness. Bull. Volcanol. 2007, 70, 123–138. [Google Scholar] [CrossRef]
- Tversky, A.; Kahneman, D. Judgment under Uncertainty: Heuristics and Biases. Science 1974, 185, 1124–1131. [Google Scholar] [CrossRef] [PubMed]


| Order | Contents | The Purpose | Time |
|---|---|---|---|
| Questionnaire on disaster awareness before the class | Measure current disaster prevention consciousness | 5 min | |
| Part 1 | Lecture on natural disasters and hazard based on lessons from the 2001 Great Tohoku Earthquake | Make the mechanism and damage of disasters recognized as scientific knowledge | 30 min |
| Break | Break | 5 min | |
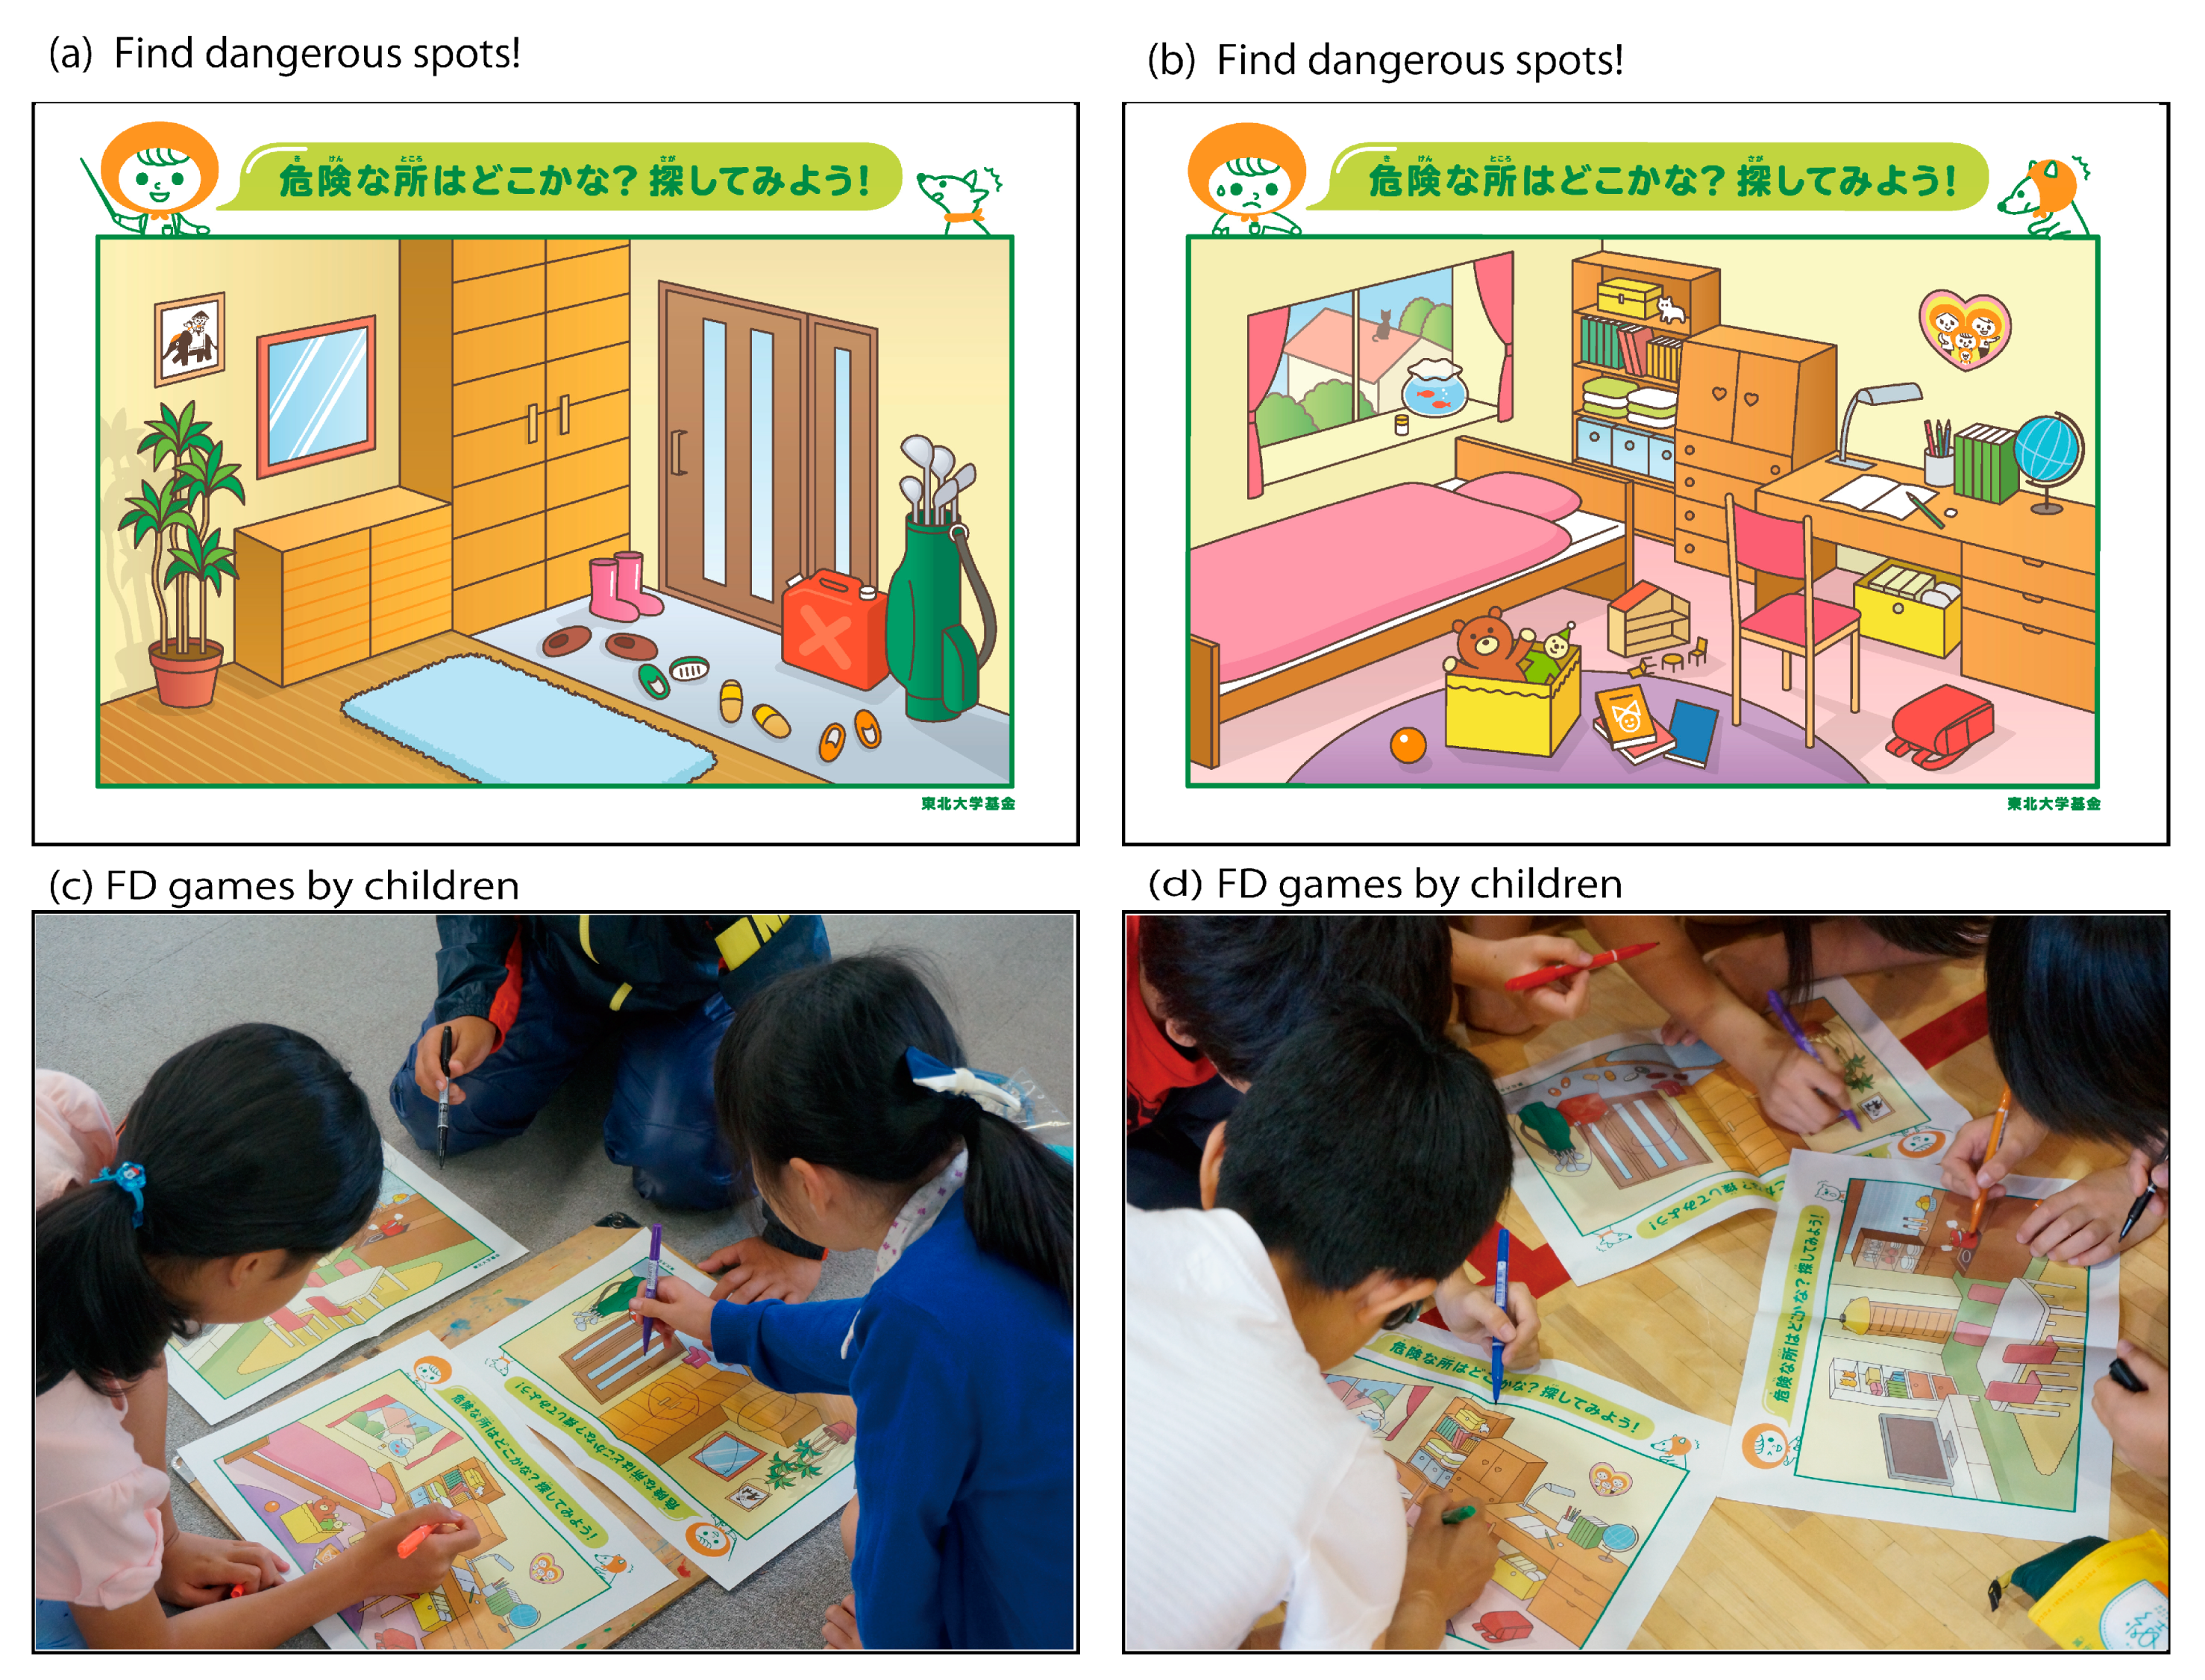
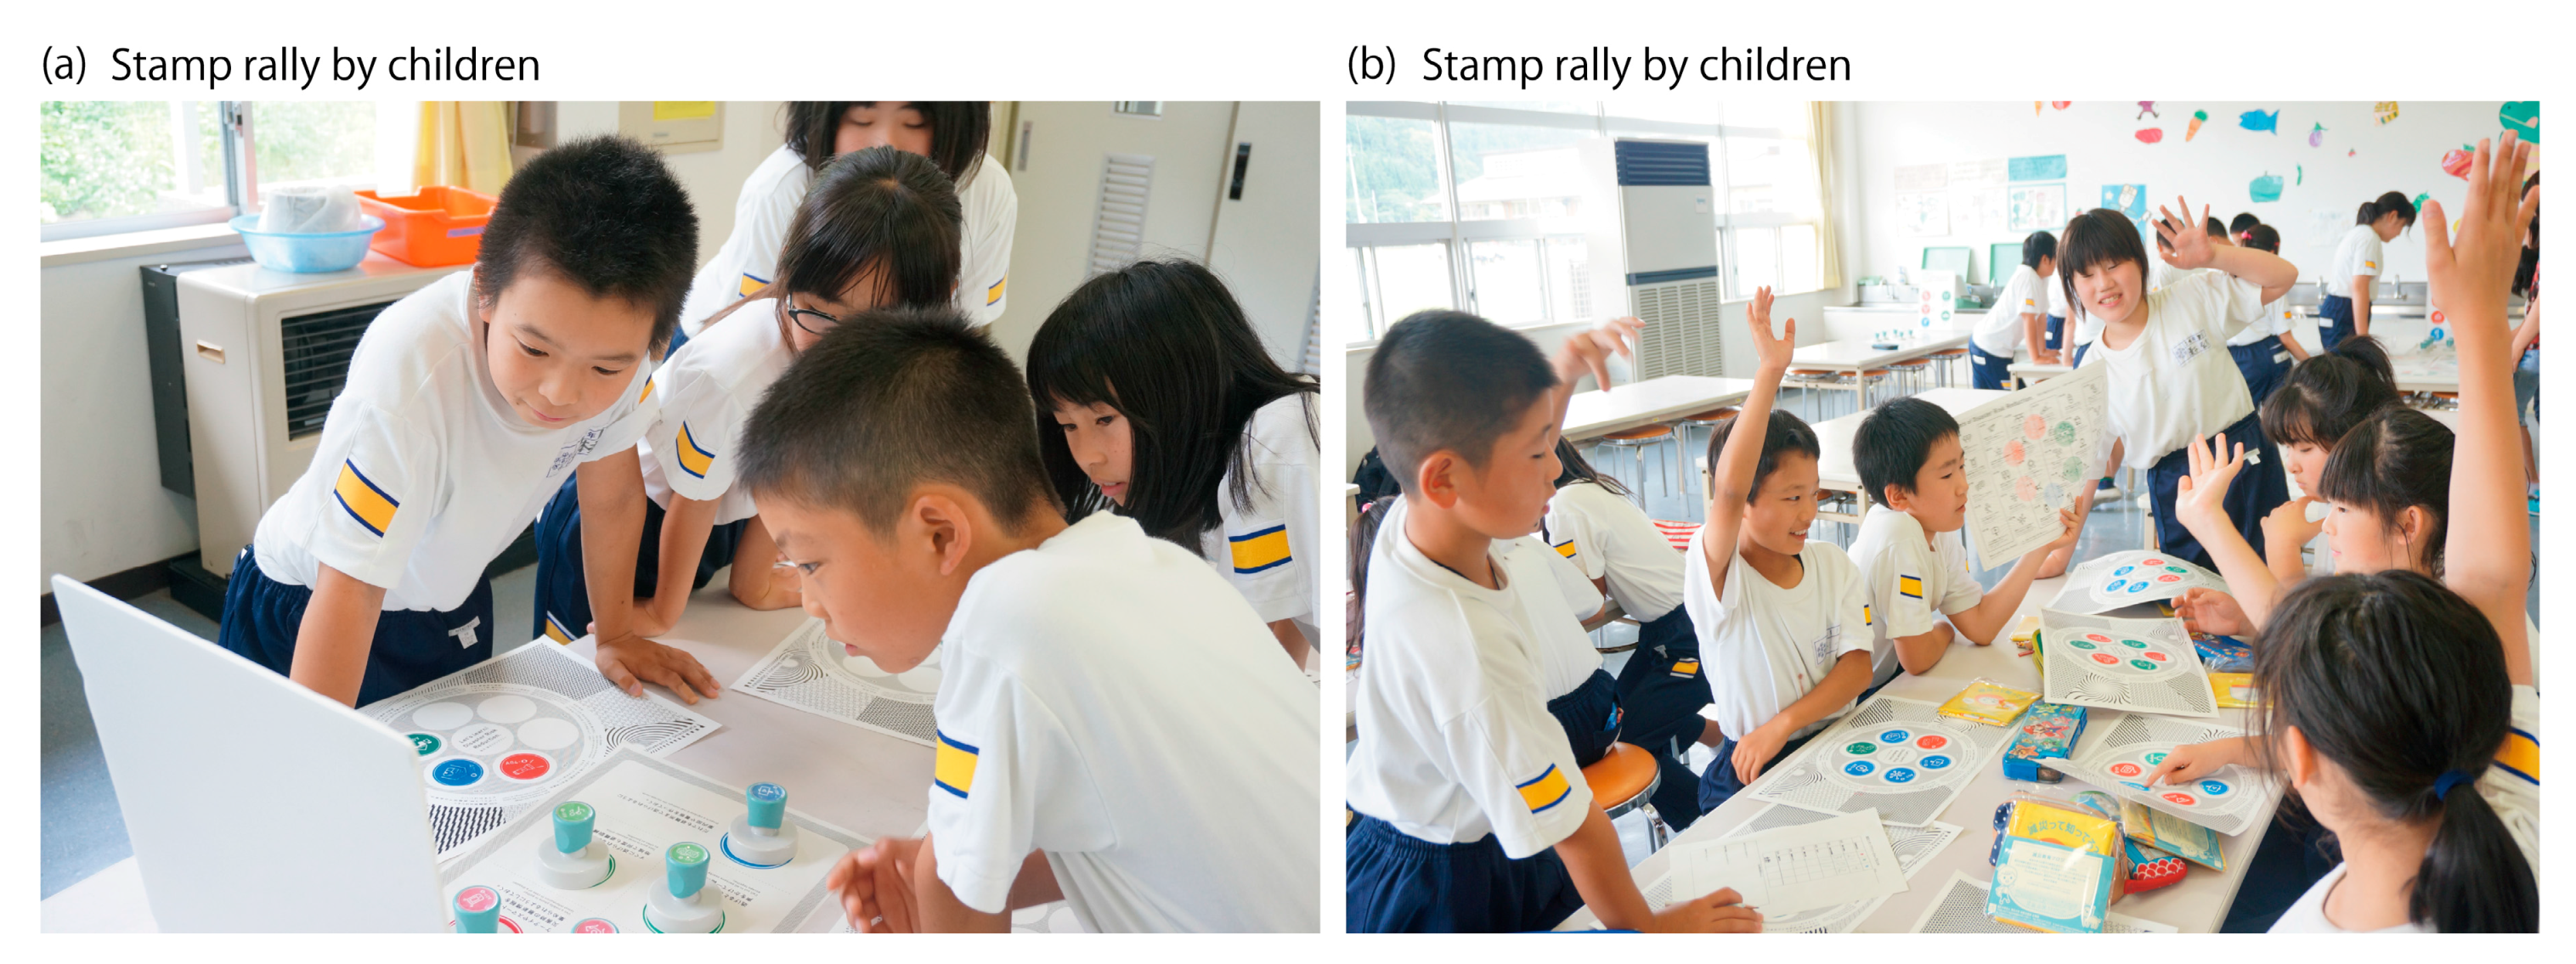
| Part 2 | Group activity game using FD game or Stamp rally | Make children anticipate the situation at the time of disaster | 25 min |
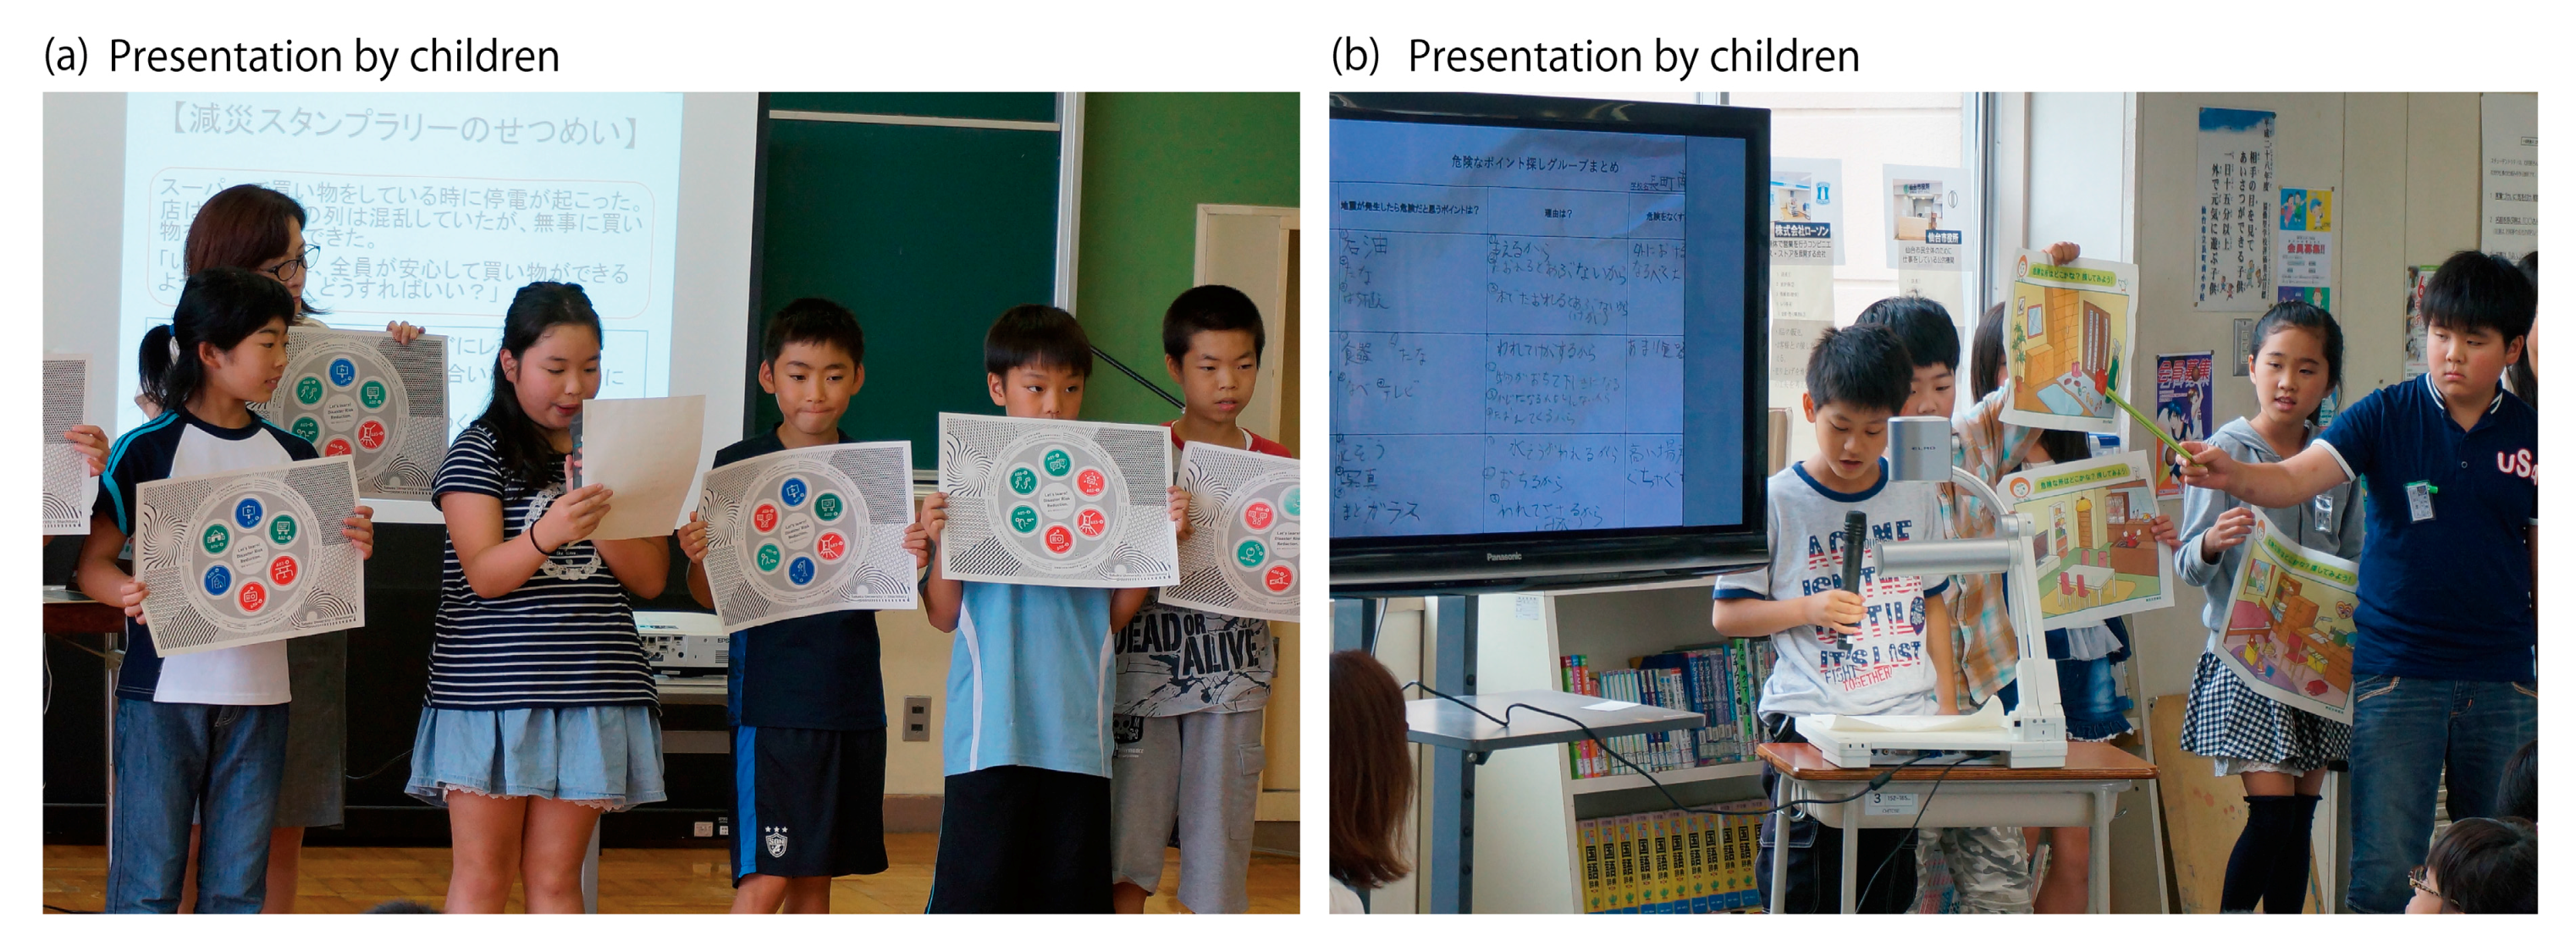
| Part 3 | Presentation | Identify disaster mitigation measures that can be implemented by individuals | 20 min |
| Questionnaire on disaster awareness after the class | Measure changes in disaster prevention awareness of children after class | 5 min |
| No. | Question Contents | Evacuation Site | Evacuation Route | Contact Method | Check Your House Is Safe or Not | Evacuation Materials | Essential Items | Stock Pile | Responsi-Bilities | Local Hazard Map | Your Pet’s Whereabouts | |
|---|---|---|---|---|---|---|---|---|---|---|---|---|
| Q12 | Have you talked with your family about disasters? Please select what you’ve discussed below | A (N = 81) | 84.0 | 28.4 | 59.3 | 46.9 | 44.4 | 66.7 | 18.5 | 38.3 | 16.0 | 12.3 |
| B (N = 32) | 78.1 | 46.9 | 31.3 | 43.8 | 56.3 | 43.8 | 28.1 | 18.8 | 15.6 | 15.6 | ||
| C (N = 33) | 90.9 | 45.5 | 30.3 | 33.3 | 42.4 | 54.5 | 27.3 | 18.2 | 15.2 | 15.2 | ||
| D (N = 54) | 53.7 | 13.0 | 25.9 | 29.6 | 27.8 | 48.1 | 20.4 | 13.0 | 7.4 | 11.1 | ||
| E (N = 55) | 72.7 | 14.5 | 20.0 | 36.4 | 30.9 | 47.3 | 23.6 | 7.3 | 9.1 | 16.4 | ||
| Average | 75.3 | 24.3 | 38.4 | 38.8 | 37.6 | 51.4 | 21.2 | 20.0 | 11.4 | 12.9 | ||
| χ2 | 21.45 *** | 15.63 ** | 28.20 *** | 4.74 | 9.47 † | 13.22 * | 1.41 | 30.06 *** | 4.19 | 1.26 | ||
| Q13 | What disaster preparations have you done with your family? Please select from the choices below. | A (N = 81) | 75.3 | 38.3 | 54.3 | 43.2 | 38.3 | 60.5 | 19.8 | 37.0 | 7.4 | 19.8 |
| B (N = 32) | 68.8 | 31.3 | 40.6 | 25.0 | 31.3 | 37.5 | 15.6 | 9.4 | 0.0 | 3.1 | ||
| C (N = 33) | 63.6 | 39.4 | 27.3 | 24.2 | 45.5 | 36.4 | 24.2 | 18.2 | 18.2 | 12.1 | ||
| D (N = 54) | 44.4 | 9.3. | 24.1 | 18.5 | 22.2 | 42.6 | 11.1 | 7.4 | 5.6 | 11.1 | ||
| E (N = 55) | 54.5 | 12.7 | 14.5 | 25.5 | 27.3 | 50.9 | 14.5 | 7.3 | 5.5 | 14.5 | ||
| Average | 62.4. | 25.9 | 34.1 | 33.3 | 32.5 | 48.6 | 16.9 | 19.2 | 7.8 | 13.7 | ||
| χ2 | 15.42 ** | 22.84 *** | 27.80 *** | 11.65 * | 7.06 | 9.04 † | 3.28 | 25.89 *** | 8.13† | 5.94 |
© 2018 by the authors. Licensee MDPI, Basel, Switzerland. This article is an open access article distributed under the terms and conditions of the Creative Commons Attribution (CC BY) license (http://creativecommons.org/licenses/by/4.0/).
Share and Cite
Yasuda, M.; Muramoto, T.; Nouchi, R. Assessment of Educational Methods for Improving Children’s Awareness of Tsunamis and Other Natural Disasters: Focusing on Changes in Awareness and Regional Characteristics in Japan. Geosciences 2018, 8, 47. https://doi.org/10.3390/geosciences8020047
Yasuda M, Muramoto T, Nouchi R. Assessment of Educational Methods for Improving Children’s Awareness of Tsunamis and Other Natural Disasters: Focusing on Changes in Awareness and Regional Characteristics in Japan. Geosciences. 2018; 8(2):47. https://doi.org/10.3390/geosciences8020047
Chicago/Turabian StyleYasuda, Mari, Toshiaki Muramoto, and Rui Nouchi. 2018. "Assessment of Educational Methods for Improving Children’s Awareness of Tsunamis and Other Natural Disasters: Focusing on Changes in Awareness and Regional Characteristics in Japan" Geosciences 8, no. 2: 47. https://doi.org/10.3390/geosciences8020047
APA StyleYasuda, M., Muramoto, T., & Nouchi, R. (2018). Assessment of Educational Methods for Improving Children’s Awareness of Tsunamis and Other Natural Disasters: Focusing on Changes in Awareness and Regional Characteristics in Japan. Geosciences, 8(2), 47. https://doi.org/10.3390/geosciences8020047