Article

Time-Space Characterization of Wellbore-Cement Alteration by CO2-Rich Brine

Géosciences Montpellier, CNRS-Université de Montpellier, Place Eugène Bataillon, 34095 Montpellier, France
*
Author to whom correspondence should be addressed.
Geosciences 2018, 8(12), 490; https://doi.org/10.3390/geosciences8120490
Submission received: 26 September 2018 / Revised: 27 November 2018 / Accepted: 12 December 2018 / Published: 15 December 2018
(This article belongs to the Special Issue Geological Storage of Gases as a Tool for Energy Transition)

Abstract

:
The risk of CO2 leakage from damaged wellbore is identified as a critical issue for the feasibility and environmental acceptance of CO2 underground storage. For instance, Portland cement can be altered if flow of CO2-rich water occurs in hydraulic discontinuities such as cement-tubing or cement-caprock interfaces. In this case, the raw cement matrix is altered by diffusion of the solutes. This fact leads to the formation of distinctive alteration fronts indicating the dissolution of portlandite, the formation of a carbonate-rich layer and the decalcification of the calcium silicate hydrate, controlled by the interplay between the reaction kinetics, the diffusion-controlled renewing of the reactants and products, and the changes in the diffusion properties caused by the changes in porosity induced by the dissolution and precipitation mechanisms. In principle, these mass transfers can be easily simulated using diffusion-reaction numerical models. However, the large uncertainties of the parameters characterizing the reaction rates (mainly the kinetic and thermodynamic coefficients and the evolving reactive surface area) and of the porosity-dependent diffusion properties prevent making reliable predictions required for risk assessment. In this paper, we present the results of a set of experiments consisting in the alteration of a holed disk of class-G cement in contact with a CO2-rich brine at reservoir conditions (P = 12 MPa and T = 60 °C) for various durations. This new experimental protocol allows producing time-resolved data for both the spatially distributed mass transfers inside the cement body and the total mass transfers inferred from the boundary conditions mass balance. The experimental results are used to study the effect of the fluid salinity and the pCO2 on the overall reaction efficiency. Experiments at high salinity triggers more portlandite dissolution, thinner carbonate layers, and larger alteration areas than those at low salinity. These features are accompanied with different spatial distribution of the alteration layers resulting from a complex interplay between salinity-controlled dissolution and precipitation mechanisms. Conversely, the effect of the pCO2 is more intuitive: Increasing pCO2 results in increasing the overall alteration rate without modifying the relative distribution of the reaction fronts.

1. Introduction

Procedures for installing Portland-type cement annulus at depth profit from decades of experience in oil industry. Yet, it is still a challenging task due to the large variability of natural environments, the limited resolution of the techniques is usually used to evaluate the quality of the cement before exploitation and the problems associated to monitor possible changes of the cement properties during the exploitation of the well [1,2]. Fractures in the cement annulus may form during CO2 injection (in the injection well) as a result of pressure and thermal changes in conjunction with the local projection of the regional stress. Abandoned wells located within the zone of storage are also a potential source of leakage. Mechanical and chemical alteration of the cement annulus is recognized as one of the main potential source of confinement failure [3,4]. As such, evaluating the conditions and the characteristics of CO2-rich brine (or CO2-brine mixtures) leakages is a critical requirement for optimizing the security and the performance of the technology and also encourage public acceptance. Leakages can occur at the caprock-cement interface, at the cement-casing interface, through the cement annulus itself or through the cement plug in the case of abandoned wells [5].
Some experimental results showed that the bulk permeability and diffusivity of cement samples in contact with CO2-rich brines usually decrease because of the carbonate mineral precipitation within the pore space [6,7,8]. For instance, the results presented by Cheshire et al. 2016 [9] regarding the response of wellbore cement to CO2 flooding for three decades suggest that cement becomes less permeable. Similar conclusions were formulated by Crow et al. 2009 [10] who concluded from downhole tests and laboratory measurements of cement cores extracted from CO2/EOR fields that the smallness of the fluid migration along the wellbore cements could be related to carbonation of the cement that ensure low permeability and tightness of the cement-casing and cement-formation interfaces.
Conversely, several studies based on batch and flow-through experiments showed that the Portland-type cements commonly employed in well completion operations (such as Class-G) react with carbonate-rich brines weakening the cement and altering its permeability [8,11,12,13,14,15,16]. Leaching and flow-through experiments, characterized by a strong renewing of the CO2-rich fluid, showed that the diffusion-driven interaction between carbonate-rich brines and the cement bearing components leads to a series of reaction fronts that divide the cement into distinctive zones [16,17,18]. From the cement-brine interface toward to the remaining unreacted cement the above-cited authors measured: (a) A silica-rich layer that is present when the renewing of the CO2-rich fluid in the fracture is high [15], (b) a calcite precipitation layer, and (c) a portlandite-depleted zone. Alteration experiments in closed reactor, using cement or cement-caprock composite samples, indicates that the carbonation process is the dominant factor that controls the cement alteration in terms of bulk permeability and diffusivity [7,19,20] and cement-claystone interface properties [21]. Nevertheless, the redistribution of the mineral species, which leads to increasing the material heterogeneity and decreasing the average elastic moduli, can favor the localization of mechanical strain and eventually further failures within the (thin) alteration zone [12,22].
The experimental results of the authors cited above suggest that the alteration of the cement depends strongly on the presence and the properties of pre-existing hydraulic discontinuities such as fractures. Portlant cement materials have a high capacity of buffering CO2-rich water (or brine) by forming calcite that tends to strengthen the sealing capacity of the cement. However, intense alteration of the cement that can endanger the sealing capacity of the system is expected when the system allows a strong renewing of the CO2-rich fluid. This behavior was precisely described by Abdoulghafour et al. 2016 [23] who performed experimental alteration of fractured cement cores. They observed that the precipitation of calcite tends to seal the cement permeability in low renewing zones (such as dead-ended fissures) controlled by diffusion, whereas strong alteration associated with a noticeable loss of mass and the development of preferential paths develop in the zones of intense renewing of the CO2-rich fluid (such as well-connected fractures).
One may consider that the alteration of the cement under geologic CO2 sequestration conditions is well described for laboratory time-scale. However, concerning the modeling, which is required for characterizing large time-scales relevant to CO2 storage (i.e., several tens of years at minimum), large uncertainties about the reaction rate parameters and the porosity-dependent diffusion properties make predictions questionable. For instance, Huet et al. 2010 [24] used a coupled transport-reaction solver to model the reaction fronts observed by Kutchko el al. 2007 [17] for a class-H cement in CO2-saturated water (pH ≈ 3.7), but they underlined the uncertainties on the porosity-diffusivity retroaction law. Abdoulghafour et al. 2016 [23] succeeded to model the alteration fronts of a fractured class-G cement core flooded by CO2-rich brine, using PHREEQ-C [25], however, it stresses the uncertainties on the kinetic and thermodynamic parameters. These two examples enlighten a more general issue linked to estimate the effective parameters (both physical and chemical) for such complex systems. This statement can be illustrated considering the difficulties associated to model a simple laboratory experiment consisting in injecting a CO2-rich solution through a fractured cement core such as that presented in this study and discussed in Abdoulghafour et al. 2016 [23]. Modeling this single experiment consists in tuning the set of parameters that allow reproducing the experimental data. The experimental results are usually (a) spatially distributed data such as the position of the fronts for a given time (usually obtained from postmortem analysis by ESEM), and/or (b) time-resolved data measured at the boundary condition of the experiment, such as ions concentration at the effluent of the fractured cement sample. These data are clearly insufficient for estimating the set of parameters ubiquitously for different reasons. Indeed, using a single map of the reaction front in the cement, measured, for instance, at the end of the experiment, does not give any information on the predictability of the defined parametric model. On the other hand, using effluent concentration time-resolved data triggers two main issues. First, the numerical model must be set for solving both the advection-diffusion problem into the fracture and the diffusion reaction problem in the cement body in order to quantify the effective (time-dependent) diffusion factor into the fracture and finally evaluate the mass fluxes at the cement-fracture interface. This involves complex simulations coupling a (Navier-)Stokes problem in the fracture and a diffusion reaction problem in the cement matrix. Second, this approach is impractical for parameterizing the macroscopic heuristic law required for modeling the change in the effective diffusivity from the (space-dependent) change in porosity caused by the mineral dissolution and precipitation mechanisms. For determining the parameters that control the dynamics of the alteration process, models must be calibrated such that they can reproduce the spatial distribution of the alteration layers at different times.
In this paper, a new experimental approach, that allows mapping the reaction fronts at different time of the evolving reaction, is presented. Ideally, this could be done by performing flow-through experiments coupled with recurrent acquisition of X-ray microtomography images such as that achieved by Noiriel et al. 2013 [26] for modeling alteration mechanisms of fractured limestone cores. However, using X-ray microtomography imaging technique for mapping reaction fronts in cement is impractical because of the tiny size of the front; the use of infra-micrometric resolution, and consequently, few millimeters sized samples should be required. A second issue is the poor performance of X-ray tomography to discriminate both the minerals involved in the cement reaction and the variable porosity. Accordingly, the methodology developed in this study is based on reproducing the same experiment several times increasing the duration of the experiment and then analyzing the altered sample. The experiments consist of injecting a carbonate-rich water into a holed class-G cement disc, such as reducing the dimensionality of the experiments in order to focus on the diffusion-reaction problem inside the cement while controlling the reactant renewing at the hole-cement interface. This configuration mimics the flow of CO2-rich water (or brine) through a hydraulic discontinuity, such as a fracture. The first objective of this communication is to demonstrate the ability of this experimental approach to quantify the dynamics of the alteration process. A second objective is to evaluate the variability of the cement alteration depending on the fluid composition. To this end, different sets of experiments were performed for studying the effect of fluid salinity and CO2 concentration on the overall reaction front spreading.

2. Materials and Methods

2.1. Preparation of the Cement Discs

Cement slurry samples were prepared by mixing a class-G Portland cement (Lafarge, Le Havre production unit, France) with fresh water using a standard water-to-cement ratio of 0.4. The resulting mixture was poured into a wood box (10 cm width × 10 cm length × 5 cm height), equipped with six vertical nylon threads symmetrically distributed and fixed inside the box in order to obtain a 500 µm-diameter hole in the hardened cement samples through which percolation fluid will be injected. After being cured for a period of one month, cylinders of 9 mm in diameter were cored in the solidified cement, placing the vertical nylon thread in the middle of the core for each of the samples. Each cylindrical cement sample was sawn in order to obtain cement discs of 9 mm in diameter and 5 mm in length. Thereafter, the nylon threads were removed. Finally, a silicon layer was added to both sides of the cement discs to avoid any reaction aside from the centered hole (Figure 1).
The composition of the cement before hydration was 64.77 wt.% CaO, 21.36 wt.% SiO2, 4.57 wt.% FeO, 3.56 wt.% Al2O3, 2.45 wt.% SO3, 0.84 wt.% MgO, 0.59 wt.% P2O5, and low concentration (<0.2 wt.%) of TiO2, Mn2O3, SrO, and H2O.

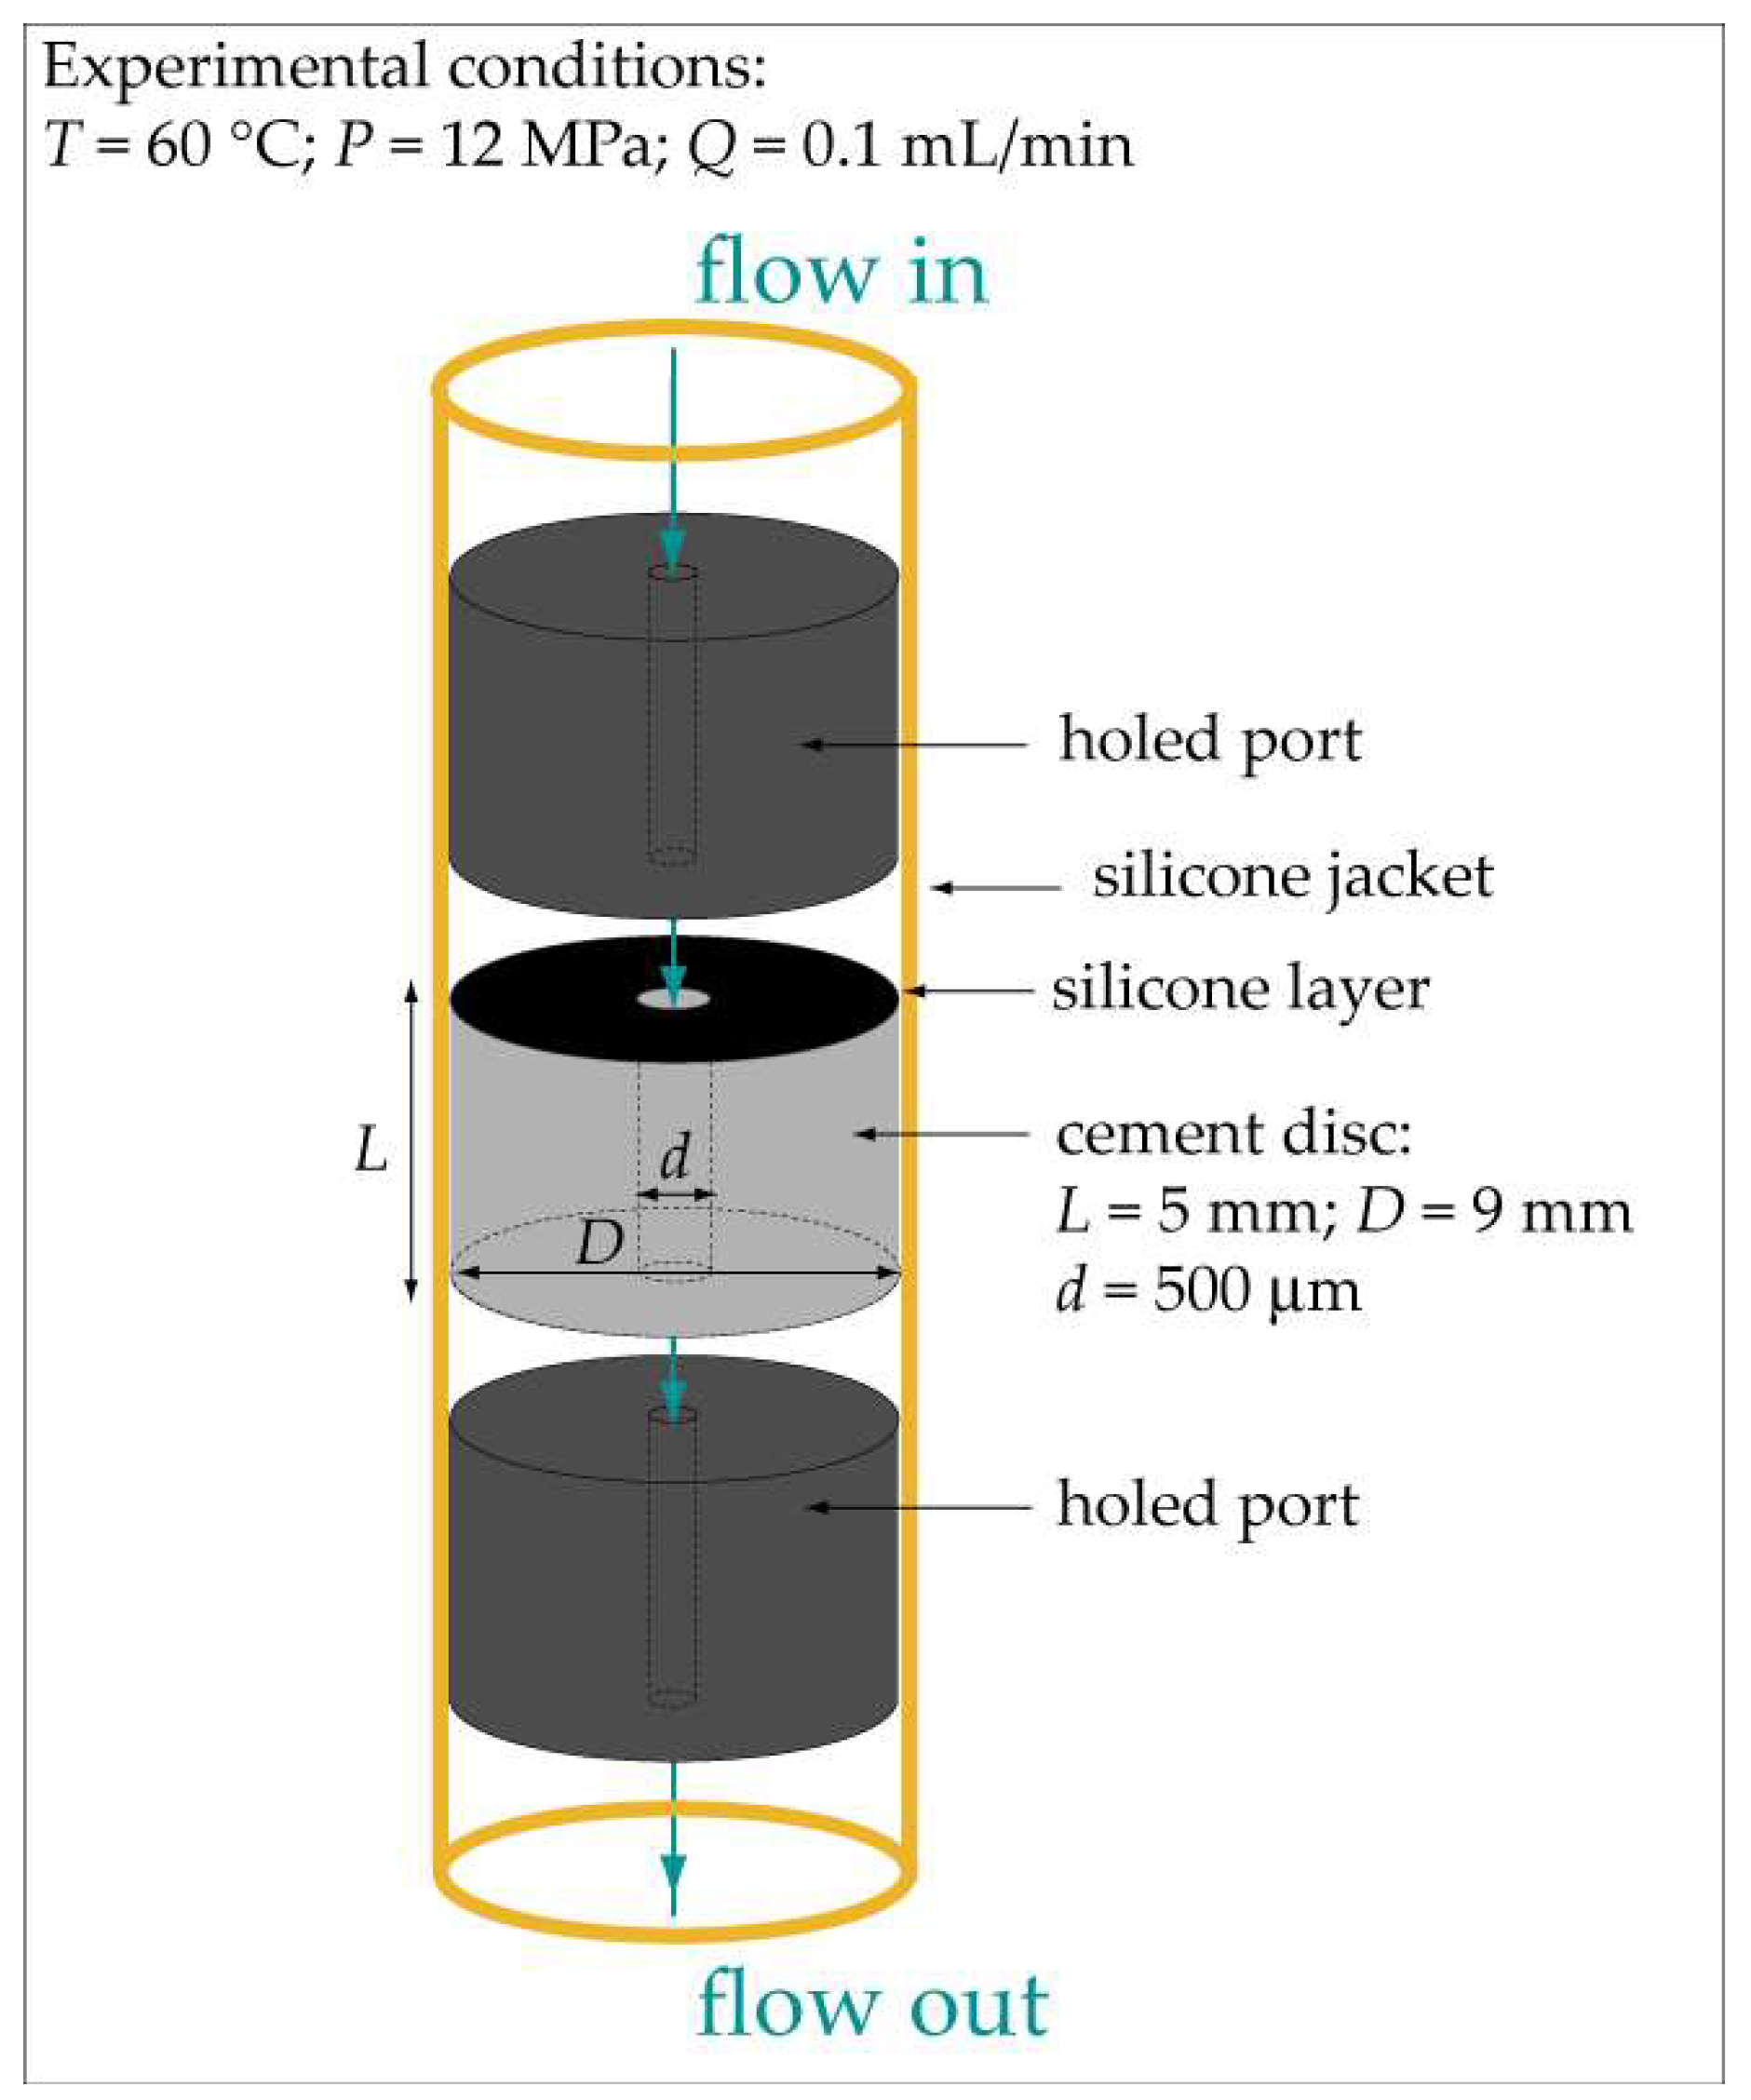
2.2. Experimental Equipment and Procedure

The experiments consisted of injecting a CO2-rich solution under a constant volumetric flow rate of 0.1 mL∙min−1 through the 500 µm-diameter hole placed at the center of a cement disc. The experiments were all performed at pressure (P) = 12 MPa and temperature (T) = 60 °C. The experimental setup used to run the experiments was the Icare Lab 1 flow-through system (Géosciences Montpellier, France), which is described in detail in [27]. Briefly, the CO2-rich solution, which is injected into the percolation cell at constant flow rate, is obtained by mixing at P = 120 bar and room T the CO2-free solution, pumped by a motorized dual-piston pump, with liquid CO2, pumped by a motorized piston pump (cooled at T = 5 °C and P = 120 bar). Once the mixture is done, the resulting CO2-rich fluid is heated up to T = 60 °C. The CO2 concentration of the CO2-rich solution is controlled by fixing the flow rates of the CO2 pump and the CO2-free solution pump. Radial confining pressure (112 % of the inlet pressure) was applied to the silicon jacket that covered the cement sample and the two holed titanium ports that sandwiched the cement sample in the percolation cell (Figure 1).
Two sets of experiments were performed. For the first set, the salinity of the CO2-rich injected solution was set to 0.5, 10, and 30 g∙L−1 of NaCl in order to assess the effect of the ionic strength on the reaction process, while partial pressure of CO2 (pCO2) was set to 3.3 MPa. Experiments lasted from 15 h to 127 h, setting a time increase between two experiments of around 30 h (Δt = 30 h). A second set of experiments was run to evaluate the influence of the CO2 concentration on the reactivity of the cement bearing minerals. For these experiments, the salinity of the injected solution was equal to the highest salinity used in the first set of experiments, i.e., 30 g∙L−1 of NaCl, and the pCO2 was diminished to 1.8 MPa (from the 3.3 MPa used for the first set). The different parameters used in the experiments are given in Table 1. Each experiment was named using the salinity value of the inlet fluid and the duration of the experiment. For instance, experiment cp0.5-t2 corresponds to an experiment that lasted for the hours corresponding to the second time duration (t2) and used a salinity value of 0.5 g∙L−1 of NaCl and a pCO2 of 3.3 MPa. For experiments using the low pCO2 value, the label LC (meaning low-carbon) was added to the label of the experiment (Table 1).
For the first set of experiments, three different input solutions were used. The three CO2-free solutions were amorphous silica (chalcedony) and carbonate equilibrated solutions (pH ≈ 7.6–8 ± 0.1) at reservoir conditions (P = 12 MPa and T = 60 °C), with different salinities of 0.5, 10, and 30 g∙L−1 of NaCl corresponding to ionic strength (I) values of 0.01, 0.18, and 0.53, respectively (Table 2). Solutions were prepared by adding appropriate amounts of reagents NaCl, CaCO3, MgCl2∙6H2O, and NaHCO3 to Mont Roucous water (bottle drinking water of composition: 3.1 ppm of Na+, 2.4 ppm of Ca2+, 0.5 ppm of Mg2+, 0.4 ppm of K+, 3.0 ppm of Cl, 2.0 ppm of SO42−, 3.0 ppm of NO3−, 6.3 ppm of HCO3, and 8.2 ppm of silica). Then, the CO2-free solutions were mixed with pure CO2 in the experimental bench in order to reach a CO2 concentration of 4.41 × 10⁻¹ mol∙L−1 (pCO2 of 3.3 MPa). Relationship between CO2 partial pressure and aqueous CO2 concentration, as well as pH and saturation state of the CO2-rich solutions under the experimental conditions were calculated using PhreeqC [25] (Table 2). The portlandite (CH) and calcium silicate hydrate (CSH) equilibrium constants [28] were added to the PhreeqC database to calculate the corresponding saturation indexes.
For the second set of experiments, one unique input solution was used. The CO2-free solution was prepared by adding 30 g∙L−1 of NaCl and 5.9 × 10⁻² gr of CaCl2 to MilliQ water. Then, the CO2-free solution was mixed with pure CO2 in the experimental bench in order to reach a CO2 concentration of 2.33 × 10⁻¹ mol∙L−1 (pCO2 of 1.8 MPa) (Table 2).
Before the experiments, cement discs were saturated in cement-equilibrated water at alkaline pH (12.7 ± 0.1) and with the salinity corresponding to the injected water (i.e., 0.5, 10, or 30 g∙L−1 of NaCl). The cement-equilibrated water was prepared by mixing deionized water with the corresponding NaCl concentration, and an excess of crushed cement for two months, and filtering the resulting solution with a 0.2 µm pore size filter.
During the experiments output solutions were collected for chemical analysis of major ions (Ca, Si, Mg, Fe, Al, and Na) by means of inductively coupled plasma optical emission spectroscopy (ICP-OES) for experiments with input salinities equal to 0.5 and 10 g∙L−1 of NaCl, and by using ionic chromatography (IC) for experiments run with the greatest input salinity (30 g∙L−1 of NaCl). High salinity provoked notable ionization interferences in the ICP-OES measurements that prevented the use of this technique to analyze high salinity solutions. Validation tests using diluted solutions were performed to verify the correspondence between ICP-OES and IC results. The ICP-OES analysis was performed using a Thermo iCap 7400 duo torch spectrometer, and the IC analysis was completed using a Dionex ICS-1000 chromatograph. Chemical analysis of the output solution enabled us to build reaction product breakthrough curves as a function of the elapsed time. The error ε(ΔCj) in the change of concentration of element j (∆Cj = Cj(out)Cj(in)) was estimated using the Gaussian error propagation method [29], taking into account that the analytical error was 2%.
Reacted samples were cut in two halves through a section perpendicular to flow located at 2.5 mm from the inlet. Thereafter, a polishing of the upper fragment was made to map structural and chemical changes in the reacted sample by means of environmental scanning electron microscope provisioned with an energy dispersive X-ray spectroscopy detector (ESEM-EDS; FEI Quanta 200 FEG instrument).

3. Results

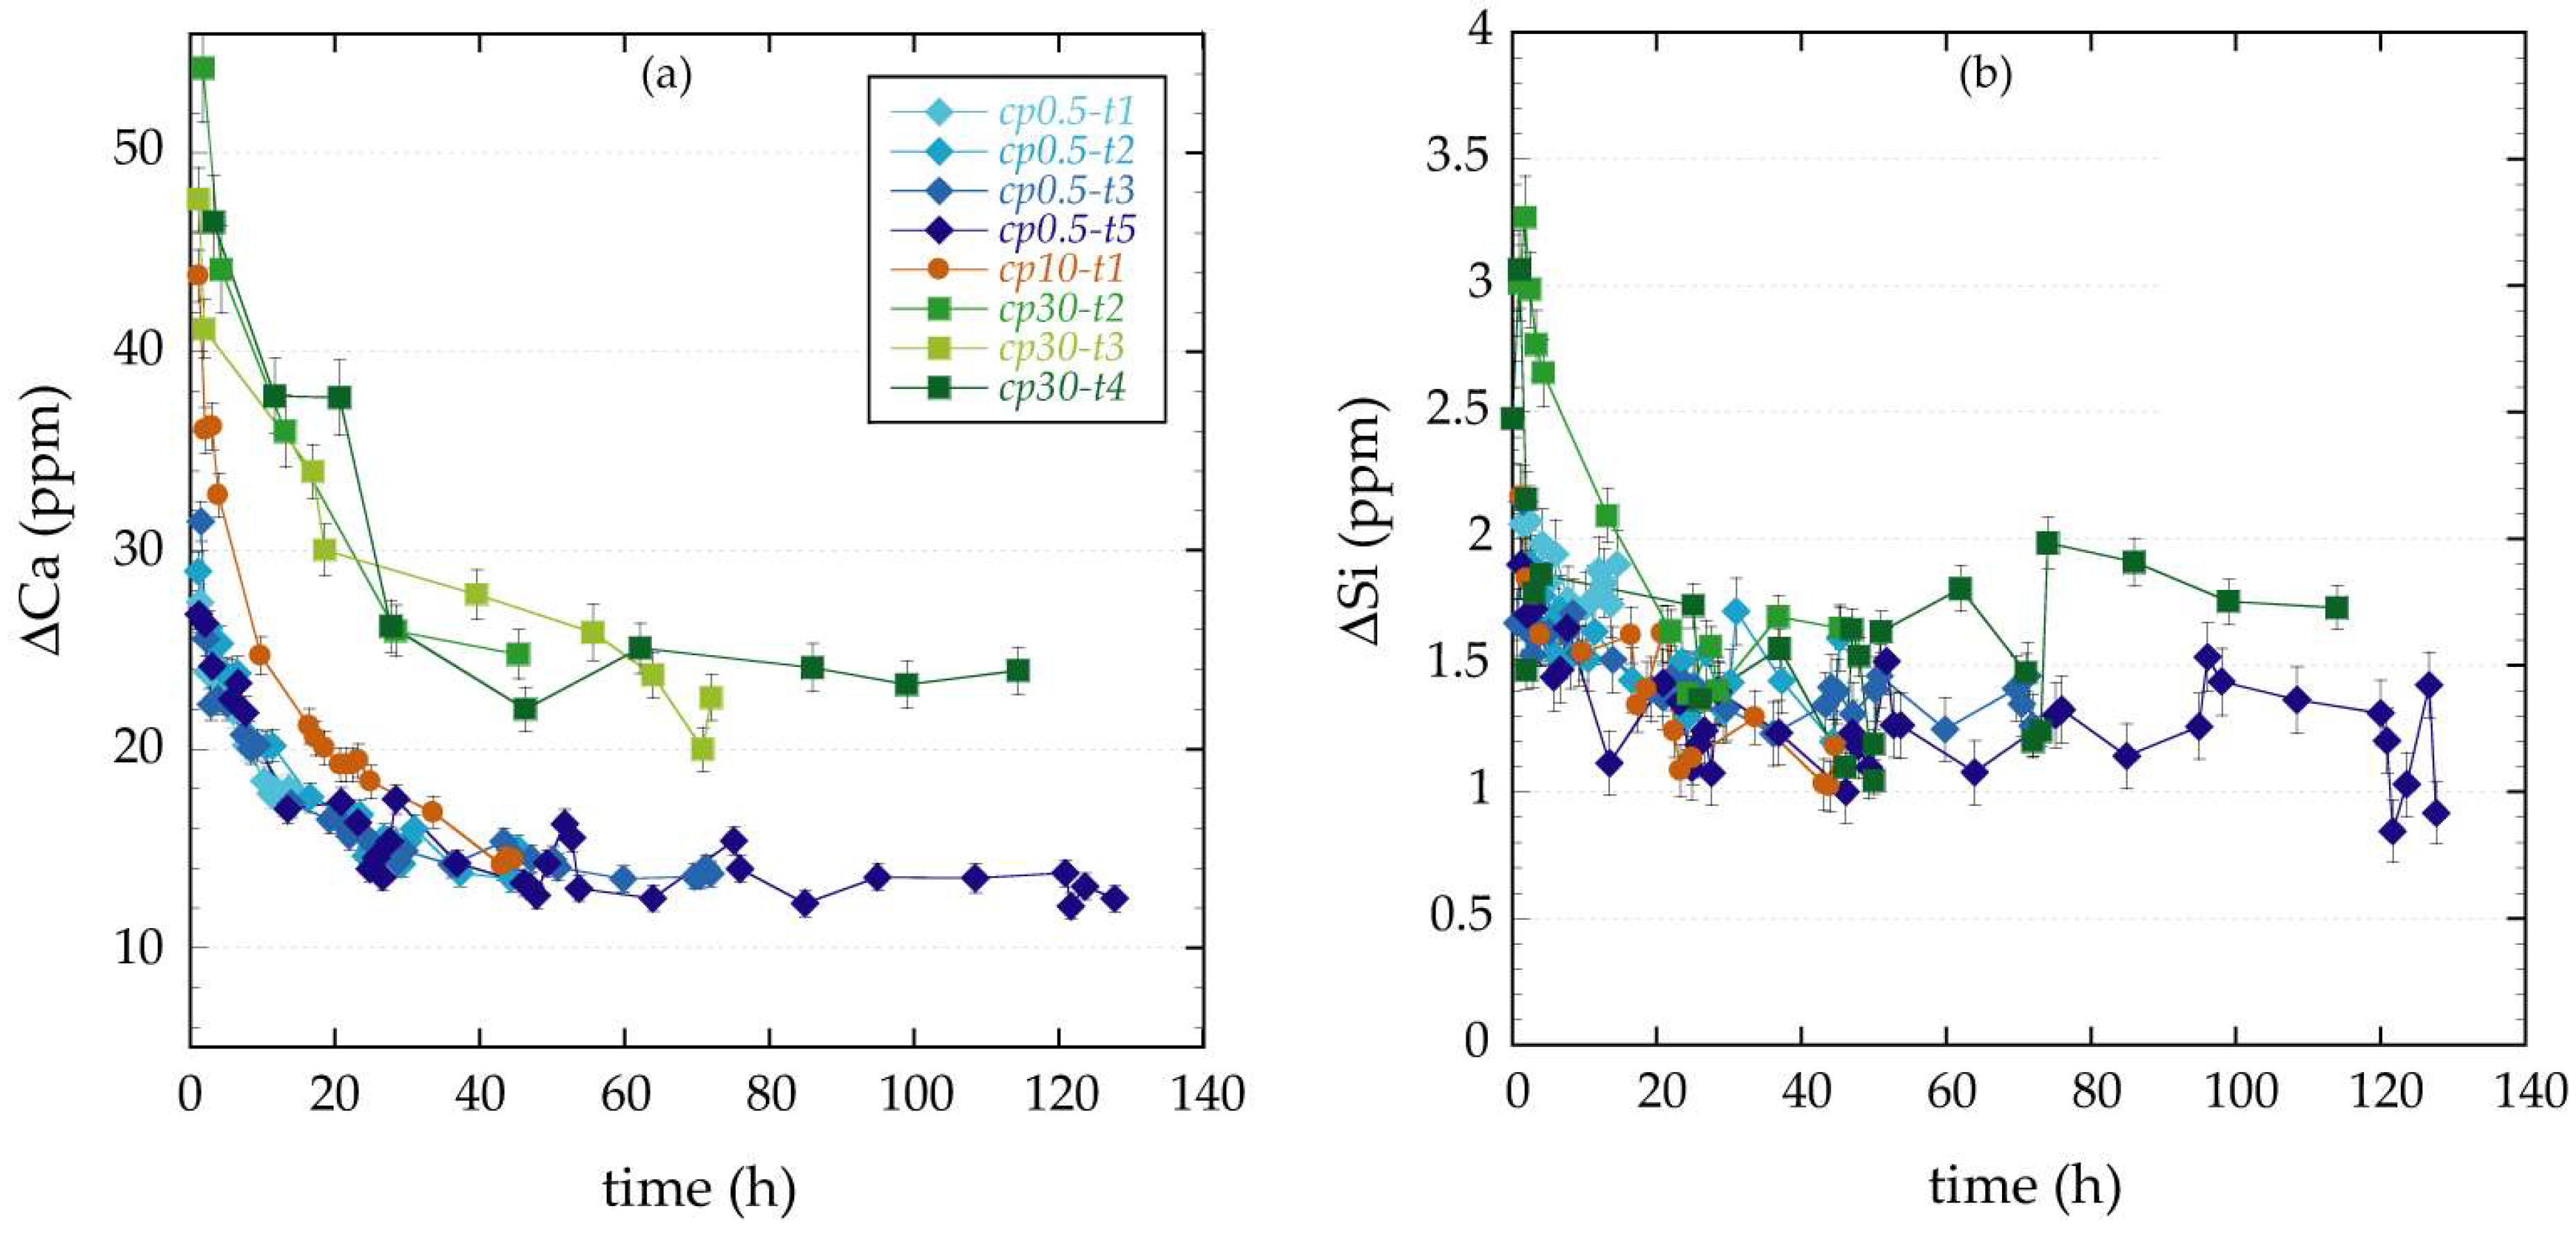
3.1. Changes in Fluid Chemistry

Figure 2 displays the variation in Ca and Si concentration over elapsed time for the first set of experiments except for experiments cp0.5-t4 and cp30-t1 because the corresponding chemical analyses were unreliable due to technical problems. The output Ca and Si concentration values are always higher than the input ones (ΔCa > 0 and ΔSi > 0) for all the experiments; ΔCa values being about one order of magnitude higher than ΔSi values. The Ca released is very high at the early stage followed by a gradual decrease in concentration up to t = 40 h. For t > 40 h, ΔCa reaches steady state at a value 14 ppm for experiments at low salinity (0.5 g∙L−1 of NaCl) and at a value of 25 ppm for experiments at high salinity (30 g∙L−1 of NaCl) (Figure 2a). The concentration of Si released shows little variation with time in most of the experiments except for the first 5 h of experiment where slightly higher Si concentrations were observed (Figure 2b). The ΔSi versus t curves display similar between experiments performed at different salinity.
The Mg released follows the same trend as the Ca released; ΔMg is always positive (ΔMg > 0) and it decreases progressively during the first 40 h up to reach steady state at a value of 0.15 ppm. The existence of equivalent Ca and Mg breakthrough curves suggested that Mg substituted Ca in the non-reacted cement matrix. ΔFe is small and constant; ΔFe ≈ 0.1 ppm. For aluminum, the values of ΔAl are always below the detection limit (i.e., lower than 0.01 ppm).
Figure 2 allows inferring the good reproducibility of the experiment, particularly at low salinity owing to the less important associated analytical error.
The two main hydration products forming the cement samples are calcium hydroxide (Ca(OH)2) or portlandite (CH) and calcium-silicate-hydrate (CSH). Ca(OH)2 is a crystalline material and represents roughly 15% to 20% of the hydrated cement. CSH is a semi-amorphous (micro-crystalline) material that comprises approximately 70% of the hydrated cement and it is the principal binding material [14]. CSH is characterized by a variable composition (wide range of Ca/Si ratios) and a marked incongruent solubility behavior. The Ca/Si ratio of CSH from fresh hydrated Portland cement is about 1.8 [30,31]. Degradation tends to lower the Ca/Si ratio, due to incongruent dissolution (preferential release of Ca compared to Si) [32].
The first step of the cement degradation mechanism by the acidic CO2-rich solution is the dissolution of the cement bearing phases, especially the portlandite (CH). Note that portlandite dissolves much faster than CSH, given that the portlandite dissolution rate is four orders of magnitude greater than CSH dissolution rate [33,34]. The dissolution of portlandite consumes H+ (pH raises) and produces free Ca2+ ions. The remaining material is the CSH fraction of the cement, which displays high porosity. The calcium released from dissolution will react with the carbonate ions present in the CO2-rich solution to form calcite (CAL) that occupies a fraction of the high porosity of the CSH. As the process evolves, the pH profile changes and the side of the calcite layer exposed to the low pH is dissolved. This fact leads to the removal of a large amount of calcium from the altered zone of the cement sample and to the formation of a high porosity and thus high diffusivity, and layer of CSH which is directly exposed to the incoming (low pH) fluid. This layer is rapidly converted into amorphous silica gel following an incongruent dissolution process.
The Ca and Si mass balance equations corresponding to the reactions discussed above are:
C a o u t C a i n = C a d i s s C H + C a d i s s C S H C a p p t C A L + C a d i s s C A L
S i o u t S i i n = S i d i s s C S H
where Cadiss-CH and Cadiss-CSH are the amount of Ca added to the solution from CH and CSH dissolution, respectively, Cadiss-CAL is the amount of Ca released from the dissolution of neo-formed calcite, Cappt-CAL is the amount of Ca consumed due to calcite precipitation, and Sidiss-CSH is the amount of Si added to the solution due to CSH incongruent dissolution.
Based on the Ca mass balance equation, positive ΔCa values obtained from chemical analysis (Figure 2a) denotes that the dissolution processes were dominant. Increasing the salinity of the input solution the amount of Ca released increased (Figure 2a; when steady state was reached, the Ca released increased from 14 to 25 ppm when salinity was increased from 0.5 to 30 g∙L−1 of NaCl), indicating either more dissolution and/or less precipitation of the minerals involved. The simple mass balance equation for Si indicates that the measured positive values of ΔSi obtained from chemical analysis (Figure 2b) come from CSH dissolution, which is scarcely affected by the salinity of the input water.

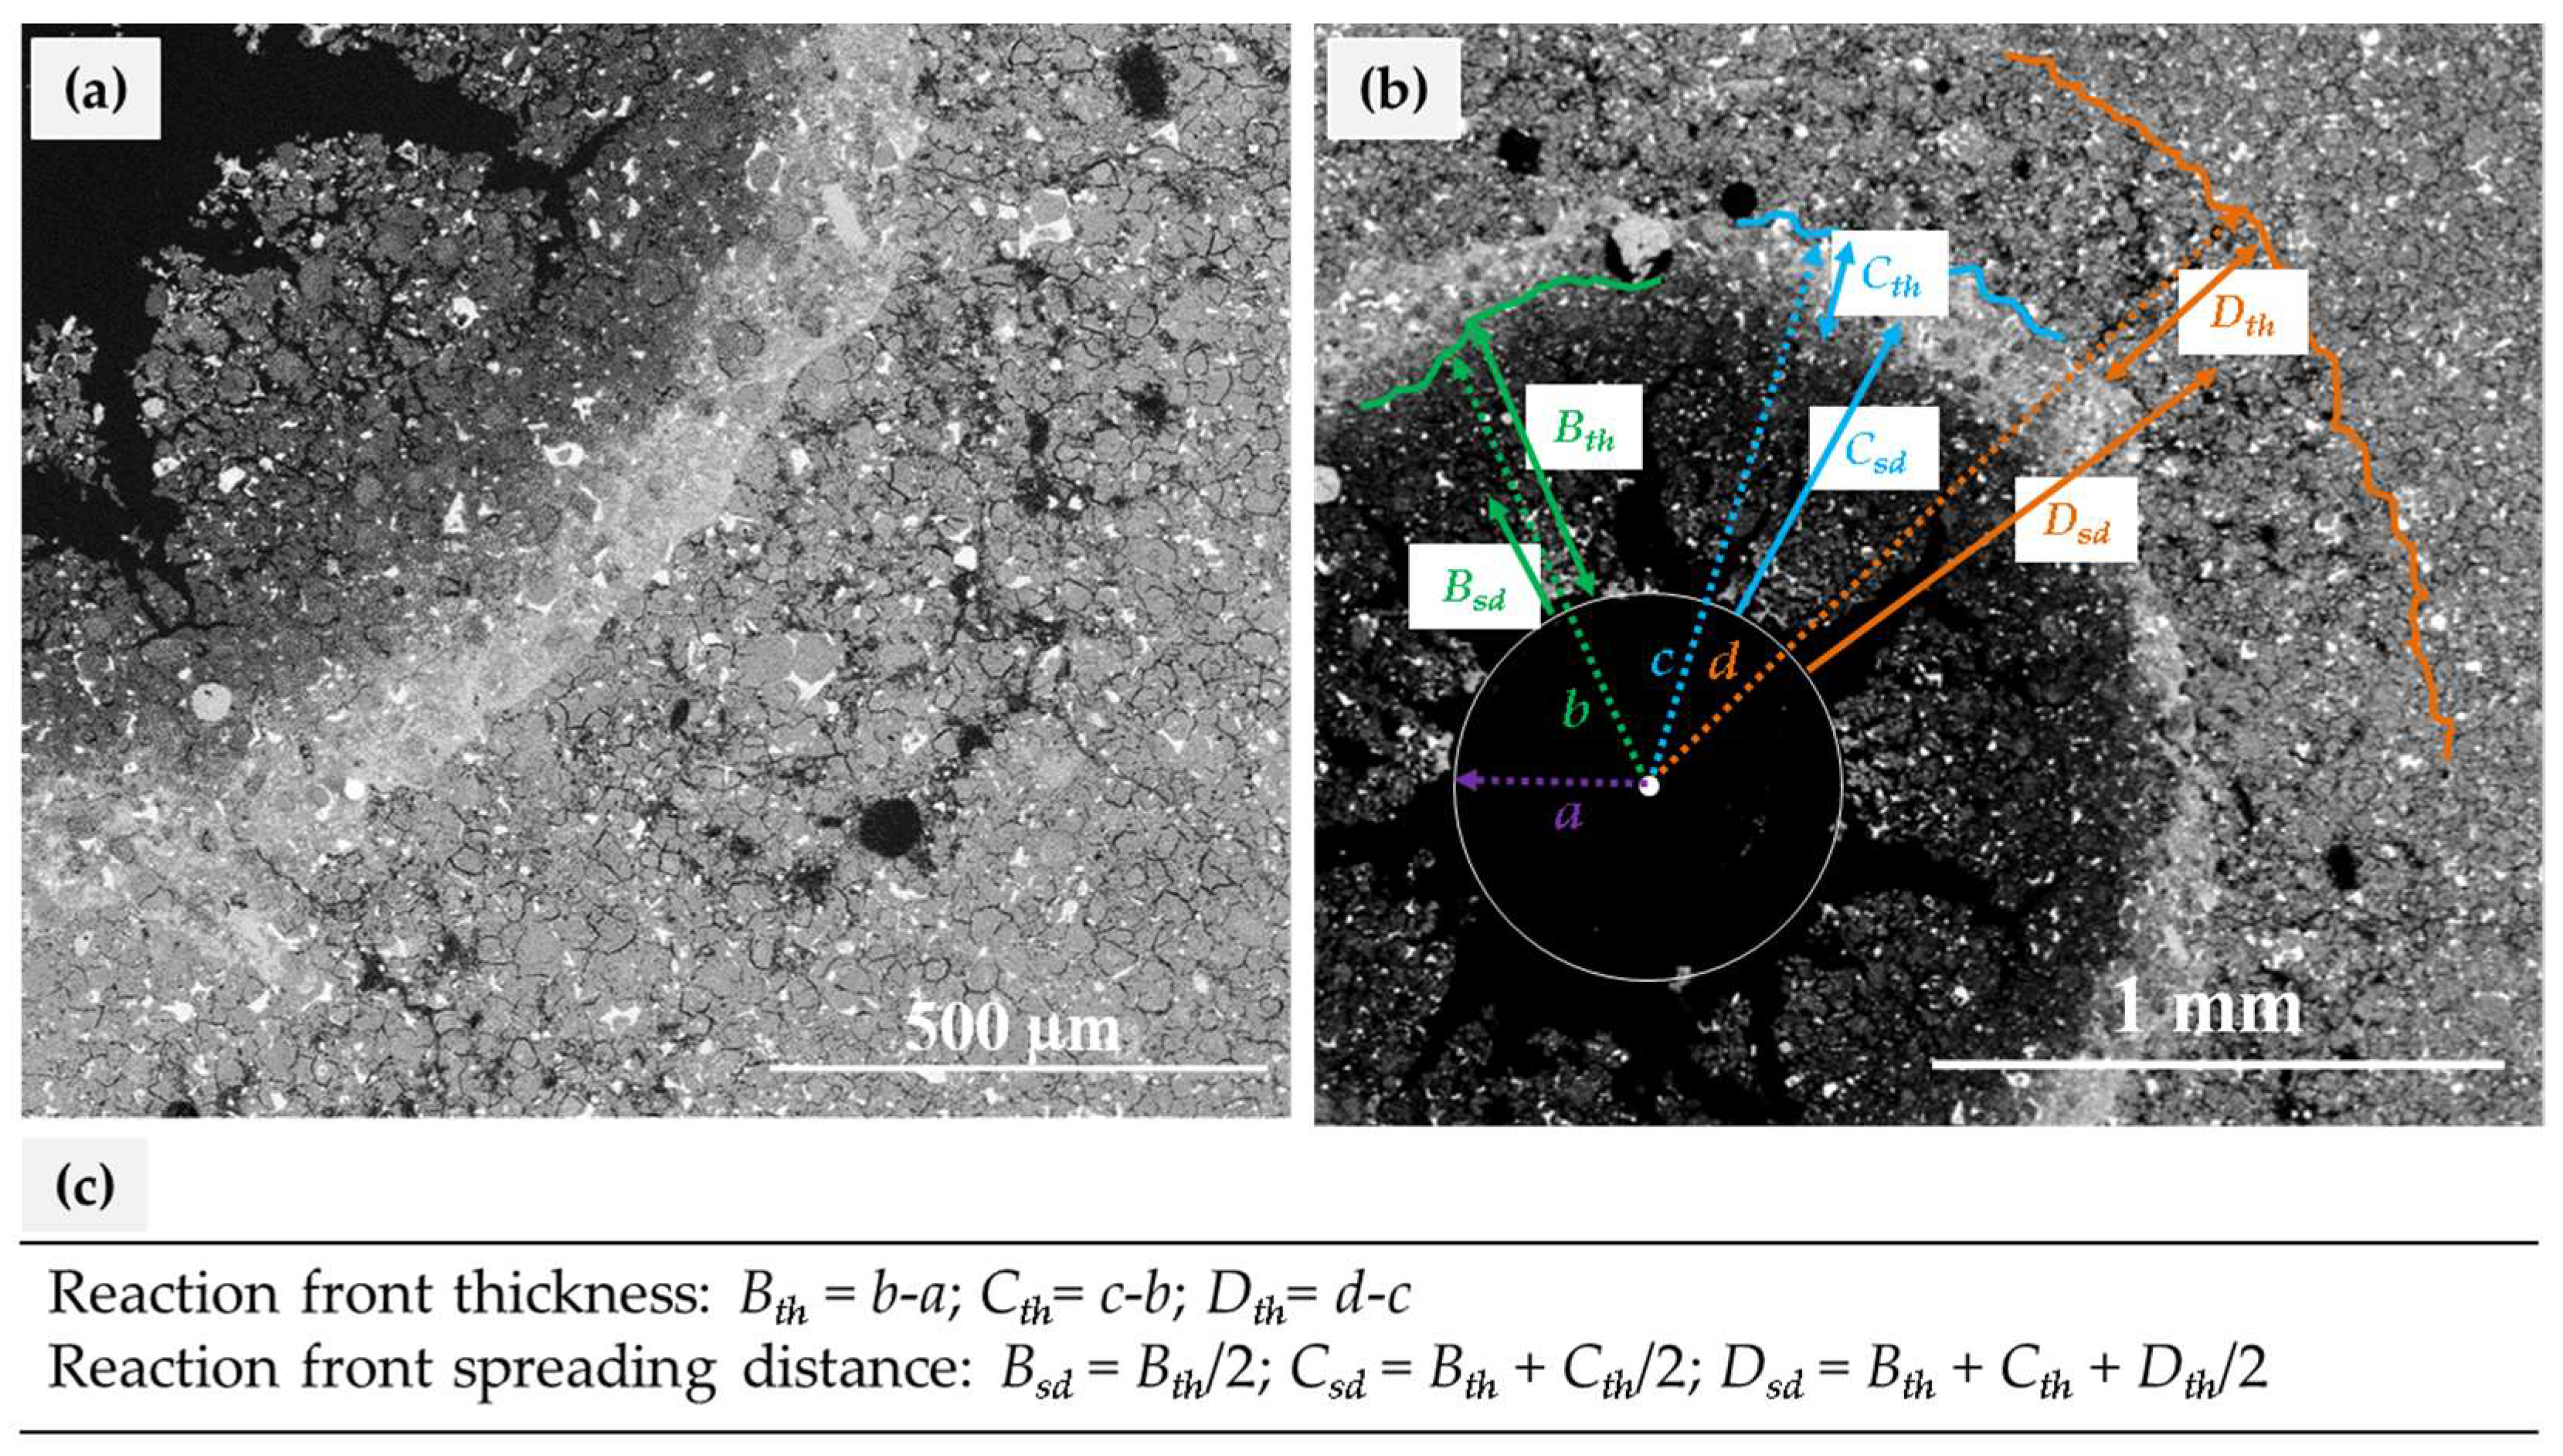
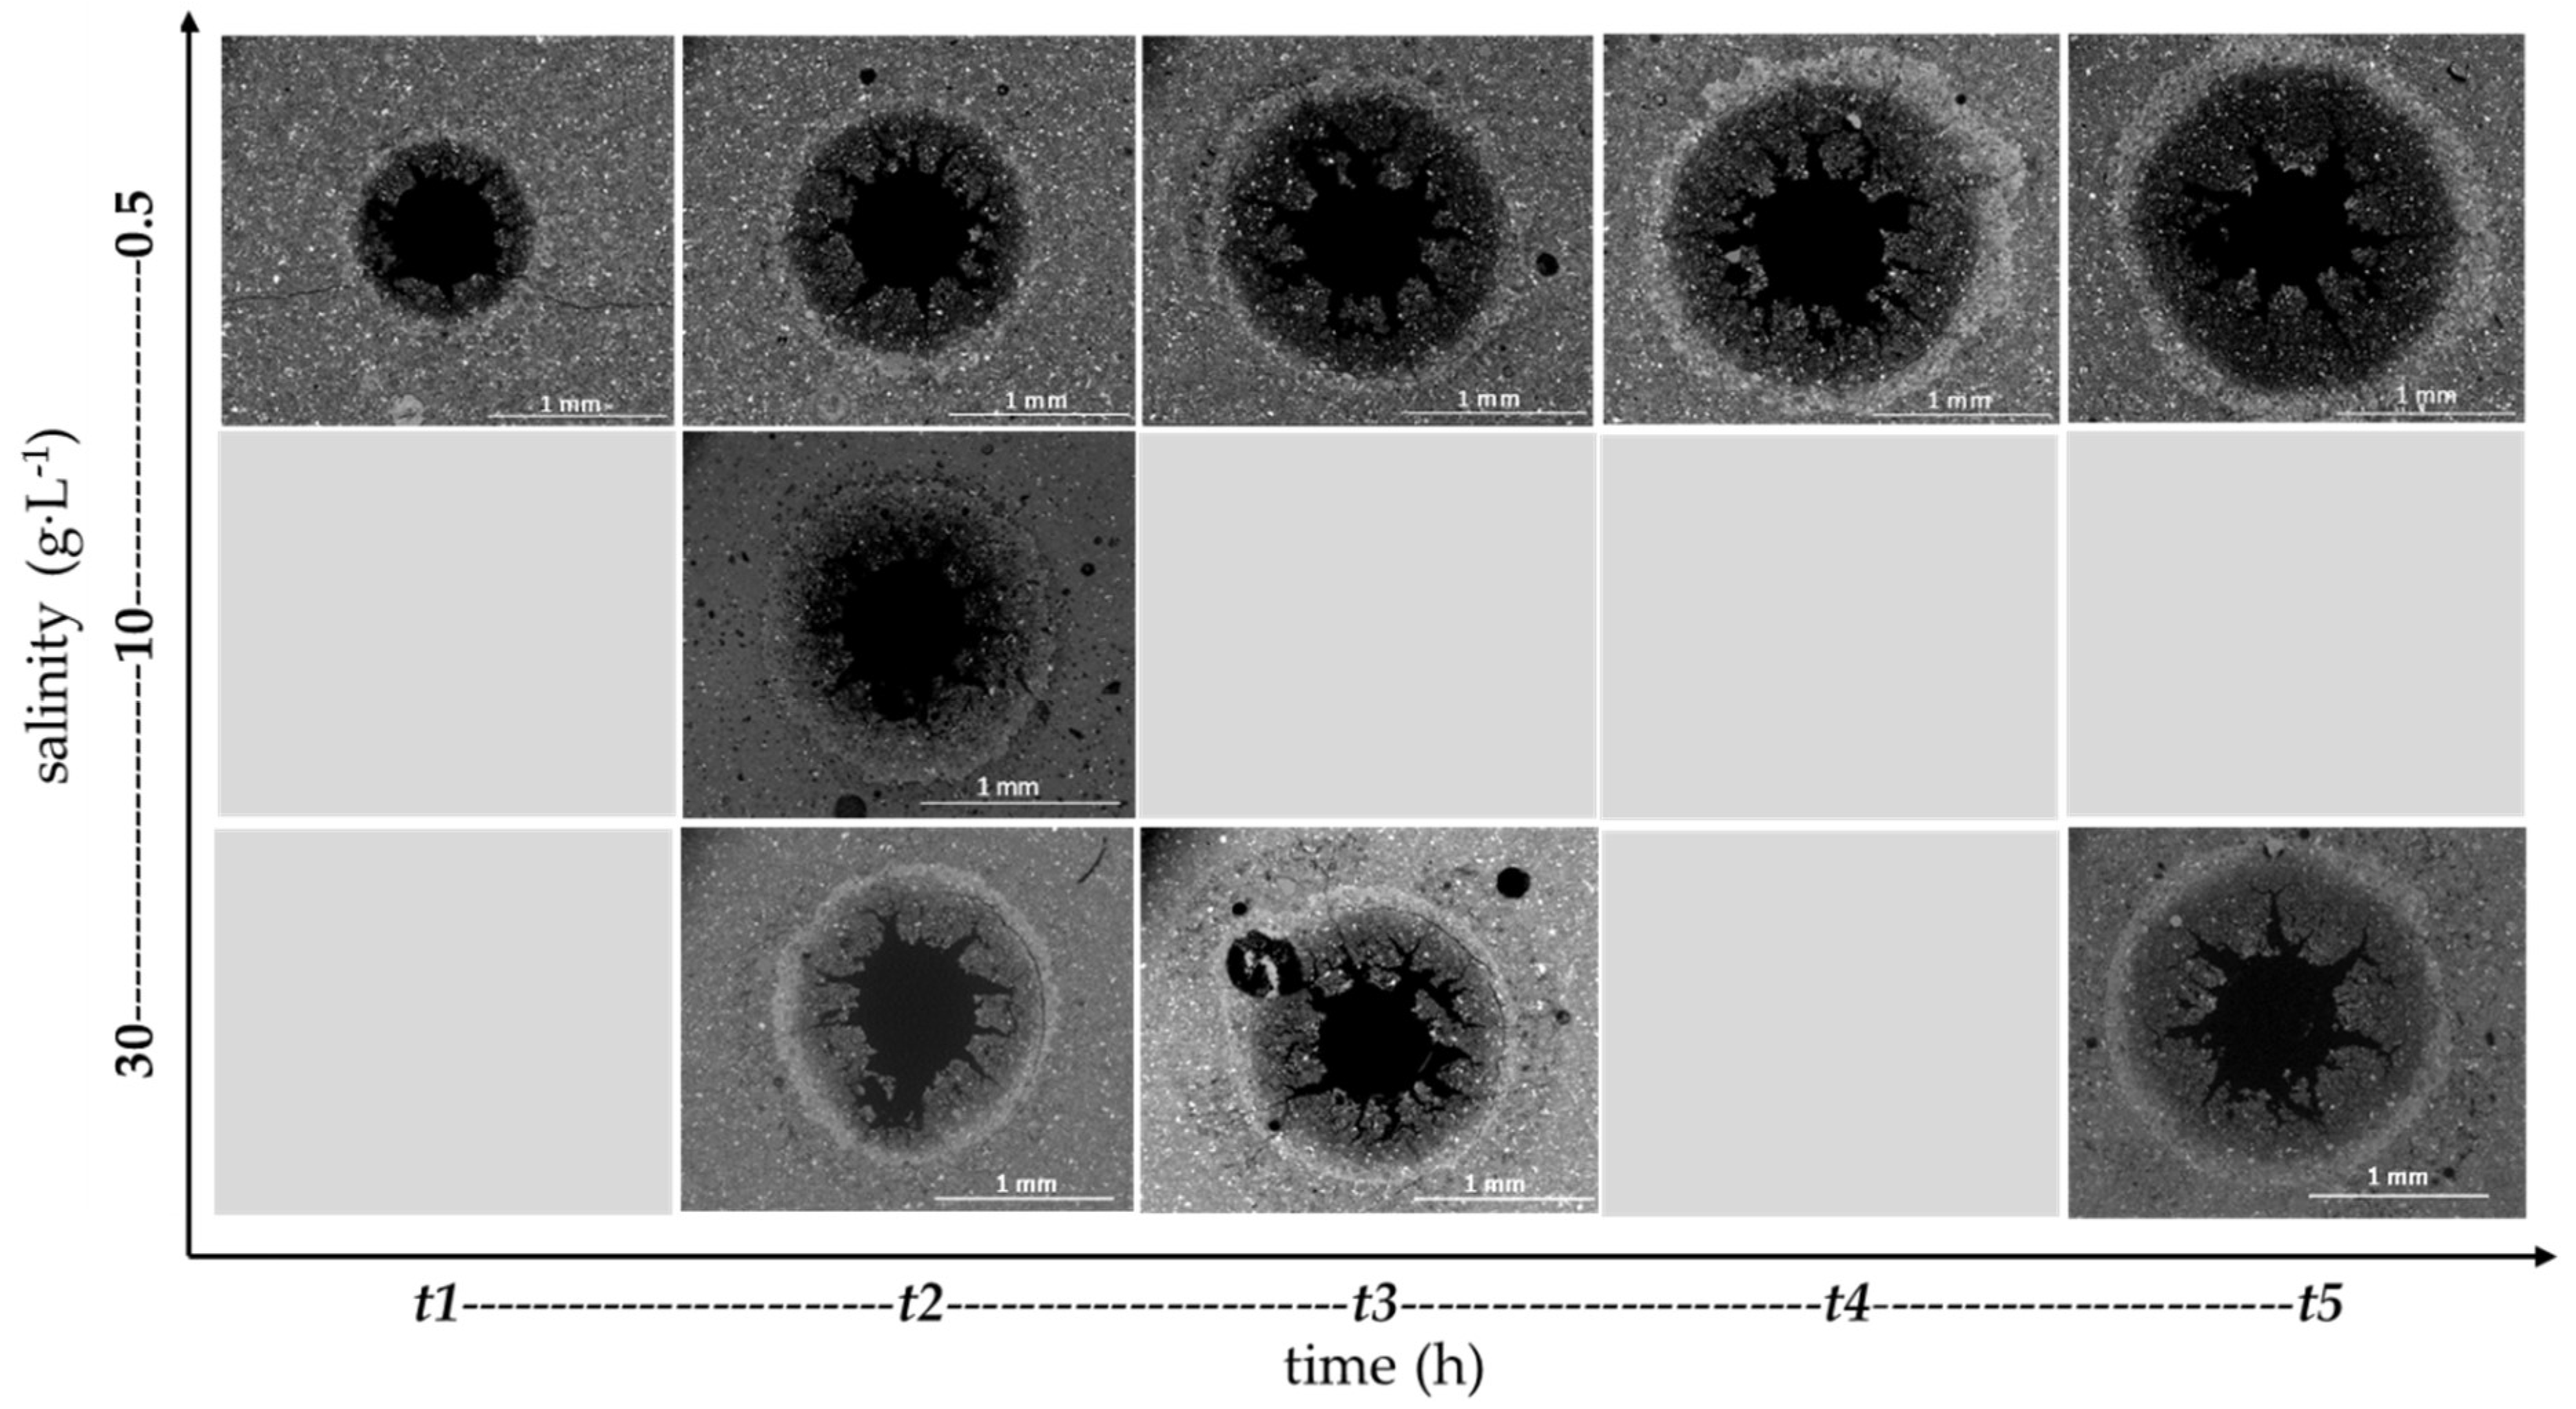
3.2. Characterization of Cement Alteration

The combination of the chemical reactions triggers the development of different alteration layers in the reacted cement samples (Figure 3a). ESEM images and chemical profiles (EDS) allow identifying and mapping these layers and the associated reaction fronts that are similar to those previously observed by other authors (e.g., [23,35]). Starting from the centered hole that corresponds to the boundary condition in terms of reactant renewing, the first alteration layer developed (noted as B) is a high porosity silica-rich layer very poor in Ca content. This layer displays cracks, perpendicular to the flow direction, that are formed by dehydration during the drying of the sample after being removed from the experimental confinement cell. These desiccation features highlight the high water content (high porosity) of the silica-rich layer. This layer is formed from the acid alteration of the CSH. The next alteration layer (notes as C) is a Ca and C rich layer with low porosity compared to the initial porosity of the unreacted cement. This layer denotes the extension of the neo-formed calcite that precipitates due to the Ca released by the CH and CSH dissolution and the carbonate from the CO2-rich solution. The last alteration layer (noted as D) denotes the portlandite-depleted layer and is characterized by an intermediate Ca content. Its porosity is higher than the porosity of the unreacted cement and the calcite layer but lower than the porosity of the amorphous silica-rich layer.
ESEM images allow accurately measuring the reaction front location. Figure 3b shows the calculated thickness (Bth, Cth, and Dth) and spreading distances (Bsd, Csd, and Dsd) of the different reaction fronts. The spreading distance of each front is considered to be the length between the hole-B layer interface and the middle of the corresponding layer. Figure 3c displays the equations used to calculate the reaction front thickness and spreading distance. Values of a, b, c, and d are the average of four measurements performed to each quarter of the sample.
The analysis of the ESEM images enables identifying dissolution/precipitation patterns that evolved differently depending on the experimental conditions. Table 3 shows the thickness and the spreading distance of the reaction layers developed for both sets of experiments. Figure 4 shows the ESEM images of the reacted cement samples for the first set of experiments (experiments performed for three different salinity values). The evolution of the reaction fronts as a function of time (from left to right) and salinity content (from top to bottom) is displayed in the figure. The main visual difference between the reacted cement samples is the presence of the alteration layer D, i.e., the portlandite-depleted layer which is well developed for the highest salinity experiments (30 g∙L−1 of NaCl), whereas it is barely visible for the experiment performed at intermediate salinity (10 g∙L−1 of NaCl), but undetectable for the experiments at low salinity (0.5 g∙L−1 of NaCl) (Figure 4). Another difference in the alteration of cement depending on the salinity content that can be inferred from the ESEM images is the width of the calcite layer (layer C); this layer is wider for the experiments performed at low salinity (0.5 g∙L−1 of NaCl) than for those run at high salinity (30 g∙L−1 of NaCl).
Figure 5 compares the cement alteration after ≈ 70 h for two experiments performed at different CO2 concentrations (comparison of experiments cp30-t3 and cp30LC-t3). The three alteration layers are visible in both cases, but larger thickness of the layers is obtained for experiments at high CO2 concentration.

4. Discussion

The chemical analysis of the output solutions and the reaction front characterization obtained by means of the ESEM measurements were both used to evaluate the effect of the ionic strength and the CO2 concentration on the degradation of the cement bearing phases. Figure 6 compares the reaction front spreading distances and the thickness of the fronts for experiments performed at different salinity (Figure 6a) and CO2 concentration (Figure 6b). In order to easily compare the different degree of cement alteration obtained, in the experiments, a schematic view of the reaction front distribution is presented on the right side of Figure 6.
The effect of the ionic strength on the cement degradation was evaluated by comparing the experimental results of the first set of experiments (different salinity). Chemical results showed that the amount of Ca released was higher for experiments run at high salinity than for those performed at low salinity (Figure 2a). The higher Ca released can result from either more active dissolution of the cement bearing phases, more dissolution of the neo-formed calcite or less precipitation of calcite (based on Ca mass balance equation). The latter hypothesis was discarded because it contradicts the results obtained by several authors that reported that calcite precipitation rate increases with increasing the ionic strength (e.g., [36,37]). The effect of the ionic strength on the dissolution rate of the cement bearing phases (CH and CSH) has been scarcely studied. Galan et al., 2011 [38] is one of the few studies that evaluate the effect of the ionic strength on CH dissolution. The authors reported that an increase in ionic strength promotes CH dissolution. Accordingly, this could be a plausible explanation for the experimental results obtained in this study; the higher the salinity the greater the measured Ca released. Regarding CSH dissolution, the similar changes in the Si concentration obtained for the experiments performed at different salinity (Figure 2b) indicate that CSH dissolution is not measurably affected by the ionic strength. The increase of CH dissolution at high salinity can also be noticed in the ESEM images; the CH dissolution layer D (i.e., the CH-depleted layer) can only be observed for high salinity experiments whereas it is overlapped by the calcite layer for the low salinity experiments (see scheme in Figure 6a). Thus, it can be postulated that, for a given experience duration, the CH-depleted layer is located at a larger distance from the hole at high salinity compared to that observed at low salinity.
While calcite precipitation rate is expected to be higher under high salinity conditions, ESEM images of the reacted cement samples showed wider calcite layers for the experiments performed at low salinity, suggesting a higher volume of precipitated calcite (Figure 4).
As mentioned above, the calcite layer observed at a given elapsed time is the result of the concurrent (a) precipitation of calcite, at the foremost of the layer, from the Ca released by the CH dissolution and the carbonate from the CO2-rich brine in circumneutral pH conditions, and (b) re-dissolution of this calcite at the hindmost of the layer were pH is low. Thus, the apparent inconsistency between the amount of precipitated calcite and the salinity condition results from the position of the calcite layer that is constrained by the distance of the CH-depleted layer from the hole and the CH dissolution rate. At high salinity, the CH-depleted layer (D layer) is far away from the calcite layer (C layer) (see scheme in Figure 6a), and thus the acid solution, diffusing from the hole, is not pH-buffered by the CH dissolution at the location of the calcite layer and the dissolution of the neo-formed calcite is more efficient. In other words, although the precipitation and the dissolution of the neo-formed calcite are both supposedly more effective at high salinity, the dissolution reaction controls the effective volume of calcite in place at a given elapsed time.
The experimental results of the first set of experiments show that the distance of altered cement for a given elapsed time was higher at high salinity than at low salinity. Indeed, after 127 h, the distance of altered cement for the experiment at high salinity (cp30-t4) is 1.04 mm (resulted from the addition of 0.51 (Bth) + 0.14 (Cth) + 0.39 (Dth)), whereas this distance for the experiment at low salinity (cp0.5-t5) is 0.76 mm (resulted from the addition of 0.58 (Bth) + 0.18 (Cth)). Thus, this fact indicates that the ionic strength can noticeably modify the spreading distance of the CH-depleted alteration layer; in fact, the calcite precipitation front (C) and the CH-depleted front (D) are superposed at low salinity while they are clearly juxtaposed at high salinity. However, the spreading distances of the alteration layers B and C are similar at different salinities. This issue should be considered when analyzing results of other studies related to cement alteration performed with low salinity solutions (e.g., [18]).
The effect of the CO2 concentration on the cement degradation was performed by comparing experiments at high salinity but different CO2 concentration (i.e., second set of experiments and experiments of the first set performed at high salinity). The relative distribution of the different altered layers was not deeply modified by the presence of higher CO2 concentration but differences related to the thickness of the layers were observed: (a) Experiments performed at high pCO2 developed wider silica-rich layers than experiments at low pCO2, and (b) the area of altered cement was larger in experiments at high pCO2 (higher reaction front spreading distances for experiments at high pCO2 than at low pCO2; Figure 6b). The results regarding the thickness of the fronts (Figure 6) indicate that the thickness of the calcite layer (C), which is the result of both precipitation and dissolution, increases less (with time) than the thickness of the other two fronts (B and D). It is worth noticing that the pH value for the high carbon solution (high pCO2) was slightly higher than that for the low carbon solution (see Table 2) given that bicarbonate was used to equilibrate the CO2-free solution with respect to calcite and dolomite only in the high pCO2 solution. However, higher reactivity and reaction front spreading distances were obtained at high pCO2 because the parameter that controls the reactivity is the CO2 concentration. The carbonic acid is a weak acid that acts as a buffer and dissociates gradually, thus maintaining the efficient reactivity (low pH) of the system during a long time.

5. Summary and Conclusions

This paper presents a new experimental methodology designed to produce time-resolved data for both the spatially distributed mass transfers inside the cement body and the exchanged mass at the boundary. As such, this experimental methodology allows for the producing of spatiotemporal quantification of the mass exchanges required for performing pertinent parameter estimation calculations and for deriving the effective kinetic coefficients needed for long-term predictive modeling.
The geometry of the experiment mimics the alteration expected in fractured cement or hydraulic discontinuities at the cement-casing interface which are, for instance, configurations that can lead to strong alteration of the cement associated with an increase of the effective hydraulic radius of the fracture [23].
The experiments focused on studying the effect of the brine salinity and the CO2 partial pressure on the cement degradation. The results emphasized that both the brine salinity and pCO2 are noticeably controlling the mass exchanges associated with the cement alteration and thus the alteration dynamics. High salinity triggers more portlandite dissolution, thinner carbonate layers, and larger alteration areas than those at low salinity. These features that are accompanied with different alteration patterns (different spatial distribution of the alteration layers) result from a complex interplay between dissolution and precipitation mechanisms. Conversely, the effect of the pCO2 is more intuitive: Increasing pCO2 results in increasing the overall alteration rate without modifying the relative distribution of the reaction fronts.
The experimental approach allows quantifying the velocity of the alteration front from the geometry of the alteration layers imaged at different elapsed times (Table 3).
The velocity values vc calculated for the calcite front (vc(t) = ∂Csd/∂t) for the different salinity and pCO2 experiments do not show any decrease with time, as it could be expected for a constant diffusion model. At the opposite, vc(t) is almost constant or displays a slight increase with time (Figure 6). This fact stresses the strong control of the increase of the effective diffusion caused by the increase of porosity associated with the overall leaching of the cement material despite the presence of the low diffusion calcite layer.
The overall alteration rate is mainly controlled by the rate of Portlandite dissolution that is quantifiable by the extension of the dissolution layer D. The dissolution of the Portlandite is strongly controlled by the effective diffusion of the entire alteration zone, which is given by the harmonic average of the product of the diffusion coefficient by the thickness of each of the alteration layers.
The calcite layer displays the lowest diffusion coefficient and thus should have a major impact on the harmonic average. However, the results indicate that the thickness of the calcite layer, which is the result of both precipitation and dissolution, increases less than the silica-rich layer (Figure 6). As a result, the contribution of the calcite layer decreases with time and the overall diffusivity of the altered zone does not change noticeably. This is a major result of this study and must be considered as an important issue when comparing dynamic experiments displaying high rate of renewing of the reactants with batch reactor experiments for which the precipitated carbonates are usually reported as the main cause of the decrease of the bulk cement diffusivity.
The non-decreasing nature of vc(t) suggests that the alteration features should continue for a long period of time and at a similar rate for such geometrical configuration. The results indicate that the velocity of the total alteration front ranges from about one to 1.5 mm per week depending on pCO2 and salinity values, which suggests the possibility of important loss of mass of years. Yet, it is worth noticing that the experiment is mimicking a two-dimensional problem, i.e. that the decrease of the reactivity (CO2 activity) along the length of a field-scale fracture is not directly quantified. Reliable extrapolations to real fracture geometries and long times require tridimensional numerical modeling. Nevertheless, it can be postulated that high reactivity along long distances can occur since (a) natural fractures can accommodate large flow rate caused by large pressure gradient between the reservoir and the overlying aquifers, and (b) the source of reactant in the case of leaky reservoir is potentially infinite.

Author Contributions

Conceptualization, P.G.; Data curation, M.G-R.; Formal analysis, M.G-R.; Methodology, M.G-R. and P.G.; Writing—original draft, M.G-R and P.G.; Writing—review & editing, P.G.

Funding

Funding to this work has come from CNRS-INSU.

Acknowledgments

Authors acknowledge Léa Causse and Frédéric Fernandez for the useful instructions provided for the development of the ICP-OES and ESEM-EDS analysis, respectively.

Conflicts of Interest

The authors declare no conflict of interest. The funders had no role in the design of the study; in the collection, analyses, or interpretation of data; in the writing of the manuscript, and in the decision to publish the results.

References

  1. Watson, T.L.; Bachu, S. Evaluation of the potential for gas and CO2 leakage along wellbores. SPE Drill. Complet. 2009, 24, 115–126. [Google Scholar] [CrossRef]
  2. Ravi, K.; Bosma, M.; Gastebled, O. Safe and economic gas wells through cement design for life of the well. Soc. Pet. Eng. 2002. [Google Scholar] [CrossRef]
  3. Shipton, Z.K.; Evans, J.P.; Dockrill, B.; Heath, J.; Williams, A.; Kirchner, D.; Kolesar, P.T. Natural leaking CO2-charged systems as analogs for failed geologic storage reservoirs. In Carbon Dioxide Capture for Storage in Deep Geological Formations—Results from CO2 Capture Project, 1st ed.; Thomas, D., Benson, S.M., Eds.; Elsevier Science: Berkeley, CA, USA, 2005; Volume 2, pp. 699–712. ISBN 9780080457482. [Google Scholar]
  4. Oldenburg, C.M.; Bryant, S.L.; Nicot, J.P. Certification framework based on effective trapping for geologic carbon sequestration. Int. J. Greenh. Gas Control 2009, 3, 444–457. [Google Scholar] [CrossRef] [Green Version]
  5. Celia, M.A.; Bachu, S.; Nordbotten, J.M.; Gasda, S.E.; Dahle, H.K. Quantitative Estimation of CO2 Leakage from Geological Storage: Analytical Models, Numerical Models, and Data Needs. In Greenhouse Gas Control Technologies, 1st ed.; Wilson, M., Rubin, E.S., Keith, D.W., Gilboy, C.F., Morris, T., Thambimuthu, K., Gale, J., Eds.; Elsevier Ltd.: Oxford, UK, 2005; Volume 1, pp. 663–671. ISBN 9780080539737. [Google Scholar]
  6. Carroll, S.; Carey, J.W.; Dzombak, D.; Huerta, N.J.; Li, L.; Richard, T.; Um, W.; Walsh, S.D.C.; Zhang, L. review: Role of chemistry, mechanics, and transport on well integrity in CO2 storage environments. Int. J. Greenh. Gas Control 2016, 49, 149–160. [Google Scholar] [CrossRef]
  7. Wigand, M.; Kaszuba, J.P.; Carey, J.W.; Hollis, W.K. Geochemical effects of CO2 sequestration on fractured wellbore cement at the cement/caprock interface. Chem. Geol. 2009, 265, 122–133. [Google Scholar] [CrossRef]
  8. Walsh, S.D.; Du Frane, W.L.; Mason, H.E.; Carroll, S.A. Permeability of wellbore-cement fractures following degradation by carbonate brine. Rock Mech. Rock Eng. 2013, 46, 455–464. [Google Scholar] [CrossRef]
  9. Cheshire, M.C.; Stack, A.G.; Carey, J.W.; Anovitz, L.M.; Prisk, T.R.; Ilavsky, J. Wellbore cement porosity evolution in response to mineral alteration during CO2 flooding. Environ. Sci. Technol. 2016, 51, 692–698. [Google Scholar] [CrossRef] [PubMed]
  10. Crow, W.; Williams, D.B.; Carey, J.W.; Celia, M.; Gasda, S. Wellbore integrity analysis of a natural CO2 producer. Energy Proc. 2009, 1, 3561–3569. [Google Scholar] [CrossRef]
  11. Carey, J.W.; Svec, R.; Grigg, R.; Lichtner, P.C.; Zhang, J.; Crow, W. Wellbore integrity and CO2-rich brine flow along the casing-cement microannulus. Energy Proc. 2009, 1, 3609–3615. [Google Scholar] [CrossRef]
  12. Mason, H.E.; Du Frane, W.L.; Walsh, S.D.; Dai, Z.; Charnvanichborikarn, S.; Carroll, S.A. Chemical and mechanical properties of wellbore cement altered by CO2-rich brine using a multianalytical approach. Environ. Sci. Technol. 2013, 47, 1745–1752. [Google Scholar] [CrossRef] [PubMed]
  13. Scherer, G.W.; Kutchko, B.; Thaulow, N.; Duguid, A.; Mook, B. Characterization of cement from a well at Teapot Dome Oil Field: Implications for geological sequestration. Int. J. Greenh. Gas Control 2011, 5, 115–124. [Google Scholar] [CrossRef]
  14. Kutchko, B.G.; Strazisar, B.R.; Lowry, G.V.; Dzombak, D.A.; Thaulow, N. Rate of CO2 attack on hydrated class H well cement under geologic sequestration conditions. Environ. Sci. Technol. 2008, 42, 6237–6242. [Google Scholar] [CrossRef] [PubMed]
  15. Abdoulghafour, H.; Luquot, L.; Gouze, P. Characterization of the mechanisms controlling the permeability changes of fractured cements flowed through by CO2-rich brine. Environ. Sci. Technol. 2013, 47, 10332–10338. [Google Scholar] [CrossRef] [PubMed]
  16. Luquot, L.; Abdoulghafour, H.; Gouze, P. Hydro-dynamically controlled alteration of fractured Portland cements flowed by CO2-rich brine. Int. J. Greenh. Gas Control 2013, 16, 167–179. [Google Scholar] [CrossRef]
  17. Kutchko, B.G.; Strazisar, B.R.; Dzombak, D.A.; Lowry, G.V.; Thaulow, N. Degradation of well cement by CO2 under geologic sequestration conditions. Environ. Sci. Technol. 2007, 41, 4787–4792. [Google Scholar] [CrossRef] [PubMed]
  18. Rimmelé, G.; Barlet-Gouédard, V.; Porcherie, O.; Goffé, B.; Brunet, F. Heterogeneous porosity distribution in Portland cement exposed to CO2-rich fluids. Cem. Concr. Res. 2008, 38, 1038–1048. [Google Scholar] [CrossRef]
  19. Bachu, S.; Bennion, D.B. Experimental assessment of brine and/or CO2 leakage through well cement at reservoir conditions. Int. J. Greenh. Gas Control 2009, 3, 494–501. [Google Scholar] [CrossRef]
  20. Liteanu, E.; Spiers, C.J. Fracture healing and transport properties of wellbore cement in the presence of supercritical CO2. Chem. Geol. 2010, 281, 195–210. [Google Scholar] [CrossRef]
  21. Jobard, E.; Sterpenich, J.; Pironon, J.; Corvisier, J.; Randi, A. Experimental modelling of the caprock/cement interface behavior under CO2 storage conditions: Effect of water and supercritical CO2 from a cathodoluminescence study. Geosciences 2018, 8, 185. [Google Scholar] [CrossRef]
  22. Kutchko, B.G.; Strazisar, B.R.; Huerta, N.; Lowry, G.V.; Dzombak, D.A.; Thaulow, N. CO2 reaction with hydrated class H well cement under geologic sequestration conditions: Effects of flyash admixtures. Environ. Sci. Technol. 2009, 43, 3947–3952. [Google Scholar] [CrossRef]
  23. Abdoulghafour, H.; Gouze, P.; Luquot, L.; Leprovost, R. Characterization and modeling of the alteration of fractured class-G Protland cement during flow of CO2-rich brine. Int. J. Greenh. Gas Control 2016, 48, 155–170. [Google Scholar] [CrossRef]
  24. Huet, B.M.; Prevost, J.H.; Scherer, G.W. Quantitative reactive transport modeling of Portland cement in CO2-saturated water. Int. J. Greenh. Gas Control 2010, 4, 561–574. [Google Scholar] [CrossRef]
  25. Parkhurst, D.L.; Appelo, C.A.J. Description of Input and Examples for PHREEQC Version 3—A Computer Program for Speciation, Batch-Reaction, One-Dimensional Transport, and Inverse Geochemical Calculations; U.S. Geological Survey Techniques and Methods: Reston, VA, USA, 2013; Chapter A43.
  26. Noiriel, C.; Gouze, P.; Madé, B. 3D analysis of geometry and flow changes in a limestone fracture during dissolution. J. Hydrol. 2013, 486, 211–223. [Google Scholar] [CrossRef]
  27. Luquot, L.; Gouze, P. Experimental determination of porosity and permeability changes induced by injection of CO2 into carbonate reservoir rocks. Chem. Geol. 2009, 265, 148–159. [Google Scholar] [CrossRef]
  28. Trapote-Barreira, A.; Cama, J.; Soler, J.M.; Lothenbach, B. Degradation of mortar under advective flow: Column experiments and reactive transport modeling. Cem. Concr. Res. 2016, 81, 81–93. [Google Scholar] [CrossRef]
  29. Barrante, J.R. Applied Mathematics for Physical Chemistry; Prentice-Hall: Upper Saddle River, NJ, USA, 1974. [Google Scholar]
  30. Atkinson, A.; Hearne, J.A.; Knights, C.F. Aqueous chemistry and thermodynamics modelling of CaO-SiO2-H2O gels. J. Chem. Soc. Dalton Trans. 1989, 2371–2379. [Google Scholar] [CrossRef]
  31. Taylor, H.F.W. Cement Chemistry, 2nd ed.; Thomas Telford Services Ltd.: London, UK, 1997. [Google Scholar]
  32. Soler, J.M. Thermodynamic Description of the Solubility of C-S-H Gels in Hydrated Portland Cement. Literature Review; Posiva: Eurajoki, Finland, 2007. [Google Scholar]
  33. Bullard, J.W.; Enjolras, E.; George, W.L.; Satterfield, S.G.; Terrill, J.E. A parallel reaction transport model applied to cement hydration and microstructure development. Model. Simul. Mater. Sci. Eng. 2010, 18, 025007. [Google Scholar] [CrossRef]
  34. Trapote-Barreira, A.; Cama, J.; Soler, J.M. Dissolution kinetics of C-S-H gel: Flow-through experiments. Phys. Chem. Earth 2014, 70–71, 17–31. [Google Scholar] [CrossRef]
  35. Mason, H.E.; Walsh, S.D.C.; DuFrane, W.L.; Carroll, S.A. Determination of diffusion profiles in altered wellbore cement using X-ray computed tomography methods. Environ. Sci. Technol. 2014, 48, 7094–7100. [Google Scholar] [CrossRef]
  36. Zhang, Y.; Dawe, R. The kinetics of calcite precipitation from a high salinity water. Appl. Geochem. 1998, 13, 177–184. [Google Scholar] [CrossRef]
  37. Zuddas, P.; Mucci, A. Kinetics of calcite precipitation from seawater: II. The influence of the ionic strength. Geochim. Cosmochim. Acta 1998, 5, 757–766. [Google Scholar] [CrossRef]
  38. Galan, I.; Glasser, F.; Andrade, C.; Baza, D. Dissolution of portlandite. In Proceedings of the 13th International Congress on the Chemistry on Cement, Madrid, Spain, 3–8 July 2011; pp. 1–7. [Google Scholar]
Figure 1. Schematic representation of a holed cement disc positioned in the percolation cell of Icare Lab 1 flow-through system.
Geosciences 08 00490 g001
Figure 2. ΔCa (a) and ΔSi (b) changes versus elapsed time for the first set of percolation experiments performed at 0.5 g∙L−1 NaCl (in blue), 10 g∙L−1 NaCl (in orange) and 30 g∙L−1 NaCl (in green). Labels of the experiments in (a) are coded by ionic strength and elapsed time.
Geosciences 08 00490 g002
Figure 3. (a) Close-up ESEM image showing the alteration layers in a reacted cement sample, (b) ESEM image displaying the measured distances (dotted arrows; a, b, c and d) and calculated values of reaction front thickness (plain arrows; Bth, Cth and Dth) and spreading distances (plain arrows; Bsd, Csd and Dsd), and (c) equations used to calculate reaction front thickness and spreading distances.
Geosciences 08 00490 g003
Figure 4. ESEM images displaying the reaction fronts observed in the reacted cement samples corresponding to the first set of experiments.
Geosciences 08 00490 g004
Figure 5. ESEM images that compare the cement alteration after ≈ 70 h of experiment for two experiments performed at different CO2 concentration (experiments cp30-t3 (a) and cp30LC-t3 (b)).
Geosciences 08 00490 g005
Figure 6. Salinity (a) and pCO2 (b) effect on the distribution and dimension of the reaction fronts in the reacted cement samples.
Geosciences 08 00490 g006
Table 1. List and parameters of the percolation experiments performed at constant flow rate. The first set includes experiments run at different duration (from t1 to t5), with different salinity of the inlet fluid (0.5, 10 and 30 g∙L−1 of NaCl) and a pCO2 = 3.3 MPa. The second set comprises experiments performed at different duration (from t1 to t5), with a pCO2 = 1.8MPa and a salinity equal to 30 g∙L−1 of NaCl.
Experiment LabelElapsed Time Input Solution pCO2Chemical AnalysisSEM Analysis
(h)(g∙L−1 NaCl)(MPa)
First Set of Experiments
cp0.5-t115.00.53.3OKOK
cp0.5-t245.70.53.3OKOK
cp0.5-t373.00.53.3OKOK
cp0.5-t4106.40.53.3-OK
cp0.5-t5127.80.53.3OKOK
cp10-t145.0103.3OKOK
cp30-t115.0303.3-OK
cp30-t245.9303.3OKOK
cp30-t373.1303.3OKOK
cp30-t4126.4303.3OKOK
Second Set of Experiments
cp30LC-t125.1301.8-OK
cp30LC-t244.2301.8-OK
cp30LC-t366.3301.8-OK
cp30LC-t4100.5301.8-OK
cp30LC-t5160.5301.8-OK
Table 2. Composition of the input solutions: (a) ionic concentration (from ICP-OES and IC) and calculated pH, ionic strength (I) and saturation index (SI) of the CO2-free input solutions and (b) calculated pH, CO2 concentration, pCO2, and saturation index (SI) of the CO2-rich solutions (reaction conditions).
Input Solution
Set of Experiments First SetSecond Set
NaClg∙L−10.51030
(a) T = 60 °C, P = 12 MPa
pH 8.027.687.647.77
I 0.010.180.530.52
Nappm204.53977.312,226.111,604.4
Clppm326.36119.218,786.517,933.1
Cappm17.621.3
Mgppm7.3-
Kppm0.4-
Sippm3.8-
S(6)ppm0.7-
N(5)ppm0.7-
(b) T = 60 °C, P = 12 MPa + CO2
pH 3.683.773.953.42
CO2mol∙L−1 0.440.23
pCO2MPa3.311.81
SI-CH −16.47−16.61−16.39−17.34
SI-CSH −23.42−23.61−23.21−39.22
Table 3. Thickness (Bth, Cth, and Dth) and spreading distance (Bsd, Csd, and Dsd) of the reaction fronts calculated from the ESEM images of the reacted cement samples. All distances are in mm.
Reaction Layers
Experiment LabelBCD
Silica-richCalcitePortlandite-depleted
BthBsdCthCsdDthDsd
(mm)
First Set of Experiments
cp0.5-t10.210.110.080.25--
cp0.5-t20.340.170.120.41--
cp0.5-t30.460.230.140.53--
cp0.5-t40.510.260.180.60--
cp0.5-t50.580.290.180.67--
cp10-t10.370.180.100.410.090.51
cp30-t10.230.090.080.270.140.38
cp30-t20.380.190.100.420.230.59
cp30-t30.400.200.110.460.340.68
cp30-t40.510.260.140.580.390.85
Second Set of Experiments
cp30LC-t10.160.040.080.170.160.29
cp30LC-t20.230.090.080.270.260.42
cp30LC-t30.230.120.140.300.310.53
cp30LC-t40.280.140.140.350.290.56
cp30LC-t50.430.220.150.510.530.85

