Review

Coastal Flood Modeling Challenges in Defended Urban Backshores

Department of Civil and Environmental Engineering, University of California, Los Angeles, CA 90095, USA
*
Author to whom correspondence should be addressed.
Geosciences 2018, 8(12), 450; https://doi.org/10.3390/geosciences8120450
Submission received: 1 November 2018 / Revised: 25 November 2018 / Accepted: 26 November 2018 / Published: 1 December 2018
(This article belongs to the Special Issue River, Urban, and Coastal Flood Risk)

Abstract

:
Coastal flooding is a significant and increasing hazard. There are multiple drivers including rising coastal water levels, more intense hydrologic inputs, shoaling groundwater and urbanization. Accurate coastal flood event prediction poses numerous challenges: representing boundary conditions, depicting terrain and hydraulic infrastructure, integrating spatially and temporally variable overtopping flows, routing overland flows and incorporating hydrologic signals. Tremendous advances in geospatial data quality, numerical modeling and overtopping estimation have significantly improved flood prediction; however, risk assessments do not typically consider the co-occurrence of multiple flooding pathways. Compound flooding refers to the combined effects of marine and hydrologic processes. Alternatively, multiple flooding source–receptor pathways (e.g., groundwater–surface water, overtopping–overflow, surface–sewer flow) may simultaneously amplify coastal hazard and vulnerability. Currently, there is no integrated framework considering compound and multi-pathway flooding processes in a unified approach. State-of-the-art urban coastal flood modeling methods and research directions critical to developing an integrated framework for explicitly resolving multiple flooding pathways are presented.

1. Introduction

Urban coastal flooding is a global humanitarian and socioeconomic hazard with multiple drivers including rising coastal water levels, more intense hydrologic inputs, shoaling groundwater and increasing urbanization. Currently, over 20 million people reside below present day high tide levels, 200 million are vulnerable to storm flooding [1], and over 600 million individuals reside in the coastal zone [2]. Mean sea levels are expected to rise 0.28–0.98 m by 2100 [3]. These estimates are, however, likely under-representative of potential sea level rise rates [4,5]. Regional trends show significant variability [6]. Relatively modest sea level rise (i.e., 0.50 m) will significantly increase flood frequencies [7]. Sweet and Park [8] showed that “tipping points”, i.e., flooding over 30 days per year, will be reached by 2050 and flood frequency will increase drastically (e.g., near daily flooding under RCP4.5 scenario) by 2100 for many locations.
Urban flood events are the most significant contributor to the overall flood risk [9,10]. Hanson et al. [11] suggested a threefold increase in coastal population exposure by the 2070s which will be exacerbated as low-lying areas are urbanized. From an economic perspective, assets exposed to the 100-year coastal flood are expected to increase dramatically in the coming decades. Hallegatte et al. [12] suggested a near order of magnitude increase in flood damages by 2050. Hinkel et al. [13] estimated 1.2–9.3% of global GDP and up to US$ 210 trillion of assets will be exposed to the 100-year coastal flood under emissions scenario RCP8.5. Collectively, these studies point to the burgeoning risk of urban coastal flooding, but do not account for the additive impacts of multiple flood pathways. Prime et al. [14] demonstrated that modeled flood extent is grossly underestimated when cumulative (and nonlinear) multiple flood pathway impacts are not considered, and that resulting costs grow disproportionately.
Large storm systems often bring elevated coastal water levels, energetic waves and intense rainfall. Compound modeling accounts for the interactions between hydrologic and oceanic processes. Wahl et al. [15] presented three compound flooding pathways; (1) the super elevation of estuary or bay water levels; (2) storm surge dominated flooding that is exacerbated by rainfall; or (3) freshwater that is unable to gravity drain to bays and estuaries because of high tail water conditions from storm surge. Flood hazard mapping applications (e.g., FEMA) often assume that freshwater flows are independent or temporally shifted and can be ignored. For example, Divoky et al. [16] and Glahn et al. [17] suggested that during storm events river hydrographs peak subsequent to coastal forcing (i.e., storm surge and waves). Zheng et al. [18] showed that the time lag between peak discharge and storm surge in the coastal zone depends on catchment location and size, among other catchment properties, and that the time lag can diminish for smaller water systems. More recent research (e.g., [19]) shows that neglecting compound impacts significantly underestimate flood hazard in a number of large urban areas. Alternatively, multiple flooding pathways (e.g., groundwater–surface water, overtopping–overflow, and surface–storm sewer flow) may amplify coastal flooding impacts. Gallien et al. [20] and Gallien et al. [21] showed that the storm drain system can redistribute flows in an urban area, and that when high water levels prevent gravity drainage other flooding source–receptor pathways (such as wave overtopping or precipitation) may be exacerbated. For example, Gallien et al. [21] showed that raising seawalls to limit tidal flooding may increase beach overtopping flood extent by retaining overtopped water that otherwise would have flowed to the bay.
This review focuses on coastal flood modeling methods applied to the defended urban areas and the impacts of adjacent water bodies (i.e., nearshore and estuary), as depicted in Figure 1. Defended areas are inherently vulnerable, low-lying and often flat terrain. Ramirez et al. [22] showed that highly simplified modeling performs acceptably in steep terrain; however, it is precisely these flat, feature-rich topographies that demand complex modeling. State-of-the-art flood modeling methodologies and challenges are outlined for defended urban coastal environments. Given the terrain complexity, the outlined methodologies have deterministic simulations in mind, i.e., particular external forcing scenarios drive the models to compute the flood extent in the study area. Deterministic simulations are used for validating numerical models and methodologies, and offer key insights into the governing hydrodynamic and hydrologic processes. In contrast, probabilistic analyses can examine input data uncertainty propagation through many realizations (Monte Carlo) and account for event dependence and extreme statistics. Probabilistic analyses inherently favor computationally efficient modeling approaches (e.g., [23]), similar to methodologies applied for large-scale coastal flood hazard mapping (e.g., [24,25,26]). We envision a hybrid framework where local, high resolution deterministic modeling is used to identify dominant flooding pathways and flow hydrodynamics while probabilistic models capture model uncertainty and utilize a multivariate approach for considering compound or multi-pathway flooding.

2. State of Knowledge

Scientific literature presents a general modeling methodology (e.g., [20,22,23,27,28,29,30,31,32,33,34,35]); however, there has been a call for more rigorous regional flood modeling and improved methodologies (e.g., [36,37,38]). Urban flooding is the most significant contributor to flood risk [9,10], and poses a number of modeling challenges, including offshore boundary conditions, terrain and infrastructure depiction, representing hydrologic inputs, characterizing spatially and temporally variable wave runup and overtopping flows, inclusion of hydraulic infrastructure, routing overland flow and quantitative model evaluation. Overland flood prediction is presented as central to the modeling framework, with offshore and hydrological forcing considered as external boundary conditions (Figure 1). Ideally, computationally efficient couplings that explicitly model all relevant flooding pathways will be developed.

2.1. Overland Flow Modeling

Overland flow may be routed via simplistic planar surface projections [37,39], mass conservation schemes (e.g., LISFLOOD-FP [27]), simple inertial formulations of the shallow water equations (e.g., [40]) or through more sophisticated hydrodynamic models (e.g., AdH, MIKE FLOOD, TUFLOW, DIVAST, BreZo, Delft3D, and Telemac) which solve the full 2D shallow water equations. The static method, also known as planar surface projection, equilibrium, or “bathtub” method, has drawn substantial criticism for poor predictive skill in protected urban backshores [20,41]. Poulter and Halpin [29] and Heberger et al. [37] presented a raster-based modeling approach where areas that fall below the water level are flooded, i.e., the assumption is that hydraulic flow paths exist and the flood is sustained sufficiently long to fill the impacted region up to the height of the embayment. Variants of this approach can be devised to account for protection by levees and seawalls, but all static models retain the fundamental assumption that flooding occurs instantaneously upon exceeding overflow thresholds. Static methods are an “all or nothing” approach. If the water level exceeds the threshold, all connected areas are predicted to be flooded; alternatively, if the water level is below the flooding threshold, all areas are presumed to be dry. This leads to extraordinary under- and over-prediction [20,21]. Since flow is not hydraulically routed, depth and velocity information are unavailable with static models. Figure 2A shows a static prediction and Figure 2B shows a hydrodynamic simulation along with the observed flood extent. Static models perform poorly and should be avoided for low-lying defended urban backshores.
An alternative method is to extend the hydraulic model domain to all areas subject to episodic inundation and to make flood mapping an integral part of the hydraulic model analysis. For example, Brown et al. [28] presented a coupled storm surge and overland flow model for Canvey Island located in the Thames Estuary. There are two primary benefits to this approach: hydrodynamic information is explicitly calculated (e.g., depth, velocity, arrival time) and predictions are substantially more accurate in urban backshores.

Shallow Water Equations

Overland flow has been investigated using kinematic and diffusive wave models that do not consider inertial terms in the momentum balance. However, in urban environments where flow transitions are common and high resolution depth and velocity estimates are desirable, inertial terms improve predictions [42]. Hunter et al. [43,44] showed that diffusion wave models may be less computationally efficient than solving the full 2D nonlinear shallow water equations because the optimal time step is a quadratic function of the grid size. The efficiency of diffusive models is thus lost for fine-scaled grids required to resolve hydraulic pathways in urban areas. Bates et al. [40] proposed an “inertial” model removing the convective but retaining the local acceleration term which improved computational times and reasonably simulated depth and velocities. Neal et al. [45] showed that such an approach leads to reduced computational time compared to full shallow water models for gradually sloping, subcritical flows. Inertial models and their parallelized versions (e.g., [46]) thus offer a potential option for probabilistic and large-scale model applications which require computational efficiency [24]. These simplified models can accurately predict flood extent in slowly temporal-spatial varying applications, but momentum terms are critical to accurate velocity estimates [42,45].
Full 2D nonlinear shallow water models have proven to provide excellent depth and velocity estimates in urban areas (e.g., [47,48]). Particular attention should be paid to the numerical implementation and its suitability for rapidly variable flows. Discontinuous Galerkin finite element methods or Godunov-based finite volume schemes admit supercritical flows from abrupt elevation changes inherent to urban environments such as sea walls, streets, and curbs without case specific parameter tuning. Finite volume schemes are the most widely used 2D nonlinear shallow water solution method [49]. Numerous Godunov-type finite volume codes have been successfully implemented in coastal embayment modeling [20,50,51,52] and urban flood simulations [47,48,52,53,54,55].

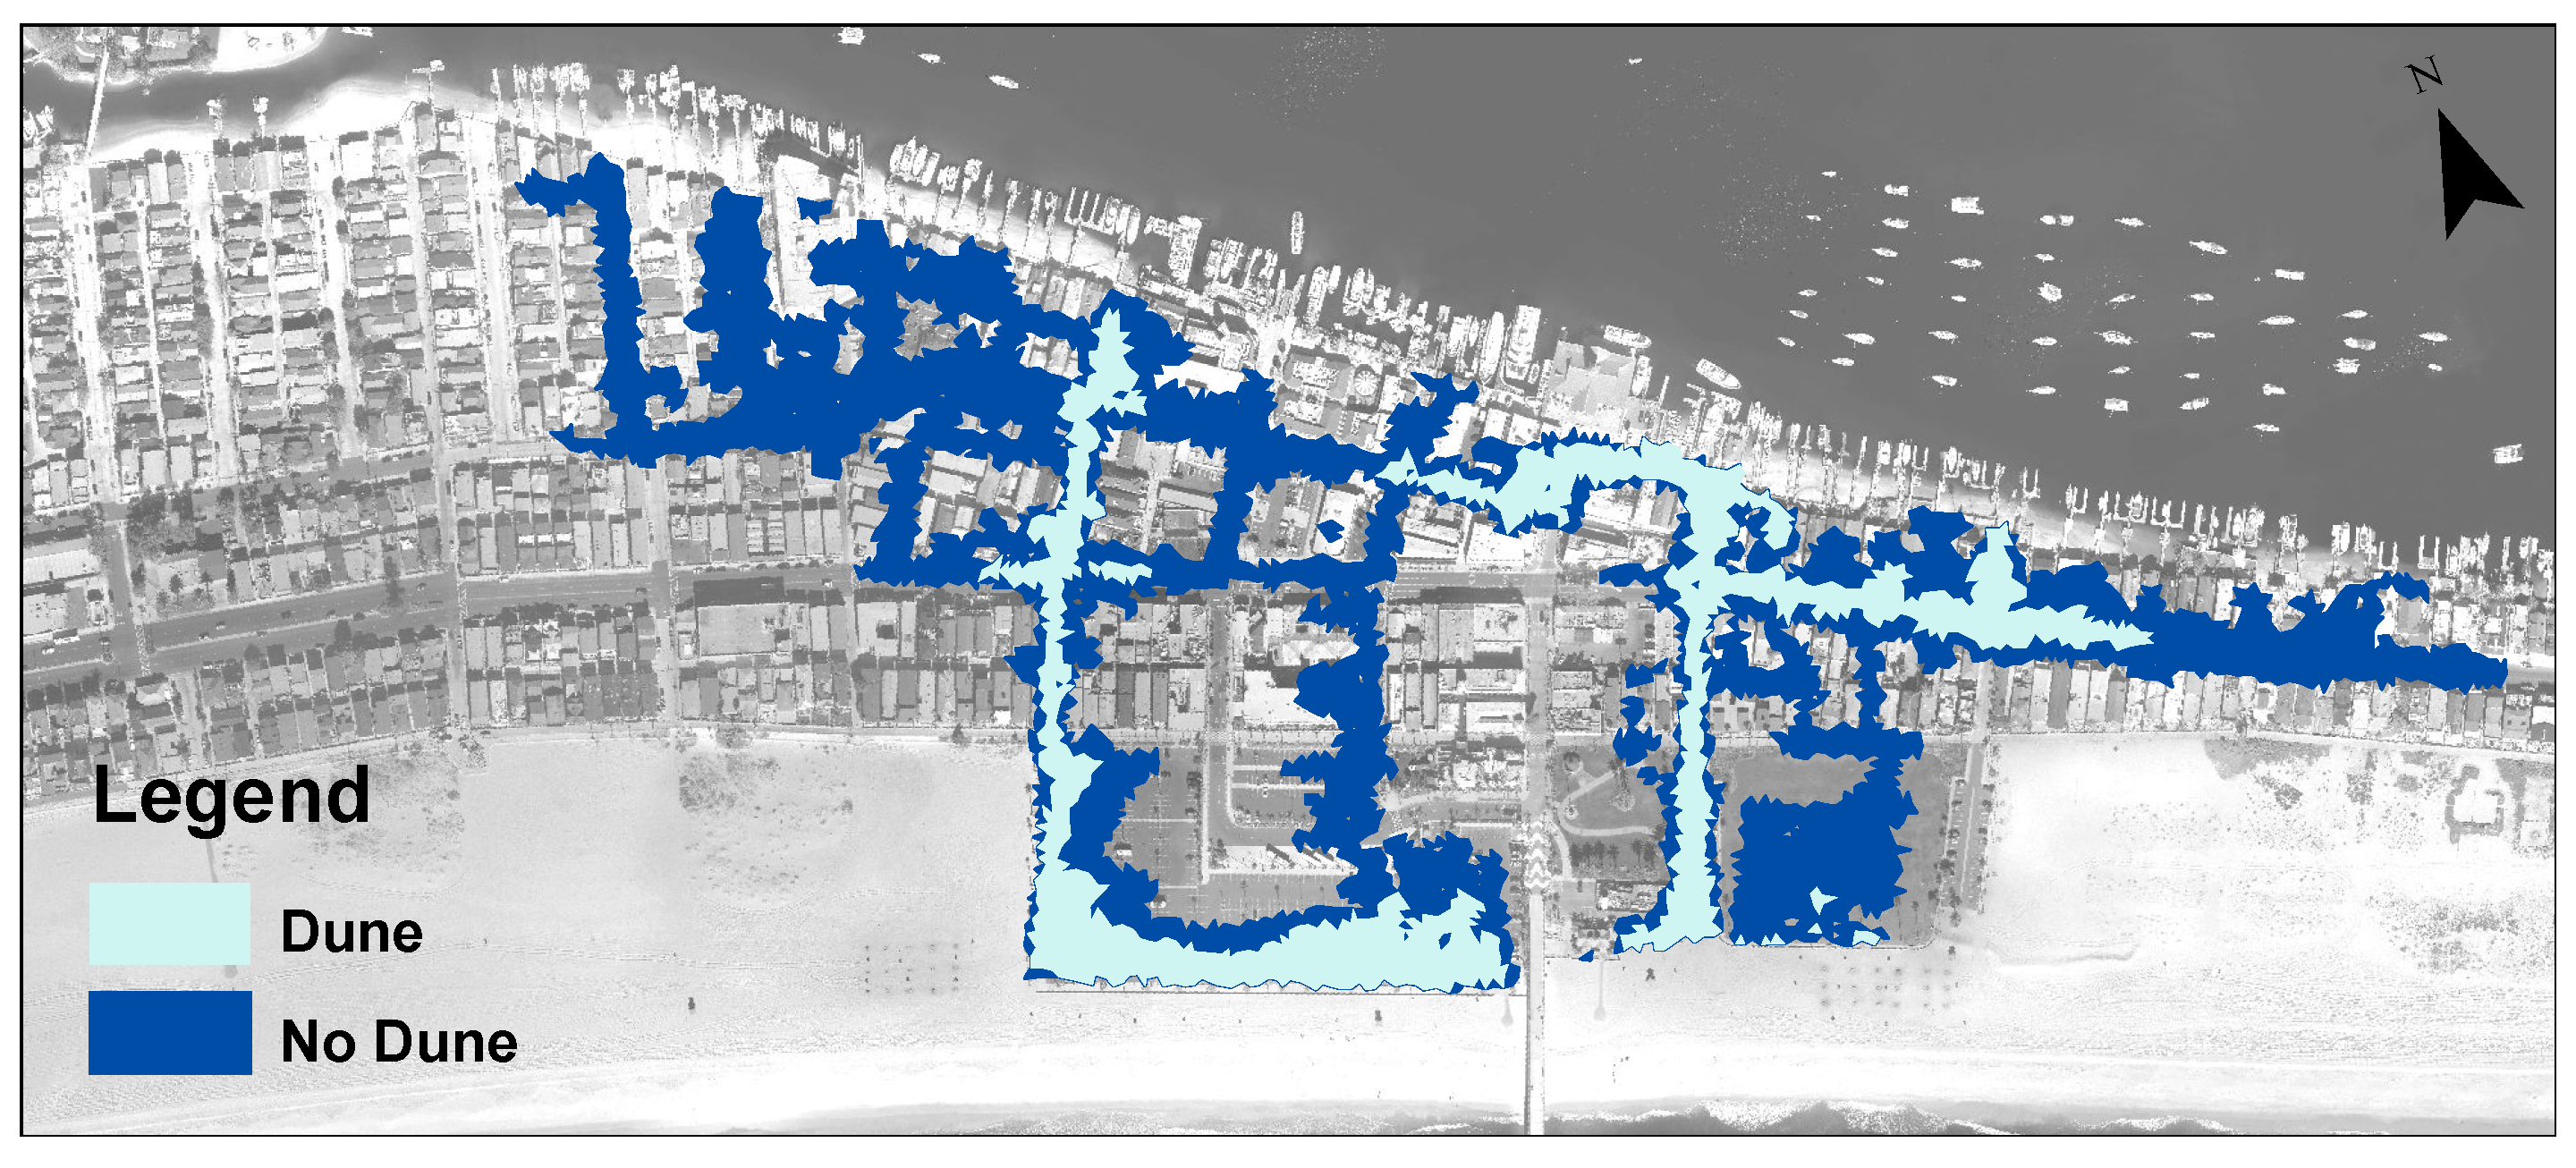
2.2. Terrain and Infrastructure

Accurate topographic representation is fundamental to predicting coastal flooding. Sanders [56] showed high resolution LiDAR-derived digital elevation products significantly outperformed larger scale mapping products. For example, digital elevation models (DEMs) derived from airborne interferometric synthetic aperture radar (IfSAR) and shuttle radar topography mission (SRTM) data are surface products with significant noise and do not sufficiently resolve hydraulic topography, which negatively impacts flood predictions [56].
Multiple studies have noted that low relief areas are especially sensitive to terrain representation [57,58]. Generally, LiDAR-derived data with a spatial resolution of ∼1 m postings and vertical accuracy ∼10–15 cm are adequate for terrain resolution [48,56,58,59]. However, Néelz et al. [60] found significant LiDAR limitations for resolving built areas, while Webster et al. [61] and Gallien et al. [21] suggested LiDAR inadequately resolves abrupt elevation changes such as wharves or sea walls. Similarly, Gallien [34] showed highly-filtered bare earth DEM products may misrepresent topography, particularly between buildings or other tall structures. Numerous studies point to the importance of resolving key hydraulic features such as roads, walls, storm drainage and dunes which restrict or redistribute flow (e.g., [9,20,23,29,41,47,48]). Gallegos et al. [48] showed that street depressions must be reasonably resolved for hydraulic routing and suggested mesh resolutions of ∼5 m or three cells balances accuracy and computational effort. Gallien et al. [20] showed that, for accurate results of weir-like sea-wall overflow, wall elevations must be accurately surveyed and explicitly resolved in the hydraulic mesh (Figure 3). These studies emphasize the need for high accuracy real time kinematic (RTK) or post-processed GPS surveys of hydraulically important urban topography, but only a limited number of studies have attempted to explicitly include infrastructure in hydrodynamic coastal flood modeling efforts (e.g., [20,21,23,28,34,62,63,64]).
Data preparation, whether the product is a digital surface model (DSM) including canopy, buildings, vehicles and other surface features or is a digital terrain model (DTM) representing bare earth topography is of key interest. Urban flood models fall in one of the following four categories depending on the method of representing buildings in the terrain [53]: building-hole models, where the buildings are replaced with building-perimeter polyline [47], and either a free-slip boundary [54] or other internal hydraulic conditions are imposed along the perimeter; building-resistance models, where a relatively large resistance parameter (bottom friction) is assigned to cells corresponding to building footprints [65] or developed parcels; building-porosity models, where buildings are represented through spatially-distributed porosity and drag coefficients, without resolving the exact geometry of the buildings [52,66]; and building-block models, where buildings with their representative shape and height are included in the terrain, essentially blocking the flow from passing through them (e.g., [67]). Each method requires a different mesh style. All methods reasonably predict flood hydrographs and extent when the model resolves important flow paths and storage functions of the land surface [53], but velocities depend on building representations [53,64]. The model of choice depends on availability of computational power, the importance of velocity predictions, and the availability of the necessary data coupled with the user’s familiarity with the GIS techniques needed for each method implementation [53].
In urban applications, significant portions of the flow may be conveyed by storm sewers. Henonin et al. [68] presented an urban flood model classification that represents the storm system and overland flow model dimensionality (e.g., 1D–1D, 1D–2D, etc). SWMM [69] is a widely used link-node approach for resolving subsurface flows for 1D–2D modeling [42]. In coastal applications, storm system drainage is critical to predicting flood extent for three reasons: (1) bay or ocean water levels may flood low protected backshores through the storm drain outfalls; (2) the storm drain system may redistribute water in a domain; and (3) overland flow volumes may be reduced by storm system drainage. Gallien et al. [20] showed that the storm drain system redistributes flood water even when the outlets are closed to prevent back-flooding from high bay levels. That is, water entering one curb inlet may cause flooding through subsurface hydraulics connections even if the surface topography is not hydraulically connected. This interaction cannot be resolved in models ignoring drainage, which challenges the traditional assumption that storm system flows can be ignored when the drainage system is operating at capacity [70,71].
Infrastructure failure should be explicitly incorporated into flood predictions e.g., [28,72]. However, generally the approach is “all or nothing”. Infrastructure is either omitted from coastal flooding models (nothing) resulting in substantial vulnerability overestimation, or infrastructure is resolved (all), but potential failures are not considered, resulting in vulnerability underestimation. The uncertainty generated by failure of protective barriers such as levees can be examined by integrating scenarios of flood defense breaches into both static and hydrodynamic methods (e.g., [28]), however only the hydrodynamic approach accounts for storage and resistance effects, and provides detailed information about the velocity and depth distribution. In the case of dynamic protective barriers (e.g., sand dunes and berms), sediment transport models can be applied to explicitly account for dynamic breaching during a storm event. For example, Elsayed and Oumeraci [73] calibrated XBeach, applied it to predict a dam breach and subsequent overland flow, and suggested that flow and velocity were in good agreement with observed values.
“Soft” infrastructure such as beach and dune restoration and artificial dune building are often the first line defense in coastal management, but little is known about their performance and design. Often beaches are only crudely resolved from a single survey, or estimated from LiDAR data, which may under- or overestimate vulnerability. Similarly, morphological evolution during energetic wave events is often unresolved, which significantly alters overtopping flood volume estimates [74]. Artificial dunes (also referred to as “berms”) provide critical backshore protection and are widely deployed as a first line of defense for large wave and/or high water level events [72,75]. These structures are often sacrificial, intended only to deflect specific high water or energetic wave events, and are often unresolved in individual LiDAR surveys. Temporary berming is a popular mitigation strategy for urban coastal flooding (e.g., [72,76,77,78,79,80]). Gallien et al. [21] considered flood mitigation effects of artificial dunes and showed that the backshore flooding extent increased nearly 400% without a temporary dune (Figure 4).

2.3. Boundary Conditions

Urban coastal flood models require characterizing both open coast and estuary water levels, hydrologic inputs and wave overtopping flows. Sea level rise will increase oceanic and bay water levels and allow wave energy to propagate landward, potentially increasing wave overtopping flooding.

2.3.1. Water Level

Water level boundary conditions may be represented by simple arbitrary values, output from multi-scale models, probabilistic or synthetic data. Sea level rise assessments commonly utilize a single water level value depicting a future change in sea level (e.g., [59,81,82,83,84]). Alternatively, probabilistic water levels may be used to force an overland flow model [31]. Kopp et al. [85] determined probabilistic water levels for global tide gauges through the 22nd century. Sophisticated nested modeling systems (e.g., [33,35]) downscaled global climate models to consider regional water levels to predict regional water level impacts.
In open coastal areas, ocean water levels are sufficient for flood model boundary conditions, however, estuary and embayment water levels may not correspond to open coast water levels and require explicit embayment resolution [32]. For example, the southern lobe of San Francisco Bay experiences tidal amplification (∼1.4×) [86], and Lyddon et al. [87] showed significant spatial variability of water levels from the combined effects of tide and storm surge in hyper-tidal estuaries. Gallien et al. [20] suggested that even relatively small (∼3 cm) water surface elevations in bays can cause significant changes in protected urban flood prediction. More sophisticated hydrodynamic event simulation at the regional scale (<100 km) has been approached by establishing a simulation domain wherein hydraulic models are applied to simulate spatial and temporal changes in bay water levels in response to boundary forcing (e.g., [20,28,33,34,35]). Critically, hydrologic inputs may superelevate bay and estuary water levels.

2.3.2. Hydrologic Impacts

Hydrologic impacts on coastal flooding may be through fluvial (river) or pluvial (runoff) pathways. From a fluvial perspective, previous research suggested river hydrographs peak subsequent to storm surge and may not affect coastal forcing (e.g., [16,17]). However, Svensson and Jones [88] suggested that steep catchments are particularly vulnerable to compound flooding because maximum surge and riverine discharges may be coincident. Similarly, Chen and Liu [89] showed the importance of storm surge and river discharge phasing, while Orton et al. [90] and Maskell et al. [91] showed that exclusion of freshwater inputs can lead to significantly lower projected bay and estuary water levels predictions. Orton et al. [90] noted that omitting freshwater inputs and density variations led to low bias, which is particularly concerning for urbanized areas with extensive subsurface infrastructure. Ward et al. [92] mapped sea level and fluvial input dependence and showed that over half the global sites exhibited significant dependence. Compound fluvial flooding is often approached on the local scale using deterministic hydrodynamic modeling (e.g., [89,90,93,94]), while larger scales typically consider probabilistic methods (e.g., [15,19]). For example, Olbert et al. [95] and Gallien et al. [62] used deterministic modeling to show that sheltered urbanized estuarine areas are particularly sensitive to streamflow. Moftakhari et al. [19] used a probabilistic approach to show that neglecting compound impacts significantly underestimates flooding hazards in a number of large urban areas and advocated for local-scale research to accurately quantify impacts. Numerous research groups have pointed to the importance of resolving compound fluvial coastal flows for accurate coastal flood predictions (e.g., [19,62,90,91,95,96,97]). Critically, a paucity of observational data limits flood risk assessment, and the collection of high quality observations is advocated [93,98].
From a pluvial perspective, storm surge may saturate the area and rainfall becomes runoff and potentially, storm system flow. During high coastal water level events, storm systems are often closed to prevent back flooding, which exacerbates pluvial flooding. Although rainfall and drainage have recently been recognized as a significant issue [99,100], only limited efforts incorporate this key hazard. Cheng et al. [101] developed the COSM model, which couples nearshore (ADCIRC) and watershed (pWASH123D) processes, and suggested a tight two way coupling is necessary to accurately resolve nearshore-watershed interactions. Tang et al. [102] presented a hybrid modeling approach, where a 3D ocean model (FVCOM) is coupled to a 2D nonlinear shallow water model to explicitly resolve marine flooding, which is combined with spatial output from a probabilistic hydrologic model to resolve compound flooding from various storm events. Thompson and Frazier [103] estimated potential future flooding hazards using a 2D hurricane surge model (SLOSH) and inland precipitation using the Interconnected Channel and Pond Routing Model (IPCR) model, and showed that precipitation significantly increases the flood extent. Joyce et al. [94] used an ocean (ADCIRC) and a nearshore wave transformation model (SWAN) in a one way coupling to force a hydrological/hydraulic and storm water model (ICPR). With the exception of Cheng et al. [101], these analyses did not consider the subsurface groundwater flows.
Sea level rise is expected to increase beach groundwater levels (e.g., [104,105,106,107]), which presents two critical dynamics, beach stability [108] and groundwater shoaling [106]. Swash zone processes are multi-phase, shallow, and transient, presenting both modeling and observation difficulties [109]. Studies that considered beach groundwater and sediment transport (e.g., [108,110,111,112]) generally suggest that high groundwater tables promote erosion which increases backshore vulnerability [104].
From a flooding perspective, groundwater may inundate coastal areas [106,107]. High beach groundwater levels may reduce infiltration processes which have been associated with increased wave runup [113,114]. Areas with shallow aquifers are particularly vulnerable to emergence [107]. Underground infrastructure (e.g., pipes, tunnels, and basements) will become increasingly vulnerable to rising groundwater [105]. Coastal groundwater shoaling and emergence generally occur more frequently as the vertical unsaturated subsurface space narrows [115]. The inclusion of groundwater inundation in modeling has been shown to result in more than twice as much coastal flooding compared to marine inundation alone [106].

2.3.3. Wave Overtopping

Backshores historically unimpacted by incident wave overtopping, may become vulnerable with higher sea levels, and Arns et al. [116] suggested that future water levels will amplify wave runup design heights by ∼50% in currently impacted areas. Although wave overtopping has received sustained attention in the literature (e.g., [117,118,119,120]), wave runup and overtopping are considered significant deficiencies in current modeling methodologies [28,121,122], and have been recognized as a key future research area [123].
Wave forcing may be represented by known deep water wave characteristics (i.e., buoy data) or more sophisticated numerical wave modeling efforts. Flood vulnerability assessments often use simple empirical runup models (e.g., [124]) driven by deep water wave data. This method cannot capture nearshore bathymetry effects or key nearshore processes (e.g., wave–current interaction). An alternative is to propagate waves into the region of interest using SWAN [125] or other phase-averaged (spectral) wave models. From the spectral parameters, a random-phased wave field can be generated in a phase-resolving model (e.g., [126,127]). Stochastic uncertainty of the random phasing should be addressed when computing runup/overtopping metrics [128]. In areas of high urbanization with reflective armoured shores, significant inter-tidal or submerged infrastructure (e.g., harbors, jetties, and breakwalls), Boussinesq-type [129] or other non-hydrostatic phase-resolving models (e.g., [130]) have proven to adequately represent the nearshore wave field.
A simplistic method for depicting flooding from overtopping involves adding maximum wave runup to determine a total water level (e.g., [37,131]) and projecting this water level across the land surface. The total water level method is applied using a bathtub model and consequently suffers identical deficiencies shown in overland flow modeling. Overtopping time scales in episodic flooding events caused by a coincident large wave conditions and high tides range from minutes to a few hours, insufficient time to fill the backshore, and consequently total water level methods for wave overtopping have proven to significantly overpredict the inundation zone in defended urban backshores [62]. Overtopping is inherently a dynamic, temporally variable process which can be represented using empirical and numerical models.
Only a limited number of studies have attempted to include wave overtopping volumes using empirical estimates or numerical estimates [31,132,133,134,135]. Numerical models represent the current state-of-the-art for simulating overtopping flows and theoretically, if the physics are well represented, could predict overtopping in an infinite number of dune, dike or wall configurations. However, field scale implementations have been challenged by computational effort, grid sensitivities, and boundary condition effects which have restricted most applications to numerical wave flumes (e.g., [136]) or analytical solutions and laboratory validation data (e.g., [121,137,138,139]).

3. Wave Overtopping Models

3.1. Empirical Wave Overtopping Models

Literature presents a number of empirical wave overtopping models (e.g., [140,141,142,143,144,145,146,147,148,149,150,151,152,153]). Typically models calculate a dimensionless overtopping rate that considers freeboard (crest elevation above still water level) and wave characteristics (significant wave height and peak period). EurOtop has been widely used in estimating overtopping volumes for coastal flooding applications (e.g., [21,34,123,132,154,155]). The general EurOtop average overtopping formula for coastal dikes and embankment seawalls is,
q g H m 0 3 = min ( a , b ) , a = 0.023 tan α γ b ξ m 1 , 0 exp 2.7 R c ξ m 1 , 0 H m o γ b γ f γ β γ v 1.3 , b = 0.09 exp 1.5 R c H m 0 γ f γ β γ v 1.3 ,
where H m 0 is the significant wave height at the toe of the structure, α is the slope, g represents gravity, q is the mean overtopping rate per unit length, γ b is the berm influence factor, γ f is the roughness influence factor, γ β is the oblique wave attack factor, and γ v is the vertical wall influence factor [153]. The van der Meer [149] formulation relies on a breaker parameter ξ m 1 , 0 , which characterizes the wave breaking condition (i.e., breaking, non-breaking) and is given as,
ξ m 1 , 0 = tan α H m 0 L m 1 , 0 ,
where L m 1 , 0 is a spectral deep-water wave length. For a complete discussion of the TAW and EurOtop equations, refer to the works of van der Meer [149], Pullen et al. [151] and van der Meer et al. [153]. It should be noted that EurOtop and other empirical wave overtopping formulae provide average overtopping rate estimates and do not resolve individual wave overtopping volumes or infragravity energy which are important to wave overtopping flooding.

3.2. Numerical Wave Overtopping Models

Numerical modeling is attractive for resolving overtopping flows because, theoretically, a validated model may be configured for any desired structure, bathymetry or wave train. Additionally, numerical models can simulate impulsive, temporally variable overtopping rates and facilitate dynamic (wave-by-wave) coupling with the overland flow model. A variety of methods to resolve wave overtopping have been investigated; the Navier–Stokes equations, Boussinesq-type models and the Nonlinear Shallow Water (NLSW) equations.

3.2.1. Navier–Stokes Equations

The full incompressible Navier–Stokes equations provide an excellent model for wave overtopping and can resolve complicated hydrodynamics such as wave breaking and overcome limitations associated with any particular wave theory [137]. Significant numerical modeling work resolving wave runup and breaking processes has been accomplished (e.g., [156,157,158,159,160,161,162]). A selection of these models were subsequently investigated as overtopping models. In the Eulerian framework, Liu et al. [138] presented a 2D Reynolds Averaged Navier–Stokes model based upon the Lin and Liu [159] RANS solver with a k ϵ turbulence closure model. The model was named Cornell Breaking Waves and Structures (COBRAS) and was applied to regular wave overtopping of a porous structure. Comparison to laboratory data showed COBRAS correctly simulated the free surface and overtopping rates [138]. Losada et al. [137] employed an extended COBRAS model, COBRAS-UC, developed by the University of Cantabria (e.g., [163,164,165,166]), which uses a volume averaged Navier–Stokes turbulence model developed by Hsu et al. [158], and successfully simulated both regular and irregular wave overtopping of a rubble mound breakwater. Similarly, Soliman [167] and Reeve et al. [168] employed the Lin and Liu [159] RANS formulation to investigate combined overtopping and overflow of smooth impermeable sea walls with small and negative freeboards. Results generally agree with previous models; however, for combined overflow and wave simulations, significant overprediction is observed. Thompson et al. [169] used a RANS formulation to predict seawall overtopping and showed generally good agreement with EurOtop average overtopping rates. A three-dimensional (3D) LES model was proposed by Li et al. [170] to study overtopping of sloped and vertical structures and produced promising results when ran on high resolution grids; however, grid dependency was observed. Similarly, Okayasu et al. [139] extended a 3D LES model to investigate wave overtopping on gentle slopes and stepped sea walls, and results suggested a sensitivity to water depth at the structure toe. Lagrangian methods for solving the Navier–Stokes have gained some attention within the scientific community and are attractive because the method is meshless and requires no special surface tracking [157]. Overtopping has been considered using SPH in small scales (e.g., [171,172,173]) with generally good results. Although both the Lagrangian and Eulerian methods of solving the Navier–Stokes equations have proven successful for modeling wave overtopping volumes, computational effort is extremely high and currently impractical for field scale or long wave train (i.e., 1000 waves) simulations.

3.2.2. Boussinesq

The classical Boussinesq equations for variable depths were developed by Peregrine [174] and benefit from the ability to include frequency dispersion; however, these equations were valid only where depth to deep water wave length ratio is less than 0.2 [175]. Subsequently, considerable effort to extend the equations applicability into deeper water has occurred (e.g., [176,177,178,179,180]) and numerous studies have extended into the surf and swash zones (e.g., [129,181,182,183,184,185]). Stansby [186], Stansby and Feng [187] and Orszaghova et al. [188] considered solitary wave overtopping, whereas Lynett et al. [134] considered 1D wave spectra. Sitanggang and Lynett [189] proposed a Boussinesq solver to propagate waves from intermediate depths to nearshore coupled to a Navier–Stokes solver to resolve wave breaking. Alternatively, Tonelli and Petti [190] suggested a Boussinesq model for propagating waves when nonlinearity and dispersion effects are of similar order and switching to a NLSW solver when nonlinearity dominates. The combined Boussinesq and nonlinear shallow water models capture wave dispersion and are attractive for resolving dynamic wave runup and overtopping.

3.2.3. Nonlinear Shallow Water Equations

The nonlinear shallow water equations are a common method of representing wave overtopping. Although the hydrostatic assumption is violated in circumstances where vertical velocity is a significant flow feature, the NLSW equations have proven to be a reasonable approximation in the mid to inner surf zone [191], and represent the majority of overtopping models [121]. Numerous NLSW models have investigated wave runup (e.g., [191,192,193,194]) and overtopping (e.g., [121,136,195,196,197,198,199]). However, a sensitivity to boundary location was observed in multiple studies and careful placement of the boundary is advocated [34,199,200,201,202]. XBeach [203] is a widely used 2D flow and sediment transport model that resolves both infragravity and incident wave forcing. XBeach-Surfbeat solves a time dependent wave action balance that forces a Generalized Lagrangian Mean (GLM) formulation of the nonlinear shallow water equations [203]. XBeach-Nonhydrostatic solves the NLSW equations, and a one-layer, nonhydrostatic pressure correction [204] enables short wave variation in intermediate to shallow depths. XBeach has been used primarily to model erosion, overwash or barrier breaching during storm events (e.g., [203,205,206,207]) and more recently has been used to predict temporally and spatially variable overtopping flows (e.g., [34,73]). XBeach-G [208] is a variant of XBeach developed specifically for gravel beaches, which utilizes the nonhydrostatic flow solver with a groundwater model to simulate infiltration and exfiltration through permeable gravel beds. Similarly, SWASH [130] is a nonhydrostatic shallow water solver which admits multiple layers to account for vertical flow structure and has been used to model overtopping processes [209,210]. Generally, results suggest that NLSW models are capable of predicting mean overtopping rates; however, random wave phasing presents a particular challenge. A number of studies have suggested a sea state of 1000 random waves provides consistent results for a given water level [198,199,202]. Notably, the effect of converging overtopping rates with tidal fluctuations has not been considered.
Overtopping flows are typically transferred to an overland flow solver using an overtopping flow hydrograph from empirical or numerical estimates (e.g., [34,64,73,169]). Although mass is conserved in this coupling, momentum information is lost, potentially impacting the flood description near the overtopped feature and precluding structure wave loading analysis. Elsayed and Oumeraci [73] simulated overtopping, breaching and overflow processes using XBeach and HEC-RAS and reported that hydrograph-transferred flows, which conserve mass but omit momentum, produced higher water depths in the backshores.

3.3. Overtopping Flood Validation

Few studies have attempted to validate wave overtopping volumes in relation to flooding. Laudier et al. [132] presented a quantitative field scale validation of overtopping on a natural beach in Central California, and results suggested that empirical models overestimate overtopping rates. Cheung et al. [135] and Lynett et al. [134] presented numerical overtopping models along with qualitative validation data (e.g., high water marks or levee damage) and in the case of Lynett et al. [134], empirical and numerical estimates differed by a factor of ten. Smith et al. [63] considered a urban coastal flood event along the North Somerset coast in the UK and used point sources to introduce overtopping volumes to the flooding domain, however overtopping rates were not modeled in a prognostic manner, but rather from a post event analysis of the inundation area which revealed the flood volume. Moreover, the analysis suggested significant uncertainty in the overtopping estimate, and the study concluded overtopping volumes are a dominant source of uncertainty relative to flood extent prediction. Gallien [34] collected wave overtopping flood validation data and showed that empirical and numerical estimates performed similarly despite order of magnitude differences in total overtopped volume, suggesting that a few large waves in succession (likely resulting from the combined effects of incident and infragravity waves) dominated backshore flooding. Indeed, wave overtopping is considered a significant deficiency in the current modeling methodology [28,121,122], and multiple studies stress the need for field validation data [29,32,62,168,211,212].

4. Flood Model Evaluation
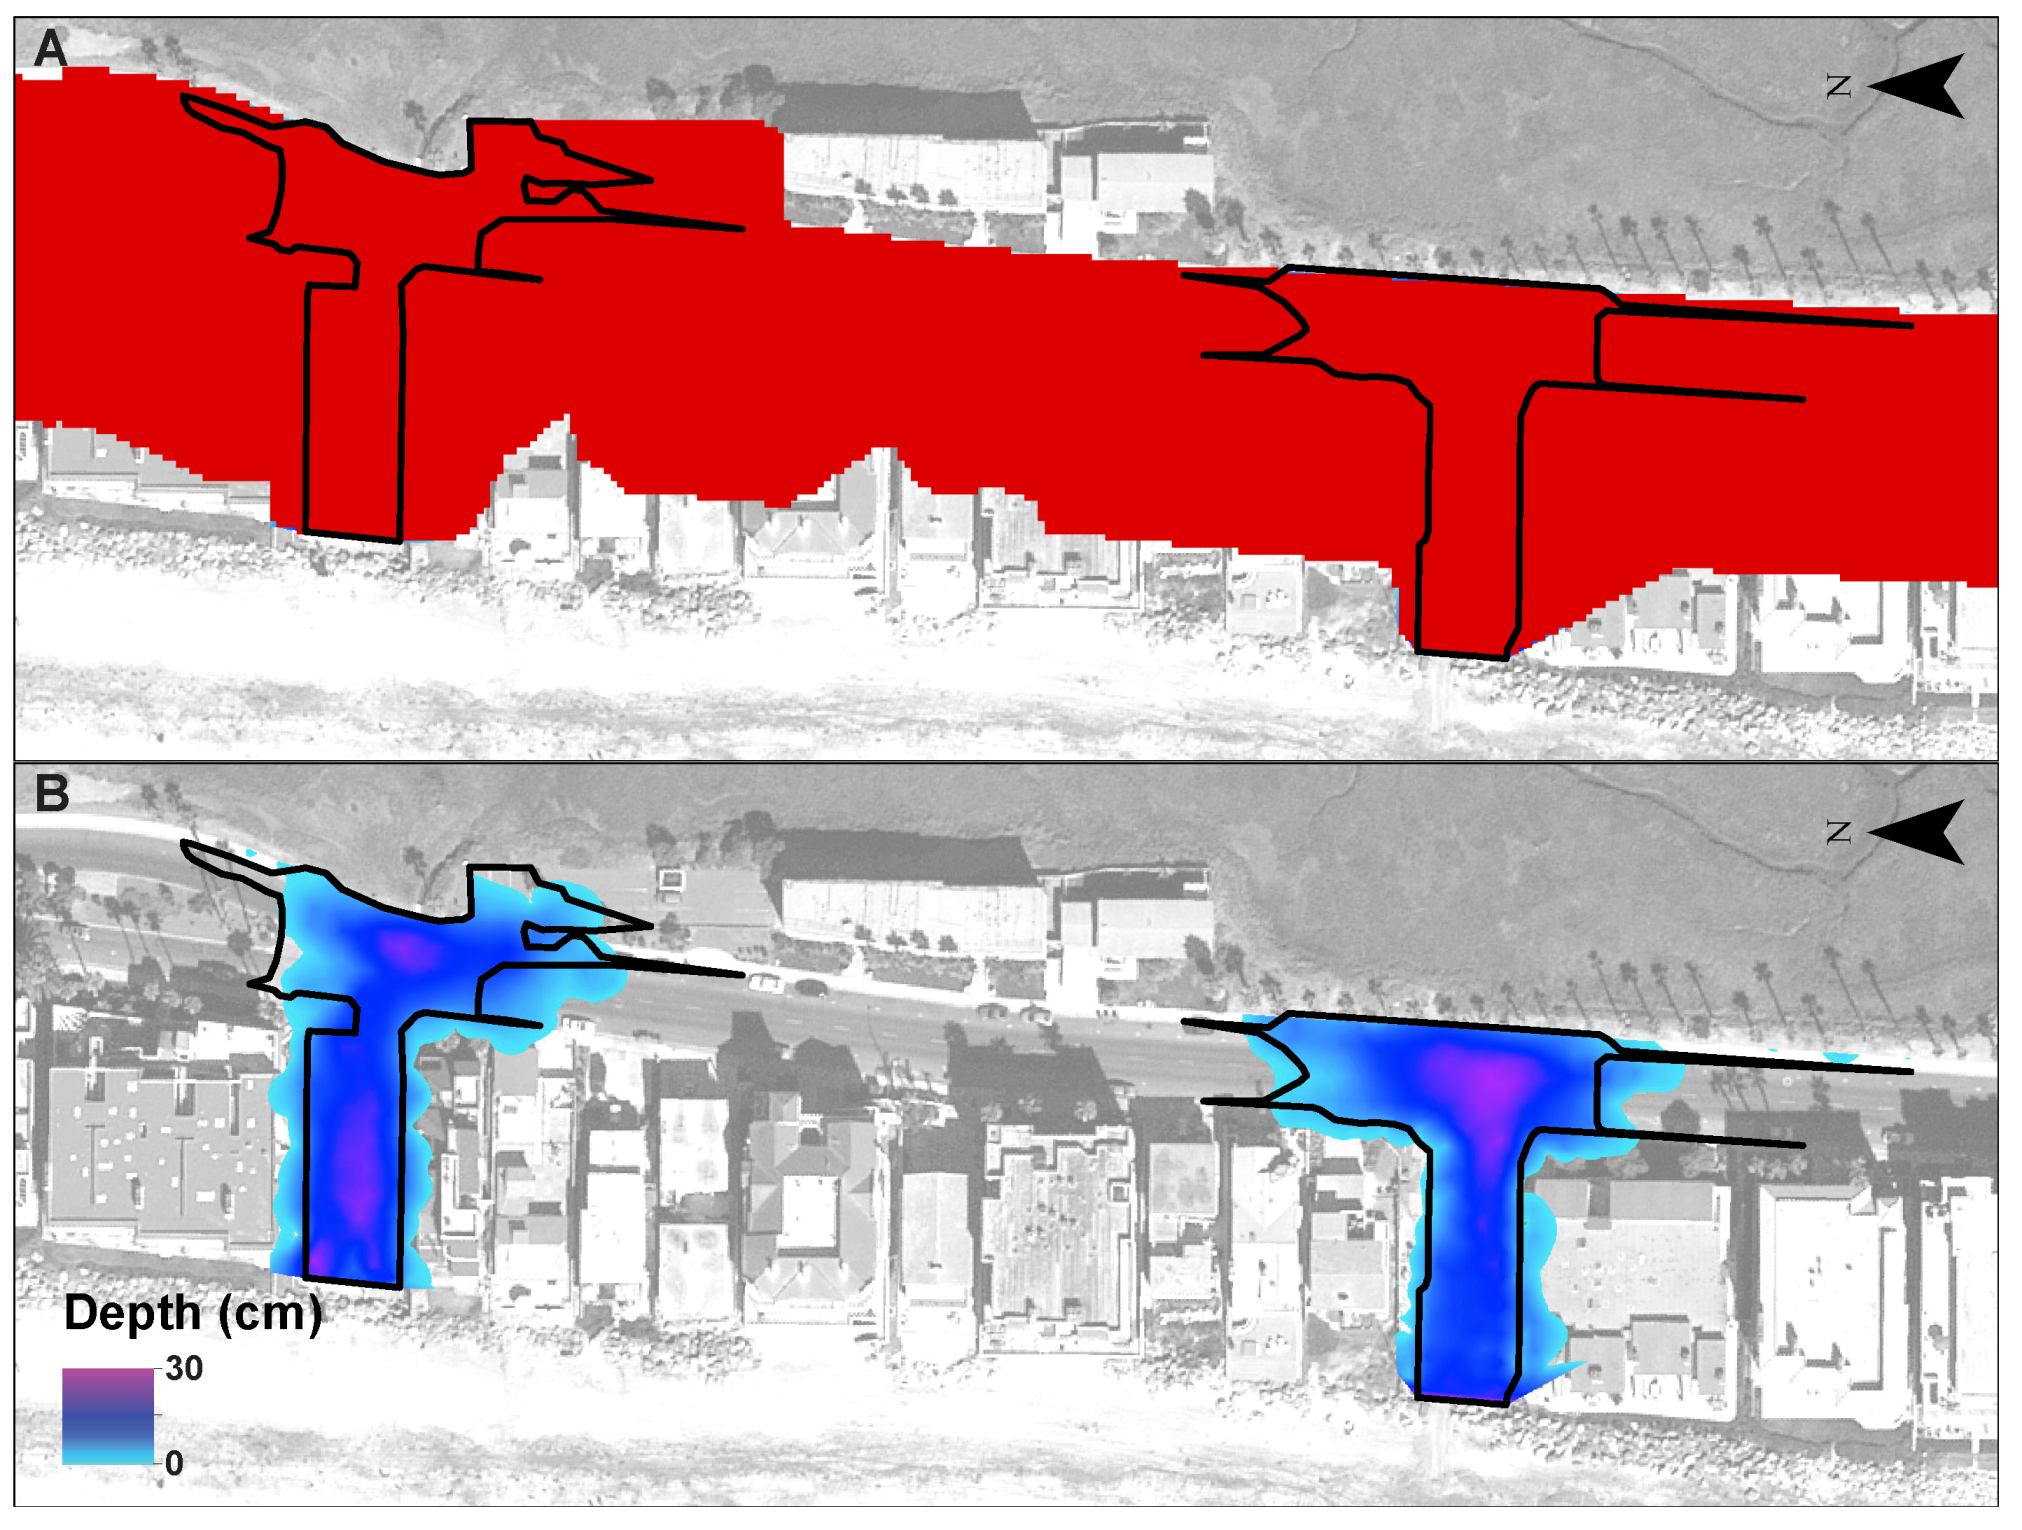
Generally, in coastal flood modeling systems, individual model elements such as water elevation or wave characteristics are validated against a known event (e.g., [33,64,169]). These evaluations, although useful to accurately represent boundary conditions, do not provide flood prediction information. Flood extent, depth, velocity, arrival time and duration are often qualitatively evaluated. Recent technological advances in lower cost sensors, surveying, remote sensing and unmanned aerial observations systems (i.e., drones and UAV) present the opportunity to improve quantitative evaluation of flooding events. Traditionally, flood extent has been used to validate coastal flood models (e.g., [20,21,27,34,62,63,97]).

4.1. Flood Extent

Coastal flood extent model performance has been quantified using overlap [33] or a coefficient of areal correspondence [213]. Overlap represents the fraction of the observed flood that was correctly modeled and is described as,
O v e r l a p = A M A O A O ,
where A O and A M represent the observed and modeled flood extent, respectively. Overlap tests only whether observed flooded areas were predicted and ignores overprediction (e.g., [33]). A fit measure of one shows that all observed flooding was predicted, however does not penalize overprediction, i.e., if a model predicts extensive nonphysical flooding it could still achieve a 1 (i.e, 100%) overlap.
A more robust flood prediction evaluation relies on the coefficient of areal correspondence [213], commonly referred to as fit agreement or F<1>, which represents the intersection of modeled and observed flood extents divided by the union of the predicted and observed flood extent (e.g., green in Figure 3) as follows,
F A = A M A O A M A O .
A fit measure of zero and unity corresponds to no agreement and complete agreement, respectively. Further evaluation of a model can consider a measure of underprediction, F U P , which characterizes the fraction of flooded area observed but not predicted, as follows,
F U P = A O A M A O A M A O .
In this case, a fit measure of zero and unity correspond to no underprediction and complete underprediction, respectively. Lastly, a measure of over overprediction, F O P , characterizes the fraction of flooded area predicted but not observed, as follows,
F O P = A M A M A O A M A O .
In this case, a fit measure of zero and unity corresponds to no overprediction and complete overprediction, respectively. Superior models will maximize F A while minimizing both F U P and F O P .

4.2. Hydrodynamic Validation

Few studies have attempted to hydrodynamically validate flooding. Laudier et al. [132] conducted field observations of a lagoon-filling event but has drawn criticism in the literature [214]. Cheung et al. [135] and Lynett et al. [134] presented numerical overtopping models along with qualitative validation data (e.g., high water marks or levee damage). Smith et al. [63] presented a model that was validated using photos derived of high water marks and eyewitness data. LeRoy et al. [64] used water depth, reported stagnation area and eyewitness reports. However, there are no known quantitative hydrodynamically field-validated coastal flooding models. Multiple studies stress the need for field validation data [21,29,32,168,211,212]. A paucity of in-situ hydrodynamic validation (depth, velocity, flood arrival time) inhibits accurate urban coastal flood modeling and prediction [34,169].

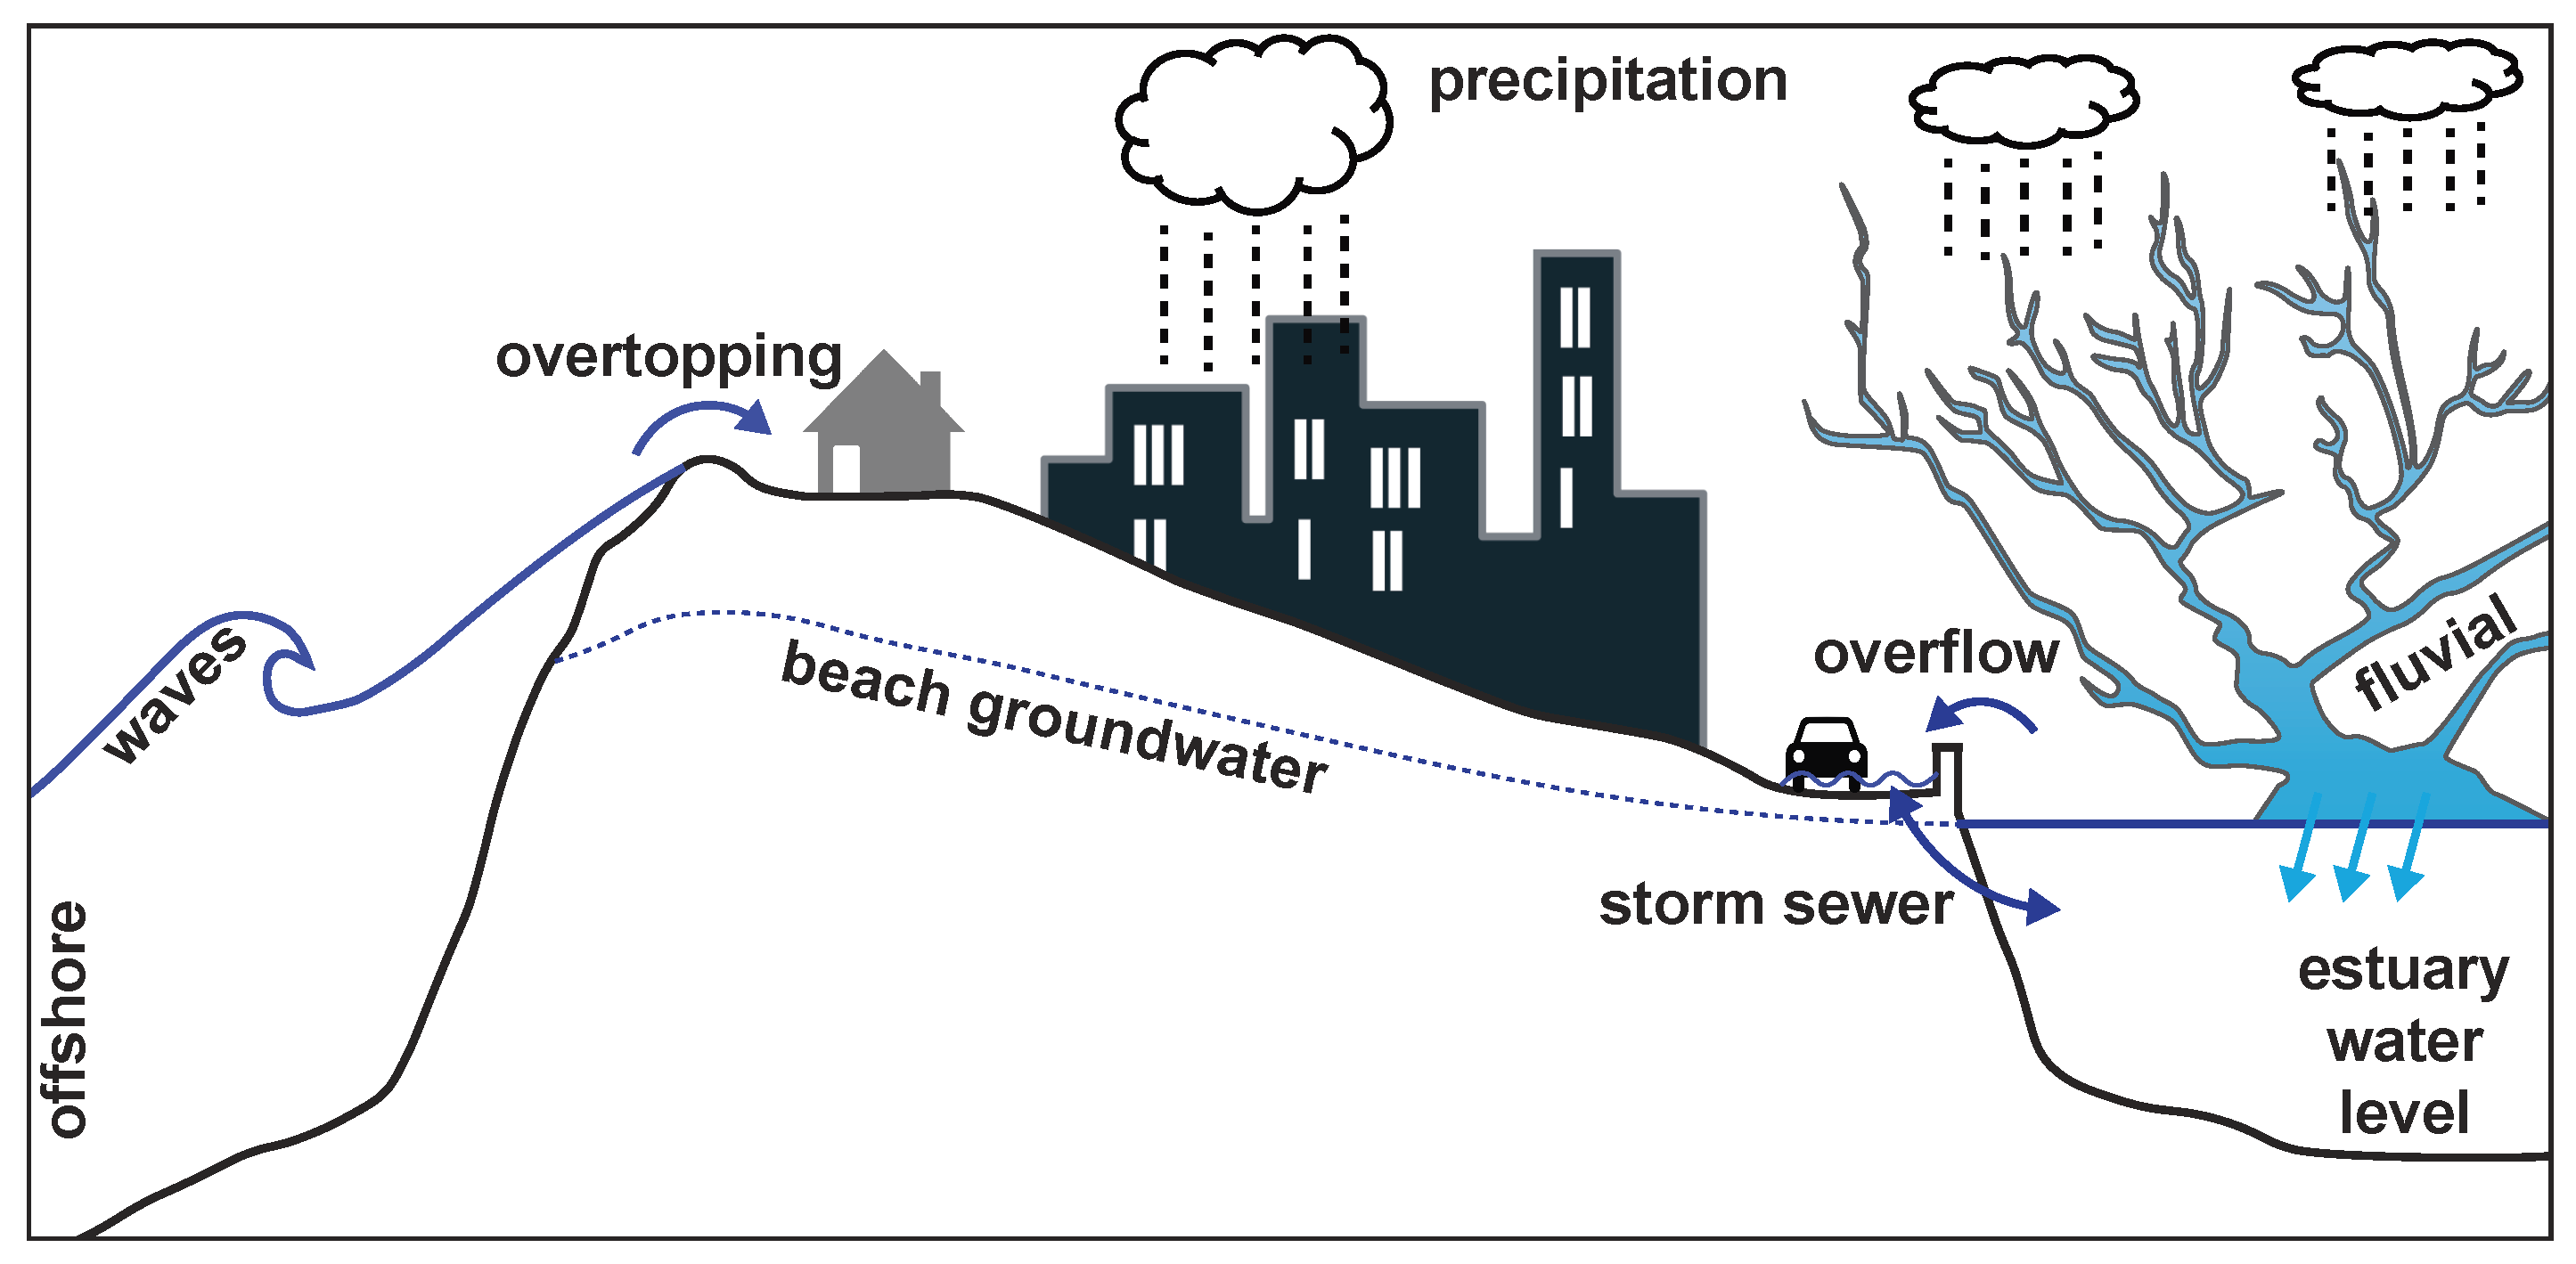
5. Multi-Pathway Flooding

Rising sea levels will challenge low-lying coastal communities necessitating increasingly accurate flood prediction. Neglecting compound impacts may significantly underestimate flood risk, particularly in urban areas [19]. One of the key issues in effective coastal flood prediction is representing the combined effects of oceanic and freshwater forcing along with urban infrastructure that constrain or redistribute water, and integrating structural breaching and failure processes. Careful consideration of future flooding source–receptor pathways is recommended, since mitigating one pathway may exacerbate another (e.g., [21]).
Sea level rise will propagate wave energy shoreward, potentially exposing barrier island communities and urban sand spits to wave overtopping flooding in addition to overflow from high water levels found in inlets and bays. Numerical models (e.g., nonlinear shallow water, Boussinesq, Navier Stokes) reasonably simulate temporally and spatially variable overtopping rates and may be coupled to hydrodynamic models that simulate weir-like overflow and propagate overland flooding (e.g., BreZo, Delft3D, and HEC-RAS). Particular attention should be paid to flow transfer when separate overtopping and overland flow models are used for computational efficiency. Ideally, model development will tightly couple these processes in a computationally efficient way.
In coastal applications, storm system drainage is critical to predicting flood extent for three reasons; (1) bay or ocean water levels may flood low protected backshores through the storm drain outfalls; (2) the storm drain system may redistribute water; and (3) overland flow volumes may be reduced by storm system drainage. Storm system and overland flow are commonly considered in 1D–2D coupling using 1D link-node models such as SWMM coupled to a 2D overland flow solver, but the uncertainty of 1D–2D models has not been well addressed [42].
Compared to marine flooding, groundwater inundation modeling is extremely limited [215,216]. Even in areas where sea level rise may not cause direct groundwater inundation, water tables at shallow and intermediate depths have the potential to jeopardize infrastructure [106], and at locations further inland than coastal surface flooding [105,217,218]. Elsayed and Oumeraci [219] presented a coupled modeling approach to resolve overtopping, overland flow propagation and infiltration impacts on coastal aquifers, and suggested further development is needed to resolve the unsaturated zone and, in turn, the surface–groundwater interaction.

6. Conclusions and Future Work

Nonlinear shallow water models employing shock capturing schemes (e.g., Galerkin and Godunov) have been shown to accurately route overland flow and handle critical flow transitions caused by urban features such as streets, curbs and walls; however, depth and velocity estimates are highly sensitive to terrain and building representation [53,64]. Static (“bathtub”) models perform poorly in defended urban backshore and should be avoided.
High resolution LiDAR-derived DTMs generally represent surface topography, however to accurately route flood flows the modeler must be careful to include fine scale hydraulic features which are un- or under-resolved in the LiDAR data (e.g., seawalls and artificial dunes). Building representation significantly affects velocity estimates [53]. Appropriate site representation often requires extensive site knowledge and additional surveying. A paucity of observational data obstructs accurate flood risk assessment and high quality observational data collections are advocated [93,98]. Flood extent is the most common validation method; however, quantitative in-situ hydrodynamic validation (e.g., depth and velocity) data are urgently needed [34,169].
Wave overtopping is a significant deficiency in current modeling methodologies [28,121,122], and is identified as key future research area [123]. Often, the beach itself is poorly resolved or excludes temporary dune structures, both of which fundamentally alter backshore flood predictions. Static methods are sensitive to freeboard (a function of beach elevations) and cannot represent temporally variable overtopping flows. EurOtop and other empirical models, strictly intended for structures but often used on beaches, can provide temporally variable average overtopping estimates (for varying offshore boundary conditions), however do not resolve impulsive swash event volumes. Flood extent and hydrodynamic differences from average versus impulsive overtopping estimates are not considered in the literature and deserve attention. Numerical models can simulate impulsive, temporally and spatially variable overtopping rates and may be coupled to hydrodynamic models that simulate weir-like overflow and propagate overland flooding. Typically, flows are transferred through one-way coupling using a flow hydrograph which conserves mass but does not consider momentum. Depending on the problem of interest, the modeler is left to decide if a computationally efficient mass conservation one-way coupling is sufficient, or if higher-resolution tightly coupled models are needed. Notably, random wave phase uncertainty affects overtopping volume estimates (particularly with dynamic water levels). Wave overtopping flooding represents a significant modeling challenge and field observations are needed [34].
Compound and multi-pathway flooding are critical to accurately characterize future, non-stationary coastal vulnerability. In estuarine areas, water levels may vary significantly through tidal amplification, tide–surge interactions, and fluvial inputs and should be resolved in flood modeling efforts. Pluvial flows have received only limited attention but are a key component in assessing urban coastal flooding. Nested modeling is the current state-of-the-art for representing local water levels, wave overtopping, overland flow and sewer flows. Ideally, model development will incorporate multiple processes to minimize coupling challenges. Deterministic modeling is necessary to identify dominant flooding pathways and proves helpful in considering particular scenarios, but cannot capture the range of potential coastal flooding hazards. Probabilistic frameworks considering uncertainty and coastal process dependence are recommended. Critically, data and models must be synthesized to explicitly represent all potential flooding source–receptor pathways under future conditions.

Author Contributions

Conceptualization, T.W.G.; methodology, T.W.G.; resources, T.W.G.; writing—original draft preparation, T.W.G.; writing—review and editing, T.W.G., N.K., M.-P.C.D., B.-X.T., J.T.D.L. and M.A.W.; visualization, T.W.G.; supervision, T.W.G.; project administration, T.W.G.; and funding acquisition, T.W.G.

Funding

This research was supported by the US Army Corps of Engineers (W912HZ-14-2-0025) and the California Department of Parks and Recreation, Division of Boating and Waterways Oceanography Program (C1670006).

Acknowledgments

Jochen Schubert, Brian Woodward, Kent Smith, Bill Boyd, Rob Grenzeback, Greg Boyd, and Lucian Parry assisted in field data collections that made this manuscript possible.The authors would like to thank the three anonymous reviewers for their constructive feedback which strengthened this manuscript.

Conflicts of Interest

The authors declare no conflict of interest. The funders had no role in the design of the study; in the collection, analyses, or interpretation of data; in the writing of the manuscript, or in the decision to publish the results.

Abbreviations

The following abbreviations are used in this manuscript:
MDPIMultidisciplinary Digital Publishing Institute
FEMAFederal Emergency Management Agency
DEMDigital Elevation Model
DSMDigital Surface Model
DTMDigital Terrain Model
RTKReal Time Kinematic
TAWTechnical Advisory Committee for Water Retaining Structures
NLSWNonLinear Shallow Water
RANSRaynolds Averaged Navier Stokes
LESLarge Eddy Simulation
SPHSmooth Particly Hydrodynamics
GLMGeneralized Lagrangian Mean

References

  1. Nicholls, R.J. Planning for the impacts of sea level rise. Oceanography 2011, 24, 144–157. [Google Scholar] [CrossRef]
  2. Merkens, J.L.; Reimann, L.; Hinkel, J.; Vafeidis, A.T. Gridded population projections for the coastal zone under the Shared Socioeconomic Pathways. Glob. Planet. Chang. 2016, 145, 57–66. [Google Scholar] [CrossRef]
  3. Church, J.; Clark, P.; Cazenave, A.; Gregory, J.; Jevrejeva, S.; Levermann, A.; Merrifield, M.; Milne, G.; Nerem, R.S.; Nunn, P.; et al. Sea level change. In Climate Change 2013: The Physical Science Basis. Contribution of Working Group I to the Fifth Assessment Report of the Intergovernmental Panel on Climate Chang; Stocker, T.F., Qin, D., Plattner, G.K., Tignor, M., Allen, S., Boschung, J., Nauels, A., Xia, Y., Bex, V., Midgley, P., Eds.; Cambridge University Press: Cambridge, UK; New York, NY, USA, 2013; pp. 1137–1216. [Google Scholar]
  4. Hansen, J.; Sato, M.; Hearty, P.; Ruedy, R.; Kelley, M.; Masson-Delmotte, V.; Russell, G.; Tselioudis, G.; Cao, J.; Rignot, E.; et al. Ice melt, sea level rise and superstorms: Evidence from paleoclimate data, climate modeling, and modern observations that 2C global warming is highly dangerous. Atmos. Chem. Phys. Dis. 2015, 16, 3761–3862. [Google Scholar] [CrossRef]
  5. DeConto, R.M.; Pollard, D. Contribution of Antarctica to past and future sea-level rise. Nature 2016, 531, 591–597. [Google Scholar] [CrossRef] [PubMed]
  6. Carson, M.; Köhl, A.; Stammer, D.; Slangen, A.B.A.; Katsman, C.A.; van de Wal, R.S.W.; Church, J.; White, N. Coastal sea level changes, observed and projected during the 20th and 21st century. Clim. Chang. 2016, 134, 269–281. [Google Scholar] [CrossRef]
  7. Hunter, J. A simple technique for estimating an allowance for uncertain sea-level rise. Clim. Chang. 2012, 113, 239–252. [Google Scholar] [CrossRef]
  8. Sweet, W.V.; Park, J. From the extreme to the mean: Acceleration and tipping points of coastal inundation from sea level rise. Earth’s Future 2014, 2, 579–600. [Google Scholar] [CrossRef] [Green Version]
  9. Fewtrell, T.; Bates, P.D.; Horritt, M.; Hunter, N. Evaluating the effect of scale in flood inundation modelling in urban environments. Hydrol. Process. Int. J. 2008, 22, 5107–5118. [Google Scholar] [CrossRef]
  10. Ntelekos, A.A.; Oppenheimer, M.; Smith, J.A.; Miller, A.J. Urbanization, climate change and flood policy in the United States. Clim. Chang. 2010, 103, 597–616. [Google Scholar] [CrossRef]
  11. Hanson, S.; Nicholls, R.; Ranger, N.; Hallegatte, S.; Corfee-Morlot, J.; Herweijer, C.; Chateau, J. A global ranking of port cities with high exposure to climate extremes. Clim. Chang. 2011, 104, 89–111. [Google Scholar] [CrossRef]
  12. Hallegatte, S.; Green, C.; Nicholls, R.J.; Corfee-Morlot, J. Future flood losses in major coastal cities. Nat. Clim. Chang. 2013, 3, 802. [Google Scholar] [CrossRef]
  13. Hinkel, J.; Lincke, D.; Vafeidis, A.T.; Perrette, M.; Nicholls, R.J.; Tol, R.S.; Marzeion, B.; Fettweis, X.; Ionescu, C.; Levermann, A. Coastal flood damage and adaptation costs under 21st century sea-level rise. Proc. Natl. Acad. Sci. USA 2014, 111, 3292–3297. [Google Scholar] [CrossRef] [PubMed] [Green Version]
  14. Prime, T.; Brown, J.M.; Plater, A.J. Physical and economic impacts of sea-level rise and low probability flooding events on coastal communities. PLoS ONE 2015, 10, e0117030. [Google Scholar] [CrossRef] [PubMed]
  15. Wahl, T.; Jain, S.; Bender, J.; Meyers, S.D.; Luther, M.E. Increasing risk of compound flooding from storm surge and rainfall for major US cities. Nat. Clim. Chang. 2015, 5, 1093. [Google Scholar] [CrossRef]
  16. Divoky, D.; Battalio, R.; Dean, B.; Collins, I.; Hatheway, D.; Scheffner, N. Storm Meteorology. FEMA Coastal Flood Hazard Analysis and Mapping Guidelines, Focused Study Report; Technical Report, FEMA Tech. Rep; Federal Emergency Management Agency: Washington, DC, USA, 2005.
  17. Glahn, B.; Taylor, A.; Kurkowski, N.; Shaffer, W.A. The role of the SLOSH model in National Weather Service storm surge forecasting. Natl. Weather Digest 2009, 33, 3–14. [Google Scholar]
  18. Zheng, F.; Westra, S.; Sisson, S.A. Quantifying the dependence between extreme rainfall and storm surge in the coastal zone. J. Hydrol. 2013, 505, 172–187. [Google Scholar] [CrossRef]
  19. Moftakhari, H.R.; Salvadori, G.; AghaKouchak, A.; Sanders, B.F.; Matthew, R.A. Compounding effects of sea level rise and fluvial flooding. Proc. Natl. Acad. Sci. USA 2017, 114, 9785–9790. [Google Scholar] [CrossRef] [Green Version]
  20. Gallien, T.; Schubert, J.; Sanders, B. Predicting tidal flooding of urbanized embayments: A modeling framework and data requirements. Coast. Eng. 2011, 58, 567–577. [Google Scholar] [CrossRef]
  21. Gallien, T.; Sanders, B.; Flick, R. Urban coastal flood prediction: Integrating wave overtopping, flood defenses and drainage. Coast. Eng. 2014, 91, 18–28. [Google Scholar] [CrossRef]
  22. Ramirez, J.A.; Lichter, M.; Coulthard, T.J.; Skinner, C. Hyper-resolution mapping of regional storm surge and tide flooding: Comparison of static and dynamic models. Nat. Hazards 2016, 82, 571–590. [Google Scholar] [CrossRef]
  23. Purvis, M.J.; Bates, P.D.; Hayes, C.M. A probabilistic methodology to estimate future coastal flood risk due to sea level rise. Coast. Eng. 2008, 55, 1062–1073. [Google Scholar] [CrossRef]
  24. Vousdoukas, M.I.; Voukouvalas, E.; Mentaschi, L.; Dottori, F.; Giardino, A.; Bouziotas, D.; Bianchi, A.; Salamon, P.; Feyen, L. Developments in large-scale coastal flood hazard mapping. Nat. Hazards Earth Syst. Sci. 2016, 16, 1841–1853. [Google Scholar] [CrossRef] [Green Version]
  25. Vousdoukas, M.I.; Mentaschi, L.; Voukouvalas, E.; Verlaan, M.; Jevrejeva, S.; Jackson, L.P.; Feyen, L. Global probabilistic projections of extreme sea levels show intensification of coastal flood hazard. Nat. Commun. 2018, 9, 2360. [Google Scholar] [CrossRef] [PubMed]
  26. Rueda, A.; Vitousek, S.; Camus, P.; Tomás, A.; Espejo, A.; Losada, I.J.; Barnard, P.L.; Erikson, L.H.; Ruggiero, P.; Reguero, B.G.; et al. A global classification of coastal flood hazard climates associated with large-scale oceanographic forcing. Sci. Rep. 2017, 7, 5038. [Google Scholar] [CrossRef] [PubMed]
  27. Bates, P.D.; Dawson, R.J.; Hall, J.W.; Horritt, M.S.; Nicholls, R.J.; Wicks, J.; Hassan, M.A.A.M. Simplified two-dimensional numerical modelling of coastal flooding and example applications. Coast. Eng. 2005, 52, 793–810. [Google Scholar] [CrossRef]
  28. Brown, J.D.; Spencer, T.; Moeller, I. Modeling storm surge flooding of an urban area with particular reference to modeling uncertainties: A case study of Canvey Island, United Kingdom. Water Resour. Res. 2007, 43, W06402. [Google Scholar] [CrossRef]
  29. Poulter, B.; Halpin, P.N. Raster modelling of coastal flooding from sea-level rise. Int. J. Geogr. Inf. Sci. 2008, 22, 167–182. [Google Scholar] [CrossRef]
  30. Dawson, R.J.; Dickson, M.E.; Nicholls, R.J.; Hall, J.W.; Walkden, M.J.; Stansby, P.K.; Mokrech, M.; Richards, J.; Zhou, J.; Milligan, J.; et al. Integrated analysis of risks of coastal flooding and cliff erosion under scenarios of long term change. Clim. Chang. 2009, 95, 249–288. [Google Scholar] [CrossRef] [Green Version]
  31. Martinelli, L.; Zanuttigh, B.; Corbau, C. Assessment of coastal flooding hazard along the Emilia Romagna littoral, IT. Coast. Eng. 2010, 57, 1042–1058. [Google Scholar] [CrossRef]
  32. Anselme, B.; Durand, P.; Thomas, Y.F.; Nicolae-Lerma, A. Storm extreme levels and coastal flood hazards: A parametric approach on the French coast of Languedoc (district of Leucate). C. R. Geosci. 2011, 343, 677–690. [Google Scholar] [CrossRef]
  33. Barnard, P.L.; van Ormondt, M.; Erikson, L.H.; Eshleman, J.; Hapke, C.; Ruggiero, P.; Adams, P.N.; Foxgrover, A.C. Development of the Coastal Storm Modeling System (CoSMoS) for predicting the impact of storms on high-energy, active-margin coasts. Nat. Hazards 2014, 74, 1095–1125. [Google Scholar] [CrossRef]
  34. Gallien, T. Validated coastal flood modeling at Imperial Beach, California: Comparing total water level, empirical and numerical overtopping methodologies. Coast. Eng. 2016, 111, 95–104. [Google Scholar] [CrossRef]
  35. O’Neill, A.C.; Erikson, L.H.; Barnard, P.L.; Limber, P.W.; Vitousek, S.; Warrick, J.A.; Foxgrover, A.C.; Lovering, J. Projected 21st Century Coastal Flooding in the Southern California Bight. Part 1: Development of the Third Generation CoSMoS Model. J. Mar. Sci. Eng. 2018, 6, 59. [Google Scholar] [CrossRef]
  36. Merz, B.; Kreibich, H.; Thieken, A.; Schmidtke, R. Estimation uncertainty of direct monetary flood damage to buildings. Nat. Hazards Earth Syst. Sci. 2004, 4, 153–163. [Google Scholar] [CrossRef] [Green Version]
  37. Heberger, M.; Cooley, H.; Herrera, P.; Gleick, P.H.; Moore, E. The Impacts of Sea-Level Rise on the California Coast; California Climate Change Center: Sacramento, CA, USA, 2009.
  38. Barredo, J.I.; Engelen, G. Land use scenario modeling for flood risk mitigation. Sustainability 2010, 2, 1327–1344. [Google Scholar] [CrossRef]
  39. Marcy, D.; Brooks, W.; Draganov, K.; Hadley, B.; Haynes, C.; Herold, N.; McCombs, J.; Pendleton, M.; Ryan, S.; Schmid, K.; et al. New mapping tool and techniques for visualizing sea level rise and coastal flooding impacts. In Solutions to Coastal Disasters 2011; American Society of Civil Engineers: Reston, VA, USA, 2011; pp. 474–490. [Google Scholar]
  40. Bates, P.D.; Horritt, M.S.; Fewtrell, T.J. A simple inertial formulation of the shallow water equations for efficient two-dimensional flood inundation modelling. J. Hydrol. 2010, 387, 33–45. [Google Scholar] [CrossRef]
  41. Bernatchez, P.; Fraser, C.; Lefaivre, D.; Dugas, S. Integrating anthropogenic factors, geomorphological indicators and local knowledge in the analysis of coastal flooding and erosion hazards. Ocean Coast. Manag. 2011, 54, 621–632. [Google Scholar] [CrossRef]
  42. Sanders, B.F. Hydrodynamic modeling of urban flood flows and disaster risk reduction. In Oxford Research Encyclopedia of Natural Hazard Science; Oxford University Press: New York, NY, USA, 2017. [Google Scholar]
  43. Hunter, N.M.; Horritt, M.S.; Bates, P.D.; Wilson, M.D.; Werner, M.G. An adaptive time step solution for raster-based storage cell modelling of floodplain inundation. Adv. Water Resour. 2005, 28, 975–991. [Google Scholar] [CrossRef]
  44. Hunter, N.; Bates, P.; Neelz, S.; Pender, G.; Villanueva, I.; Wright, N.; Liang, D.; Falconer, R.A.; Lin, B.; Waller, S.; et al. Benchmarking 2D hydraulic models for urban flood simulations. Proc. Inst. Civ. Eng. Waste Resour. Manag. 2008, 161, 13–30. [Google Scholar] [CrossRef]
  45. Neal, J.; Villanueva, I.; Wright, N.; Willis, T.; Fewtrell, T.; Bates, P. How much physical complexity is needed to model flood inundation? Hydrol. Process. 2012, 26, 2264–2282. [Google Scholar] [CrossRef]
  46. Neal, J.; Dunne, T.; Sampson, C.; Smith, A.; Bates, P. Optimisation of the two-dimensional hydraulic model LISFOOD-FP for CPU architecture. Environ. Model. Softw. 2018, 107, 148–157. [Google Scholar] [CrossRef]
  47. Mignot, E.; Paquier, A.; Haider, S. Modeling floods in a dense urban area using 2D shallow water equations. J. Hydrol 2006, 327, 186–199. [Google Scholar] [CrossRef] [Green Version]
  48. Gallegos, H.A.; Schubert, J.E.; Sanders, B.F. Two-dimensional, high-resolution modeling of urban dam-break flooding: A case study of Baldwin Hills, California. Adv. Water Resour. 2009, 32, 1323–1335. [Google Scholar] [CrossRef]
  49. Teng, J.; Jakeman, A.; Vaze, J.; Croke, B.; Dutta, D.; Kim, S. Flood inundation modelling: A review of methods, recent advances and uncertainty analysis. Environ. Model. Softw. 2017, 90, 201–216. [Google Scholar] [CrossRef]
  50. Arega, F.; Sanders, B.F. Dispersion model for tidal wetlands. J. Hydraul. Eng. 2004, 130, 739–754. [Google Scholar] [CrossRef]
  51. Cea, L.; French, J.; Vázquez-Cendón, M. Numerical modelling of tidal flows in complex estuaries including turbulence: An unstructured finite volume solver and experimental validation. Int. J. Numer. Methods Eng. 2006, 67, 1909–1932. [Google Scholar] [CrossRef]
  52. Sanders, B.F.; Schubert, J.E.; Gallegos, H.A. Integral formulation of shallow-water equations with anisotropic porosity for urban flood modeling. J. Hydrol. 2008, 362, 19–38. [Google Scholar] [CrossRef]
  53. Schubert, J.E.; Sanders, B.F. Building treatments for urban flood inundation models and implications for predictive skill and modeling efficiency. Adv. Water Resour. 2012, 41, 49–64. [Google Scholar] [CrossRef]
  54. Schubert, J.E.; Sanders, B.F.; Smith, M.J.; Wright, N.G. Unstructured mesh generation and landcover-based resistance for hydrodynamic modeling of urban flooding. Adv. Water Res. 2008, 31, 1603–1621. [Google Scholar] [CrossRef]
  55. Villaneueva, I.; Wright, N. Linking Riemann and storage cell methods for flood predictions. Proc. Inst. Civ. Eng. Waste Resour. Manag. 2006, 159, 27–33. [Google Scholar] [CrossRef]
  56. Sanders, B.F. Evaluation of on-line DEMs for flood inundation modeling. Adv. Water Res. 2007, 30, 1831–1843. [Google Scholar] [CrossRef]
  57. Bates, P.; Anderson, M.; Hervouet, J.M.; Hawkes, J. Investigating the behaviour of two-dimensional finite element models of compound channel flow. Earth Surf. Process. Landf. J. Br. Geomorphol. Group 1997, 22, 3–17. [Google Scholar] [CrossRef]
  58. Colby, J.D.; Dobson, J.G. Flood modeling in the coastal plains and mountains: Analysis of terrain resolution. Nat. Hazards Rev. 2010, 11, 19–28. [Google Scholar] [CrossRef]
  59. Gesch, D.B. Analysis of lidar elevation data for improved identification and delineation of lands vulnerable to sea-level rise. J. Coast. Res. 2009, 49–58. [Google Scholar] [CrossRef]
  60. Néelz, S.; Pender, G.; Villanueva, I.; Wilson, M.; Wright, N.; Bates, P.; Mason, D.; Whitlow, C. Using remotely sensed data to support flood modelling. Proc. Inst. Civ. Eng. Waste Resour. Manag. 2006, 159, 35–43. [Google Scholar] [CrossRef]
  61. Webster, T.L.; Forbes, D.L.; Dickie, S.; Shreenan, R. Using topographic lidar to map flood risk from storm-surge events for Charlottetown, Prince Edward Island, Canada. Can. J. Remote Sens. 2004, 30, 64–76. [Google Scholar] [CrossRef]
  62. Gallien, T.W.; Barnard, P.L.; van Ormondt, M.; Foxgrover, A.C.; Sanders, B.F. A parcel-scale coastal flood forecasting prototype for a Southern California urbanized embayment. J. Coast. Res. 2012, 29, 642–656. [Google Scholar] [CrossRef]
  63. Smith, R.A.; Bates, P.D.; Hayes, C. Evaluation of a coastal flood inundation model using hard and soft data. Environ. Modell. Softw. 2012, 30, 35–46. [Google Scholar] [CrossRef]
  64. LeRoy, S.L.; Pedreros, R.; André, C.; Paris, F.; Lecacheux, S.; Marche, F.; Vinchon, C. Coastal flooding of urban areas by overtopping: Dynamic modelling application to the Johanna storm (2008) in Gâvres (France). Nat. Hazards Earth Syst. Sci. 2015, 15, 2497–2510. [Google Scholar] [CrossRef]
  65. Liang, D.; Falconer, R.A.; Lin, B. Coupling surface and subsurface flows in a depth averaged flood wave model. J. Hydrol. 2007, 337, 147–158. [Google Scholar] [CrossRef]
  66. Yamashita, K.; Suppasri, A.; Oishi, Y.; Imamura, F. Development of a Tsunami Inundation Analysis Model for Urban Areas Using a Porous Body Model. Geosciences 2018, 8, 12. [Google Scholar] [CrossRef]
  67. Baba, T.; Takahashi, N.; Kaneda, Y.; Inazawa, Y.; Kikkojin, M. Tsunami Inundation Modeling of the 2011 Tohoku Earthquake Using Three-Dimensional Building Data for Sendai, Miyagi Prefecture, Japan. In Tsunami Events and Lessons Learned: Environmental and Societal Significance; Kontar, Y., Santiago-Fandiño, V., Takahashi, T., Eds.; Springer: Dordrecht, The Netherlands, 2014; pp. 89–98. [Google Scholar]
  68. Henonin, J.; Russo, B.; Mark, O.; Gourbesville, P. Real-time urban flood forecasting and modelling–a state of the art. J. Hydroinform. 2013, 15, 717–736. [Google Scholar] [CrossRef]
  69. Rossman, L.; Huber, W. Storm Water Management Model (SWMM). User Manu. Version 2016, 5, 22. [Google Scholar]
  70. Fewtrell, T.J.; Duncan, A.; Sampson, C.C.; Neal, J.C.; Bates, P.D. Benchmarking urban flood models of varying complexity and scale using high resolution terrestrial LiDAR data. Phys. Chem. Earth 2011, 36, 281–291. [Google Scholar] [CrossRef]
  71. Sampson, C.C.; Fewtrell, T.J.; Duncan, A.; Shaad, K.; Horritt, M.S.; Bates, P.D. Use of terrestrial laser scanning data to drive decimetric resolution urban inundation models. Adv. Water Res. 2012, 41, 1–17. [Google Scholar] [CrossRef]
  72. Harley, M.D.; Ciavola, P. Managing local coastal inundation risk using real-time forecasts and artificial dune placements. Coast. Eng. 2013, 77, 77–90. [Google Scholar] [CrossRef]
  73. Elsayed, S.M.; Oumeraci, H. Combined modelling of coastal barrier breaching and induced flood propagation using XBeach. Hydrology 2016, 3, 32. [Google Scholar] [CrossRef]
  74. Phillips, B.T.; Brown, J.M.; Bidlot, J.R.; Plater, A.J. Role of beach morphology in wave overtopping hazard assessment. J. Mar. Sci. Eng. 2017, 5, 1. [Google Scholar] [CrossRef]
  75. Gallien, T.; O’Reilly, W.; Flick, R.; Guza, R. Geometric properties of anthropogenic flood control berms on southern California beaches. Ocean Coast. Manag. 2015, 105, 35–47. [Google Scholar] [CrossRef]
  76. Wells, J.T.; McNinch, J. Beach scraping in North Carolina with special reference to its effectiveness during Hurricane Hugo. J. Coast. Res. 1991, 8, 249–261. [Google Scholar]
  77. Clark, R. Hurricane dennis supplemental damage assessment report: Impact of hurricane dennis on dog island and discussion of post-storm recovery responses. In Florida Department of Environmental Protection, Division of Water Resource Management, Bureau of Beaches and Coastal Systems; Florida Department of Environmental Protection: Tallahassee, FL, USA, 2005. [Google Scholar]
  78. Carley, J.T.; Shand, T.; Coghlan, I.; Blacka, M.; Cox, R.; Littman, A.; Fitzgibbon, B.; McLean, G.; Watson, P. Beach scraping as a coastal management option. In Proceedings of the 19th NSW Coastal Conference, Ballina, NSW, Australia, 10–12 November 2010. [Google Scholar]
  79. Rogers, J.; Research, C.I.; Association, I. Beach Management Manual; CIRIA Report; Construction Industry Research and Information Association: London, UK, 2010. [Google Scholar]
  80. Kratzmann, M.G.; Hapke, C.J. Quantifying anthropogenically driven morphologic changes on a barrier island: Fire Island National Seashore, New York. J. Coast. Res. 2010, 28, 76–88. [Google Scholar] [CrossRef]
  81. Coveney, S.; Fotheringham, A.S. The impact of DEM data source on prediction of flooding and erosion risk due to sea-level rise. Int. J. Geogr. Inf. Sci. 2011, 25, 1191–1211. [Google Scholar] [CrossRef]
  82. Kirshen, P.; Knee, K.; Ruth, M. Climate change and coastal flooding in Metro Boston: Impacts and adaptation strategies. Clim. Chang. 2008, 90, 453–473. [Google Scholar] [CrossRef]
  83. Yin, J.; Yin, Z.E.; Hu, X.M.; Xu, S.Y.; Wang, J.; Li, Z.H.; Zhong, H.D.; Gan, F.B. Multiple scenario analyses forecasting the confounding impacts of sea level rise and tides from storm induced coastal flooding in the city of Shanghai, China. Environ. Earth Sci. 2011, 63, 407–414. [Google Scholar] [CrossRef]
  84. Strauss, B.H.; Ziemlinski, R.; Weiss, J.L.; Overpeck, J.T. Tidally adjusted estimates of topographic vulnerability to sea level rise and flooding for the contiguous United States. Environ. Res. Lett. 2012, 7, 014033. [Google Scholar] [CrossRef] [Green Version]
  85. Kopp, R.E.; Horton, R.M.; Little, C.M.; Mitrovica, J.X.; Oppenheimer, M.; Rasmussen, D.; Strauss, B.H.; Tebaldi, C. Probabilistic 21st and 22nd century sea-level projections at a global network of tide-gauge sites. Earth Future 2014, 2, 383–406. [Google Scholar] [CrossRef] [Green Version]
  86. Knowles, N. Potential Inundation due to Rising Sea Levels in the San Francisco Bay Region; California Climate Change Center: Sacramento, CA, USA, 2010.
  87. Lyddon, C.; Brown, J.M.; Leonardi, N.; Plater, A.J. Uncertainty in estuarine extreme water level predictions due to surge-tide interaction. PLoS ONE 2018, 13, e0206200. [Google Scholar] [CrossRef]
  88. Svensson, C.; Jones, D.A. Dependence between sea surge, river flow and precipitation in south and west Britain. Hydrol. Earth Syst. Sci. 2004, 8, 973–992. [Google Scholar] [CrossRef] [Green Version]
  89. Chen, W.B.; Liu, W.C. Modeling flood inundation induced by river flow and storm surges over a river basin. Water 2014, 6, 3182–3199. [Google Scholar] [CrossRef]
  90. Orton, P.; Georgas, N.; Blumberg, A.; Pullen, J. Detailed modeling of recent severe storm tides in estuaries of the New York City region. J. Geophys. Res. Oceans 2012, 117, C09030. [Google Scholar] [CrossRef]
  91. Maskell, J.; Horsburgh, K.; Lewis, M.; Bates, P. Investigating River–Surge Interaction in Idealised Estuaries. J. Coast. Res. 2013, 30, 248–259. [Google Scholar] [CrossRef]
  92. Ward, P.J.; Couasnon, A.; Eilander, D.; Haigh, I.D.; Hendry, A.; Muis, S.; Veldkamp, T.I.; Winsemius, H.C.; Wahl, T. Dependence between high sea-level and high river discharge increases flood hazard in global deltas and estuaries. Environ. Res. Lett. 2018, 13, 084012. [Google Scholar] [CrossRef]
  93. Kumbier, K.; Cabral Carvalho, R.; Vafeidis, A.T.; Woodroffe, C.D. Investigating compound flooding in an estuary using hydrodynamic modelling: A case study from the Shoalhaven River, Australia. Nat. Hazards Earth Syst. Sci. 2018, 18, 463–477. [Google Scholar] [CrossRef]
  94. Joyce, J.; Chang, N.B.; Harji, R.; Ruppert, T.; Singhofen, P. Cascade impact of hurricane movement, storm tidal surge, sea level rise and precipitation variability on flood assessment in a coastal urban watershed. Clim. Dyn. 2018, 51, 383–409. [Google Scholar] [CrossRef]
  95. Olbert, A.I.; Comer, J.; Nash, S.; Hartnett, M. High-resolution multi-scale modelling of coastal flooding due to tides, storm surges and rivers inflows. A Cork City example. Coast. Eng. 2017, 121, 278–296. [Google Scholar] [CrossRef]
  96. Ikeuchi, H.; Hirabayashi, Y.; Yamazaki, D.; Muis, S.; Ward, P.J.; Winsemius, H.C.; Verlaan, M.; Kanae, S. Compound simulation of fluvial floods and storm surges in a global coupled river-coast flood model: Model development and its application to 2007 Cyclone Sidr in Bangladesh. J. Adv. Model. Earth Syst. 2017, 9, 1847–1862. [Google Scholar] [CrossRef]
  97. Saleh, F.; Ramaswamy, V.; Wang, Y.; Georgas, N.; Blumberg, A.; Pullen, J. A multi-scale ensemble-based framework for forecasting compound coastal-riverine flooding: The Hackensack-Passaic watershed and Newark Bay. Adv. Water Res. 2017, 110, 371–386. [Google Scholar] [CrossRef]
  98. Molinari, D.; De Bruijn, K.M.; Castillo-Rodríguez, J.T.; Aronica, G.T.; Bouwer, L.M. Validation of flood risk models: Current practice and possible improvements. Int. J. Dis. Risk 2018. [Google Scholar] [CrossRef]
  99. Archetti, R.; Bolognesi, A.; Casadio, A.; Maglionico, M. Development of flood probability charts for urban drainage network in coastal areas through a simplified joint assessment approach. Hydrol. Earth Syst. Sci. 2011, 15, 3115–3122. [Google Scholar] [CrossRef] [Green Version]
  100. Lian, J.; Xu, K.; Ma, C. Joint impact of rainfall and tidal level on flood risk in a coastal city with a complex river network: A case study of Fuzhou City, China. Hydrol. Earth Syst. Sci. 2013, 17, 679. [Google Scholar] [CrossRef]
  101. Cheng, H.P.; Cheng, J.R.C.; Hunter, R.M.; Lin, H.C. Demonstration of a Coupled Watershed-Nearshore Model; Technical Report; Engineer Research and Development Center: Vicksburg, MS, USA, 2010. [Google Scholar]
  102. Tang, H.; Kraatz, S.; Wu, X.; Cheng, W.; Qu, K.; Polly, J. Coupling of shallow water and circulation models for prediction of multiphysics coastal flows: Method, implementation, and experiment. Ocean Eng. 2013, 62, 56–67. [Google Scholar] [CrossRef]
  103. Thompson, C.M.; Frazier, T.G. Deterministic and probabilistic flood modeling for contemporary and future coastal and inland precipitation inundation. Appl. Geogr. 2014, 50, 1–14. [Google Scholar] [CrossRef]
  104. Horn, D.P. Measurements and modelling of beach groundwater flow in the swash-zone: A review. Cont. Shelf Res. 2006, 26, 622–652. [Google Scholar] [CrossRef]
  105. Bjerklie, D.M.; Mullaney, J.R.; Stone, J.R.; Skinner, B.J.; Ramlow, M.A. Preliminary Investigation of the Effects of Sea-Level Rise on Groundwater Levels in New Haven, Connecticut; Technical Report; US Geological Survey: Reston, VA, USA, 2012. [Google Scholar]
  106. Rotzoll, K.; Fletcher, C.H. Assessment of groundwater inundation as a consequence of sea-level rise. Nat. Clim. Chang. 2013, 3, 477. [Google Scholar] [CrossRef]
  107. Hoover, D.J.; Odigie, K.O.; Swarzenski, P.W.; Barnard, P. Sea-level rise and coastal groundwater inundation and shoaling at select sites in California, USA. J. Hydrol. Reg. Stud. 2017, 11, 234–249. [Google Scholar] [CrossRef]
  108. Grant, U. Influence of the Water Table on Beach Aggradation and Degradation. J. Mar. Res. 1948, 7, 655–660. [Google Scholar]
  109. Puleo, J.A.; Lanckriet, T.; Wang, P. Near bed cross-shore velocity profiles, bed shear stress and friction on the foreshore of a microtidal beach. Coast. Eng. 2012, 68, 6–16. [Google Scholar] [CrossRef]
  110. Grant, U. Effect of ground-water table on beach erosion. Geol. Soc. Am. Bull. 1946, 57, 1252. [Google Scholar]
  111. Turner, I.L.; Coates, B.P.; Acworth, R.I. Tides, waves and the super-elevation of groundwater at the coast. J. Coast. Res. 1997, 46–60. [Google Scholar]
  112. Heiss, J.W.; Puleo, J.A.; Ullman, W.J.; Michael, H.A. Coupled surface-subsurface hydrologic measurements reveal infiltration, recharge, and discharge dynamics across the swash zone of a sandy beach. Water Resour. Res. 2015, 51, 8834–8853. [Google Scholar] [CrossRef]
  113. Bakhtyar, R.; Brovelli, A.; Barry, D.A.; Li, L. Wave-induced water table fluctuations, sediment transport and beach profile change: Modeling and comparison with large-scale laboratory experiments. Coast. Eng. 2011, 58, 103–118. [Google Scholar] [CrossRef] [Green Version]
  114. Pintado-Patiño, J.C.; Torres-Freyermuth, A.; Puleo, J.A.; Pokrajac, D. On the role of infiltration and exfiltration in swash zone boundary layer dynamics. J. Geophys. Res. C Oceans 2015, 120, 6329–6350. [Google Scholar] [CrossRef] [Green Version]
  115. Habel, S.; Fletcher, C.H.; Rotzoll, K.; El-Kadi, A.I. Development of a model to simulate groundwater inundation induced by sea-level rise and high tides in Honolulu, Hawaii. Water Res. 2017, 114, 122–134. [Google Scholar] [CrossRef] [PubMed]
  116. Arns, A.; Dangendorf, S.; Jensen, J.; Talke, S.; Bender, J.; Pattiaratchi, C. Sea-level rise induced amplification of coastal protection design heights. Sci. Rep. 2017, 7, 40171. [Google Scholar] [CrossRef] [PubMed] [Green Version]
  117. Altomare, C.; Suzuki, T.; Chen, X.; Verwaest, T.; Kortenhaus, A. Wave overtopping of sea dikes with very shallow foreshores. Coast. Eng. 2016, 116, 236–257. [Google Scholar] [CrossRef]
  118. Etemad-Shahidi, A.; Shaeri, S.; Jafari, E. Prediction of wave overtopping at vertical structures. Coast. Eng. 2016, 109, 42–52. [Google Scholar] [CrossRef]
  119. Formentin, S.M.; Zanuttigh, B.; van der Meer, J.W. A neural network tool for predicting wave reflection, overtopping and transmission. Coast. Eng. J. 2017, 59, 1750006. [Google Scholar] [CrossRef]
  120. Van der Meer, J.W. Wave run-up and overtopping. In Dikes and Revetments; Routledge: London, UK, 2017; pp. 145–160. [Google Scholar]
  121. Hubbard, M.E.; Dodd, N. A 2D numerical model of wave run-up and overtopping. Coast. Eng. 2002, 47, 1–26. [Google Scholar] [CrossRef]
  122. Hunt, J. Inland and coastal flooding: Developments in prediction and prevention. Phiosl. Trans. R. Soc. Lond. A 2005, 363, 1475–1491. [Google Scholar] [CrossRef]
  123. Wadey, M.P.; Nicholls, R.J.; Hutton, C. Coastal flooding in the Solent: An integrated analysis of defences and inundation. Water 2012, 4, 430–459. [Google Scholar] [CrossRef]
  124. Stockdon, H.F.; Holman, R.A.; Howd, P.A.; Sallenger, A.H. Empirical parameterization of setup, swash, and runup. Coast. Eng. 2006, 53, 57–588. [Google Scholar] [CrossRef]
  125. Booij, N.; Ris, R.; Holthuijsen, L.H. A third-generation wave model for coastal regions: 1. Model description and validation. J. Geophys. Res. Oceans 1999, 104, 7649–7666. [Google Scholar] [CrossRef] [Green Version]
  126. Wei, G.; Kirby, J.T.; Sinha, A. Generation of waves in Boussinesq models using a source function method. Coast. Eng. 1999, 36, 271–299. [Google Scholar] [CrossRef] [Green Version]
  127. Smit, P.; Zijlema, M.; Stelling, G. Depth-induced wave breaking in a non-hydrostatic, near-shore wave model. Coast. Eng. 2013, 76, 1–16. [Google Scholar] [CrossRef]
  128. Williams, H.E.; Briganti, R.; Pullen, T. The role of offshore boundary conditions in the uncertainty of numerical prediction of wave overtopping using non-linear shallow water equations. Coast. Eng. 2014, 89, 30–44. [Google Scholar] [CrossRef]
  129. Lynett, P.J. Nearshore wave modeling with high-order Boussinesq-type equations. J. Water Port Coast. Ocean Eng. 2006, 132, 348–357. [Google Scholar] [CrossRef]
  130. Zijlema, M.; Stelling, G.; Smit, P. SWASH: An operational public domain code for simulating wave fields and rapidly varied flows in coastal waters. Coast. Eng. 2011, 58, 992–1012. [Google Scholar] [CrossRef]
  131. Federal Emergency Management Agency (FEMA). Coastal Wave Runup and Overtopping. In Guidance for Flood Risk Analysis and Mapping; Federal Emergency Management Agency: Washington, DC, USA, 2018. [Google Scholar]
  132. Laudier, N.A.; Thornton, E.B.; MacMahan, J. Measured and modeled wave overtopping on a natural beach. Coast. Eng. 2011, 58, 815–825. [Google Scholar] [CrossRef]
  133. Chini, N.; Stansby, P. Extreme values of coastal wave overtopping accounting for climate change and sea level rise. Coast. Eng. 2012, 65, 27–37. [Google Scholar] [CrossRef]
  134. Lynett, P.J.; Melby, J.A.; Kim, D.H. An application of Boussinesq modeling to hurricane wave overtopping and inundation. Ocean Eng. 2010, 37, 135–153. [Google Scholar] [CrossRef]
  135. Cheung, K.; Phadke, A.; Wei, Y.; Rojas, R.; Douyere, Y.M.; Martino, C.; Houston, S.; Liu, P.F.; Lynett, P.; Dodd, N.; et al. Modeling of storm-induced coastal flooding for emergency management. Ocean Eng. 2003, 30, 1353–1386. [Google Scholar] [CrossRef]
  136. Hu, K.; Mingham, C.G.; Causon, D.M. Numerical simulation of wave overtopping of coastal structures using the non-linear shallow water equations. Coast. Eng. 2000, 41, 433–465. [Google Scholar] [CrossRef]
  137. Losada, I.J.; Lara, J.L.; Guanche, R.; Gonzalez-Ondina, J.M. Numerical analysis of wave overtopping of rubble mound breakwaters. Coast. Eng. 2008, 55, 47–62. [Google Scholar] [CrossRef]
  138. Liu, P.L.F.; Lin, P.; Chang, K.A.; Sakakiyama, T. Numerical modeling of wave interaction with porous structures. J. Water Port Coast. Ocean Eng. 1999, 125, 322–330. [Google Scholar] [CrossRef]
  139. Okayasu, A.; Suzuki, T.; Matsubayashi, Y. Laboratory experiment and three-dimensional Large Eddy Simulation of wave overtopping on gentle slope seawalls. Coast. Eng. J. 2005, 47, 71–89. [Google Scholar] [CrossRef]
  140. Kikkawa, H.; Shi-igai, H.; Kono, T. Fundamental study of wave over-topping on levees. Coast. Eng. Jpn. 1968, 11, 107–115. [Google Scholar] [CrossRef]
  141. Ahrens, J. Prediction of Irregular Wave Overtopping; Technical Report; U.S. Army Coastal Engineering Research Center: Springfield, VA, USA, 1977.
  142. Owen, M. Design of Seawalls Allowing for Wave Overtopping; Report No. EX 924; Hydraulics Research Station: Wallingford, UK, 1980. [Google Scholar]
  143. Ahrens, J.P.; Heimbaugh, M.S.; Davidson, D.D. Irregular Wave Overtopping of Seawall/revetment Configurations, Roughans Point, Massachusetts: Experimental Model Study; US Army Engineer Waterways Experiment Station: Vicksburg, MS, USA, 1986; Volume 86.
  144. Ahrens, J.P.; Heimbaugh, M.S. Seawall overtopping model. In Coastal Engineering 1988; ASCE Library: Reston, VA, USA, 1989; pp. 795–806. [Google Scholar]
  145. Schüttrumpf, H. Wellenüberlauf bei Seedeichen—Experimentelle und theoretische Untersuchungen. Ph.D. Thesis, Technical University Carolo-Wilhelmina, Braunschweig, Germany, 2001. [Google Scholar]
  146. De Waal, J.; Van der Meer, J. Wave runup and overtopping on coastal structures. In Coastal Engineering 1992; ASCE Library: Reston, VA, USA, 1993; pp. 1758–1771. [Google Scholar]
  147. van der Meer, J.W. Conceptual design of rubble mound breakwaters. In Advances In Coastal And Ocean Engineering: (Volume 1); World Scientific: Toh Tuck, Singapore, 1995; pp. 221–315. [Google Scholar]
  148. Hedges, T.; Reis, M. Random wave overtopping of simple sea walls: A new regression model. Proc. Inst. Civ. Eng. Water Marit. Energy 1998, 130, 0001–0010. [Google Scholar] [CrossRef]
  149. van der Meer, J. Technical Report Wave Run-Up and Wave Overtopping at Dikes; TAW report (incorporated in the EurOtop manual); Technical Advisory Committee on Food Defence: Delft, The Nederlands, 2002.
  150. Mase, H.; Hedges, T.; Shareef, M.; Nagahashi, S. Wave overtopping formula for gentle slopes incorporating wave runup. Proc. Coast. Eng. 2003, 50, 636–640. [Google Scholar]
  151. Pullen, T.; Allsop, N.; Bruce, T.; Kortenhaus, A.; Schütrumpf, H.; Van Der Meer, J. EurOtop: Wave Overtopping of Sea Defences and Related Structures: Assessment Manual. Environment Agency, UK/Expertise Netwerk Waterkeren, NL/Kuratorium fur Forschung im Kusteningenieurwesen, DE; Technical Report; Environment Agency: Bristol, UK, 2007; 178p, ISBN 978-3-8042-1064-6. [Google Scholar]
  152. Reis, M.T.; Hu, K.; Hedges, T.S.; Mase, H. A comparison of empirical, semiempirical, and numerical wave overtopping models. J. Coast. Res. 2008, 24, 250–262. [Google Scholar] [CrossRef]
  153. van der Meer, J.; Allsop, N.; Bruce, T.; De Rouck, J.; Kortenhaus, A.; Pullen, T.; Zanuttigh, B. Eurotop 2016: Manual on Wave Overtopping of Sea Defences and Related Structures. An Overtopping Manual Largely Based on European Research, but For Worldwide Application; Environmental Agency: London, UK, 2016.
  154. Bertin, X.; Li, K.; Roland, A.; Zhang, Y.J.; Breilh, J.F.; Chaumillon, E. A modeling-based analysis of the flooding associated with Xynthia, central Bay of Biscay. Coast. Eng. 2014, 94, 80–89. [Google Scholar] [CrossRef]
  155. Tsoukala, V.K.; Chondros, M.; Kapelonis, Z.G.; Martzikos, N.; Lykou, A.; Belibassakis, K.; Makropoulos, C. An integrated wave modelling framework for extreme and rare events for climate change in coastal areas–the case of Rethymno, Crete. Oceanologia 2016, 58, 71–89. [Google Scholar] [CrossRef]
  156. Christensen, E.D.; Deigaard, R. Large eddy simulation of breaking waves. Coast. Eng. 2001, 42, 53–86. [Google Scholar] [CrossRef]
  157. Dalrymple, R.A.; Rogers, B. Numerical modeling of water waves with the SPH method. Coast. Eng. 2006, 53, 141–147. [Google Scholar] [CrossRef]
  158. Hsu, T.J.; Sakakiyama, T.; Liu, P.L.F. A numerical model for wave motions and turbulence flows in front of a composite breakwater. Coast. Eng. 2002, 46, 25–50. [Google Scholar] [CrossRef]
  159. Lin, P.; Liu, P.L.F. A numerical study of breaking waves in the surf zone. J. Fluid Mech. 1998, 359, 239–264. [Google Scholar] [CrossRef]
  160. Miyata, H. Finite-difference simulation of breaking waves. J. Comput. Phys. 1986, 65, 179–214. [Google Scholar] [CrossRef]
  161. Watanabe, Y.; Saeki, H. Three-dimensional large eddy simulation of breaking waves. Coast. Eng. J. 1999, 41, 281–301. [Google Scholar] [CrossRef]
  162. Wu, T.R. A Numerical Study of Three-Dimensional Breaking Waves and Turbulence Effects. Ph.D. Thesis, Cornell University, Ithaca, NY, USA, August 2004. [Google Scholar]
  163. Garcia, N.; Lara, J.; Losada, I. 2-D numerical analysis of near-field flow at low-crested permeable breakwaters. Coast. Eng. 2004, 51, 991–1020. [Google Scholar] [CrossRef]
  164. Lara, J.; Garcia, N.; Losada, I. RANS modelling applied to random wave interaction with submerged permeable structures. Coast. Eng. 2006, 53, 395–417. [Google Scholar] [CrossRef]
  165. Lara, J.L.; Losada, I.J.; Liu, P.L.F. Breaking waves over a mild gravel slope: Experimental and numerical analysis. J. Geophys. Res. Oceans 2006, 111, C11019. [Google Scholar] [CrossRef]
  166. Losada, I.J.; Lara, J.L.; Christensen, E.D.; Garcia, N. Modelling of velocity and turbulence fields around and within low-crested rubble-mound breakwaters. Coast. Eng. 2005, 52, 887–913. [Google Scholar] [CrossRef]
  167. Soliman, A.S. Numerical Study of Irregular Wave Overtopping and Overflow. Ph.D. Thesis, University of Nottingham, Nottingham, UK, 2003. [Google Scholar]
  168. Reeve, D.; Soliman, A.; Lin, P. Numerical study of combined overflow and wave overtopping over a smooth impermeable seawall. Coast. Eng. 2008, 55, 155–166. [Google Scholar] [CrossRef]
  169. Thompson, D.A.; Karunarathna, H.; Reeve, D.E. Modelling extreme wave overtopping at Aberystwyth Promenade. Water 2017, 9, 663. [Google Scholar] [CrossRef]
  170. Li, T.; Troch, P.; De Rouck, J. Wave overtopping over a sea dike. J. Comput. Phy. 2004, 198, 686–726. [Google Scholar] [CrossRef]
  171. Gotoh, H.; Shao, S.; Memita, T. SPH-LES model for numerical investigation of wave interaction with partially immersed breakwater. Coast. Eng. J. 2004, 46, 39–63. [Google Scholar] [CrossRef]
  172. Shao, S.; Ji, C.; Graham, D.I.; Reeve, D.E.; James, P.W.; Chadwick, A.J. Simulation of wave overtopping by an incompressible SPH model. Coast. Eng. 2006, 53, 723–735. [Google Scholar] [CrossRef] [Green Version]
  173. Akbari, H. Simulation of wave overtopping using an improved SPH method. Coast. Eng. 2017, 126, 51–68. [Google Scholar] [CrossRef]
  174. Peregrine, D.H. Long waves on a beach. J. Fluid Mech. 1967, 27, 815–827. [Google Scholar] [CrossRef]
  175. Abbott, M.; Petersen, H.; Skovgaard, O. On the numerical modelling of short waves in shallow water. J. Hydraul. Res. 1978, 16, 173–204. [Google Scholar] [CrossRef]
  176. Beji, S.; Nadaoka, K. A formal derivation and numerical modelling of the improved Boussinesq equations for varying depth. Ocean Eng. 1996, 23, 691–704. [Google Scholar] [CrossRef]
  177. Madsen, P.A.; Murray, R.; Sørensen, O.R. A new form of the Boussinesq equations with improved linear dispersion characteristics. Coast. Eng. 1991, 15, 371–388. [Google Scholar] [CrossRef]
  178. Madsen, P.A.; Sørensen, O.R. A new form of the Boussinesq equations with improved linear dispersion characteristics. Part 2. A slowly-varying bathymetry. Coast. Eng. 1992, 18, 183–204. [Google Scholar] [CrossRef]
  179. Nwogu, O. Alternative form of Boussinesq equations for nearshore wave propagation. J. Water Port Coast. Ocean Eng. 1993, 119, 618–638. [Google Scholar] [CrossRef]
  180. Wei, G.; Kirby, J.T.; Grilli, S.T.; Subramanya, R. A fully nonlinear Boussinesq model for surface waves. Part 1. Highly nonlinear unsteady waves. J. Fluid Mech. 1995, 294, 71–92. [Google Scholar] [CrossRef]
  181. Chen, Q.; Kirby, J.T.; Dalrymple, R.A.; Kennedy, A.B.; Chawla, A. Boussinesq modeling of wave transformation, breaking, and runup. II: 2D. J. Water Port Coast. Ocean Eng. 2000, 126, 48–56. [Google Scholar] [CrossRef]
  182. Lynett, P.J.; Wu, T.R.; Liu, P.L.F. Modeling wave runup with depth-integrated equations. Coast. Eng. 2002, 46, 89–107. [Google Scholar] [CrossRef] [Green Version]
  183. Madsen, P.A.; Sørensen, O.; Schäffer, H. Surf zone dynamics simulated by a Boussinesq type model. Part I. Model description and cross-shore motion of regular waves. Coast. Eng. 1997, 32, 255–287. [Google Scholar] [CrossRef]
  184. Kennedy, A.B.; Chen, Q.; Kirby, J.T.; Dalrymple, R.A. Boussinesq modeling of wave transformation, breaking, and runup. I: 1D. J. Water Port Coast. Ocean Eng. 2000, 126, 39–47. [Google Scholar] [CrossRef]
  185. Sørensen, O.R.; Schäffer, H.A.; Sørensen, L.S. Boussinesq-type modelling using an unstructured finite element technique. Coast. Eng. 2004, 50, 181–198. [Google Scholar] [CrossRef]
  186. Stansby, P.K. Solitary wave run up and overtopping by a semi-implicit finite-volume shallow-water Boussinesq model. J. Hydraul. Res. 2003, 41, 639–647. [Google Scholar] [CrossRef]
  187. Stansby, P.K.; Feng, T. Surf zone wave overtopping a trapezoidal structure: 1-D modelling and PIV comparison. Coast. Eng. 2004, 51, 483–500. [Google Scholar] [CrossRef]
  188. Orszaghova, J.; Borthwick, A.G.; Taylor, P.H. From the paddle to the beach—A Boussinesq shallow water numerical wave tank based on Madsen and Sørensen’s equations. J. Comput. Phys. 2012, 231, 328–344. [Google Scholar] [CrossRef]
  189. Sitanggang, K.; Lynett, P. Multi-scale simulation with a hybrid Boussinesq-RANS hydrodynamic model. Int. J. Numer. Meth. Fluids 2010, 62, 1013–1046. [Google Scholar] [CrossRef]
  190. Tonelli, M.; Petti, M. Hybrid finite volume–finite difference scheme for 2DH improved Boussinesq equations. Coast. Eng. 2009, 56, 609–620. [Google Scholar] [CrossRef]
  191. Brocchini, M.; Dodd, N. Nonlinear shallow water equation modeling for coastal engineering. J. Water Port Coast. Ocean Eng. 2008, 134, 104–120. [Google Scholar] [CrossRef]
  192. Hibberd, S.; Peregrine, D. Surf and run-up on a beach: A uniform bore. J. Fluid Mech. 1979, 95, 323–345. [Google Scholar] [CrossRef]
  193. Kobayashi, N.; Watson, K.D. Wave reflection and runup on smooth slopes. Coast. Hydrodyn. 1987, 7, 548–563. [Google Scholar]
  194. Titov, V.V.; Synolakis, C.E. Modeling of breaking and nonbreaking long-wave evolution and runup using VTCS-2. J. Water Port Coast. Ocean Eng. 1995, 121, 308–316. [Google Scholar] [CrossRef]
  195. Kobayashi, N.; Wurjanto, A. Wave overtopping on coastal structures. J. Water Port Coast. Ocean Eng. 1989, 115, 235–251. [Google Scholar] [CrossRef]
  196. Kobayashi, N.; Raichle, A.W. Irregular wave overtopping of revetments in surf zones. J. Water Port Coast. Ocean Eng. 1994, 120, 56–73. [Google Scholar] [CrossRef]
  197. Dodd, N. Numerical model of wave run-up, overtopping, and regeneration. J. Water Port Coast. Ocean Eng. 1998, 124, 73–81. [Google Scholar] [CrossRef]
  198. Shiach, J.B.; Mingham, C.G.; Ingram, D.M.; Bruce, T. The applicability of the shallow water equations for modelling violent wave overtopping. Coast. Eng. 2004, 51, 1–15. [Google Scholar] [CrossRef]
  199. Tuan, T.Q.; Oumeraci, H. A numerical model of wave overtopping on seadikes. Coast. Eng. 2010, 57, 757–772. [Google Scholar] [CrossRef]
  200. Witting, M.; Kaiser, R.; Schüttrumpf, H.; Niemeyer, H. Use of nonlinear shallow water wave overtopping models for seawall and dyke design: Validation and comparison studies. Proc. Coast. Struct. Breakwaters 2005, 269–289. [Google Scholar]
  201. Hu, K.; Meyer, D. The validity of the non-linear shallow water equations for modelling wave runup and reflection. Proc. ICE Coast. Struct. Breakwaters 2005, 5, 195–206. [Google Scholar]
  202. Pullen, T.; Allsop, N. Use of numerical models of wave overtopping: A summary of current understanding. In R&D Interim Guidance Note FD2410/GN1; Department for Environment, Food and Rural Affairs: London, UK, 2003; p. 7. [Google Scholar]
  203. Roelvink, D.; Reniers, A.; van Dongeren, A.; van Thiel de Vries, J.; McCall, R.; Lescinski, J. Modelling storm impacts on beaches, dunes and barrier islands. Coast. Eng. 2009, 56, 1133–1152. [Google Scholar] [CrossRef]
  204. Smit, P.; Stelling, G.; Roelvink, J.A.; van Thiel de Vries, J.S.M.; McCall, R.T.; Dongeren, A.R.V.; Zwinkels, C.; Jacobs, R. XBeach: Non-Hydrostatic Model: Validation, Verification and Model Description; Technical Report; Delft University of Technology: Delft, The Nederlands, 2010. [Google Scholar]
  205. McCall, R.T.; van Thiel de Vries, J.S.M.; Plant, N.G.; van Dongeren, A.R.; Roelvink, J.A.; Thompson, D.M.; Reniers, A.J.H.M. Two-dimensional time dependent hurricane overwash and erosion modeling at Santa Rosa Island. Coast. Eng. 2010, 57, 668–683. [Google Scholar] [CrossRef]
  206. Splinter, K.D.; Palmsten, M.L. Modeling dune response to an East Coast Low. Mar. Geol. 2012, 329–331, 46–57. [Google Scholar] [CrossRef]
  207. McCall, R.; Masselink, G.; Poate, T.; Bradbury, A.; Russell, P.; Davidson, M. Predicting overwash on gravel barriers. J. Coast. Res. 2013, 65, 1473–1478. [Google Scholar] [CrossRef]
  208. McCall, R.; Masselink, G.; Poate, T.; Roelvink, J.; Almeida, L.; Davidson, M.; Russell, P. Modelling storm hydrodynamics on gravel beaches with XBeach-G. Coast. Eng. 2014, 91, 231–250. [Google Scholar] [CrossRef] [Green Version]
  209. Suzuki, T.; Altomare, C.; Veale, W.; Verwaest, T.; Trouw, K.; Troch, P.; Zijlema, M. Efficient and robust wave overtopping estimation for impermeable coastal structures in shallow foreshores using SWASH. Coast. Eng. 2017, 122, 108–123. [Google Scholar] [CrossRef]
  210. Lerma, A.N.; Bulteau, T.; Elineau, S.; Paris, F.; Durand, P.; Anselme, B.; Pedreros, R. High-resolution marine flood modelling coupling overflow and overtopping processes: Framing the hazard based on historical and statistical approaches. Nat. Hazards Earth Syst. Sci. 2018, 18, 207–229. [Google Scholar] [CrossRef]
  211. Battjes, J.A.; Gerritsen, H. Coastal modelling for flood defence. Phiosl. Trans. R. Soc. Lond. A 2002, 360, 1461–1475. [Google Scholar] [CrossRef] [PubMed]
  212. Thomalla, F.; Brown, J.; Kelman, I.; Möller, I.; Spence, R.; Spencer, T. Towards an integrated approach for coastal flood impact assessment. In Solutions to Coastal Disasters’ 02; ASCE Library: Reston, VA, USA, 2002; pp. 142–158. [Google Scholar]
  213. Taylor, P.J. Quantitative Methods in Geography: An Introduction to Spatial Analysis; Houghton Mifflin Harcourt: Boston, MA, USA, 1977. [Google Scholar]
  214. Plant, N.G.; Stockdon, H.F. How well can wave runup be predicted? Comment on Laudier et al. (2011) and Stockdon et al. (2006). Coast. Eng. 2015, 102, 44–48. [Google Scholar] [CrossRef] [Green Version]
  215. Cooper, H.M.; Zhang, C.; Selch, D. Incorporating uncertainty of groundwater modeling in sea-level rise assessment: A case study in South Florida. Clim. Chang. 2015, 129, 281–294. [Google Scholar] [CrossRef]
  216. Sukop, M.C.; Rogers, M.; Guannel, G.; Infanti, J.M.; Hagemann, K. High temporal resolution modeling of the impact of rain, tides, and sea level rise on water table flooding in the Arch Creek basin, Miami-Dade County Florida USA. Sci. Total Environ. 2018, 616, 1668–1688. [Google Scholar] [CrossRef] [PubMed]
  217. Masterson, J.P.; Garabedian, S.P. Effects of sea-level rise on ground water flow in a coastal aquifer system. Groundwater 2007, 45, 209–217. [Google Scholar] [CrossRef] [PubMed]
  218. Walter, D.A.; McCobb, T.D.; Masterson, J.P.; Fienen, M.N. Potential Effects of Sea-Level Rise on the Depth to Saturated Sediments of the Sagamore and Monomoy flow lenses on Cape Cod, Massachusetts; Technical Report; US Geological Survey: Reston, VA, USA, 2016.
  219. Elsayed, S.M.; Oumeraci, H. Modelling and mitigation of storm-induced saltwater intrusion: Improvement of the resilience of coastal aquifers against marine floods by subsurface drainage. Environ. Model. Softw. 2018, 100, 252–277. [Google Scholar] [CrossRef]
Figure 1. Cross-shore transect showing the region of interest from the nearshore to the estuary.
Geosciences 08 00450 g001
Figure 2. (A) A static flood prediction; and (B) a hydrodynamic flood prediction using XBeach nonhydrostatic as an overtopping model along with field validation data (black outline). Note depth is unavailable in static predictions and is shown only as extent in red.
Geosciences 08 00450 g002
Figure 3. Validated flood prediction with: (A) the wall resolved with an RTK survey; and (B) original LiDAR data which does not capture the wall elevation. Adapted from Gallien et al. [20].
Geosciences 08 00450 g003
Figure 4. Overtopping flood extent with (light blue) and without (blue) an artificial dune. Predicted flooded area is 0.021 km 2 and 0.082 km 2 , respectively.
Geosciences 08 00450 g004

