Article

Hydrodynamic Shear-Induced Densification of Bacteriogenic Iron Oxides: Mechanisms and Implications

Department of Earth Sciences, University of Toronto, 22 Russell St., Toronto, ON M5S 3B1, Canada
*
Author to whom correspondence should be addressed.
Geosciences 2018, 8(11), 423; https://doi.org/10.3390/geosciences8110423
Submission received: 5 October 2018 / Revised: 8 November 2018 / Accepted: 14 November 2018 / Published: 16 November 2018
(This article belongs to the Special Issue Microbial Biomineralization)

Abstract

:
Bacterial–mineral aggregates are the products of a tight biogeochemical coupling between microbes and geological media and play an outsized role in governing the composition of natural waters through biogeochemical cycling and mineral formation and dissolution processes. The results of combined batch column settling experiments, volumetric analyses, and microscopic investigations demonstrate that composite bacteriogenic iron oxide aggregates are sensitive to densification in response to hydrodynamic shear, a physical fluid phenomenon that introduces significant alterations to aggregate size and structure, permeability, and settling and transport behaviour. After exposing aggregate suspensions to varying degrees of shear stress, final solids volume fractions decreased by as much as 75% from initial data, while aggregate bulk density saw increases from 999 kg·m–3 to as much as 1010 kg·m–3. Inverse modelling of time course data yielded estimates for settling rate constants and initial settling velocities that increased with shear stress application. As well as having implications for aqueous contaminant transport and potential bacterial bioenergetic strategies, these results suggest the preservation potential of microfossils formed from bacterial–mineral aggregates may be significantly reduced with shear-induced alterations, leading to a possible underrepresentation of these microfossils in the sedimentary record and a gap in our understanding of early life on Earth.

1. Introduction

Owing to the ubiquity of microorganisms and associated biogenic substances in aqueous and terrestrial environments, minerals typically co-occur with various organic constituents, producing composite solids with unique physicochemical properties [1,2]. These bacterial–mineral aggregates function as focal points for interactions between the geosphere and biosphere and have been the subject of ongoing research, especially those formed in conjunction with iron oxyhydroxides; these appear in the literature variously as bacteriogenic iron oxides (BIOS) [3,4], cell-Fe(III) mineral aggregates [5], Fe cell-mineral aggregates [6,7], Fe flocs [8], and ferrihydrite–bacteria composites [2]. While diverse in name, these materials all possess the same geochemically significant characteristics: wide distribution in soils, sediments, and surface and subsurface aqueous systems [9,10]; unique surface reactivity properties and high sorbent affinity for various compounds including trace contaminants [11,12]; a tendency to accumulate into large-scale flocculent microbial mats and biofilms associated with physical and chemical gradients, such as light and nutrient fluxes [13,14]; and an internal organic-mineral fibrillar architecture that mirrors the highly porous, hydrated meshwork structure of hydrogels [5,15,16].
This resemblance to hydrogels is particularly relevant in the context of a natural phenomenon known as hydrodynamic shear-induced densification. Specifically, hydrogel-like materials are sensitive to poroelastic deformation induced by hydrodynamic shear stress in fluid flow fields, resulting in shear-induced shrinkage and densification of the aggregates [17]. In terms of fluid mechanics, this behaviour arises from the development of localized pressure gradients around permeable hydrogel-like materials based on differences in internal and external flow velocities, which result from more tortuous flow paths through the permeable aggregates (Figure 1) [18,19]. The resulting fluid pressure gradient causes a net extraction of internal fluid out of the aggregates (dewatering) leading to a reduction in aggregate size (i.e., shrinkage or compaction) and an increase in bulk density [20].
Shear-induced densification has been explored mainly in the context of dewatering technologies in such industries as wastewater treatment [21,22] and mineral processing [23]. However, this phenomenon has a range of important environmental ramifications with regards to its influence on the properties of bacterial–mineral aggregates. Ferris et al. [24] demonstrated that BIOS flocs undergo breakage and fragmentation in all but the most quiescent flow conditions, suggesting that shear-induced alterations to bacterial–mineral aggregates occur widely across a range of hydraulic regimes which may be characterized as low-flow (e.g., wetlands, groundwater discharge channels, hydrothermal vents). In environments where bacterial–mineral aggregates are actively formed, changes in aggregate properties associated with densification have coincident impacts on the mass transport behaviour and the solubility and reactivity of these geomaterials, in turn affecting the diffusion of contaminants and nutrients through aquatic ecosystems [2,5,18]. As the thickness of layered beds of settling materials tends to co-vary with particle size, densified microbe–mineral aggregates in the rock record may serve as palaeoenvironmental indicators in depositional systems, with possible ties to the genesis of Precambrian banded iron formations and other geological units whose origins remain obscure [25,26]. Additionally, aggregate densification may also impact the preservation potential and ultimate fate of bacterial microfossils in the geological record, with implications for our understanding of early life processes on Earth [24].
Much of the existing research on bacterial–mineral aggregates has centered on individual features and mechanisms considered to play important roles in governing bacterial–mineral interactions: e.g., microbially-mediated mineral formation and dissolution processes [12,27]; cell surface reactivity and the sorption of dissolved contaminants to bacterial–mineral aggregates [2,6]; and the kinetics of bacterially-enhanced redox reactions [28,29,30,31]. However, few studies have employed a wider lens on bacterial–mineral aggregates to interrogate their basic physical properties and their susceptibility to physicochemical alterations, specifically in comparison to deformable hydrogel materials. The aim of the present study was to determine how hydrodynamic shear-induced densification influences bacterial–mineral aggregate structure, size, permeability, and bulk density, and to interpret how these alterations may influence the transport behaviour of these materials in aqueous systems. Utilizing flocculent BIOS as model bacterial–mineral aggregates, samples subjected to induced shear stress as well as samples left intact (i.e., undisturbed by applied shear stress) underwent batch column settling trials in experimental microcosms and were subsequently dried and weighed. Alterations of the physical properties of the BIOS aggregates were then quantified on the basis of aggregate densification theory and inverse modelling of time course settling data, as well as through gravimetric and volumetric analyses of dried samples. Additionally, investigations into the structure of the sample bacterial–mineral aggregates using differential interference contrast (DIC) light microscopy and scanning electron microscopy (SEM) techniques provided correlative data for the comparison of experimental and calculated measurements of bacterial–mineral aggregate properties across a range of applied shear stress conditions.

2. Materials and Methods

2.1. Site Description and Sample Collection

The study took place in Meilleurs Bay, Ontario, Canada, approximately 10 km west of Deep River on the Ottawa Valley. The primary study location is Ogilvie Creek (46°09′55.5′′ N, 77°37′23.8′′ W), a first-order stream sourced from surface outflow from a small southerly lake which drains into a wetland adjacent to the Ottawa River. A chalybeate groundwater spring discharges into Ogilvie Creek and features a loosely-aggregated, flocculent BIOS mat extending from the spring’s point source to approximately 2.5 m downgradient where the discharge channel joins the main creek. In situ physicochemical, mineralogical, and microbiological data for this site have been reported at length in prior investigations [28,31,32]. Additional BIOS sampling was performed at a nearby spring-sourced wetland drainage area (Beaver Pond; 46°09′50.3′′ N, 77°37′30.8′′ W). Both sampling areas are associated with a shallow sand aquifer composed of glaciofluvial materials deposited between 6000 and 11,200 years ago, and bedrock consists of faulted and fractured monzonitic gneiss of the Mesoproterozoic-era Grenville Province, overlain by unconsolidated sediments, predominantly glacial till and glaciofluvial sands [32,33].
At each location, samples of flocculent BIOS material were collected using sterile 60 mL syringes at points where the subaqueous microbial mats were thickest. Samples from the Ogilvie Creek location are denoted by the prefix “OC”, and the sample from Beaver Pond by the prefix “BP”. After being transferred gently into a series of deionized-water-rinsed 50 mL polypropylene conical tubes, the BIOS samples were stored at 4 °C. Experiments on the BIOS suspensions were conducted in an onsite laboratory at ambient temperature (ca. 20 °C) within 2 to 4 h of sample collection.

2.2. Shear Stress Application

Hydrodynamic shear stress was induced by hand shaking the BIOS sample suspensions at a constant frequency (i.e., cycles per second) and constant amplitude (i.e., the downward-upward motion is confined to a fixed arc length) for predetermined lengths of time. Although a mechanical laboratory shaker would have maximized the uniformity of shear stress application across these samples, the field setting of this study necessitated use of a metronome-directed hand-shaking method. Similar tube shaking techniques have been utilized in other studies, but few attempts have been made to quantify the levels of shear applied with this method [34,35]. For the present purposes, adequate estimates can be obtained when the downward–upward motion of shaking is conceptualized as a 360° reciprocal orbit, in conjunction with the principles of fluid dynamics employed in studies that utilize orbital shakers to induce shear stress [24,36,37].
The average energy dissipation rate ε (m2·s–3) in a sealed shaking tube is calculated by
ε = N e f 3 L T 4 V 2 / 3 ,
with,
N e = 75 R e 1 + 25 R e 0.6 + 1.5 R e 0.2
and,
R e = ρ w f d C 2 η 1 ,
where f is the shaking frequency, L T is the tube’s length, V is the liquid volume within the tube, N e is the modified Newton number, R e is the Reynolds number, ρ w is the density of water at 20 °C (taken to be 998 kg·m–3 based on the low total dissolved solids content of the source water; see Shirokova and Ferris [38]), d C is the inner diameter of the graduated cylinder (0.027 m), and η is the dynamic fluid viscosity of the suspension (0.001 Pa·s) [24,39,40]. The applied hydrodynamic shear stress σ s (N·m–2) for the calculated energy dissipation rate is given by [37]:
σ s = ρ w   ( ε   ν ) 1 / 2 ,
where ν is the kinematic viscosity, calculated from,
ν =   η ρ w 1 .

2.3. Batch Column Settling Trials

For initial settling trials without the application of hydrodynamic shear stress (cycle A), BIOS suspensions were poured into deionized water-rinsed 100 mL polyethylene graduated cylinders. With the formation of a distinct suspension-liquid interface below the meniscus, the vertical decrease of the interface height h with settling was tracked over time by recording BIOS suspension volumes ( V s u s p e n s i o n ) at times ( t ) of 0, 5, 15, 25, 35, 45, 60 and 75 min (Figure 2). From measurements of cylinder inner diameter ( d C ), V s u s p e n s i o n values were divided by the cross-sectional area ( A ) to obtain interface height values ( h ).
After completion of cycle A settling, subsequent trials (cycle B, and C where applicable) were conducted on samples manipulated uniquely in order to assess the effects of a range of applied shear stress on settling behavior and aggregate physical properties, and, in several cases, the effects of simple resuspension by a tube inversion, without the application of shear stress (Table 1). Since σ s and ε are time-independent quantities, it is pertinent to calculate the total amount of kinetic energy imparted to each BIOS suspension over what can be termed the total exposure (i.e., shaking) time t e . This is accomplished by multiplying the calculated average energy dissipation rate ε (m2·s–3 or W·kg–1) by t e (s) such that:
e k = ε t e ,
where e k is the time-dependent specific kinetic energy imparted per unit volume of fluid in J·kg–1.
In the batch column settling experiments, the rate of decrease in height of the solids–water interface over time (i.e., settling velocity, v ) is described by:
v = d h d t = k ( h h ) ,
where k is the settling rate constant and h is the final equilibrium solid–liquid interface height [22,41,42]. Integration yields:
h = ( h 0 h )   exp ( k t ) + h .
Measured time course data from batch column settling experiments were fit to Equation (8) by non-linear regression using Levenberg–Marquardt optimization with STATISTICA 13.3 software (Tibco, Palo Alto, CA, USA) to obtain estimates for h and k .

2.4. Gravimetric and Volumetric Analyses

After the final settling trial was completed, samples were resuspended, dispensed into pre-weighed aluminum foil dishes and dried to a constant weight at 60 °C for 72 h. Weighing the dried BIOS samples yielded individual dry weights m B I O S from which solid volumes of the BIOS material V B I O S were calculated by:
V B I O S = m B I O S ρ B I O S ,
where ρ B I O S is the measured dry solid density of BIOS (2200 kg·m–3), as reported by Posth et al. [5]. Before settling, the suspension features a uniform initial solids volume fraction ϕ 0 , derived by:
ϕ 0 = V B I O S V s u s p e n s i o n ( 0 ) ,
where V s u s p e n s i o n ( 0 ) is the total aqueous volume of the homogenous BIOS suspension (Figure 2a) [20,41]. At times t > 0, the aggregates settle toward the base of the container with a progressively decreasing suspension–water interface ( h < h 0 ) , forming a separate suspension phase of aggregates at the base of the container with a volume V s u s p e n s i o n ( t ) < V s u s p e n s i o n ( 0 ) and an overall solids volume fraction ϕ > ϕ 0 below an overlying clear liquor phase with a solids volume fraction ϕ = 0 (Figure 2b) [43]. The suspension settles to an equilibrium suspension–water interface h (calculated from inverse modelling estimates) with a corresponding equilibrium suspension phase volume V (Figure 2c).
The aggregate solids volume fraction ϕ a g g quantifies the mean solids volume fraction within the settled aggregate phase by:
ϕ a g g = V B I O S φ   V = V B I O S V a g g ,
where the aggregate volume V a g g is equivalent to the equilibrium suspension volume V multiplied by the packing fraction φ , for which a nominal value of φ = 0.6 was assigned to account for random loose packing associated with BIOS [17,42,44]; in other words, the volume occupied by the hydrated aggregates is 60% of the total suspension volume, with the remaining 40% accounting for the open pore space between aggregates. Estimates for h , obtained initially from Equation (8), were converted to corresponding final equilibrium volumes V a g g for each cycle. The inverse of Equation (11) yields the swelling ratio Q by:
Q = V a g g V B I O S .
Finally, aggregate bulk density ρ a g g was calculated by:
ρ a g g = ϕ a g g ρ B I O S + ( 1 ϕ a g g ) ρ w .

2.5. Optical Microscopy and Scanning Electron Microscopy (SEM)

Wet mount microscope slides were prepared from three of the BIOS suspensions (OC-01, -02, and -04, before and after shaking) by pipetting one drop of the liquid onto a microscope slide, mounting a cover slip, and sealing the edges with transparent lacquer. Slides were labelled according to sample and cycle and stored in sealed petri dishes for further analysis.
DIC light microscopy was performed on the slides at 10× and 40× magnification using a Nikon Microphot-FXA microscope (Nikon, Tokyo, Japan) to examine the distribution and dimensions of bacterial sheath structures in the BIOS samples for each sample and cycle. A minimum of six transects for each slide were conducted and images were captured using a Moticam CCD camera mount and Motic Images Plus 3.0 software (Motic North America, Richmond, BC, Canada). Images were imported into ImageJ and sheath lengths L were measured for each slide (600 < n < 700) using the freehand line selection tool and tabulated as spreadsheet data. Observed lengths of the bacterial sheath structures (the primary structural component to BIOS aggregates) were compared with theoretical values for aggregate diameters d a g g , which were derived using calculated values for ρ a g g and v and the equation for Stokes’ law of settling velocity:
v = d a g g 2 g Δ ρ 18 η ,
which can be rearranged to,
d a g g = 18 v η g Δ ρ ,
where g is the acceleration due to gravity and Δ ρ is the difference in density between the bulk aggregate and the suspending fluid ( ρ a g g ρ w ) [45]. Although calculations using Stokes’ law are optimized for spherical particles, its employment for irregular-shaped bacterial–mineral aggregates is adequate for the present purposes of comparing theoretical and observed aggregate length scales [5].
For SEM analysis, dried material was combined from multiple BIOS samples (specifically, OC-01, -02, -03, and -05) and ground up into a fine powder using a pestle and mortar. SEM was performed on a 0.5 mL sample of the dried BIOS using a JEOL 6610LV (JEOL USA, Peabody, MA, USA) SEM at an accelerating voltage of 15 kV and a working distance of 17 mm.

3. Results

3.1. Shear Stress Application

Table 2 summarizes the hydrodynamic shear stress applications on all sheared BIOS samples assayed in the settling experiments. For all samples except OC-04, the mean energy dissipation rate calculated from Equations (1)–(3) was ε = 0.65 m2·s–3, and the hydrodynamic applied shear stress was σ s = 0.82 N·m–2. OC-04 was subjected to tube shaking at half the standard frequency (0.5 f = 1.35 s–1), hence for this sample ε = 0.10 m2·s–3 and σ s = 0.32 N·m–2. A single value for aqueous tube volume was used in Equation (1), calculated as the mean from all sample volumes ( V = 41 mL; n = 7). Values for specific kinetic energy e k imparted to the suspensions through tube shaking treatments ranged from 6.0­ to 80.4 J·kg–1 as calculated from Equation (6).

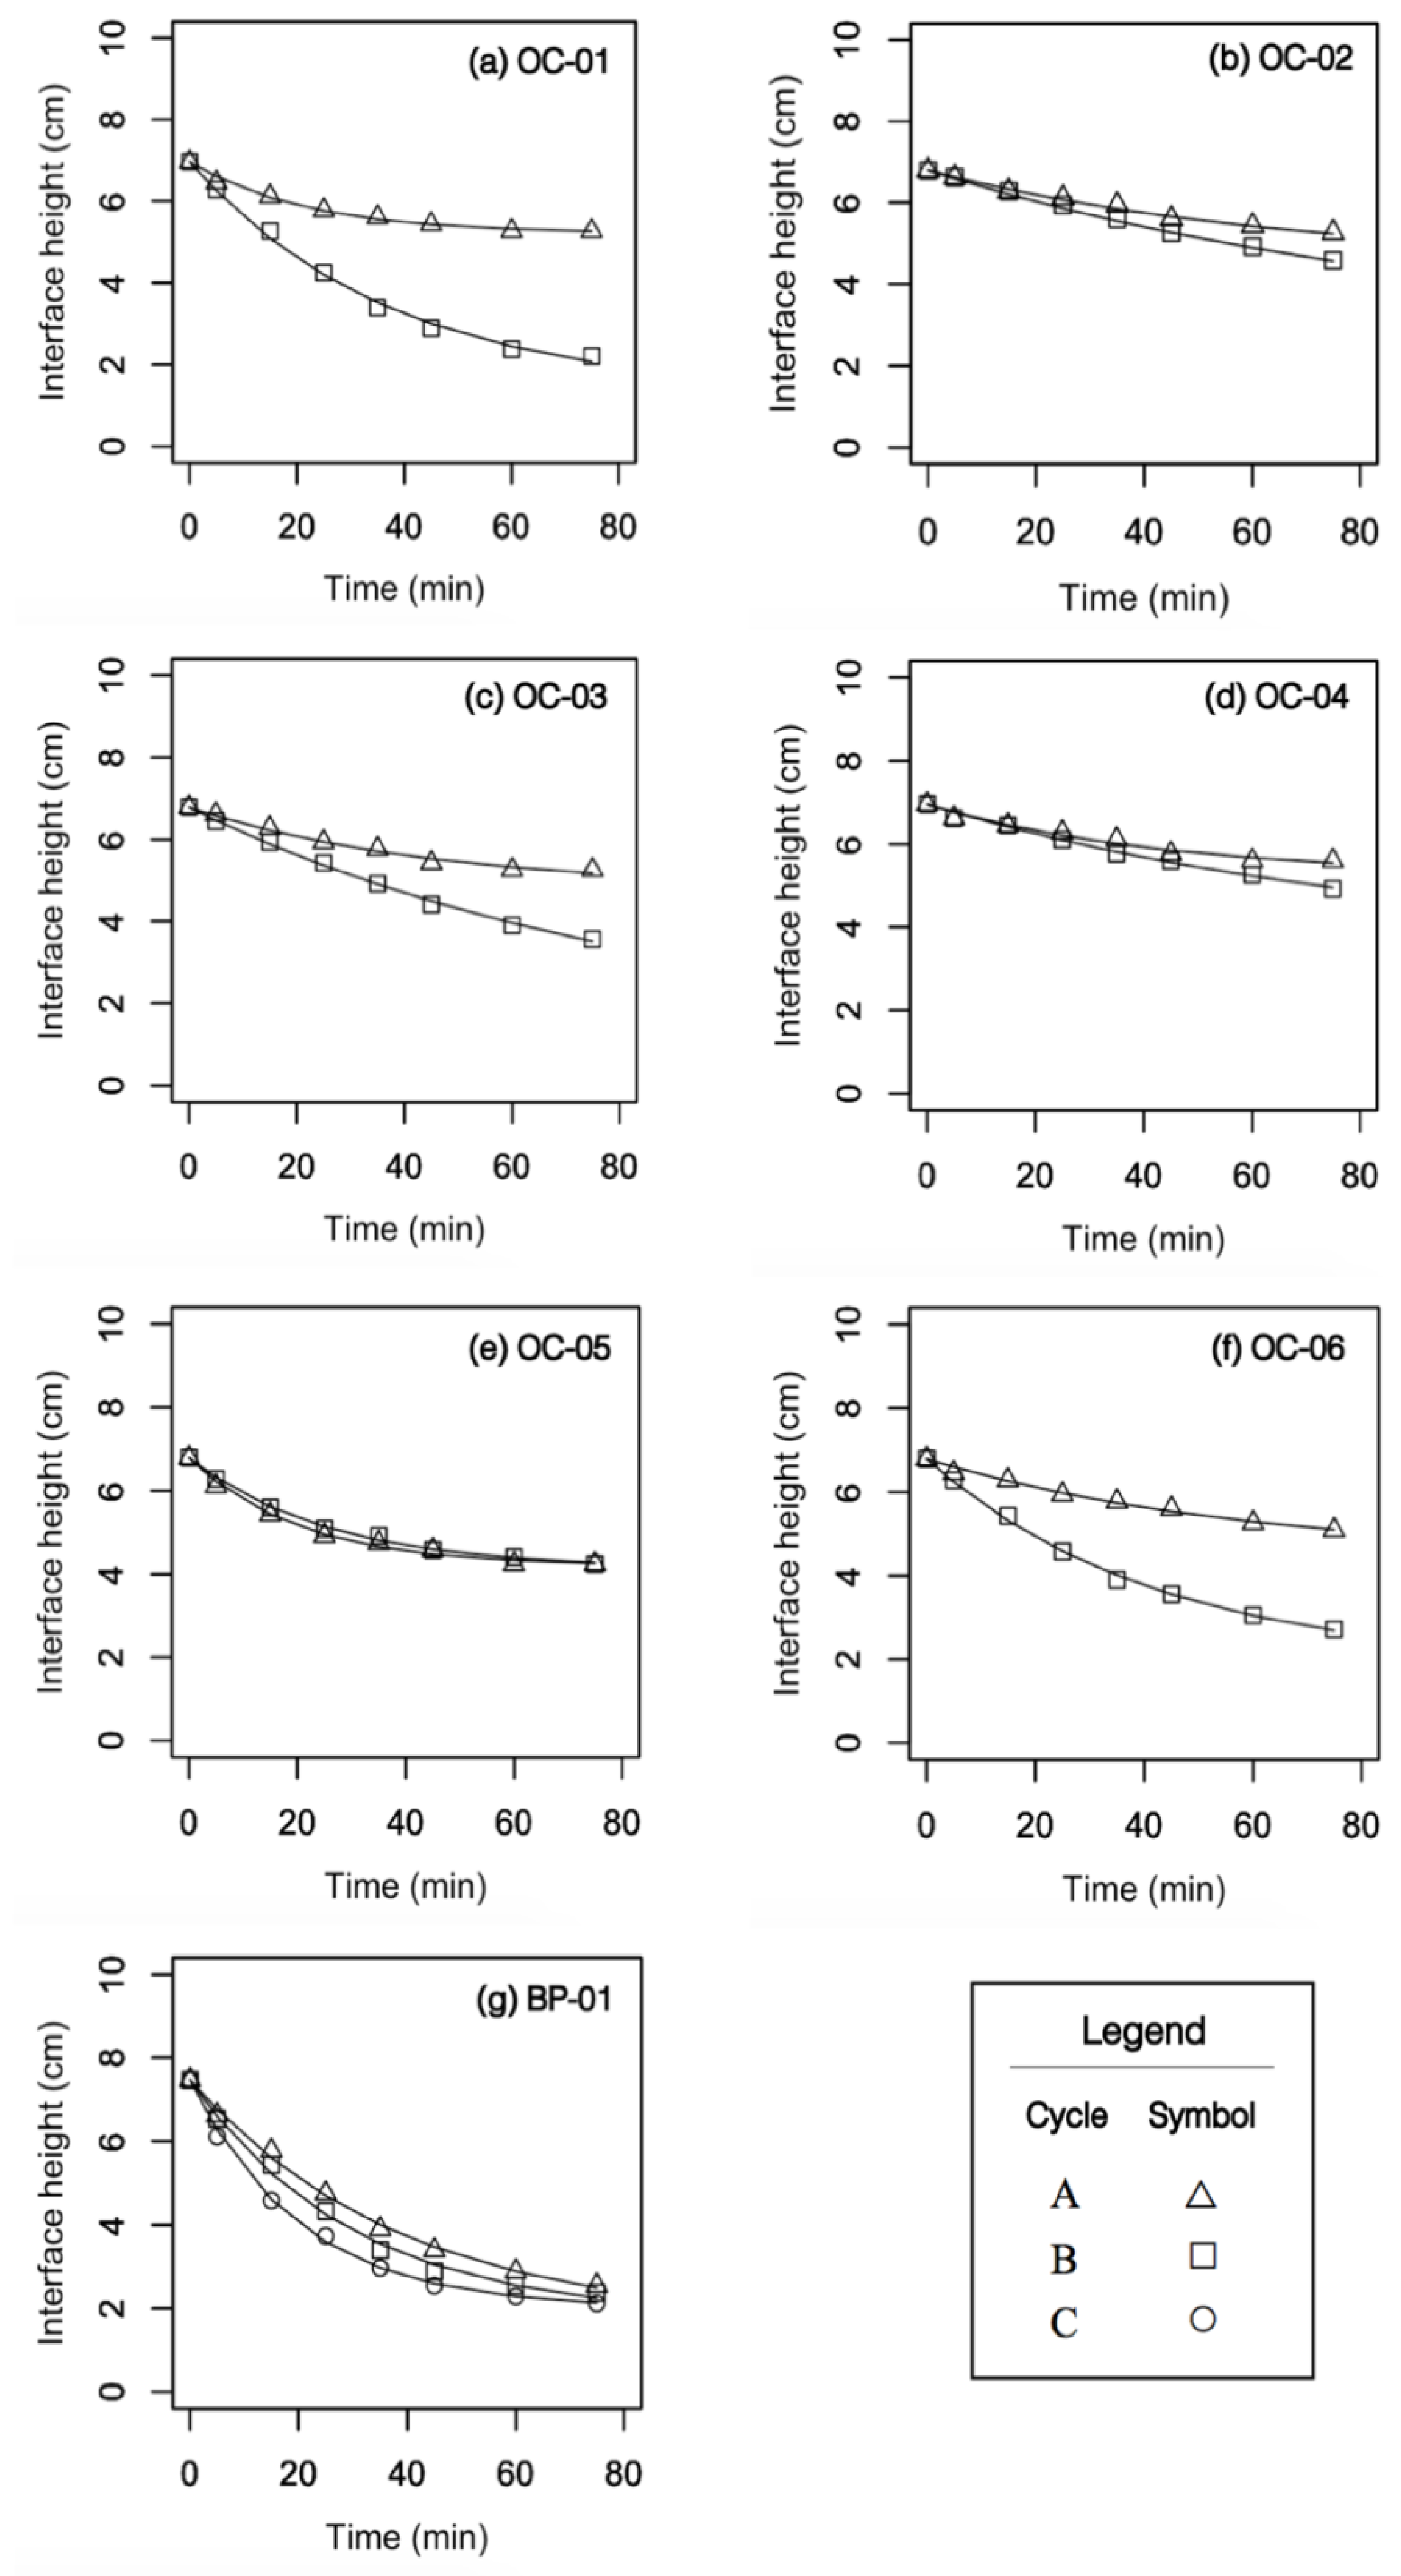
3.2. Batch Column Settling Trials

Time course plots of the batch column settling data with corresponding best fit settling curves are presented in Figure 3. Corresponding estimates for equilibrium interface heights ( h ) and settling rate constants ( k ) with ± standard errors appear in Table 3, along with initial settling velocities v calculated from Equation (7). In all cases, the fit accounts for greater than 97% of the variance in the observed settling heights over time ( R > 0.97). The settling curves plotted against time generally displayed negative exponential decay behaviour, tending to flatten out and approach an asymptotic value defined as h [22], estimates for which ranged from 1.08 ± 0.52 to 5.21 ± 0.07 cm. k estimates ranged from 0.010 ± 0.003 to 0.049 ± 0.002 min–1, depending on the sample trial and treatment or cycle. Examining the changes in settling curve profiles with successive treatments, there exists a generally linear negative correlation between specific shaking energy imparted to the suspensions and final observed cycle B settling heights (i.e., at t = 75 min) for e k values from 6.0 to 40.2 J·kg–1 (Figure 4). Incremental increases in shaking energy of samples OC-05, -02, -03, and -01 ( e k = 0, 13.4, 26.8 and 40.2 J·kg–1, respectively) were reflected in proportional decreases in the settling curve heights (Figure 3a–c,e). Sample OC-04, which was subjected to shaking at half the frequency, displayed only minor changes in settling behaviour, suggesting the amount of applied energy 6.0 J·kg–1) was insufficient to induce significant densification (Figure 3d). Interestingly, the cycle B settling curves of samples shaken for 60 s (OC-01) and 120 s (OC-06) at a frequency of 2.69 s–1 are virtually indistinguishable despite there being a 100% increase in applied shear stress from OC-01 to -06 (Figure 3a,f). Observed final settling heights ( t = 75 min) were 2.2 cm and 2.6 cm, and the results of inverse modelling yielded comparable h estimates of 1.33 ± 0.24 cm and 1.84 ± 0.17 cm, respectively. However, it should be noted that a slight visible difference exists between the cycle A curves for OC-01 and OC-06, indicating natural variations from sample to sample.
For each sample, the solids–water interface fell at a greater initial rate than previously as the experiment progressed through successive treatments, reflected in increases in initial free settling velocities v . Expressed differently, a unifying condition observed in the settling trials was that at any given time h ( A ) > h ( B ) > h ( C ) , where parenthesized subscripts refer to cycle (the latter cycle C term applicable only for sample BP-01). For several settling trials, the difference in interface height between cycles at a given time was significant (Figure 3a,c,f), while for others the difference was minute yet non-zero (Figure 3d,g). The important observation is that in no case did the suspensions exhibit the reverse behaviour of settling at a slower rate than the cycle previous; the rate of aggregate settling was enhanced with each cycle, regardless of whether hydrodynamic shear stress or a simple resuspension was applied between cycles.
Trends in settling rate constants between the different trials are not as clear. This is likely due to the fact that settling rates depend not only on the product of final settling heights and corresponding rate constants (by Equation (8)) but also the dry weight of BIOS ( m B I O S ) in the individual samples. Because m B I O S varied between samples but not treatments, corresponding changes in equilibrium BIOS solids concentration ( [ B I O S ] ) as a function of final settling height h will exist between samples and treatments according to the relationship:
[ B I O S ] = m B I O S A h .
When calculated [ B I O S ] values are plotted as a function of their corresponding settling rate constants, two distinct decreasing trends are evident from the data (Figure 5): the first encompasses the settling trials conducted with Ogilvie Creek BIOS before shaking (i.e., no applied shear stress, or only very gentle shaking in the case of OC-04B, marked in solid blue), while the second is from the same BIOS samples after shaking (i.e., cycle B samples subjected to hydrodynamic shear densification, absent OC-04B), as well as the unshaken Beaver Pond (BP-01) settling trials. These trends demonstrate the effects of differing solids contents for each sample arising from small-scale heterogeneities in BIOS mat material in the area sampled, to be discussed further in Section 4.

3.3. Gravimetric and Volumetric Analyses

Starting solids volume fractions ( ϕ 0 ) for the homogenous suspensions are presented in Table 4, along with BIOS solid volumes ( V B I O S ) derived from measured dry weights ( m B I O S ). All volume fraction quantities are reported in permille (‰). BIOS dry weights ranged from 0.043 to 0.106 g, equivalent to volumes of 0.02 to 0.05 mL.
For each cycle, suspension volumes decreased with settling from initial V s u s p e n s i o n ( 0 ) to final equilibrium volumes V , reflecting the amount of shear-induced densification and breakage undergone by the aggregates and the resulting rearrangement of the consolidating solids network bed structure (Table 5) [20]. Final suspension volumes tended to decrease at the end of each settling trial with concomitant increases in the aggregate solids volume fractions ϕ a g g , which relates V B I O S (constant across cycles) to V , and decreases in the swelling ratio Q . Both trends are expected based on each parameter’s relationship to V by Equations (11) and (12). The highest change in modelled V a g g estimates between cycles was observed in sample OC-01, when an exposure time of 60 s to shaking at 2.69 s–1 led to a total decrease in suspension volume of 22.7 mL (58% of the total sample volume), from V ( A ) = 30.1 mL to V ( B ) = 7.83 mL. At the other end of the spectrum, a simple resuspension of sample OC-05 without shaking led to a decrease in V a g g of only 0.3 mL; the decrease in h values corresponding to these volumes (0.06 cm) is within the standard error of estimates (± 0.08 cm), suggesting that little to no densification occurred in this sample between cycles A and B. Similarly, sample BP-01 appears to reverse the trend of decreasing V with successive cycles, as these values appear to increase from V ( A ) = 9.84 mL to V ( C ) = 11.84 cm. However, these increases are again more or less within the standard error of corresponding h estimates from which aggregate volumes are derived. Aggregate bulk densities ρ a g g tended to increase with successive cycles, evidence of the cumulative densification of the aggregates with settling and shaking [42]. In the two samples highlighted above (OC-05, BP-01), ρ a g g remained constant, signifying little to no densification occurs when a basic resuspension is performed in lieu of hydrodynamic shear application.
Overall, the BIOS aggregate suspensions displayed characteristics typical of hydrogel materials, namely low solids volume fractions and aggregate bulk densities and high swelling ratios [16,46]. Dry solid weights were exceedingly small, ranging from 0.043 to 0.106 g. For all samples, the application of hydrodynamic shear caused a rise in ρ a g g as a result of aggregate collapse and dewatering, and an increase in the final solids volume fraction within the settled aggregate phase ϕ a g g , caused by the aggregates binding more tightly together with densification [42]. These positive changes were generally scaled according to the total amount of specific kinetic energy e k imparted to the suspensions based on the shaking exposure time t e .

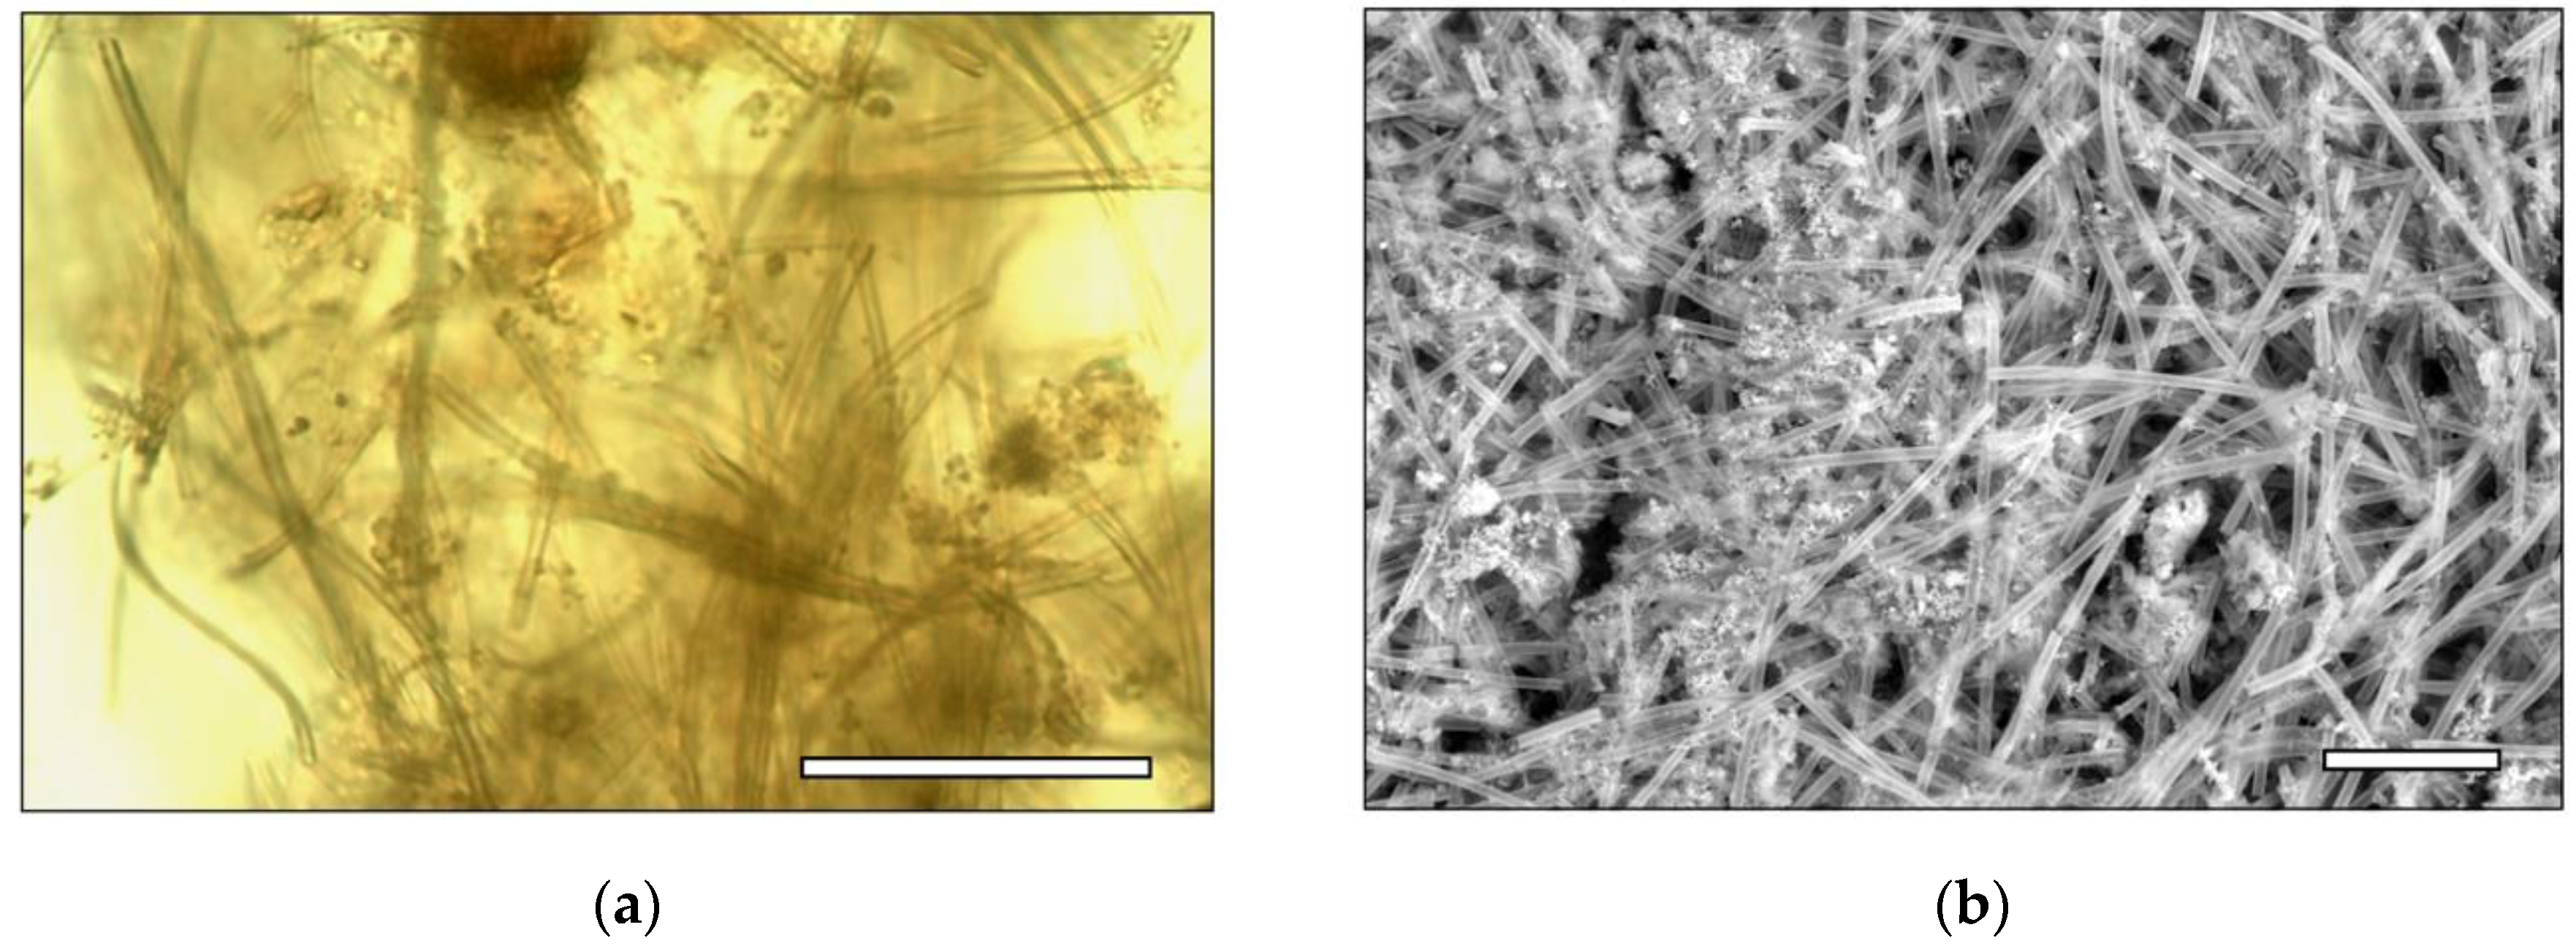
3.4. Optical and SEM Microscopy

Extensive DIC light microscopy of the three BIOS samples (OC-01, -02, -04) revealed a tangled mass of filamentous ~1.0 µm-diameter tubular structures, diagnostic of the extracellular structures produced by the freshwater Fe-oxidizing bacteria Leptothrix ochracea (Figure 6a) [31]. Intermixed with the bacterial sheaths were fine-grained hydrous ferric oxide (HFO) mineral precipitates typically 5.0 to 10.0 µm in diameter, forming a highly porous bacterial–HFO composite material typical of circumneutral, suboxic, Fe-rich habitats [47,48,49]. This bacterial–mineral assemblage was confirmed with SEM analysis (Figure 6b). The aggregates appear more compacted in the scanning electron micrograph than in the wet mount micrograph; this is expected, as the SEM sample was created from densified BIOS that had been further compressed during sample drying and preparation, whereas the DIC microscopy slide was created from an untreated aqueous BIOS suspension.
Based on histogram analyses of compiled initial (cycle A) and final (cycle B) measurements for mean and median sheath lengths L , sample distribution on all slides was positively skewed ( S k > 0). Measured mean and median L values decreased with successive cycles, indicating their breakage into shorter fragments due to the effects of hydrodynamic shear forces. Calculated theoretical aggregate diameters ( d a g g ) are included in Table 5 and ranged from 63.9 to 156 µm. The shaken samples OC-01, -02, and -04 exhibit the same decreasing trend of d a g g as with measured sheath lengths.
Morphological measurements of bacterial–mineral materials have been previously used as a method of confirming alterations and structural breakage in response to variable hydrodynamic conditions [37,50,51]. In this study, they are employed as an alternative lens on the effects of aggregate densification intended to complement the experimental microcosm observations, in the manner employed by Ferris et al. [24] wherein the effects of hydrodynamic shear on bacterial sheaths were interrogated with samples of BIOS collected from the same location (albeit with different operating conditions of applied shear stress). In that study it was found that the reduction in bacterial sheath and stalk lengths over time under constant applied shear stress can be described by:
d L d t = λ ( L L m i n ) ,
which gives,
L = L m i n + ( L t = 0 L m i n ) exp ( λ t ) ,
where L is either the mean or median sheath length measured with microscopy, L m i n is the equilibrium minimum sheath length arising after complete breakage and λ represents the breakage rate constant [24]. As introduced earlier in this study, Equation (6) is used to calculate the specific kinetic energy imparted to the sample suspension as the product of the average energy dissipation rate ε and the exposure time t e . Rearranging this equation gives:
t e = e k ε ,
which, when substituted into Equation (18), yields the exponential relationship between sheath length and specific kinetic energy:
L e k = L m i n + ( L e k = 0 L m i n ) exp ( λ ε e k ) .
Normalizing Equation (20) to the initial sheath length (i.e., dividing both sides by L e k = 0 ) gives the remaining fraction of initial sheath length ( L e k / L e k = 0 ) as:
f e k = f m i n + ( 1 f m i n ) exp ( k ε e k ) ,
where the dimensionless value f m i n represents an asymptotic threshold for sheath breakage as a function of e k . The plots of f e k for both mean and median sheath lengths L as well as calculated d a g g values as a function of e k are compelling in that all essentially follow the same decreasing exponential trend, as predicted by Equation (21) (Figure 7).

4. Discussion

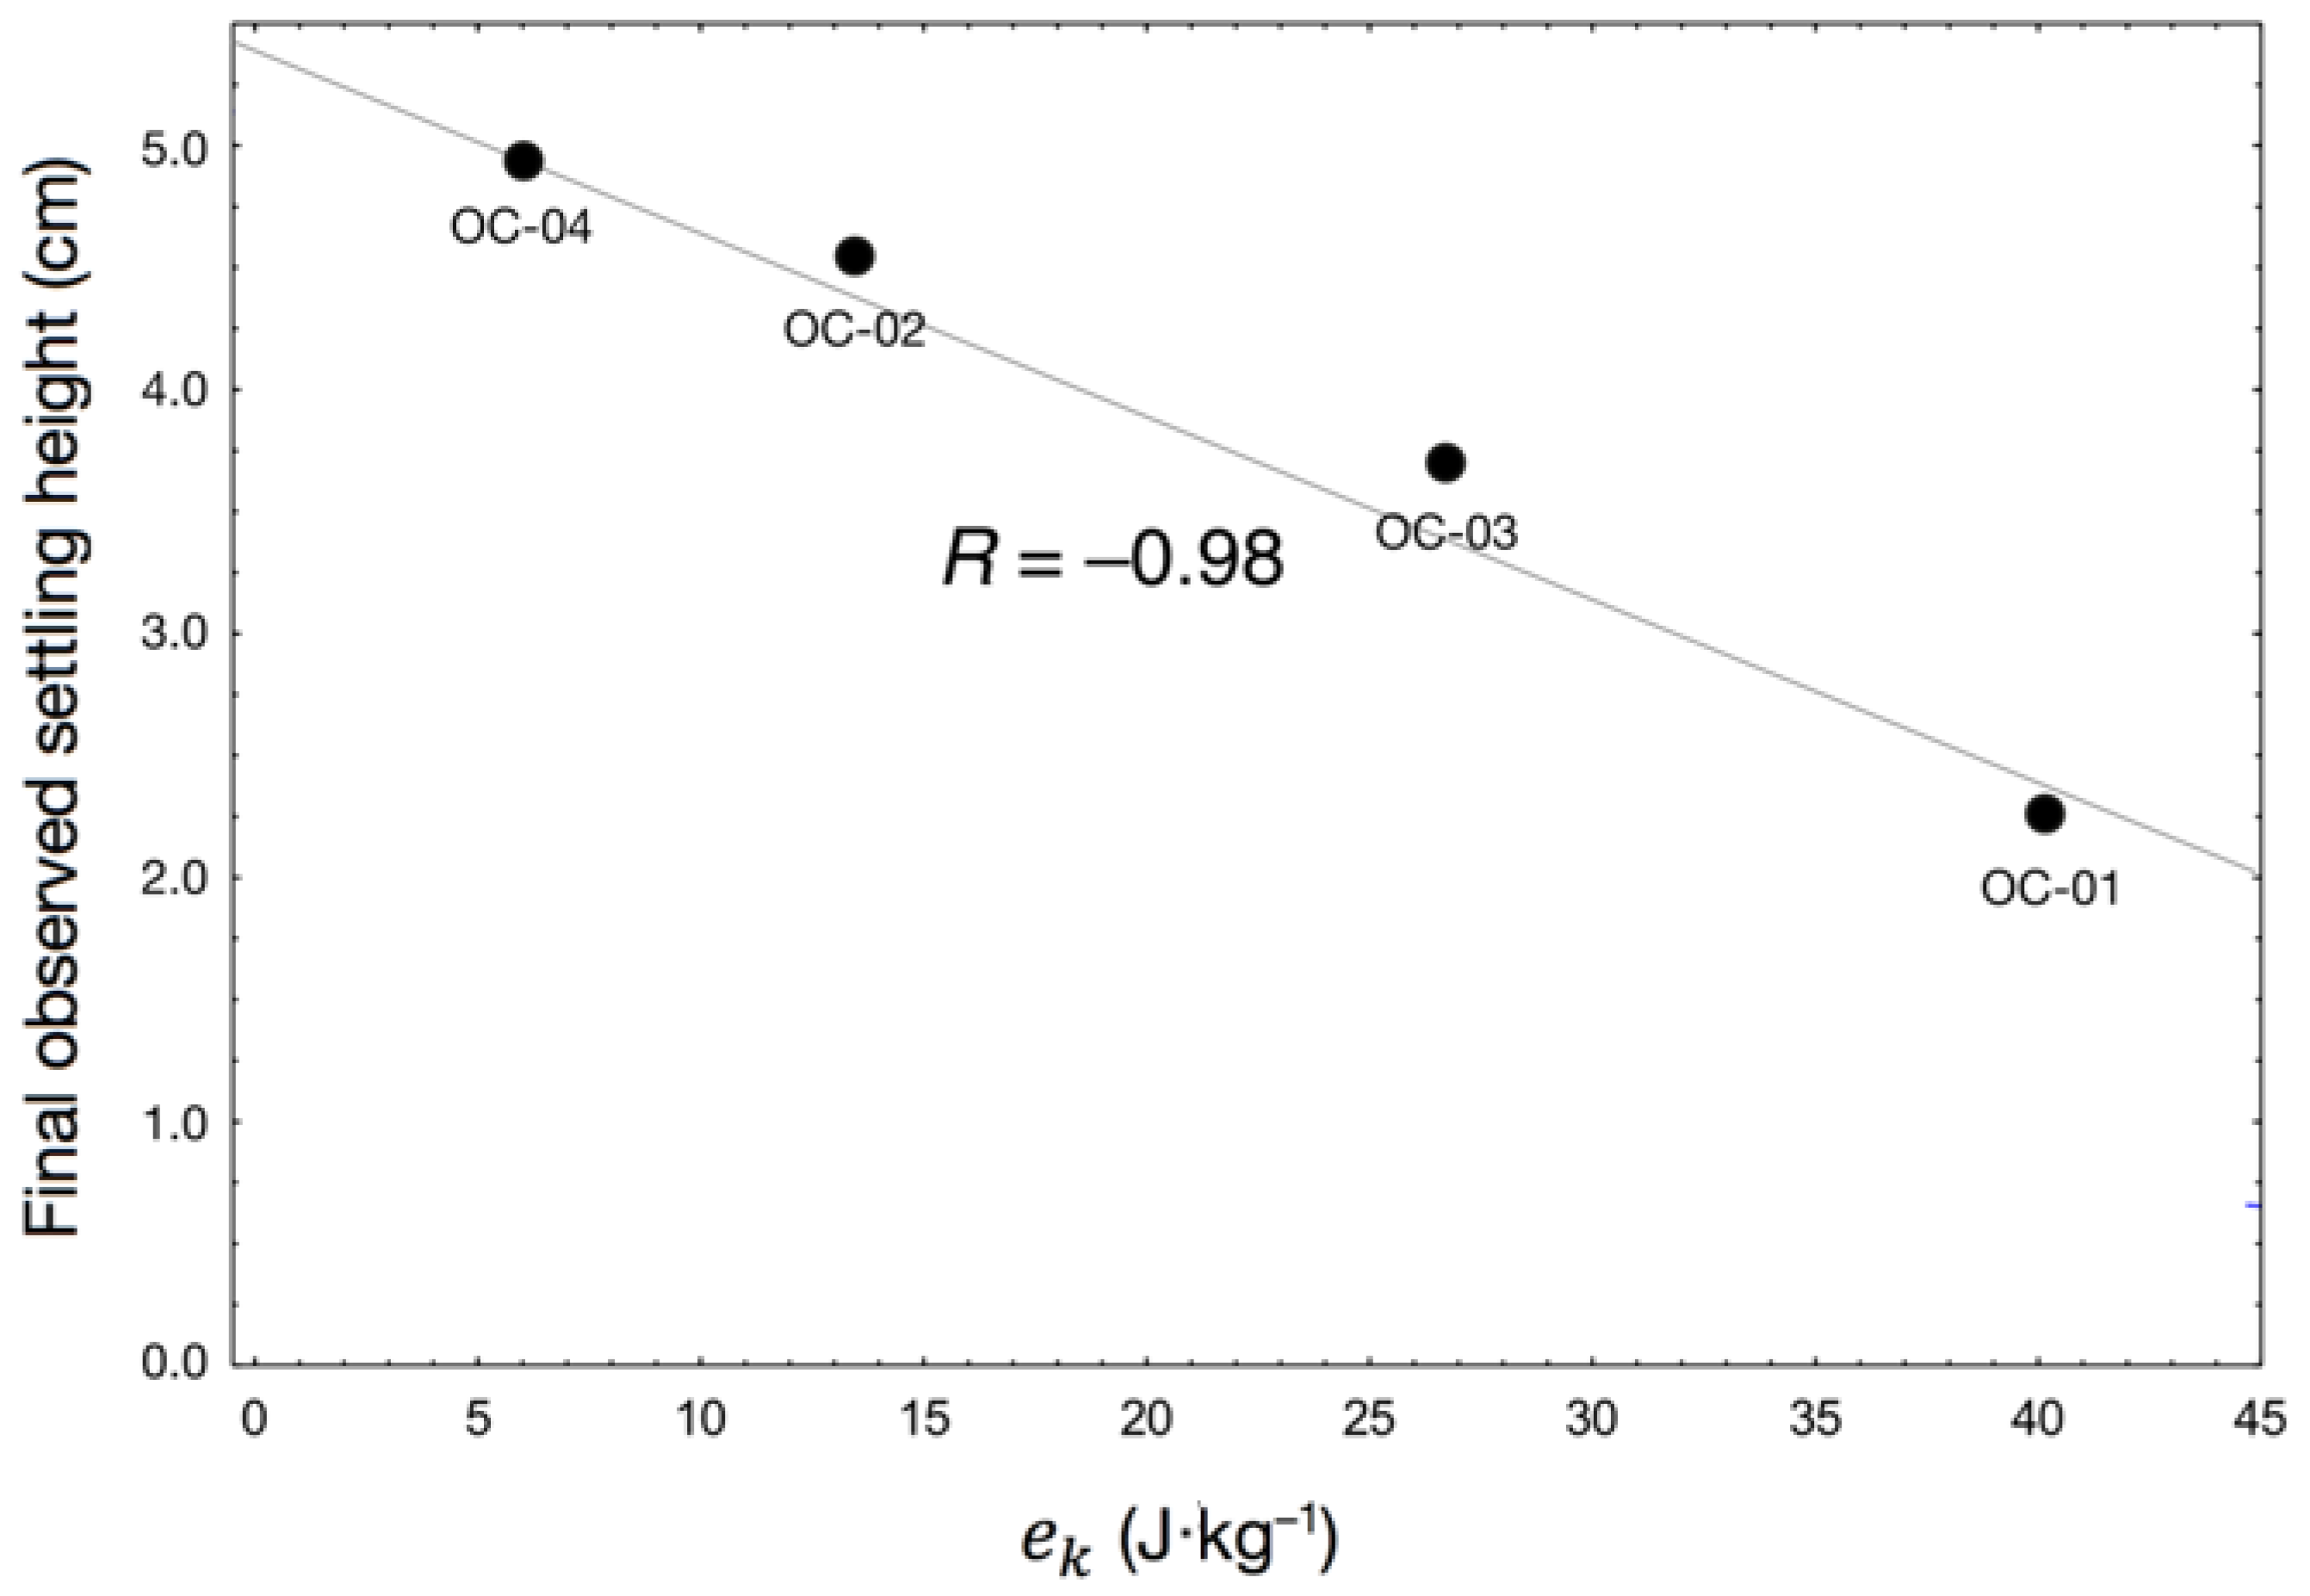
4.1. Effects of Hydrodynamic Shear on Settling Behaviour

As BIOS aggregate mats tend to proliferate in low-energy aqueous environments, the hydrodynamic shear forces acting on them are expected to arise mainly from the shear zone above the sediment bed–water interface [52]. At the same time, inertial shear stresses on bacterial–mineral aggregates arise during turbulent conditions (e.g., during rainfall events and floods) which can induce fragmentation and breakage [53]. Reported bed shear stress in natural systems ranges from 0.0006 to 0.16 N·m–2 in wetlands and along continental shelf margins [54,55] and 0.02 to 2.5 N·m–2 in small streams and creeks [56,57]. Van Leussen [58] noted that the turbulent flow region expected to occur in the bottom boundary layer during periods of high current velocities would feature turbulent shear ranging from 0.1 to 0.6 N·m–2, similar to the shear stress values applied in this study through sample agitation (0.32 and 0.82 N·m–2). The energy dissipation rate ( ε ) values in the shaking trials, calculated as they are from Reynolds numbers that are well into the turbulent flow regime ( R e > 4000) [59], indicate that inertial shear stress is the primary component of hydromechanical force being applied to the shaken samples.
The observation that in all cases settling rates were enhanced with successive cycles is evidence of the sensitivity of BIOS aggregates to densification from hydrodynamic shear forces, whether these forces be applied through tube shaking or “naturally” induced in the container during previous settling trials. One important experimental consequence of this is that bacterial–mineral aggregates may be subject to inadvertent densification during sampling and treatment prior to the initiating of any experiments [60]. Additionally, during the process of settling under gravity in a vertical column, wall surface adhesion processes can affect the settling behaviour of the solids in the column. The fact that densification of suspensions can occur even in the absence of applied mechanical shear has been previously recognised by Spehar et al. [44] who identified inter-aggregate buffeting as a relevant mechanism. Benn et al. [45] note that wall effects are minor in the initial stages of solid settling but can become considerable during slower bed consolidation over periods of time much longer than the duration of experiments in the present study. The implication is that densification occurs in a static water column under simple settling by gravity, regardless of whether the samples undergo shaking to manually induce hydrodynamic shear. This behaviour was confirmed in the settling trials for the sheared samples as well as the unsheared suspensions OC-05 and BP-01 (although with the prior observations in mind, “unsheared” should be considered a misnomer).
On that note, the possibility of pre-existing, in situ densification of the BIOS aggregates sampled must be raised (distinct from the applied hydrodynamic shear forces that act on the aggregates during shaking). It is worth noting that the two trends observed between equilibrium solid BIOS concentrations [ B I O S ] and settling rate constants k are not simply distinguished by cycle (i.e., initial A cycles designated as “before shaking” and B cycles as “after shaking”). The proximity of the lightly shaken (OC-04; e k = 6.0 J·kg–1) and unshaken (OC-05) sample data points to the “before shaking” regression line in Figs. 3d and e is reasonable, considering that the physical effects of hydrodynamic shear appear to be scaled according to e k . However, it was found that the Beaver Pond BIOS exhibited behaviour indicative of having previously undergone densification, as these data points (BP-01A, -B, and -C) fall within the 90% confidence interval of the “after shaking” regression line. A pertinent observation here is that, in terms of physical appearance, the slightly darker colour and granular texture of the Beaver Pond BIOS strongly resembled Ogilvie Creek BIOS after shear stress application. The initial implication is that the Beaver Pond BIOS was subjected to in situ, natural shear-induced densification before sample collection, analogous to that anticipated for the shaken Ogilvie Creek samples. This is supported by observations of elevated baseflow in the Beaver Pond drainage system at the time of sampling due to runoff from spring snowmelt (although flow rates were not measured) as well as the shape of the initial (cycle A) settling curve for BP-01, which bears a striking resemblance to the more steeply sloped curves typical of densified cycle B trials (e.g., Figure 3a). On the other hand, the different location of origin of this sample relative to the Ogilvie Creek samples may explain the differences in their settling behaviour, based on potential divergences in water chemistry, mineralogy, and solid-phase densities between these locations.

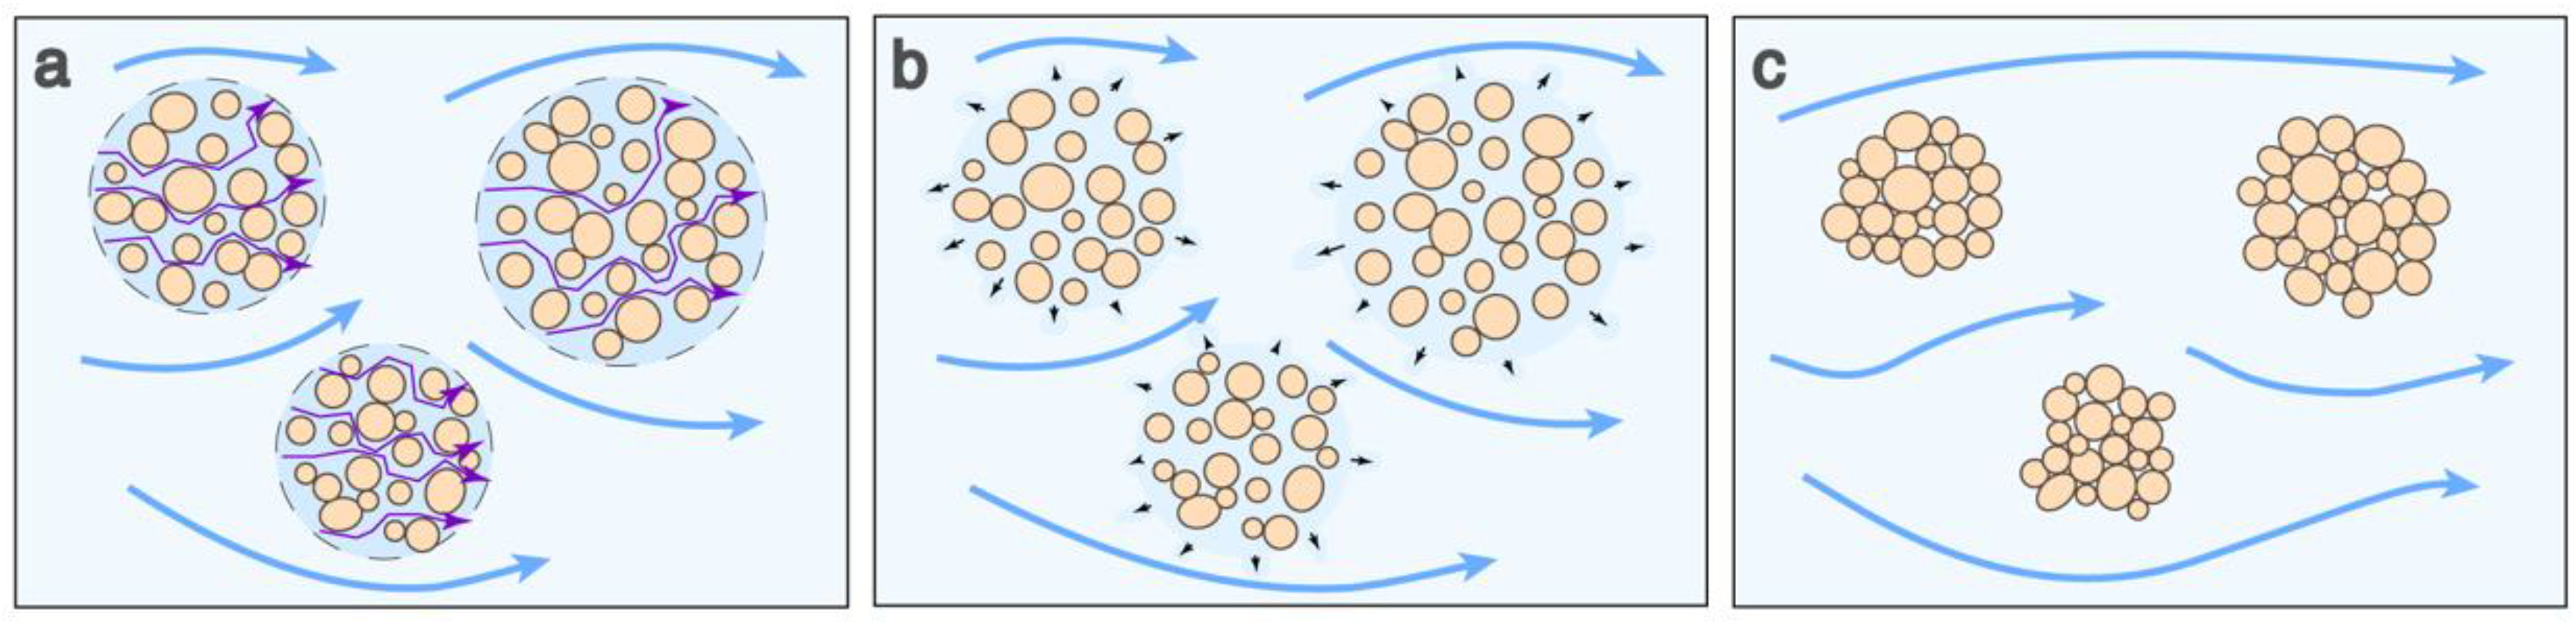
4.2. Physical Changes to Bacterial–Mineral Aggregates

As noted in Section 3.2, the relationship between shaking energy and suspension equilibrium interface height h is more or less linearly correlated in the e k range of 0 to 40.2 J·kg–1; at higher shaking energies this relationship breaks down, as witnessed in the cycle B settling curves for OC-01 and -06, which are virtually identical despite their being a twofold increase in shear stress application between sample treatments. This observation points to the existence of a threshold e k value, induced by a sustained amount of turbulent hydrodynamic shear at a given frequency, above which there are no significant differences in the observed settling behaviour. The idea is intuitive when one recalls that the underlying structures of these BIOS aggregates are relatively brittle, high-aspect-ratio polymeric sheaths formed by bacteria. The collapse and densification of the aggregates is accompanied by the fragmentation of these structures, which is a function of their shear strength [24]. As the bacterial sheaths are fragmented into smaller particles with continued shaking, the energy barrier or threshold for further breakage is elevated while the applied shear force remains constant. For a given hydrodynamic condition, there exists an equilibrium minimum sheath length ( L m i n , introduced in Equations (17) and (18)) occurring when local shearing forces equal sheath strength and further fragmentation ceases [37,52]. This energy threshold, inferred from observations of suspension settling behaviour, is corroborated here in the results of microscopic investigations of bacterial sheath lengths, as the asymptotic threshold value representing the minimum sheath length ( f m i n = 0.53 ± 0.03) is approached just beyond an applied specific kinetic energy of 40.2 J·kg–1, at which point additional shaking has little to no effect on the subsequent aggregate fragments.
There is reasonable agreement between theoretical aggregate diameters and observed sheath lengths (i.e., within an order of magnitude), considering that BIOS aggregates have been observed to consist of tangled meshes of fibrillar bacterial sheaths, where object lengths are expected to be less than total aggregate diameters ( L < d a g g ). These results are also in general agreement with the measured diameters of similar BIOS aggregates reported by Posth et al. [5] and Chan et al. [50] ranging from 5 to 56 µm. While simple breakage of the aggregates (without densification) may be a possible interpretation of the results of microscopic investigations of the aggregate structures, when taken in concert with the findings of volumetric analyses on the samples, shear-induced densification provides a phenomenological explanation for the observed decrease in settling heights and increase in final solids volume fractions and bulk densities over successive cycles in the settling experiments. A caveat here concerns the possibility that the enhanced settling rates of the shaken suspensions may be partially offset by shearing and tearing of larger aggregates into smaller “satellite aggregates,” which would tend to decrease settling rates; subsequent investigations must seek to resolve these uncertainties in the cumulative processes affecting bacterial–mineral aggregates undergoing hydrodynamic shear stress. Overall, these findings are in concordance with several other studies, which describe to varying degrees the observed deformation and densification of bacterial–mineral aggregates subject to changes in flow conditions in natural settings, albeit in a less quantitative manner than the results presented here [14,61,62,63].

4.3. Broader Implications of Aggregate Densification

The water content of swollen gel-like aggregates before densification typically exceeds 95% [64]; in this study, the undensified suspensions ranged from 99.87 to 99.95% water content. As such, sheared and settling aggregates have the potential for considerable intra-aggregate fluid flow, and this has important consequences for the diffusion of substrates to bacteria fixed within the aggregates. Emerson et al. [19] observed that the tortuous flow paths through filamentous BIOS aggregates could lead to significantly slower intra-aggregate flow, thus benefiting local iron-oxidizing bacteria by entraining Fe-rich waters and increasing Fe(II) availability. With aggregate dewatering and densification, intra-aggregate flow is effectively reduced to zero as the internal pressure equilibrates with the external pressure acting on the aggregate. Intuitively, these changes in aggregate material properties will have subsequent effects on the character of the resulting sediments that settle out of the water column, with important hydrogeological implications (relating to the permeability and hydraulic conductivity of aquifer sediments, for instance).
At the same time, the ramifications for the living component of bacterial–mineral aggregates are significant. If aggregate dewatering and densification are physiologically detrimental for microbial inhabitants in terms of nutrient fluxes, the question is raised whether shear-induced aggregate densification can be modulated by microbial activity, and what form such modulations would take. On the one hand, aggregate densification may be promoted through the ongoing microbial precipitation of higher density minerals (e.g., Fe-oxyhydroxides), but at the energetic expense of limiting nutrient fluxes by constricting intra-aggregate flow, even if this flow is minimal compared to inter-aggregate flow. Conversely, the bacterial production of low-density biomass may counterbalance the effects of fluid flow on increasing bulk density and decreasing aggregate size, but at the risk of the hydrodynamic shear-induced detachment and washout of the microbial aggregates during elevated flow conditions, away from optimal physicochemical conditions. From limited observations in the field, this bioenergetic balance seems to prevail such that the aggregate structures are equilibrated with respect to the shear stresses while cellular growth continues. Liu and Tay [62] note that under hydrodynamic shear forces, biofilms have been observed to secrete more exopolysaccharides, in turn balancing the more coherent aggregate structure against the effective hydromechanical shear force. In the face of fluid shear oscillations caused by phenomena such as storm events, meltwater-driven freshets, or variations in current velocities associated with temperature and density (i.e., thermohaline) fluctuations, this bioenergetic response would lead to the formation of a stable microbial community [24,63]. It is also possible that gentler and slower in situ densification processes might be significant in natural flow settings on longer temporal scales; the effects on batch settling of such slow densification mechanisms have been modelled by Zhang et al. [42]. Potential microbial contributions to such short- and long-term natural aggregate densification processes must be explored in future studies.
An important additional consideration relates to the deposition and fossilization of bacterial sheath and stalk morphotypes related to these sensitive aggregate materials. The susceptibility of BIOS sheath components to breakage with hydrodynamic shear-induced densification is witnessed in the results of this study, suggesting a poor preservation potential and a reduced prevalence of intact microfossils in the sedimentary record. This possible underrepresentation of bacterial morphotypes raises a potentially significant knowledge gap in our understanding of early life processes on Earth. Further investigations into the effects of hydrodynamic shear-induced densification on bacterial–mineral aggregates can aid in addressing these and other issues, such as refining the search for unequivocal biomarkers in the sedimentary records of Mars and other planetary bodies, where, if life does exist, it is posited to involve a tight energetic coupling between microorganisms and their surrounding geosphere, as seen on Earth [65,66].
As bacterial–material aggregates are abundant and widely distributed on Earth, elucidating the natural processes that alter and shape these materials has potentially far-reaching ramifications. The fate of these geo-active composite materials is intertwined with nutrient cycling and the mobility and toxicity of trace contaminants in aqueous systems, as discussed earlier. The interdisciplinary sciences tasked with addressing the urgent environmental problems of the present day will be served by a greater understanding of the behaviour of bacterial–mineral aggregates in nature, and their susceptibility to important material alterations induced by physical phenomena such as hydrodynamic shear-induced densification. Further investigations will aid in a better understanding of this phenomenon and, more generally, the complex feedback processes between microorganisms and geological materials that shape our planet.

Author Contributions

Conceptualization, B.A.E., F.G.F.; Funding acquisition, F.G.F.; Investigation, B.A.E.; Methodology, B.A.E., F.G.F.; Supervision, F.G.F.; Writing—original draft, B.A.E.

Funding

This research was funded through a Natural Science and Engineering Research Council (NSERC) of Canada Discovery Grant (2018-05839) to F.G.F.

Acknowledgments

The authors thank Shelagh Ogilvie for continued access to the field site.

Conflicts of Interest

The authors declare no conflict of interest.

References

  1. Du, H.H.; Lin, Y.P.; Chen, W.L.; Cai, P.; Rong, X.M.; Shi, Z.H.; Huang, Q.Y. Copper adsorption on composites of goethite, cells of Pseudomonas putida and humic acid. Eur. J. Soil Sci. 2017, 68, 514–523. [Google Scholar] [CrossRef]
  2. Moon, E.M.; Peacock, C.L. Adsorption of Cu(II) to ferrihydrite and ferrihydrite–bacteria composites: Importance of the carboxyl group for Cu mobility in natural environments. Geochim. Cosmochim. Acta 2012, 92, 203–219. [Google Scholar] [CrossRef]
  3. Anderson, C.R.; James, R.E.; Fru, E.C.; Kennedy, C.B.; Pedersen, K. In situ ecological development of a bacteriogenic iron oxide-producing microbial community from a subsurface granitic rock environment. Geobiology 2006, 4, 29–42. [Google Scholar] [CrossRef]
  4. Gault, A.G.; Ibrahim, A.; Langley, S.; Renaud, R.; Takahashi, Y.; Boothman, C.; Lloyd, J.R.; Clark, I.D.; Ferris, F.G.; Fortin, D. Microbial and geochemical features suggest iron redox cycling within bacteriogenic iron oxide-rich sediments. Chem. Geol. 2011, 281, 41–51. [Google Scholar] [CrossRef]
  5. Posth, N.R.; Huelin, S.; Konhauser, K.O.; Kappler, A. Size, density and composition of cell–mineral aggregates formed during anoxygenic phototrophic Fe(II) oxidation: Impact on modern and ancient environments. Geochim. Cosmochim. Acta 2010, 74, 3476–3493. [Google Scholar] [CrossRef]
  6. Li, Y.; Long, X.; Chong, Y.; Yu, G.; Huang, Z. Characterization of the cell–Fe mineral aggregate from nitrogen removal employing ferrous and its adsorption features to heavy metal. J. Clean. Prod. 2017, 156, 538–548. [Google Scholar] [CrossRef]
  7. Schädler, S.; Burkhardt, C.; Hegler, F.; Straub, K.L.; Miot, J.; Benzerara, K.; Kappler, A. Formation of Cell-Iron-Mineral Aggregates by Phototrophic and Nitrate-Reducing Anaerobic Fe(II)-Oxidizing Bacteria. Geomicrobiol. J. 2009, 26, 93–103. [Google Scholar] [CrossRef]
  8. Elliott, A.V.C.; Plach, J.M.; Droppo, I.G.; Warren, L.A. Collaborative microbial Fe-redox cycling by pelagic floc bacteria across wide ranging oxygenated aquatic systems. Chem. Geol. 2014, 366, 209–216. [Google Scholar] [CrossRef]
  9. Hao, L.; Li, J.; Kappler, A.; Obst, M. Mapping of Heavy Metal Ion Sorption to Cell-Extracellular Polymeric Substance-Mineral Aggregates by Using Metal-Selective Fluorescent Probes and Confocal Laser Scanning Microscopy. Appl. Environ. Microb. 2013, 79, 6524–6534. [Google Scholar] [CrossRef] [PubMed] [Green Version]
  10. Kappler, A.; Straub, K.L. Geomicrobiological Cycling of Iron. Rev. Mineral. Geochem. 2005, 59, 89–108. [Google Scholar] [CrossRef]
  11. Kennedy, C.B.; Gault, A.G.; Fortin, D.; Clark, I.D.; Ferris, F.G. Retention of iodide by bacteriogenic iron oxides. Geomicrobiol. J. 2011, 28, 387–395. [Google Scholar] [CrossRef]
  12. Langley, S.; Gault, A.G.; Ibrahim, A.; Takahashi, Y.; Renaud, R.; Fortin, D.; Clark, I.D.; Ferris, F.G. Sorption of Strontium onto Bacteriogenic Iron Oxides. Environ. Sci. Technol. 2009, 43, 1008–1014. [Google Scholar] [CrossRef] [PubMed]
  13. Bauld, J.; D’Amelio, E.; Farmer, J.D. Modern Microbial Mats. In The Proterozoic Biosphere: A Multidisciplinary Study; Schopf, J.W., Klein, C., Eds.; Cambridge University Press: Cambridge, UK, 1992; pp. 261–270. ISBN 0521366151. [Google Scholar]
  14. Schieber, J.; Glamoclija, M. Microbial mats built by iron bacteria: A modern example from southern Indiana. In Atlas of Microbial Mat Features Preserved Within the Siliciclastic Rock Record; Schieber, J., Bose, P., Eriksson, P., Banerjee, S., Sarkar, S., Altermann, W., Catuneanu, O., Eds.; Elsevier: Amsterdam, The Netherlands, 2007; pp. 233–244. ISBN 9780444528599. [Google Scholar]
  15. Kapellos, G.E.; Alexiou, T.S.; Payatakes, A.C. Theoretical modeling of fluid flow in cellular biological media: An overview. Math. Biosci. 2010, 225, 83–93. [Google Scholar] [CrossRef] [PubMed]
  16. Oyen, M.L. Mechanical characterisation of hydrogel materials. Int. Mater. Rev. 2014, 59, 44–59. [Google Scholar] [CrossRef]
  17. Usher, S.P.; Spehar, R.; Scales, P.J. Theoretical analysis of aggregate densification: impact on thickener performance. Chem. Eng. J. 2009, 151, 202–208. [Google Scholar] [CrossRef]
  18. Droppo, I.G.; Leppard, G.G.; Flannigan, D.T.; Liss, S.N. The freshwater floc: A functional relationship of water and organic and inorganic floc constituents affecting suspended sediment properties. Water Air Soil Pollut. 1997, 99, 43–54. [Google Scholar] [CrossRef]
  19. Emerson, D.; Fleming, E.J.; McBeth, J.M. Iron-Oxidizing Bacteria: An Environmental and Genomic Perspective. Ann. Rev. Microbiol. 2010, 64, 561–583. [Google Scholar] [CrossRef] [PubMed]
  20. Van Deventer, B.B.G.; Usher, S.P.; Kumar, A.; Rudman, M.; Scales, P.J. Aggregate densification and batch settling. Chem. Eng. J. 2011, 171, 141–151. [Google Scholar] [CrossRef]
  21. Scales, P.J.; Dixon, D.R.; Harbour, P.J.; Stickland, A.D. The fundamentals of wastewater sludge characterization and filtration. Water Sci. Technol. 2004, 49, 67–72. [Google Scholar] [CrossRef] [PubMed]
  22. Grassia, P.; Usher, S.P.; Scales, P.J. A simplified parameter extraction technique using batch settling data to estimate suspension material properties in dewatering applications. Chem. Eng. Sci. 2008, 63, 1971–1986. [Google Scholar] [CrossRef]
  23. Pearse, M.J. Historical use and future development of chemicals for solid–liquid separation in the mineral processing industry. Miner. Eng. 2003, 16, 103–108. [Google Scholar] [CrossRef]
  24. Ferris, F.G.; James, R.E.; Pedersen, K. Fragmentation of bacteriogenic iron oxides in response to hydrodynamic shear stress. Geomicrobiol. J. 2015, 32, 564–569. [Google Scholar] [CrossRef]
  25. Gerdes, G. Structures left by modern microbial mats in their host sediments. In Atlas of Microbial Mat Features Preserved Within the Siliciclastic Rock Record; Schieber, J., Bose, P., Eriksson, P., Banerjee, S., Sarkar, S., Altermann, W., Catuneanu, O., Eds.; Elsevier: Amsterdam, The Netherlands, 2007; pp. 5–38. ISBN 9780444528599. [Google Scholar]
  26. Konhauser, K.O.; Hamade, T.; Raiswell, R.; Morris, R.C.; Ferris, F.G.; Southam, G.; Canfield, D.E. Could bacteria have formed the Precambrian banded iron formations? Geology 2002, 30, 1079–1082. [Google Scholar] [CrossRef]
  27. Kennedy, C.B.; Scott, S.D.; Ferris, F.G. Hydrothermal phase stabilization of 2-line ferrihydrite by bacteria. Chem. Geol. 2004, 212, 269–277. [Google Scholar] [CrossRef]
  28. Edwards, B.A.; Shirokova, V.L.; Enright, A.M.L.; Ferris, F.G. Dependence of In Situ Bacterial Fe(II)-Oxidation and Fe(III)-Precipitation on Sequential Reactive Transport. Geomicrobiol. J. 2018, 35, 503–510. [Google Scholar] [CrossRef]
  29. Ferris, F.G.; Enright, A.M.L.; Fortin, D.; Clark, I.D. Rates of Fe(II)-oxidation and solubility of bacteriogenic iron oxides. Geomicrobiol. J. 2016, 33, 237–242. [Google Scholar] [CrossRef]
  30. Gauger, T.; Byrne, J.M.; Konhauser, K.O.; Obst, M.; Crowe, S.; Kappler, A. Influence of organics and silica on Fe(II) oxidation rates and cell–mineral aggregate formation by the green-sulfur Fe(II)-oxidizing bacterium Chlorobium ferrooxidans KoFox—Implications for Fe(II) oxidation in ancient oceans. Earth Planet. Sci. Lett. 2016, 443, 81–89. [Google Scholar] [CrossRef]
  31. James, R.E.; Ferris, F.G. Evidence for microbial-mediated iron oxidation at a neutrophilic groundwater spring. Chem. Geol. 2004, 212, 301–311. [Google Scholar] [CrossRef]
  32. Shirokova, V.L.; Enright, A.M.L.; Kennedy, C.B.; Ferris, F.G. Thermal intensification of microbial Fe(II)/Fe(III) redox cycling in a pristine shallow sand aquifer on the Canadian Shield. Water Res. 2016, 106, 604–612. [Google Scholar] [CrossRef] [PubMed]
  33. Carr, S.D.; Easton, R.M.; Jamieson, R.A.; Culshaw, N.G. Geologic transect across the Grenville orogen of Ontario and New York. Can. J. Earth Sci. 2000, 37, 193–216. [Google Scholar] [CrossRef] [Green Version]
  34. Büchs, J. Introduction to advantages and problems of shaken cultures. Biochem. Eng. J. 2001, 7, 91–98. [Google Scholar] [CrossRef]
  35. Gaur, R.L.; Pai, M.; Banaei, N. Impact of Blood Volume, Tube Shaking, and Incubation Time on Reproducibility of QuantiFERON-TB Gold In-Tube Assay. J. Clin. Microbiol. 2013, 51, 3521–3526. [Google Scholar] [CrossRef] [PubMed] [Green Version]
  36. Cherng, W.-J.; Dong, Z.-S.; Chou, C.-C.; Yeh, C.-H.; Pan, Y.-H. Hydrodynamic Simulation of an Orbital Shaking Test for the Degradation Assessment of Blood-Contact Biomedical Coatings. Micromachines 2017, 8, 1–9. [Google Scholar] [CrossRef]
  37. Li, Z.J.; Shukla, V.; Wenger, K.; Fordyce, A.; Pedersen, A.G.; Marten, M. Estimation of Hyphal Tensile Strength in Production-Scale Aspergillus oryzae Fungal Fermentations. Biotechnol. Bioeng. 2002, 77, 601–613. [Google Scholar] [CrossRef] [PubMed]
  38. Shirokova, V.L.; Ferris, F.G. Microbial Diversity and Biogeochemistry of a Shallow Pristine Canadian Shield Groundwater System. Geomicrobiol. J. 2013, 30, 140–149. [Google Scholar] [CrossRef]
  39. Korson, L.; Drost-Hansen, W.; Millero, F.J. Viscosity of Water at Various Temperatures. J. Phys. Chem. 1969, 73, 34–39. [Google Scholar] [CrossRef]
  40. Peter, C.P.; Suzuki, Y.; Büchs, J. Hydromechanical stress in shake flasks: Correlation for the maximum local energy dissipation rate. Biotechnol. Bioeng. 2006, 93, 1164–1176. [Google Scholar] [CrossRef] [PubMed]
  41. Usher, S.P.; Scales, P.J.; White, L.R. Prediction of transient bed height in batch sedimentation at large times. AIChE J. 2006, 52, 986–993. [Google Scholar] [CrossRef]
  42. Zhang, Y.; Brassia, P.; Martin, A.; Usher, S.P.; Scales, P.J. Mathematical modeling of batch sedimentation subject to slow aggregate densification. Chem. Eng. Sci. 2015, 128, 54–63. [Google Scholar] [CrossRef]
  43. Lester, D.R.; Usher, S.P.; Scales, P.J. Estimation of the Hindered Settling Function R(ϕ) from Batch-Settling Tests. AIChE J. 2005, 51, 1158–1168. [Google Scholar] [CrossRef]
  44. Spehar, R.; Kiviti-Manor, A.; Fawell, P.; Usher, S.P.; Rudman, M.; Scales, P.J. Aggregate densification in the thickening of flocculated suspensions in an un-networked bed. Chem. Eng. Sci. 2015, 122, 585–595. [Google Scholar] [CrossRef]
  45. Benn, F.A.; Fawell, P.D.; Halewood, J.; Austin, P.J.; Costine, A.D.; Jones, W.G.; Francis, N.S.; Druett, D.C.; Lester, D. Sedimentation and consolidation of different density aggregates formed by polymer-bridging flocculation. Chem. Eng. Sci. 2018, 184, 111–125. [Google Scholar] [CrossRef]
  46. Takeno, H.; Kimura, Y.; Nakamura, W. Mechanical, Swelling, and Structural Properties of Mechanically Tough Clay-Sodium Polyacrylate Blend Hydrogels. Gels 2017, 3, 1–10. [Google Scholar] [CrossRef]
  47. Fleming, E.J.; Langdon, A.E.; Martinez-Garcia, M.; Stepanauskas, R.; Poulton, N.J.; Masland, E.D.P.; Emerson, D. What’s New Is Old: Resolving the Identity of Leptothrix ochracea Using Single Cell Genomics, Pyrosequencing and FISH. PLoS ONE 2011, 6, 1–10. [Google Scholar] [CrossRef] [PubMed]
  48. Johnson, K.W.; Carmichael, M.J.; McDonald, W.; Rose, N.; Pitchford, J.; Windelspecht, M.; Karatan, E.; Bräuer, S.L. Increased Abundance of Gallionella spp., Leptothrix spp. and Total Bacteria in Response to Enhanced Mn and Fe Concentrations in a Disturbed Southern Appalachian High Elevation Wetland. Geomicrobiol. J. 2012, 29, 124–138. [Google Scholar] [CrossRef]
  49. Vesenka, J.; Havu, J.; Hruby, K.; Emerson, D. A Model for Sheath Formation Coupled to Motility in Leptothrix ochracea. Geomicrobiol. J. 2018, 35, 366–374. [Google Scholar] [CrossRef]
  50. Chan, C.S.; McAllister, S.M.; Leavitt, A.H.; Glazer, B.T.; Krepski, S.T.; Emerson, D. The Architecture of Iron Microbial Mats Reflects the Adaptation of Chemolithotrophic Iron Oxidation in Freshwater and Marine Environments. Front. Microbiol. 2016, 7, 1–18. [Google Scholar] [CrossRef] [PubMed]
  51. Nan, J.; Yao, M.; Chen, T.; Wang, Z.; Li, Q.; Zhan, D. Experimental and numerical characterization of floc morphology: role of changing hydraulic retention time under flocculation mechanisms. Environ. Sci. Pollut. Res. 2016, 23, 3596–3608. [Google Scholar] [CrossRef] [PubMed]
  52. Droppo, I.G. Structural controls on floc strength and transport. Can. J. Civil Eng. 2004, 31, 569–578. [Google Scholar] [CrossRef]
  53. Markussen, T.N.; Andersen, T.J. Flocculation and floc break-up related to tidally induced turbulent shear in a low-turbidity, microtidal estuary. J. Sea Res. 2014, 89, 1–11. [Google Scholar] [CrossRef]
  54. Manning, A.J.; Dyer, K.R. A laboratory examination of floc characteristics with regard to turbulent shearing. Mar. Geol. 1999, 160, 147–170. [Google Scholar] [CrossRef]
  55. Kachhwal, L.K.; Yanful, E.K.; Rennie, C.D. A semi-empirical approach for estimation of bed shear stress in a tailings pond. Environ. Earth Sci. 2012, 66, 823–834. [Google Scholar] [CrossRef]
  56. Bale, A.J.; Widdows, J.; Harris, C.B.; Stephens, J.A. Measurements of the critical erosion threshold of surface sediments along the Tamar Estuary using a mini-annular flume. Cont. Shelf Res. 2006, 26, 1206–1216. [Google Scholar] [CrossRef]
  57. Jamieson, R.C.; Joy, D.M.; Lee, H.; Kostaschuk, R.; Gordon, R.P. Resuspension of Sediment-Associated Escherichia coli in a Natural Stream. J. Environ. Qual. 2005, 34, 581–589. [Google Scholar] [CrossRef] [PubMed]
  58. Van Leussen, W. Estuarine Macroflocs and Their Role in Fine-grained Sediment Transport. Ph.D. Thesis, University of Utrecht, Utrecht, The Netherlands, June 1994. [Google Scholar]
  59. Marchioli, C.; Soldati, A. Turbulent breakage of ductile aggregates. Phys. Rev. E 2015, 91, 053003. [Google Scholar] [CrossRef] [PubMed]
  60. Shanks, A.L.; Trent, J.D. Marine snow: Sinking rates and potential role in vertical flux. Deep-Sea Res. 1980, 27 Pt 1, 137–143. [Google Scholar] [CrossRef]
  61. Emerson, D.; Revsbech, N.P. Investigation of an Iron-Oxidizing Microbial Mat Community Located near Aarhus, Denmark: Field Studies. Appl. Environ. Microb. 1994, 60, 4022–4031. [Google Scholar]
  62. Liu, Y.; Tay, J.-H. The essential role of hydrodynamic shear force in the formation of biofilm and granular sludge. Water Res. 2002, 36, 1653–1665. [Google Scholar] [CrossRef]
  63. Thomas, K.; Herminghaus, S.; Porada, H.; Goehring, L. Formation of Kinneyia via shear induced instabilities in microbial mats. Phil. Trans. R. Soc. A 2013, 371, 20120362. [Google Scholar] [CrossRef] [PubMed]
  64. Okay, O. General Properties of Hydrogels. In Hydrogel Sensors and Actuators; Gerlach, G., Arndt, K.-F., Eds.; Springer: Berlin, Germany, 2010; pp. 1–14. ISBN 978-3-540-75645-3. [Google Scholar]
  65. Cockell, C.S. Geomicrobiology beyond Earth: microbe–mineral interactions in space exploration and settlement. Trends Microbiol. 2010, 18, 308–314. [Google Scholar] [CrossRef] [PubMed]
  66. Hofmann, B.A.; Farmer, J.D. Filamentous fabrics in low-temperature mineral assemblages: Are they fossil biomarkers? Implications for the search for a subsurface fossil record on the early Earth and Mars. Planet. Space Sci. 2000, 48, 1077–1086. [Google Scholar] [CrossRef]
Figure 1. Schematic diagram demonstrating the shear-induced densification phenomenon experienced by a model aggregate. The blue arrows represent inter-aggregate fluid flow while the smaller purple arrows represent intra-aggregate fluid flow following more tortuous flow paths through the permeable aggregates (a). The resulting fluid pressure gradient leads to the expulsion of the internal pore water (b) and collapse and densification of the aggregates (c).
Geosciences 08 00423 g001
Figure 2. Schematic diagram illustrating the settling of a flocculent bacteriogenic iron oxides (BIOS) suspension in an experimental batch column. Before settling at t = 0, the homogenous suspension is characterized by a uniform initial solids volume fraction ϕ 0 and a volume V s u s p e n s i o n ( 0 ) equivalent to the total aqueous volume in the container (a). At times t > 0, the aggregates settle toward the base of the container with a progressively decreasing suspension–water interface ( h < h 0 ) , forming a separate suspension phase of aggregates at the base of the container with volume V s u s p e n s i o n ( t ) < V s u s p e n s i o n ( 0 ) below a clear liquor (in blue) where ϕ = 0 (b). As t , the suspension settles to a final equilibrium height h and equilibrium suspension volume V (c), based on inverse modelling estimates.
Geosciences 08 00423 g002
Figure 3. Plots of time course data for settling trials of Ogilvie Creek BIOS (af) and Beaver Pond BIOS samples (g) for cycles A (unshaken), B (shaken or resuspended), and an additional cycle C for BP-01 (resuspended), with corresponding best fit curves based on nonlinear estimation. In all cases, the fit accounts for greater than 97% of the variance in the observed settling heights ( R > 0.97).
Geosciences 08 00423 g003
Figure 4. Plot of final cycle B observed settling heights as a function of shaking energy e k for samples OC-01, -02, -03, and -04 (for which 6.0 e k 40.2 J·kg–1). The best fit line (grey) accounts for 98% of the variance in the data points ( R = –0.98).
Geosciences 08 00423 g004
Figure 5. Scatter plot comparing the relationships between equilibrium BIOS solids concentration and settling rate constant for the general cases “before shaking” (blue) and “after shaking” (red) with sample- and cycle-marked data points (e.g., OC-01A, OC-02B) and solid regression lines with dotted 90% confidence intervals.
Geosciences 08 00423 g005
Figure 6. Light micrograph of BIOS suspension with L. ochracea-dominated filamentous sheaths and mineralized hydrous ferric oxide (HFO) particles (a) and scanning electron micrograph of dried BIOS (b). Both scale bar lengths are 10 µm.
Geosciences 08 00423 g006
Figure 7. Plot of remaining fraction of initial values ( f e k ) for measured mean and median sheath lengths L and calculated d a g g values as a function of shaking energy e k . The best fit curve (grey) accounts for 98% of the variance in the data points ( R = –0.98).
Geosciences 08 00423 g007
Table 1. Measured dry weights and descriptions of sample treatments for each cycle.
Sample m B I O S (g)Description of Sample Treatment
Cycle ACycle B
OC-010.043no shakingshaken at a frequency f = 2.69 s−1 for 60 s
OC-020.066no shakingshaken at a frequency f = 2.69 s−1 for 20 s
OC-030.084no shakingshaken at a frequency f = 2.69 s−1 for 40 s
OC-040.106no shakingshaken at a frequency f = 1.35 s−1 for 60 s
OC-050.066no shakingno shaking, resuspension
OC-060.077no shakingshaken at a frequency f = 2.69 s−1 for 120 s
BP-010.079no shakingno shaking, resuspension; repeated for cycle C trial
Table 2. Parameters and values for cycle B hydrodynamic shear stress application.
Sample 1 f (s−1) ε (m2·s−3) σ s (N·m−2) t e (s) e k (J·kg−1)
OC-012.690.650.826040.2
OC-022.690.650.822013.4
OC-032.690.650.824026.8
OC-041.350.100.32606.0
OC-062.690.650.8212080.4
1 Samples OC-05 and BP-01 did not undergo shear stress application, hence they are omitted from this table.
Table 3. Calculated v values and estimates for h and k based on inverse modelling of settling time course data.
SampleCycle v (cm·min−1) 1 h (cm) k (min−1)
OC-01A0.085.21 ± 0.070.046 ± 0.005
OC-01B0.151.33 ± 0.240.027 ± 0.002
OC-02A0.134.48 ± 0.290.015 ± 0.002
OC-02B0.162.58 ± 0.710.01 ± 0.001
OC-03A0.044.81 ± 0.190.022 ± 0.004
OC-03B0.061.08 ± 0.520.011 ± 0.001
OC-04A0.045.24 ± 0.250.023 ± 0.006
OC-04B0.043.41 ± 0.660.01 ± 0.003
OC-05A0.114.20 ± 0.080.05 ± 0.004
OC-05B0.114.14 ± 0.070.04 ± 0.002
OC-06A0.244.46 ± 0.300.017 ± 0.003
OC-06B0.721.84 ± 0.170.023 ± 0.002
BP-01A0.151.67 ± 0.240.026 ± 0.002
BP-01B0.191.79 ± 0.210.034 ± 0.003
BP-01C0.272.01 ± 0.050.049 ± 0.002
1 Calculated from Equation (7).
Table 4. Initial pre-cycle volumetric parameters and values.
Sample V B I O S (mL) V s u s p e n s i o n ( 0 ) (mL) ϕ 0   ( )
OC-010.020410.48
OC-020.030400.75
OC-030.038410.93
OC-040.048401.20
OC-050.029400.75
OC-060.035400.88
BP-010.036440.82
Table 5. Final volumetric parameters and values.
SampleCycle V (mL) ϕ a g g   ( ) ρ a g g   1 (kg·m−3) Q d a g g (µm)
OC-01A30.11.07999937156
OC-01B7.834.18100324095.3
OC-02A26.41.90100052758.0
OC-02B15.23.29100230445.5
OC-03A28.32.25100044578.2
OC-03B6.469.98101010039.1
OC-04A30.92.60100138563.9
OC-04B20.14.00100325049.8
OC-05A24.72.01100049767.5
OC-05B24.42.04100049161.5
OC-06A26.32.23100145063.9
OC-06B10.85.40100518569.4
BP-01A9.846.08100516481.0
BP-01B10.55.68100517691.2
BP-01C11.85.051005198109
1 Values for ρ a g g calculated using 998 kg·m–3 as the density of water.

