1. Introduction
When the topographic anaglyph images are viewed using red-cyan glasses, the topographic relief features can be easily identified [
1]. Anaglyphs produced using the digital elevation model (DEM) data are effective to identify the tectonic geomorphic features such as small fault scarps, broad ground deformation, and tilting surfaces [
2,
3,
4]. The analysis and interpretation of topographic anaglyphs along the eastern margin of the Japan Sea and the Japan trench reveal the distribution of active deep submarine faults [
5,
6]. Nakata et al. (2012) discussed the relation between the tectonic seafloor features and earthquake source faults during the 2011 Tohoku Pacific Ocean earthquake and concluded that active submarine faults were closely related to the earthquake source faults [
5].
In coastal areas, detailed seafloor bathymetric data acquired using narrow multibeam sonar system have revealed unique topographic features such as fault scarps [
7], submerged karst landforms [
8], submarine landslides [
9], and submerged marine terraces [
10,
11]. However, these studies have primarily focused on seafloor topography; furthermore, the studies that examine the deformation that appears both on the inland surface and the seafloor are sparse. Tectonic deformation along the coastal marine depths often extends inland so that we can use the detailed topographic data, which encompasses both the inland and seafloor areas, to understand the direction, distance, and style of deformation that occurs or may occur.
This study intends to reinvestigate the tectonic geomorphology and create new tectonic maps, for the late Quaternary in and around the Yoron islands, based on the analysis and interpretation of topographic anaglyphs derived from 3-m mesh digital surface models (DSM) of inland regions, as well as the 0.6-s to 2-s-mesh seafloor DEMs. Vintage aerial photographs were used to produce the inland DSMs, and seafloor DEMs were created using the cloud point data from multibeam echo-sounding devices provided by the National Institute of Advanced Industrial Science and Technology (AIST) as well as the Japan Agency for Marine-Earth Science and Technology (JAMSTEC).
Using the topographic anaglyph interpretation, we observe that NNW-trending left lateral strike-slip faults at the Yoron island, extend across the island arc to the north into the Yoron basin. Anticlinal deformation was also observed along the marine terraces in northeastern regions of Yoron island, as well as on the seafloor to the north of Yoron island along the island shelf. This deformation runs parallel to the eastern margin of the Yoron basin, as well as the Nanseishoto (Ryukyu) trench. The objective of this study is to apply the improved methods to further understand the island arc tectonics because, globally, active faults and the tectonic deformation have been observed in only a small portion of an island arc that comprises isolated islands.
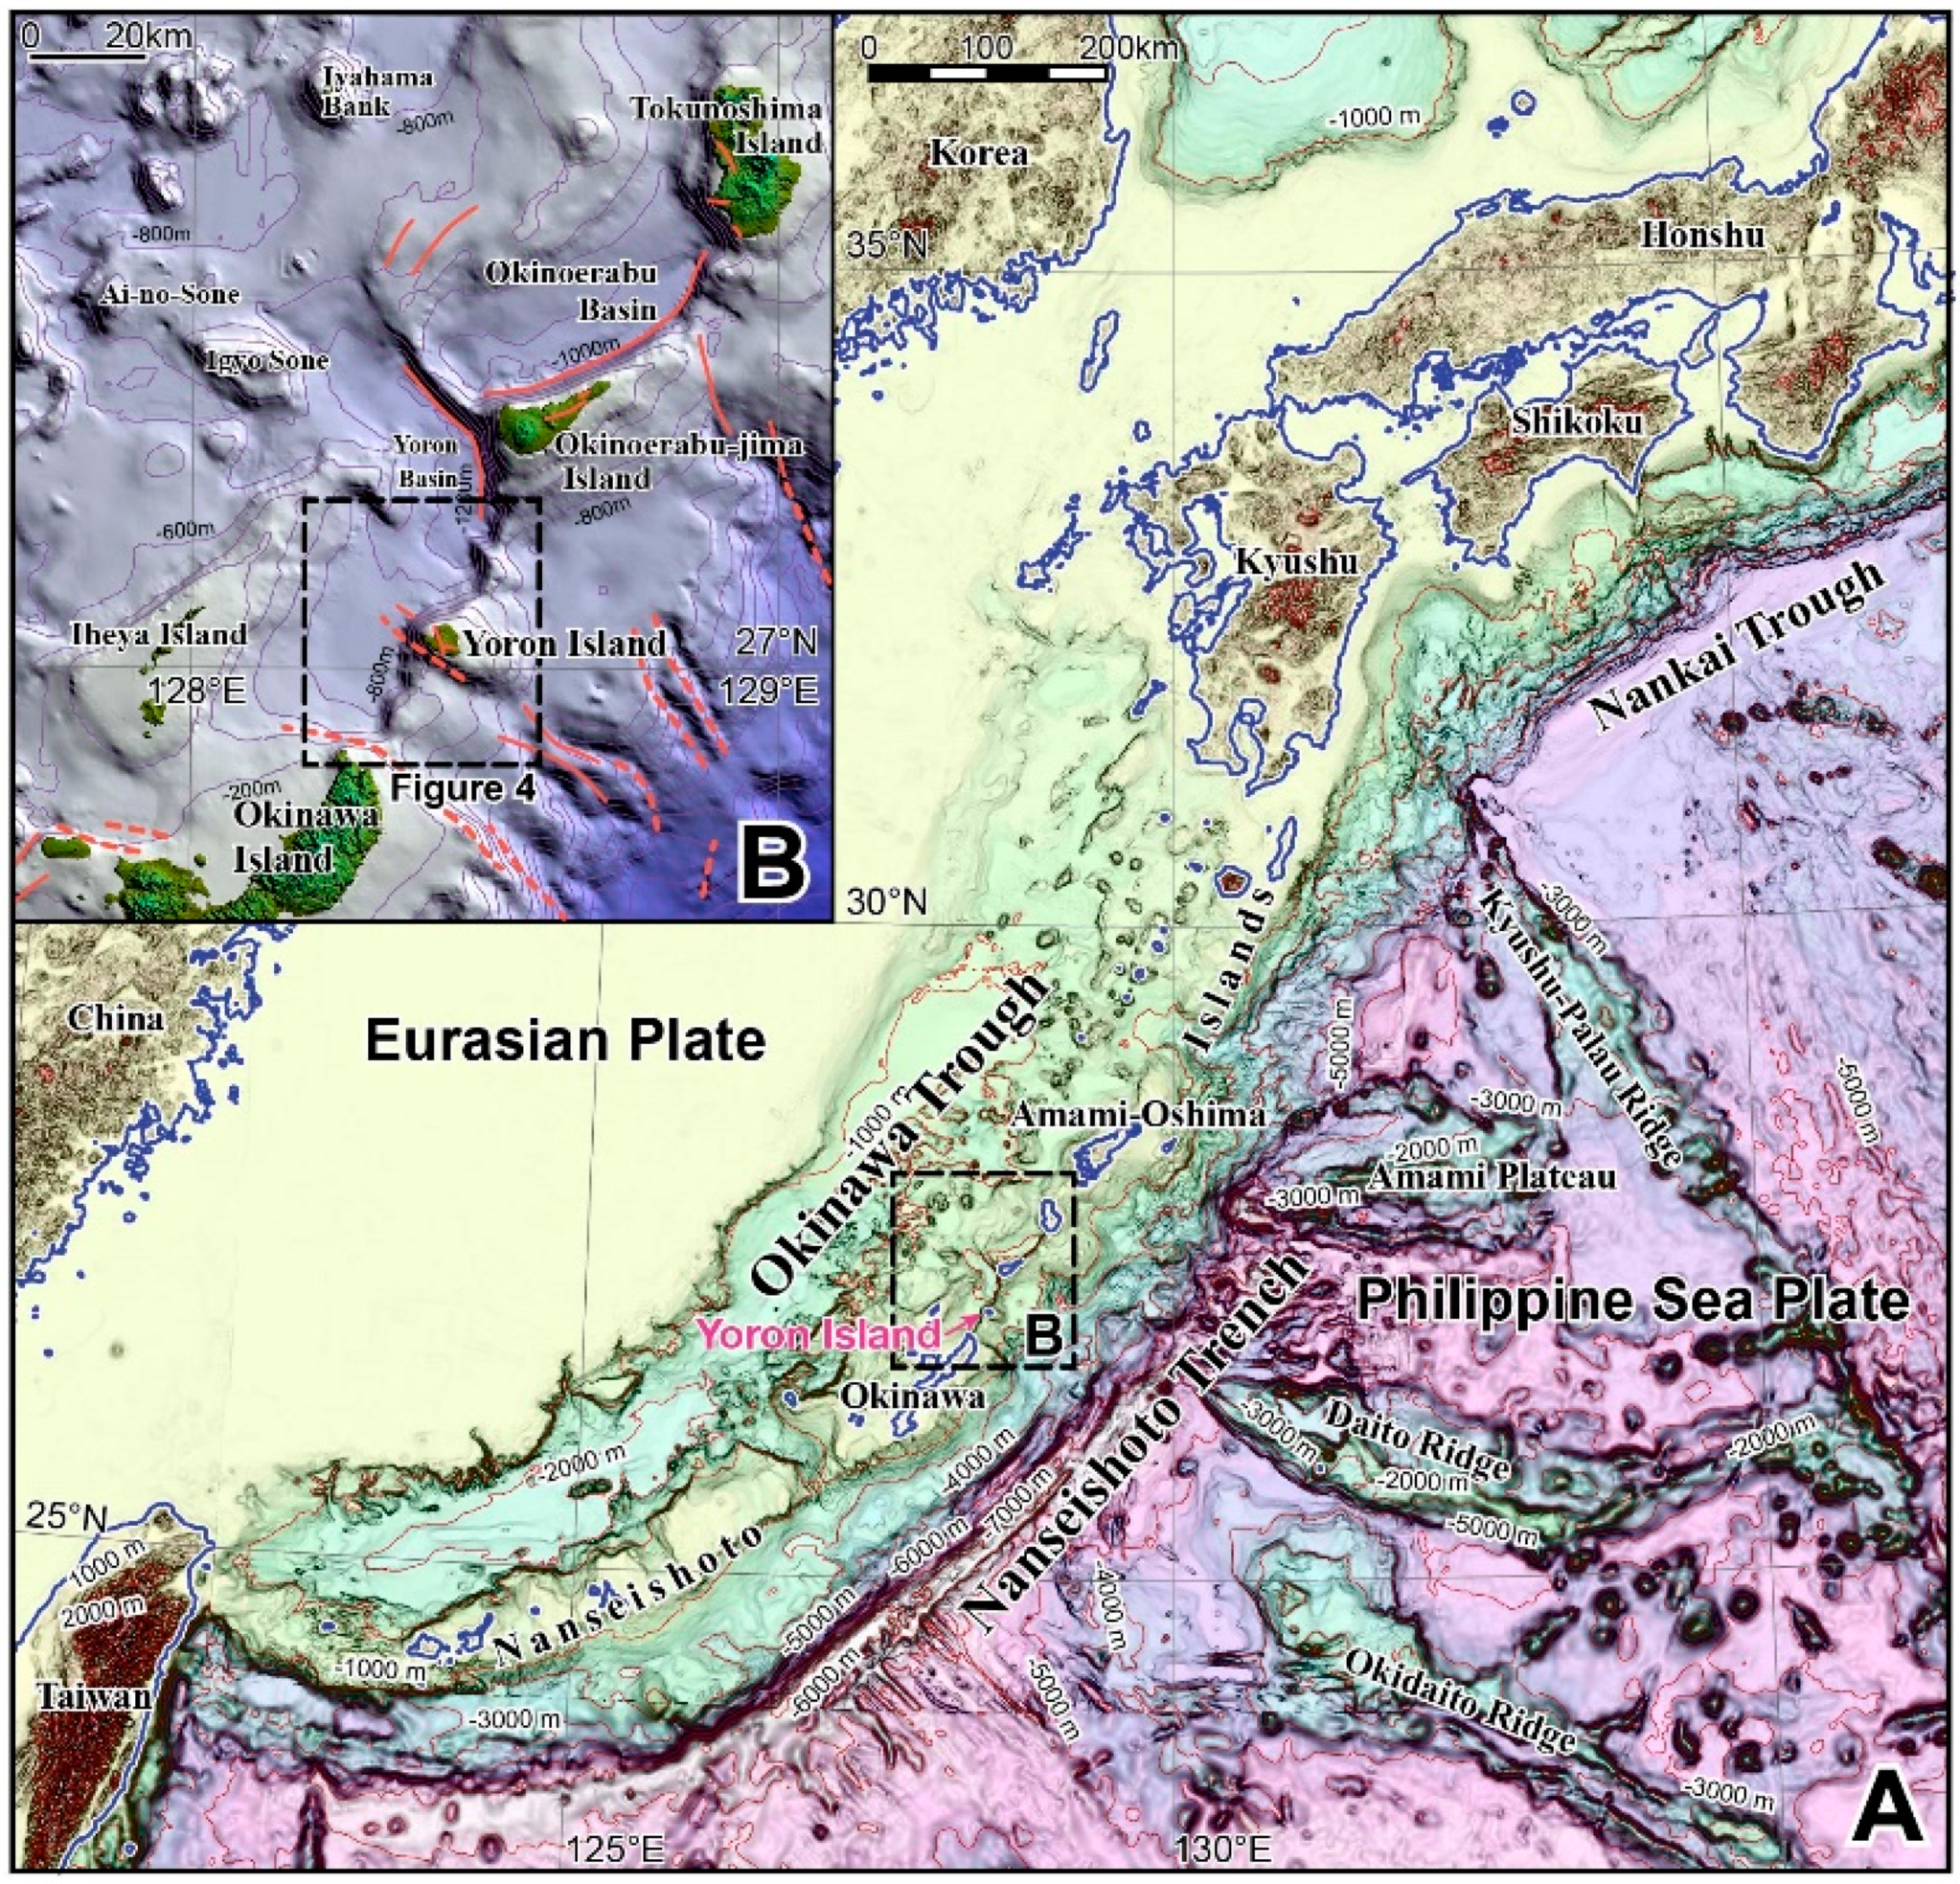
2. Tectonic Setting
Yoron island is located in the central part of the Nanseishoto islands, which extend in a NE trending direction along the island shelf whose topography is essentially formed by the subduction of the Philippine Sea plate beneath the Eurasian plate along the Nanseishoto trench (
Figure 1A). The Okinawa trough is developed via the back-arc extension of the Ryukyu arc, which is parallel to the Nanseishoto islands and the Nanseishoto trench. The EW to ENE trending grabens, which are associated with normal faulting, occur in the southwestern region of the trough, which is aligned along the trough throughout the middle to the northern regions, and at which several active volcanos exist [
12].
In the mid Nanseishoto islands, three islands (Tokunoshima, Okinoerabu-jima, and Yoron islands), spaced at an interval of 20–40 km, occur in a line between the Amami–Oshima and Okinawa islands (
Figure 1B). The coastal areas of these islands exhibit numerous well-developed coral reefs along the uplifted marine terraces [
13], which indicates that the uplift occurred during the mid to late Quaternary. According to the results of a seismic profiling survey [
14], the Plio–Pleistocene sediments beneath the uplifted coral reefs were tilted to the trench. This survey also detected Miocene sediments with thicknesses of greater than 500 m beneath the Yoron basin. Arai et al. (2015) suggested that the Yoron basin should be developed as a half graben, which led to the hypothesis that cliffs that were taller than 500 m on the eastern side of the Yoron basin were fault scarps.
Previous studies have reported the occurrence of several small active fault strands that have cut and deformed the marine terraces that occur along the Tokunoshima, Okinoerabu-jima, and Yoron islands [
15]. However, the extension and style of faulting are not well documented because certain areas of the island and terraces have limited exposure, and there is a lack of detailed topographic data.
Yoron island was formed via the uplifted coral reefs, and marine terraces covered the surfaces of the island [
15,
16]. The present-day coral reefs are well developed in and around the Yoron island, especially along the eastern shore. Fault scarps that trend NNW, cut these surfaces and extend across the central portion of the island. The present-day coral reefs also contain these fault scarps [
15].
3. Data and Methods
The 10-m mesh digital elevation model (DEM), published by the Geospatial Information Authority of Japan (GSI), is the highest resolution data that is publicly available for the Yoron island. This DEM was created from contours with an interval of 10 m on a 1:25,000 scaled topographical map, such that small topographies, e.g., old crests along the uplifted coral reefs, are not visible. The ALOS Global Digital Surface Model (AW3D30) DEM, with a horizontal pixel size of approximately ~30-m mesh released by the Japan Aerospace Exploration Agency in 2016, is useful in tectonic geomorphology [
17] and available for Yoron island. The construction of square, large cultivated fields that were originally small rounded fields affected by karst sinkholes, partially destroyed the small topography throughout the Yoron island, while topography before destruction is visible on the aerial photographs that were taken in the 1970s, which were the oldest existing large-scale color photographs.
The software adopted SfM (structure from motion) –MVS (multi-view stereo) technology, such as Agisoft PhotoScan
®, enables the creation of topographical models using aerial photographs and recorded geographical coordinates, i.e., ground control points (GCPs) [
18,
19]. We adapted the vintage colored GSI (COK-77-1) photographs, which were taken in 1977, at a scale of approximately 1:10,000 (
Table 1), and longitude and latitude information from the unalterable points on the ground acquired using GNSS (Spectra Precision Promark 120) in the field to ensure processing using PhotoScan Professional Edition
® version 1.2.6. Therefore, we generated a 0.12-s-mesh (approximately 3 m) inland DSM.
The National Institute of Advanced Industrial Science and Technology (AIST), conducted a multibeam survey from the north of Okinawa to the Okinoerabu-jima island in 2012 [
20]. The JAMSTEC (2016) stored and disseminated information for the rock and sediment core samples, as well as the results of the multibeam survey on their website, “Data and Sample Research System for Whole Cruise Information in JAMSTEC” [
21]. We collected these data using the AIST and JAMSTEC, to generate the 0.6-s-mesh (approximately 19 m) and the 2-s-mesh (approximately 65 m) seafloor DEMs, respectively. We reprocessed the 2-s-mesh DEM using digital bathymetric charts (M7020) with 1–2 m interval counters, proposed by the Japan Hydrographic Association (JHA), following the methods of [
22]. We combined these DEMs with the 500-m-mesh DEM (J-EGG500) published by the Japan Coast Gard (JCG). These were overlapped in according to the decreasing resolution.
We imported both the inland and seafloor DSMs into Simple DEM Viewer®. We further produced an anaglyph image that was overlapped onto the black and white slope shading map and the black and white shaded relief base map, for stereoscopic analysis with red-cyan glasses.
4. Results
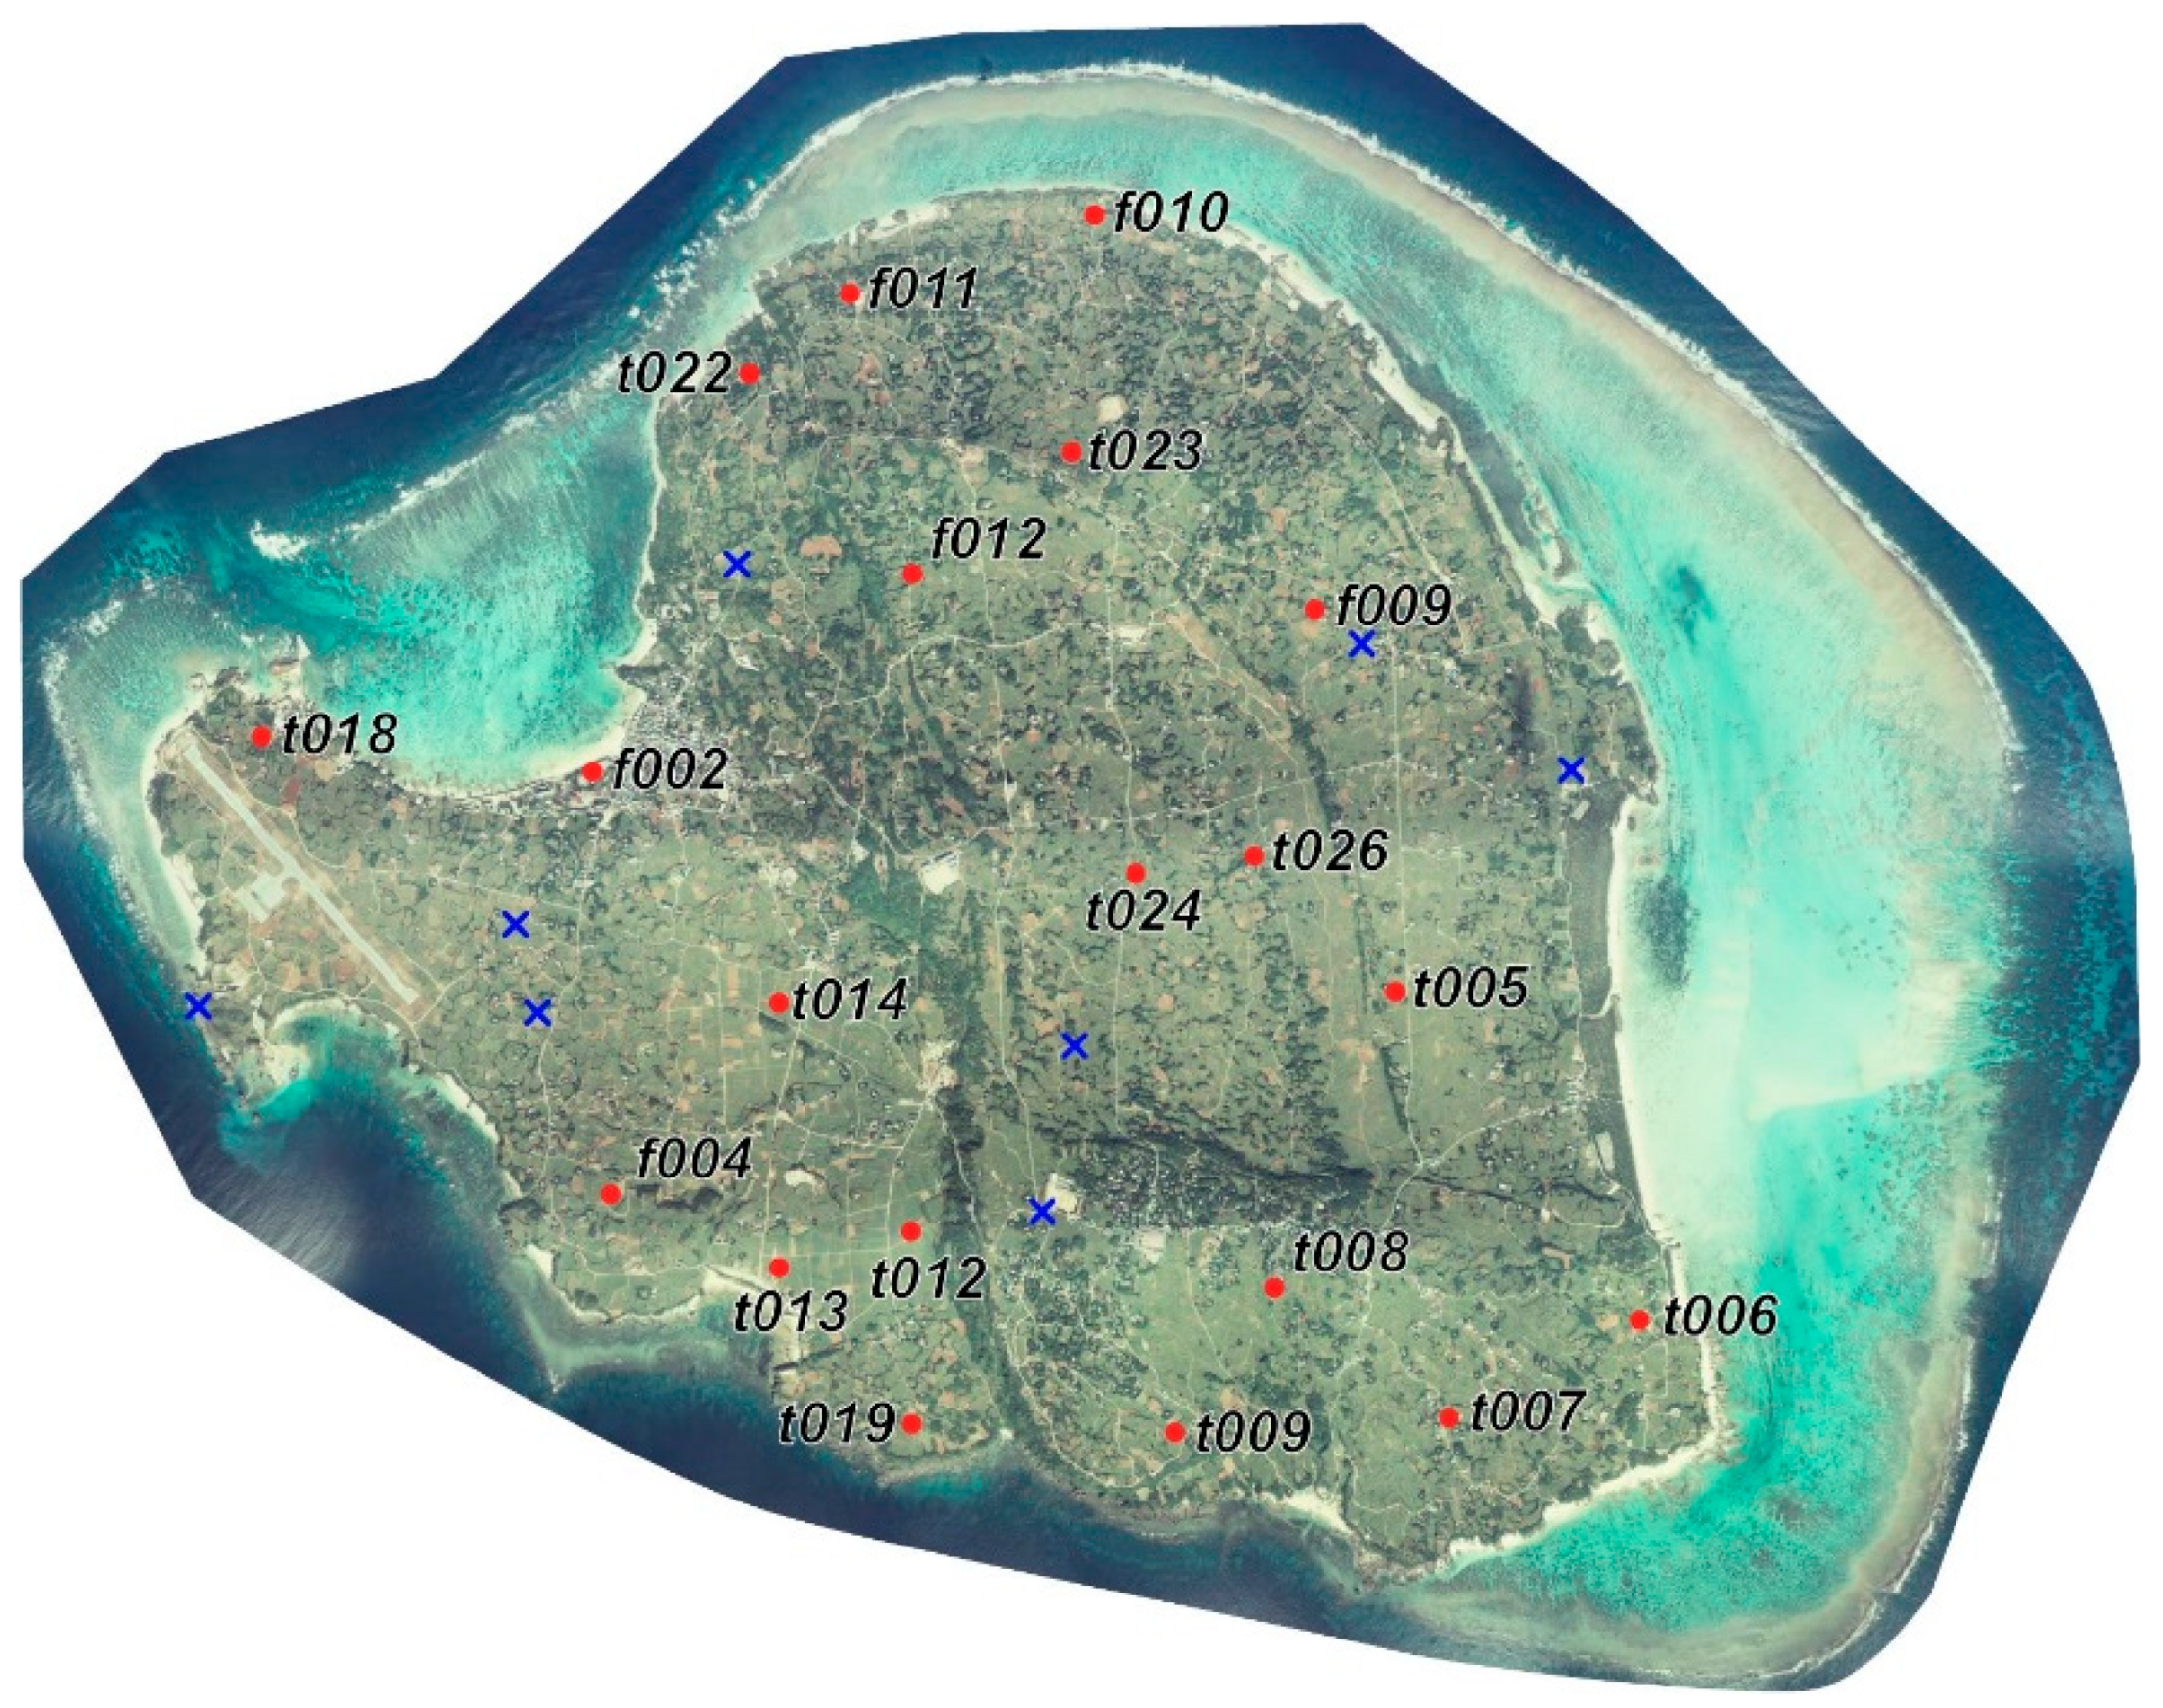
4.1. Inland DSM Accuracy Assessment
We produced the DSM based on aerial photographs from 1977, with a resolution of 0.204 m (
Table 1). The GCP residual error was approximately 1.8 m (
Figure 2,
Table 2). Validation using 8 points, revealed that this DSM exhibits a height of a root mean squared error (RMSE) of 2.6 m. We observed no inclination or distortion in the model itself. This DSM is sufficiently accurate to measure the fault scarp height, as well as the crest of the marine terrace. However, this DSM has too fine a resolution to recognize and analyze the geomorphic features on the Yoron island region, with an area of 20.8 km
2. Thus, we converted the 0.814-m mesh DSM to a 0.12-s-mesh (approximately 3 m) DSM. The 0.12-s-mesh DSM exhibits a sufficient resolution, allowing the detection of microtopography such as sugar cane fields affected by karst sinkholes, and the crests of marine terraces.
4.2. Active Fault Scarps and Ground Deformation Deduced from Topographic Anaglyphs
We identified active fault scarps and surface deformation on both the inland and seafloor, via anaglyph interpretation using red-cyan glasses. Identification criteria for this study are identical to those used by previous studies [
15].
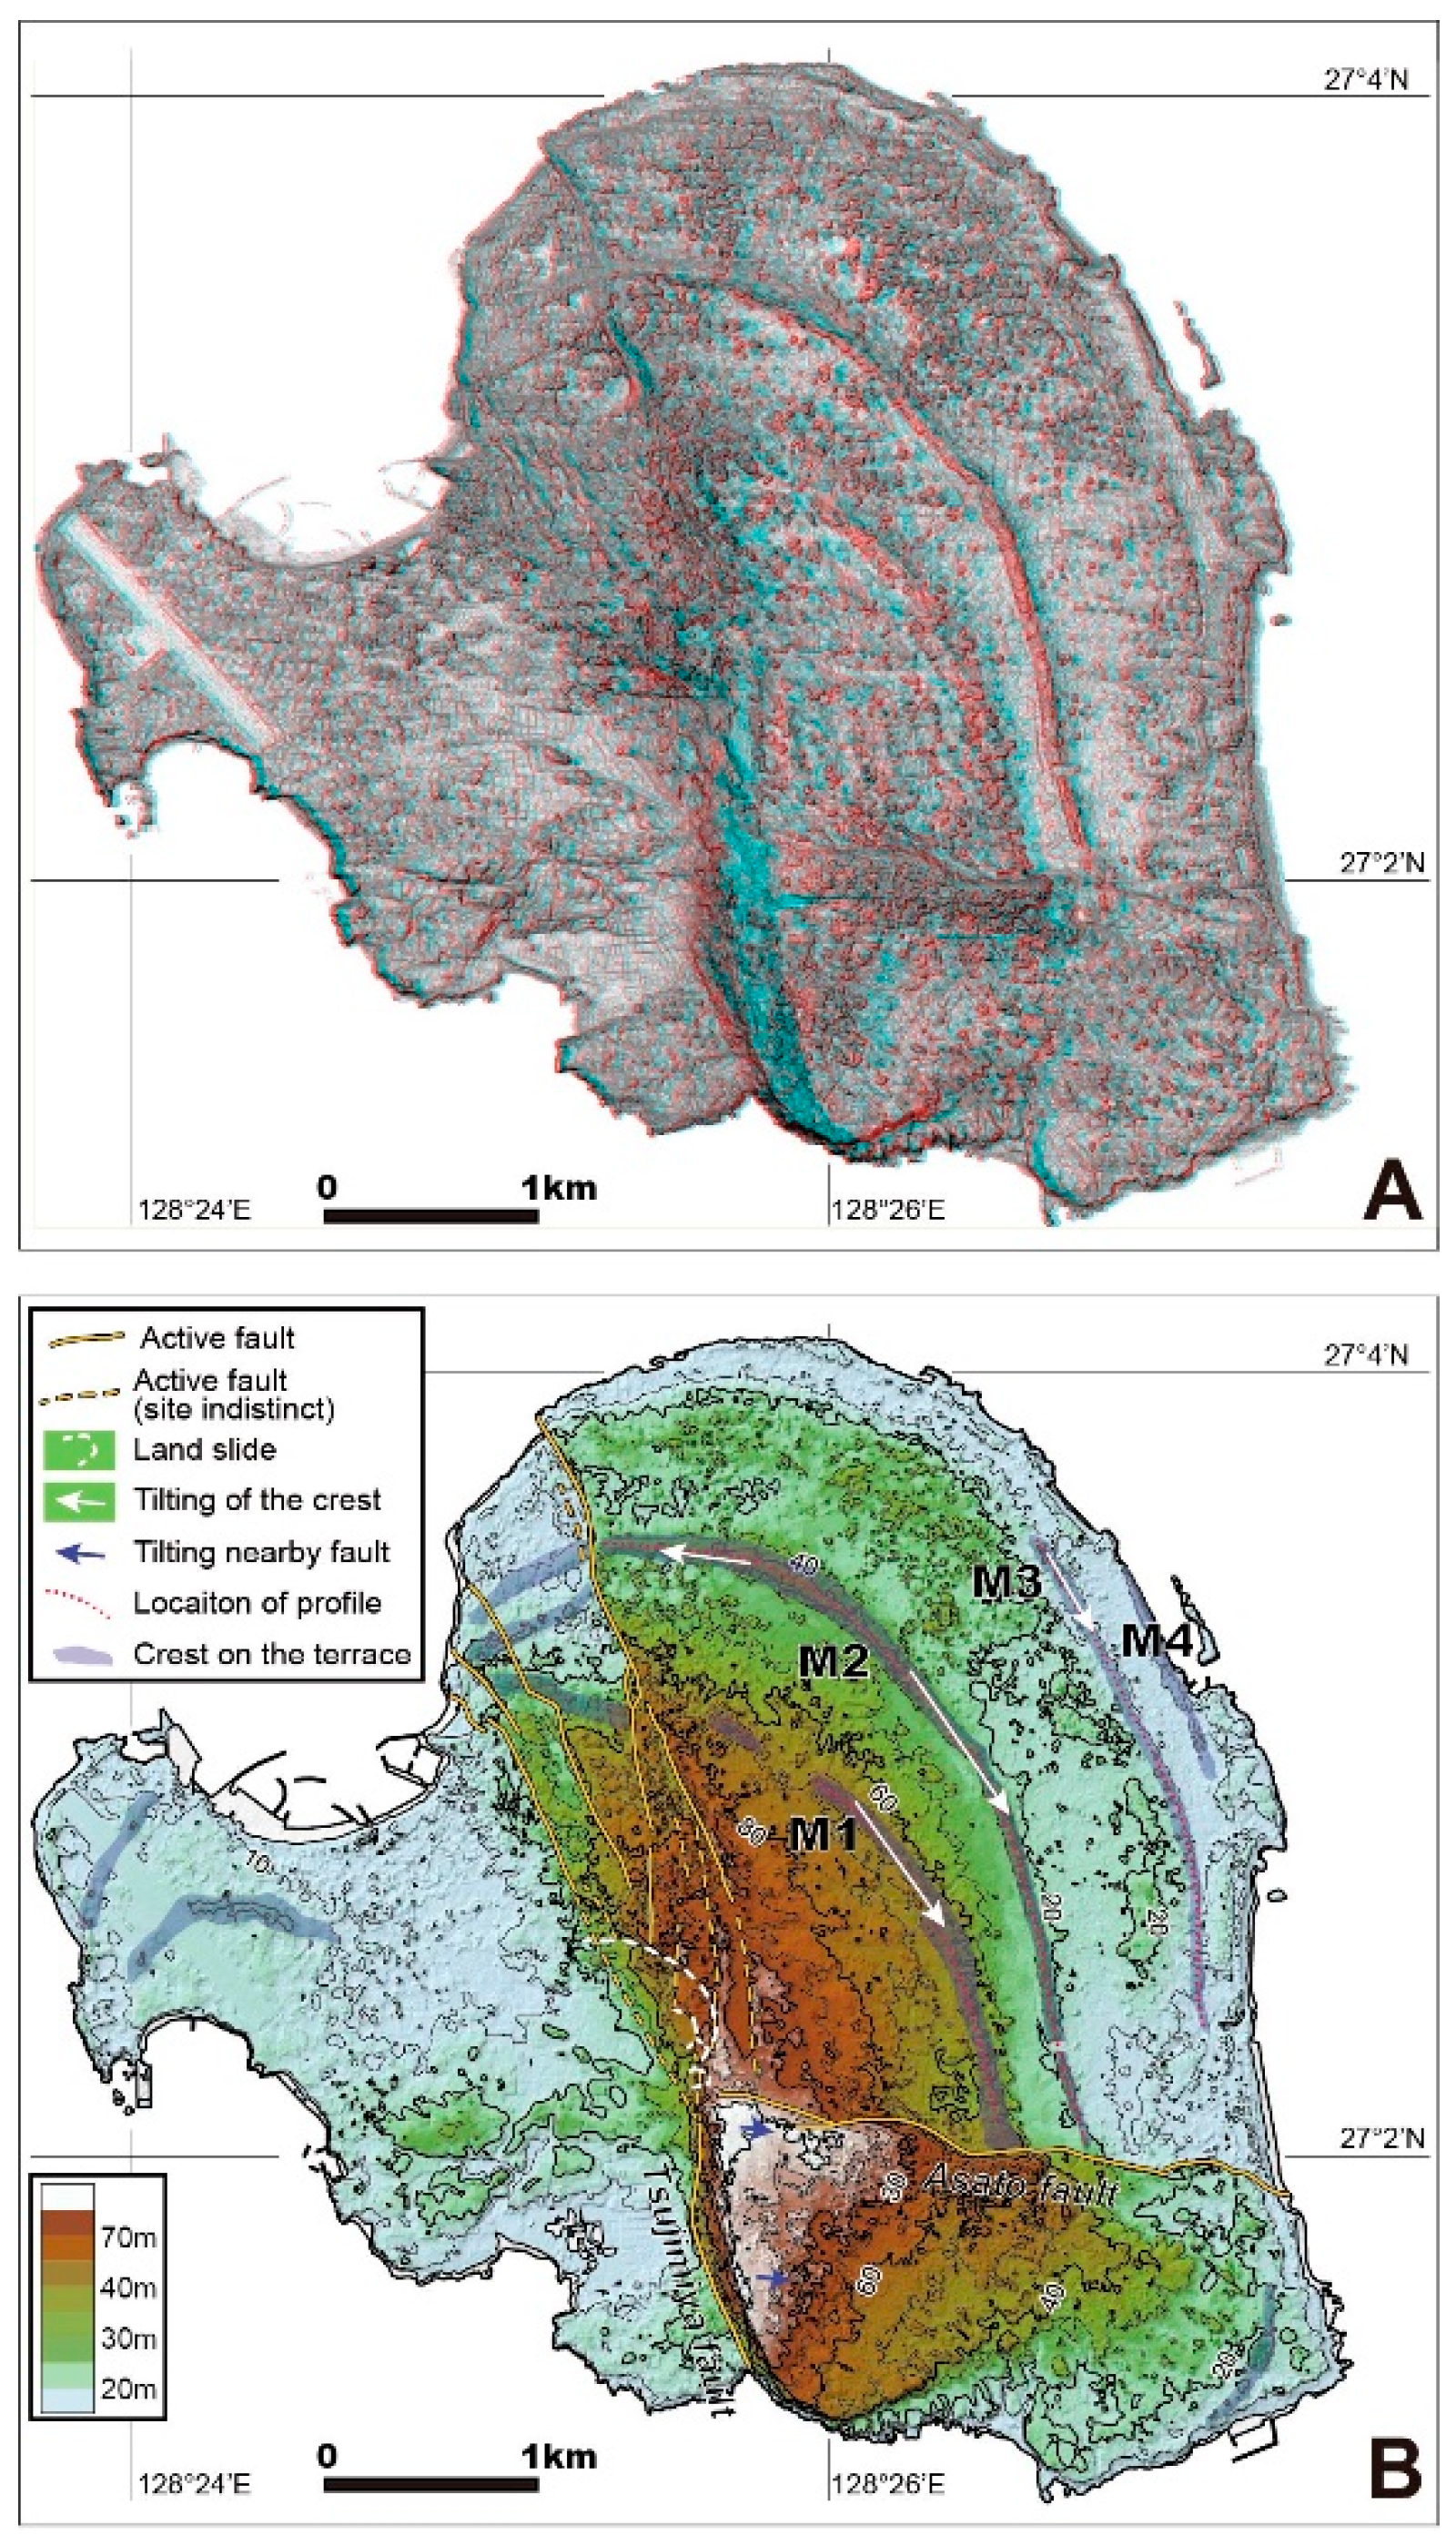
4.2.1. Active Fault Scarps on the Yoron Island
On the Yoron island, previous studies have analyzed the Tsujimiya fault, which trends NNW across the island, and the Asato fault, which trends to the southeast [
15,
23]. Based on the terrace riser offset of the lowest marine terrace, previous studies suggested that the Tsujimiya fault is a left-lateral strike-slip fault [
15].
We identified the scarps of these faults on the topographic anaglyph (
Figure 3A). The Tsujimiya fault scarp in the southern region, is isolated and faces west, with a height of less than 80 m (
Figure 3B). We observe several scarps in the mid and northern regions, which branch to the north from the island’s center, and have heights of several to 20 meters each. Surfaces near the top of the cliff in the southern region, tilt to the southeast (
Figure 3B). These fault scarps merge with the coast line on both sides of the scarp. Based on the distribution of visible reefs during low tide, we observe that the Tusjimiya fault intersects with the coral reefs throughout the northern region [
15].
We identified several circular arc-shaped cliffs along the Tsujimiya fault scarps; however, these scarps appear slightly unclear in the central region of the Yoron island, where the Tsujimiya fault merges with the Asato fault. Landslide movement has been suggested to have destroyed several of the Tsujimiya fault scarps, possibly due to faulting related to the Asato fault.
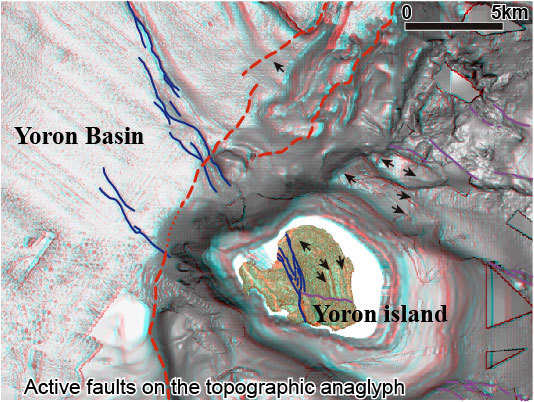
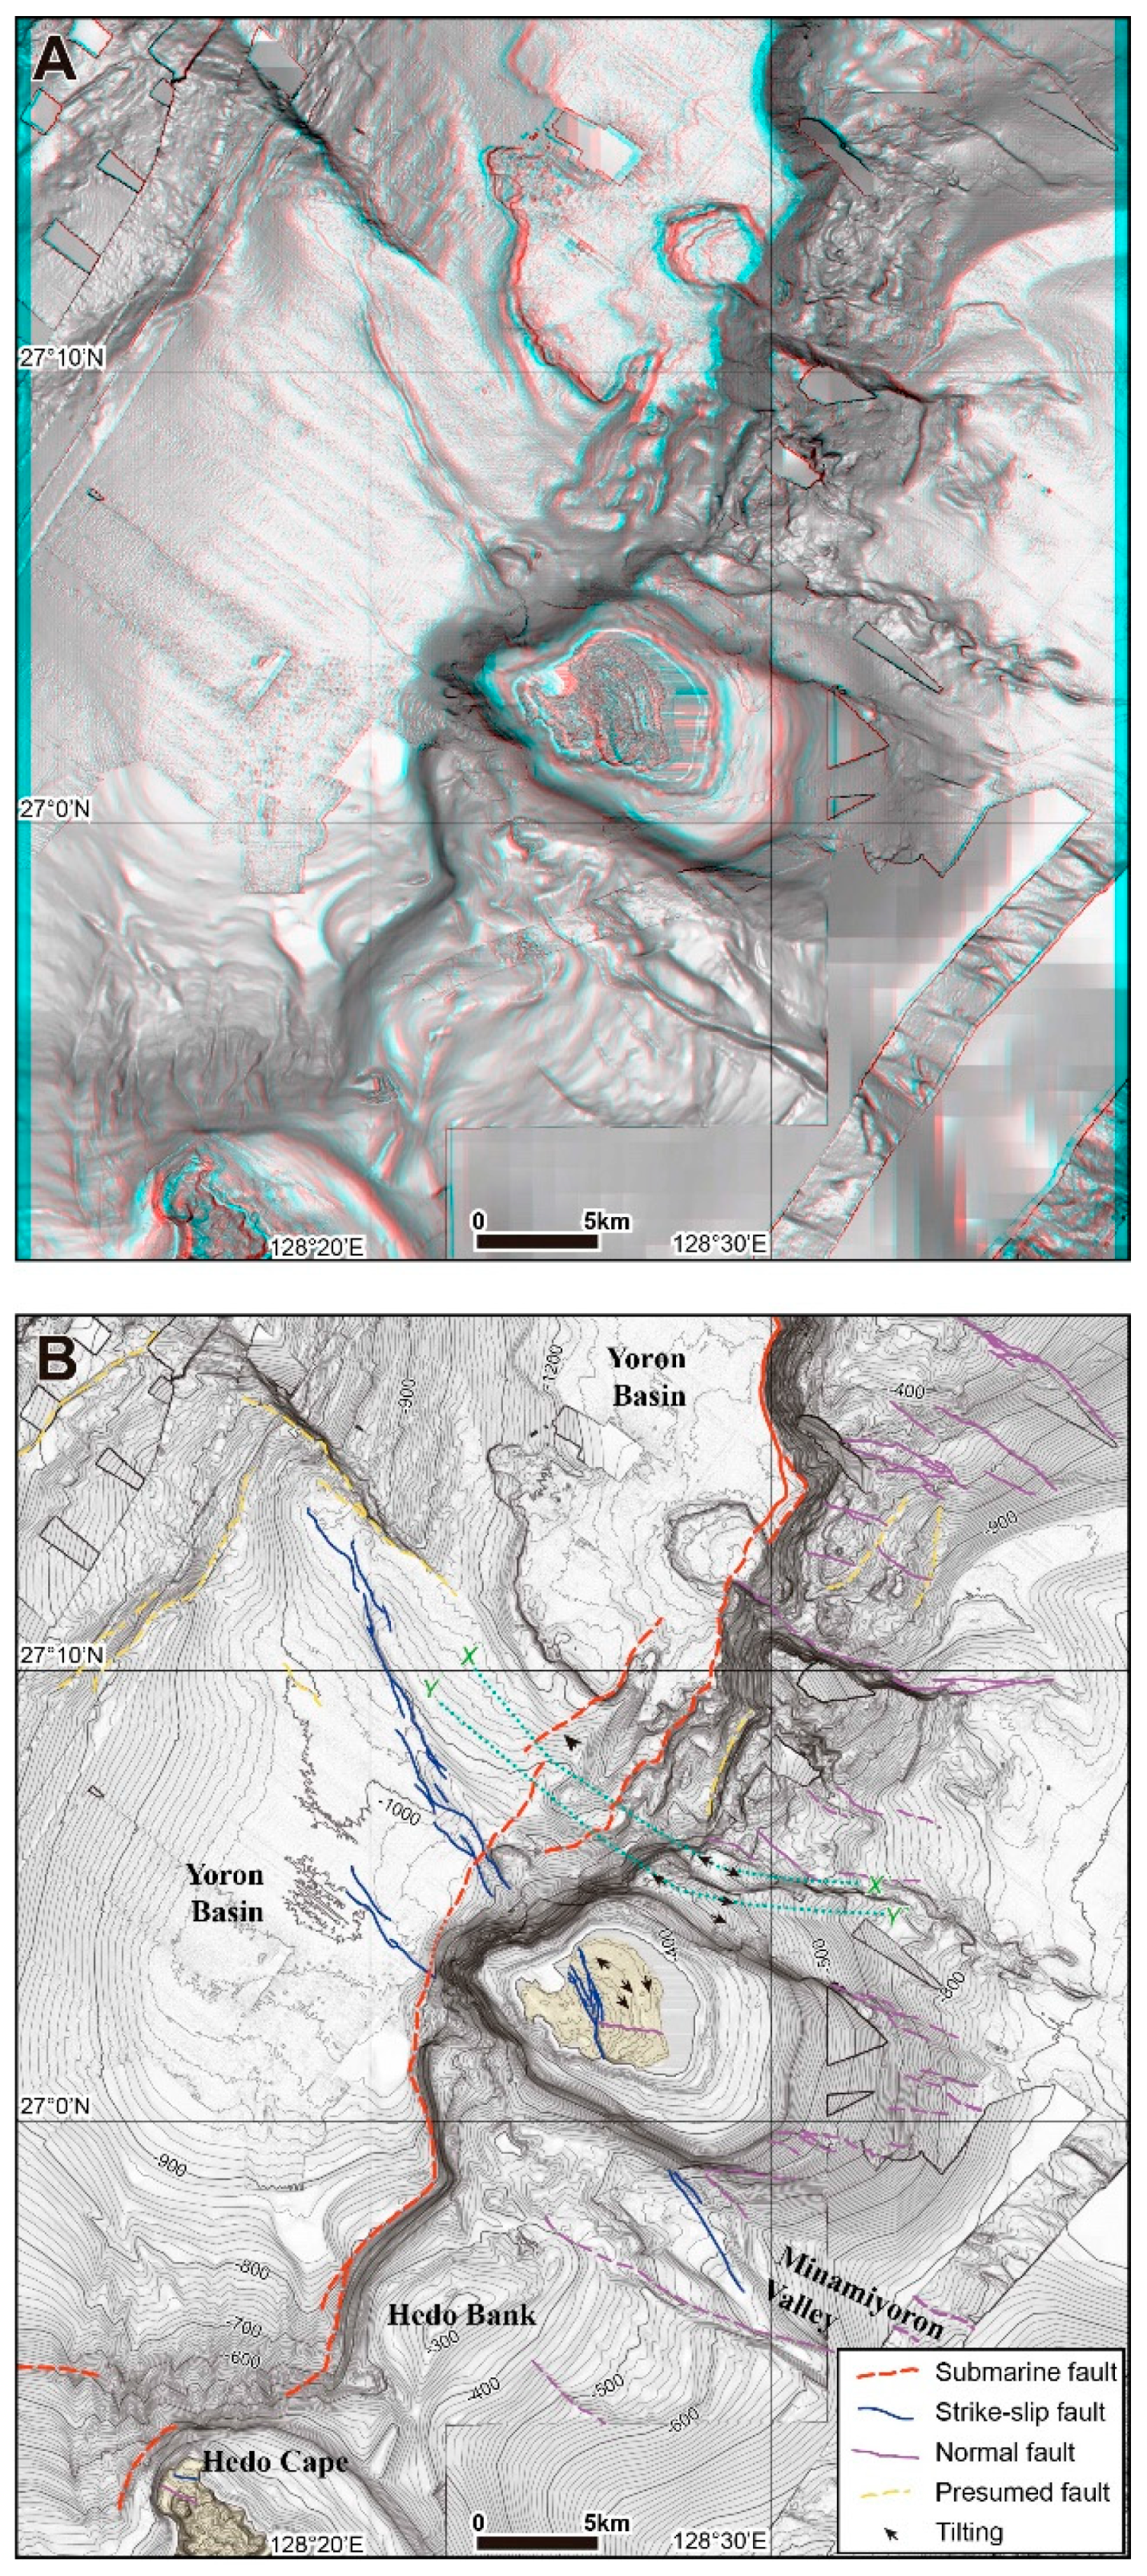
4.2.2. Active Submarine Faults in the Yoron Basin
We identified several small scarps that trend NNW and face the southwest along the seafloor in the Yoron basin, associated with the Tsujimiya fault extension on the topographical anaglyph (
Figure 4A). These small scarps, with a height of 5–25 m, extend along the flat depositional surfaces throughout the Yoron basin (
Figure 4B). Thus, we suggest that these scarps are formed via recent faulting events. These results agree with the results from recent seismic profiling surveys [
24]. Fault traces contain several stepping faults with lengths of several kilometers. Its location in the south is nearly identical to that of the active fault traces depicted by [
16]. However, it has a length of 18 km, making it longer than the fault traces that have been previously depicted.
Small depressions, with widths of a few hundred meters, scatter to the southwest of the small scarps and are parallel to the scarps. The northeastern side of the small scarps are characterized by small narrow ridges. These topographical features are similar to those of both, the Tsujimiya fault at the Yoron island and the strike-slip fault, indicating that the Tsujimiya fault continued to the Yoron basin as the NNW-trending left-lateral strike-slip fault.
4.3. Ground Deformation along the Island Arc
4.3.1. Marine Terrace Classification
We identified the uplifted coral reef marine terraces via topographical anaglyph interpretation (
Figure 3). We divided the northeastern region of the island, which was bounded by the Tsujimiya and Asato faults, into four terraces: the M1, M2, M3, and M4 surfaces in descending order. This classification is concordant with the lower four surfaces described in [
23]. Although the M2 surface, the most prominent crest, was correlated to the marine terrace developed during MIS 5e and MIS 5c by [
13,
25], respectively, no geochronological data were observed to exist for these surfaces. The most reliable paleo-shoreline indicator among the marine terraces is the crest top on the uplifted coral reef. Thus, we mapped the crests of the M1, M2, M3, and M4 surfaces using the topographical anaglyph (
Figure 3). We also mapped several ridges characterized by crest topography, outside the northeastern region of the island. The M4 surface crests near the coastline were mapped in a limited area due to the difficulties associated with identifying crests on the DSM data, which included the forest data near the coastline to capture the wind-blown sand from the beach.
4.3.2. Marine terrace crest deformation.
The crest of the M1 surface is left-laterally offset by approximately 150 m, along the most eastern strand of the Tsujimiya fault. This is due to the ridge direction, which is oblique to the fault. The three narrow ridges between the fault scarps are almost identical to the M1 surface, indicating that there is a correlation to the M1 surface. However, we did not estimate the lateral offset along the M2 surface, due to the presence of two parallel ridges on the west side of the fault.
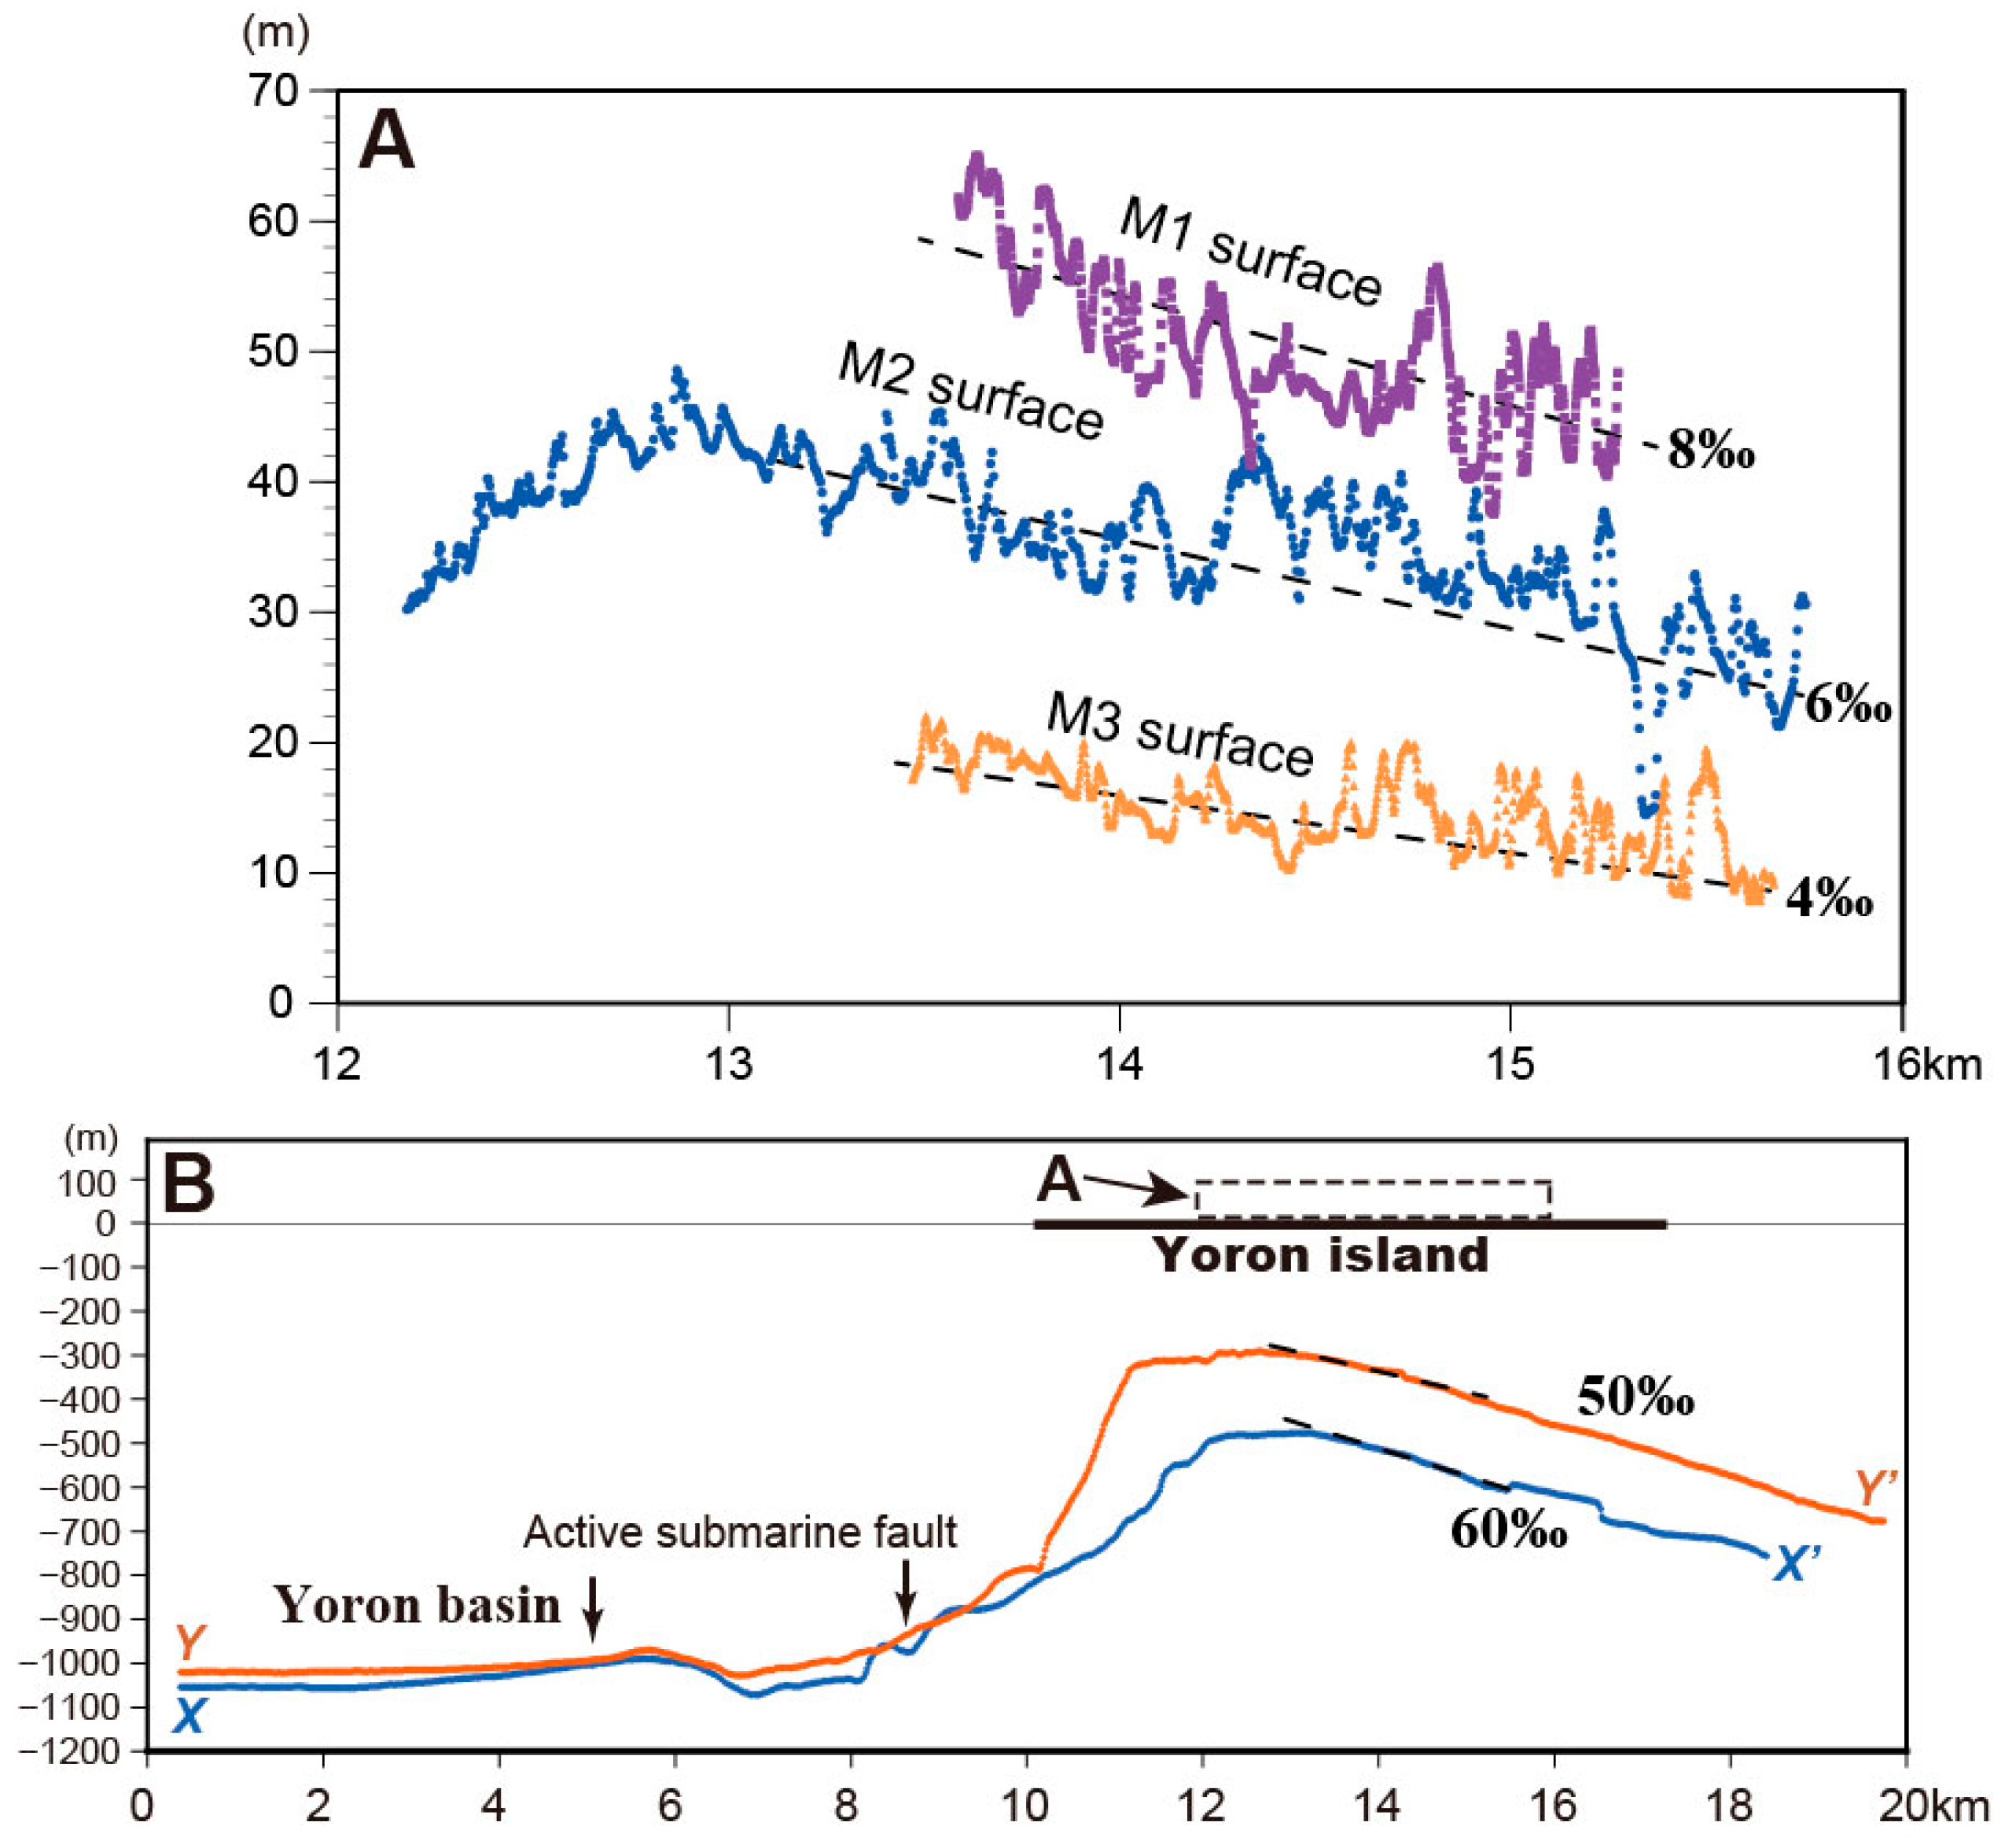
We measured the crest height using the DSM and aligned this data onto the NW trending axis, which is perpendicular to the general direction of the island shelf (
Figure 5A). From this figure, we detected the anticlinal deformation along the crest of the M2 surface, which was the longest and most distinguished ridge, whereas [
23] reported only southward tilting. It is possible that we have only observed anticlinal deformation along the southern flank of M1 and M3. The ratio of southward tilting along the M1, M2, and M3 crests are approximately 8‰, 6‰, and 4‰, respectively.
4.3.3. Seafloor Topographical Features around the Yoron Island
More than 500-m high steep slopes border the Yoron basin toward the east under which we have identified the submarine faults that are bordered by accumulated basin sediments and seismic basement [
14]. In this area, the upslope surfaces of the island shelf exhibit a convex shape and are unsymmetrically inclined to the northwest and the southeast sides. The summits of these surfaces are parallel to the steep slope and are located within 5 km from the southeastern edge of the basin (
Figure 4). A gentle convex slope to the southeast extends farther than that to the northwest. We observed this slope on topographical profiles across the basin and the island shelf (
Figure 5B). This surface’s southeastward tilting ratio is approximately 50–60‰, which is much larger as compared with that of the inland marine terraces.
5. Discussion
The two seafloor surfaces are located at approximate depths of 400 and 500 m to the north of the Yoron island (
Figure 4 and
Figure 5), are due to the deformation of the flat slope and the difference of erosion. In this study, we consider deformation to be the cause, because the shape of the longitudinal profile is similar to that of the crests of the marine terrace (
Figure 5A). The geological results observed toward the south of the Yoron island may be correlated with those of the north of the island as follows. Around the Hedo bank, to the south of the Yoron island, island shelf surfaces were formed to flatten the Hedo-oki group sediment of the Pleistocene and the Kunigami-oki group sediment of the Eocene based on the geological section via erosion [
14]. These are the possible results of seafloor surface deformation after at least the Pleistocene, which may have been formed from the anticlinal deformation.
We identified anticlinal deformation on the Pleistocene marine terrace at Yoron island, and presented the possibility of the anticlinal deformation of the seafloor to the north of the island, using topographical anaglyphs obtained from the inland DSMs and seafloor DEMs. The deformation axis extends in a line and is parallel to both the island shelf’s general trend, and the eastern edge of the Yoron basin. This axis is located within 5 km of the basin edge and is approximately 100 km away from the Nanseishoto trench. Results indicated that this deformation continued at least throughout the Pleistocene, and that this was closely related to the active submarine faults along the eastern edge of the Yoron basin. These active submarine faults are possibly reverse faults, due to the common topographic feature associated with the inland reverse faults and the absence of the antithetic faults in the Yoron basin. We have to further examine the geological structure of this area in the future.
For the marine terraces at both the Yoron island and basin, we identified several geomorphic features associated with active strike-slip faults, which were oblique to the island shelf using the topographical anaglyph. We observed small scarps on the island shelf perpendicular to the island shelf’s direction, which were associated with the normal faults reported by the results of a seismic survey (e.g., [
14]). This active fault and active anticlinal deformation distribution pattern along the outer arc ridges are similar to the areas near Aceh, Sumatra, where both oblique strike-slip faults and perpendicular normal faults cut the isolated narrow ridges along the trench [
26]. The distribution and style of these active faults and deformations can be possibly explained, if the horizontal compressive stress axis is perpendicular to the island shelf.
6. Conclusions
In this study, to reinvestigate the tectonic geomorphology in and around the Yoron island of Ryukyu arc, we produced the extensive topographical anaglyphs that cover the inland and seafloor. Several small active faults have cut and deformed the marine terraces on this island. However, the extension and style of faulting are not well documented because the areas of the island and terraces have limited exposure, and there is a lack of detailed topographic data. To reveal the topography of inland, vintage aerial photographs are used to produce the 3-m mesh inland DSM; furthermore, for the topography of the seafloor, the 0.6-s to 2-s-mesh DEM is processed using previous surveys.
We examined the tectonic geomorphological features using extensive area maps of topographical anaglyph, and presented novel tectonic maps of the late Quaternary. The results revealed that the 4-km-long Tsujimiya fault scarps across Yoron island, are composed of only the south part of 18-km-long strike-slip faults. We also identified anticlinal deformation on the Pleistocene marine terrace at the Yoron island and the seafloor to the north of the island, suggesting that this deformation continued at least throughout the Pleistocene.
This study represents a possibly effective methodology to understand the island arc tectonics, particularly in the areas which are characterized by small isolated islands. To be useful for future studies, this method requires detailed data from the coastal area for storage and distribution.


