Article

Synchrotron-Based Micro-CT Investigation of Oxic Corrosion of Copper-Coated Carbon Steel for Potential Use in a Deep Geological Repository for Used Nuclear Fuel

by
Thalia E. Standish
1,
Dmitrij Zagidulin
1,
Sridhar Ramamurthy
2,
Peter G. Keech
3,
David W. Shoesmith
1,2 and
James J. Noël
1,2,*
1
Department of Chemistry, the University of Western Ontario, London, ON N6A 5B7, Canada
2
Surface Science Western, the University of Western Ontario, London, ON N6G 0J3, Canada
3
Nuclear Waste Management Organization, Toronto, ON M4T 2S3, Canada
*
Author to whom correspondence should be addressed.
Geosciences 2018, 8(10), 360; https://doi.org/10.3390/geosciences8100360
Submission received: 14 August 2018 / Revised: 17 September 2018 / Accepted: 20 September 2018 / Published: 26 September 2018

Abstract

:
Within the multi-barrier system proposed for the permanent disposal of used nuclear fuel, the primary engineered barrier is the sealed metallic container. The present Canadian container design utilizes a carbon steel vessel coated with Cu for corrosion protection. In the event of a defect in the Cu coating that exposes the steel substrate, galvanically accelerated corrosion of steel is, in principle, possible. In this work, the progression of corrosion at a simulated through-coating defect in 3.0 mol/L NaCl solution containing dissolved O2 was monitored using electrochemical measurements and imaged non-destructively using synchrotron X-ray micro computed tomography (micro-CT). The damage volume at the base of the simulated defect was measured from the 3D micro-CT data and used to calculate the amount of O2 used to drive steel corrosion. The results demonstrate that the availability of O2 determines the rate and overall extent of corrosion, while the coatings produced using different deposition and treatment methods (cold spray deposition, heat-treated cold spray deposition, electrodeposition) lead to different corrosion propagation geometries, with the distribution of damage depending on the quality of the Cu/steel interface.

1. Introduction

The proposed long-term management method for used nuclear fuel in Canada is disposal in a deep geological repository (DGR), which has multiple barriers in place to ensure safe isolation and containment. Within this proposed multi-barrier system, the key engineered barrier is the robust used fuel container, which consists of a carbon steel inner vessel coated with ~3 mm of Cu, applied via cold spray deposition and electrodeposition. The DGR concept and container have been described in detail previously [1,2,3,4,5,6]. Upon closure, the conditions in a DGR will evolve over time, beginning as warm, dry and oxic, and then evolving to cool, wet and anoxic. The transitions among these conditions could take anywhere from a few months to many hundreds or thousands of years, and during these phases there are a number of corrosion processes that could occur. These processes, which have been described in more detail elsewhere [1], include corrosion by residual groundwater oxidants, radiolytic corrosion, corrosion by remotely produced sulphide, and galvanic corrosion of carbon steel coupled to Cu. This last process could occur if a container was placed in a DGR with a though-coating defect. This condition is not likely, as current manufacturing and inspection methodologies demonstrate robust coatings that do not have through-wall defects, even within the developmental coupons provided to this program. However, this scenario could potentially result in significant corrosion damage, as it would bypass the Cu coating corrosion barrier.
It is expected that exposure of the steel substrate to groundwater in a DGR during the initial oxic period would lead to O2 reduction on Cu driving steel dissolution at the base of the defect, Figure 1. This galvanic couple is only expected to have a significant role in accelerating the corrosion of the steel as long as there is dissolved O2 present in the vicinity of the defect. The specific distance over which O2 reduction on the Cu surface can couple to steel dissolution will depend on the ionic conductivity of the electrolyte and will also be restricted by the substantially lower ionic conductivity of the very low porosity, highly compacted bentonite clay that will be in contact with the container surface in a DGR, as ions will have to travel a more tortuous path between the anode and the remote cathode. Once the O2 is consumed, general anoxic corrosion of the exposed steel could still occur, but coupling of steel corrosion to water reduction on Cu, although thermodynamically possible, would occur at a such a low rate, due to unfavourable reaction kinetics of H2O reduction on the Cu surface in DGR conditions [7] (manifest in the form of a very large overpotential), that it is effectively negligible. The most problematic location for a defect is near the region where the steel container is welded closed, illustrated in Figure 1, since the weld depth will only be about 8 mm, whereas the body and head of the container will be 47 mm and 30 mm-thick, respectively [1].
While other researchers have investigated galvanic coupling between Cu and carbon steel [8], this couple has not been studied in the configuration of Cu-coated steel with a through-coating defect. We are researching this scenario by drilling a hole through the Cu coating to reveal the steel substrate, thereby simulating a defective coating. These samples were exposed to 3.0 mol/L NaCl solution with different dissolved [O2] and were monitored electrochemically to determine how the surface redox conditions change over time. Notably, synchrotron X-ray micro computed tomography (micro-CT) was used to observe, directly and non-destructively, the evolution of corrosion damage to steel at the base of the defect and how it changes with the Cu coating method and [O2]. The volume of steel corroded was measured from the 3D micro-CT data and was used to calculate the amount of O2 consumed by coupling to the anodic dissolution of steel. These values and observations contribute to the ultimate goal of developing a finite element model to predict the extent of corrosion at a through-coating defect under DGR conditions.

2. Materials and Methods

2.1. Cu-Coated Carbon Steel Specimens

The samples for the synchrotron micro-CT experiments were 2 mm-diameter cylinders of Cu-coated carbon steel with a ~0.5 mm-diameter hole drilled down through the 3 mm-thick coating to the Cu/steel interface to simulate a defect, Figure 2(a). These were cut from A516 grade 70 carbon steel plates that had been Cu-coated via cold spray deposition or electrodeposition; details of the coating processes have been given elsewhere [3,9]. Briefly, the cold spray coating process uses a high-speed gas jet stream (He, N2) to accelerate solid Cu powder particles towards the carbon steel substrate. Upon impact, the particles deform plastically and consolidate. The electrodeposition process involves immersing the carbon steel substrate in a Cu ion-containing bath and applying current though pulsed potentiometry to reduce the Cu ions onto the steel substrate.
A number of the cold spray Cu/steel specimens were heat-treated at 350 °C for 1 h under Ar gas. For all specimens, the top Cu surface was wet-ground by hand with SiC paper to a P320, P600, and finally P1200 grit finish, using a minimal amount of water and drying the sample frequently to ensure that the steel at the base of the drilled hole remained dry. To enable electrochemical measurements, a wire was soldered to the steel substrate and heat-shrink PTFE tubing was used to cover the wire. Samples were sonicated in methanol prior to being coated with Torr Seal epoxy (Kurt J. Lesker Canada, Inc., Concord, ON, Canada) on all sides except for the top Cu surface, Figure 2b; two coats were applied, each allowed to cure at 60 °C for two hours. Torr Seal epoxy was used because, unlike many other epoxies, it does not degrade when exposed to synchrotron X-rays, which are extremely intense. Before beginning an experiment, we wet-ground the top Cu surface to a P2400 grit finish using SiC paper, sonicated the sample in methanol, and dried it in a stream of Ar. The samples for the electrochemical measurements were made in the same manner, except that they were cut such that the top Cu surface was ~4 mm × 4 mm, and were painted with three coats of Amercoat epoxy resin instead of Torr Seal, each coat being allowed to cure at 60 °C for 24 h.

2.2. Electrochemical Setup

Experiments were performed in a three-electrode electrochemical cell, with Pt foil as the counter electrode, a saturated calomel electrode (SCE) as the reference electrode, and a Cu-coated carbon steel sample as the working electrode. While the exact groundwater conditions within the Canadian DGR are unknown, they are expected to be chloride-dominated, and may range from 50 g/L to over 300 g/L in chloride. Accordingly, for this experimental program the electrolyte was a pH-neutral, 3.0 mol/L NaCl solution prepared with reagent grade NaCl (Caledon Laboratories) and ultrapure water from a Thermo Scientific Barnstead Nanopure water purification system set to yield a resistivity of 18.2 MΩ·cm. The solution was sparged with either medical grade O2 or air (PRAXAIR) for a minimum of 30 min before starting an experiment and sparging continued throughout the experiment. For the experiments performed at the synchrotron, the sparging gases were ultra high purity O2 and air (Airgas). All experiments were performed at room temperature (21 ± 2 °C).
The galvanic corrosion potential (Eg) of the Cu-coated steel electrode was monitored throughout the experiments and its polarization resistance (Rp) was measured periodically using the linear polarization resistance (LPR) technique. Eg and Rp measurements were performed using a Solartron 1480 potentiostat and CorrWare software. LPR experiments were performed by scanning the potential ±5 mV from Eg at a rate of 10 mV/min.

2.3. Synchrotron X-ray Micro Computed Tomography (Micro-CT)

Synchrotron X-ray micro computed tomography (micro-CT), a non-destructive 3D imaging technique, was used to image the corroding Cu-coated steel samples periodically over a 42-h exposure period. The synchrotron micro-CT spatial resolution was 0.87 μm for the configuration used in these experiments, which allows for accurate damage volume measurements from the resulting data. In addition, the high intensity of the synchrotron’s X-rays allows imaging times to be very short (~5 min), which makes imaging samples as they corrode feasible. In this set of experiments, the samples were removed from solution at each imaging time-point; during imaging the solution evaporated from the defect, so after imaging, solution was gently injected into the defect using a syringe with a fine needle before placing the sample back into the electrochemical cell. Experiments were performed at the Advanced Photon Source (Argonne National Laboratory, Argonne, IL, USA) using beamline 2-BM-A.
The resulting data were reconstructed using TomoPy, an open-sourced, Python-based framework [10]. The reconstructed data were imported into software to visualize them as 2D image slices or as a 3D volume and to calculate the volume of steel corroded at the base of the defect.
X-rays produce water radiolysis products, which are a combination of oxidizing and reducing species that can affect the corrosion behaviour. To assess the impact of water radiolysis products, the spectrum of the 2-BM-A beamline was used to calculate the dose rate, and thereby the concentration of species produced by water radiolysis in the through-coating defect during the 5 min the sample is exposed to X-rays. The concentrations were below 10−6 mol/L, demonstrating that the influence of water radiolysis products on corrosion in these experiments is negligible.

2.4. Damage Volume Measurements

The volume of steel lost due to corrosion at the base of the through-Cu defect was measured from the micro-CT data by segmenting the volume at the base of the defect. Cu, steel, and low-density areas were differentiated by their grayscale values, with the lowest density areas being the darkest. To obtain the volume due to corrosion alone and to reduce the influence of sample-to-sample variation in the depth of the original drilled hole, the original volume of the defect was subtracted from each subsequent corroded volume in the series. To ensure consistency in the segmentation and measurement, each data set was aligned so that the Cu/steel interface was horizontal and not tilted, and the segmentation was performed from the same horizontal plane downwards in each data set from a given sample.

3. Results and Discussion

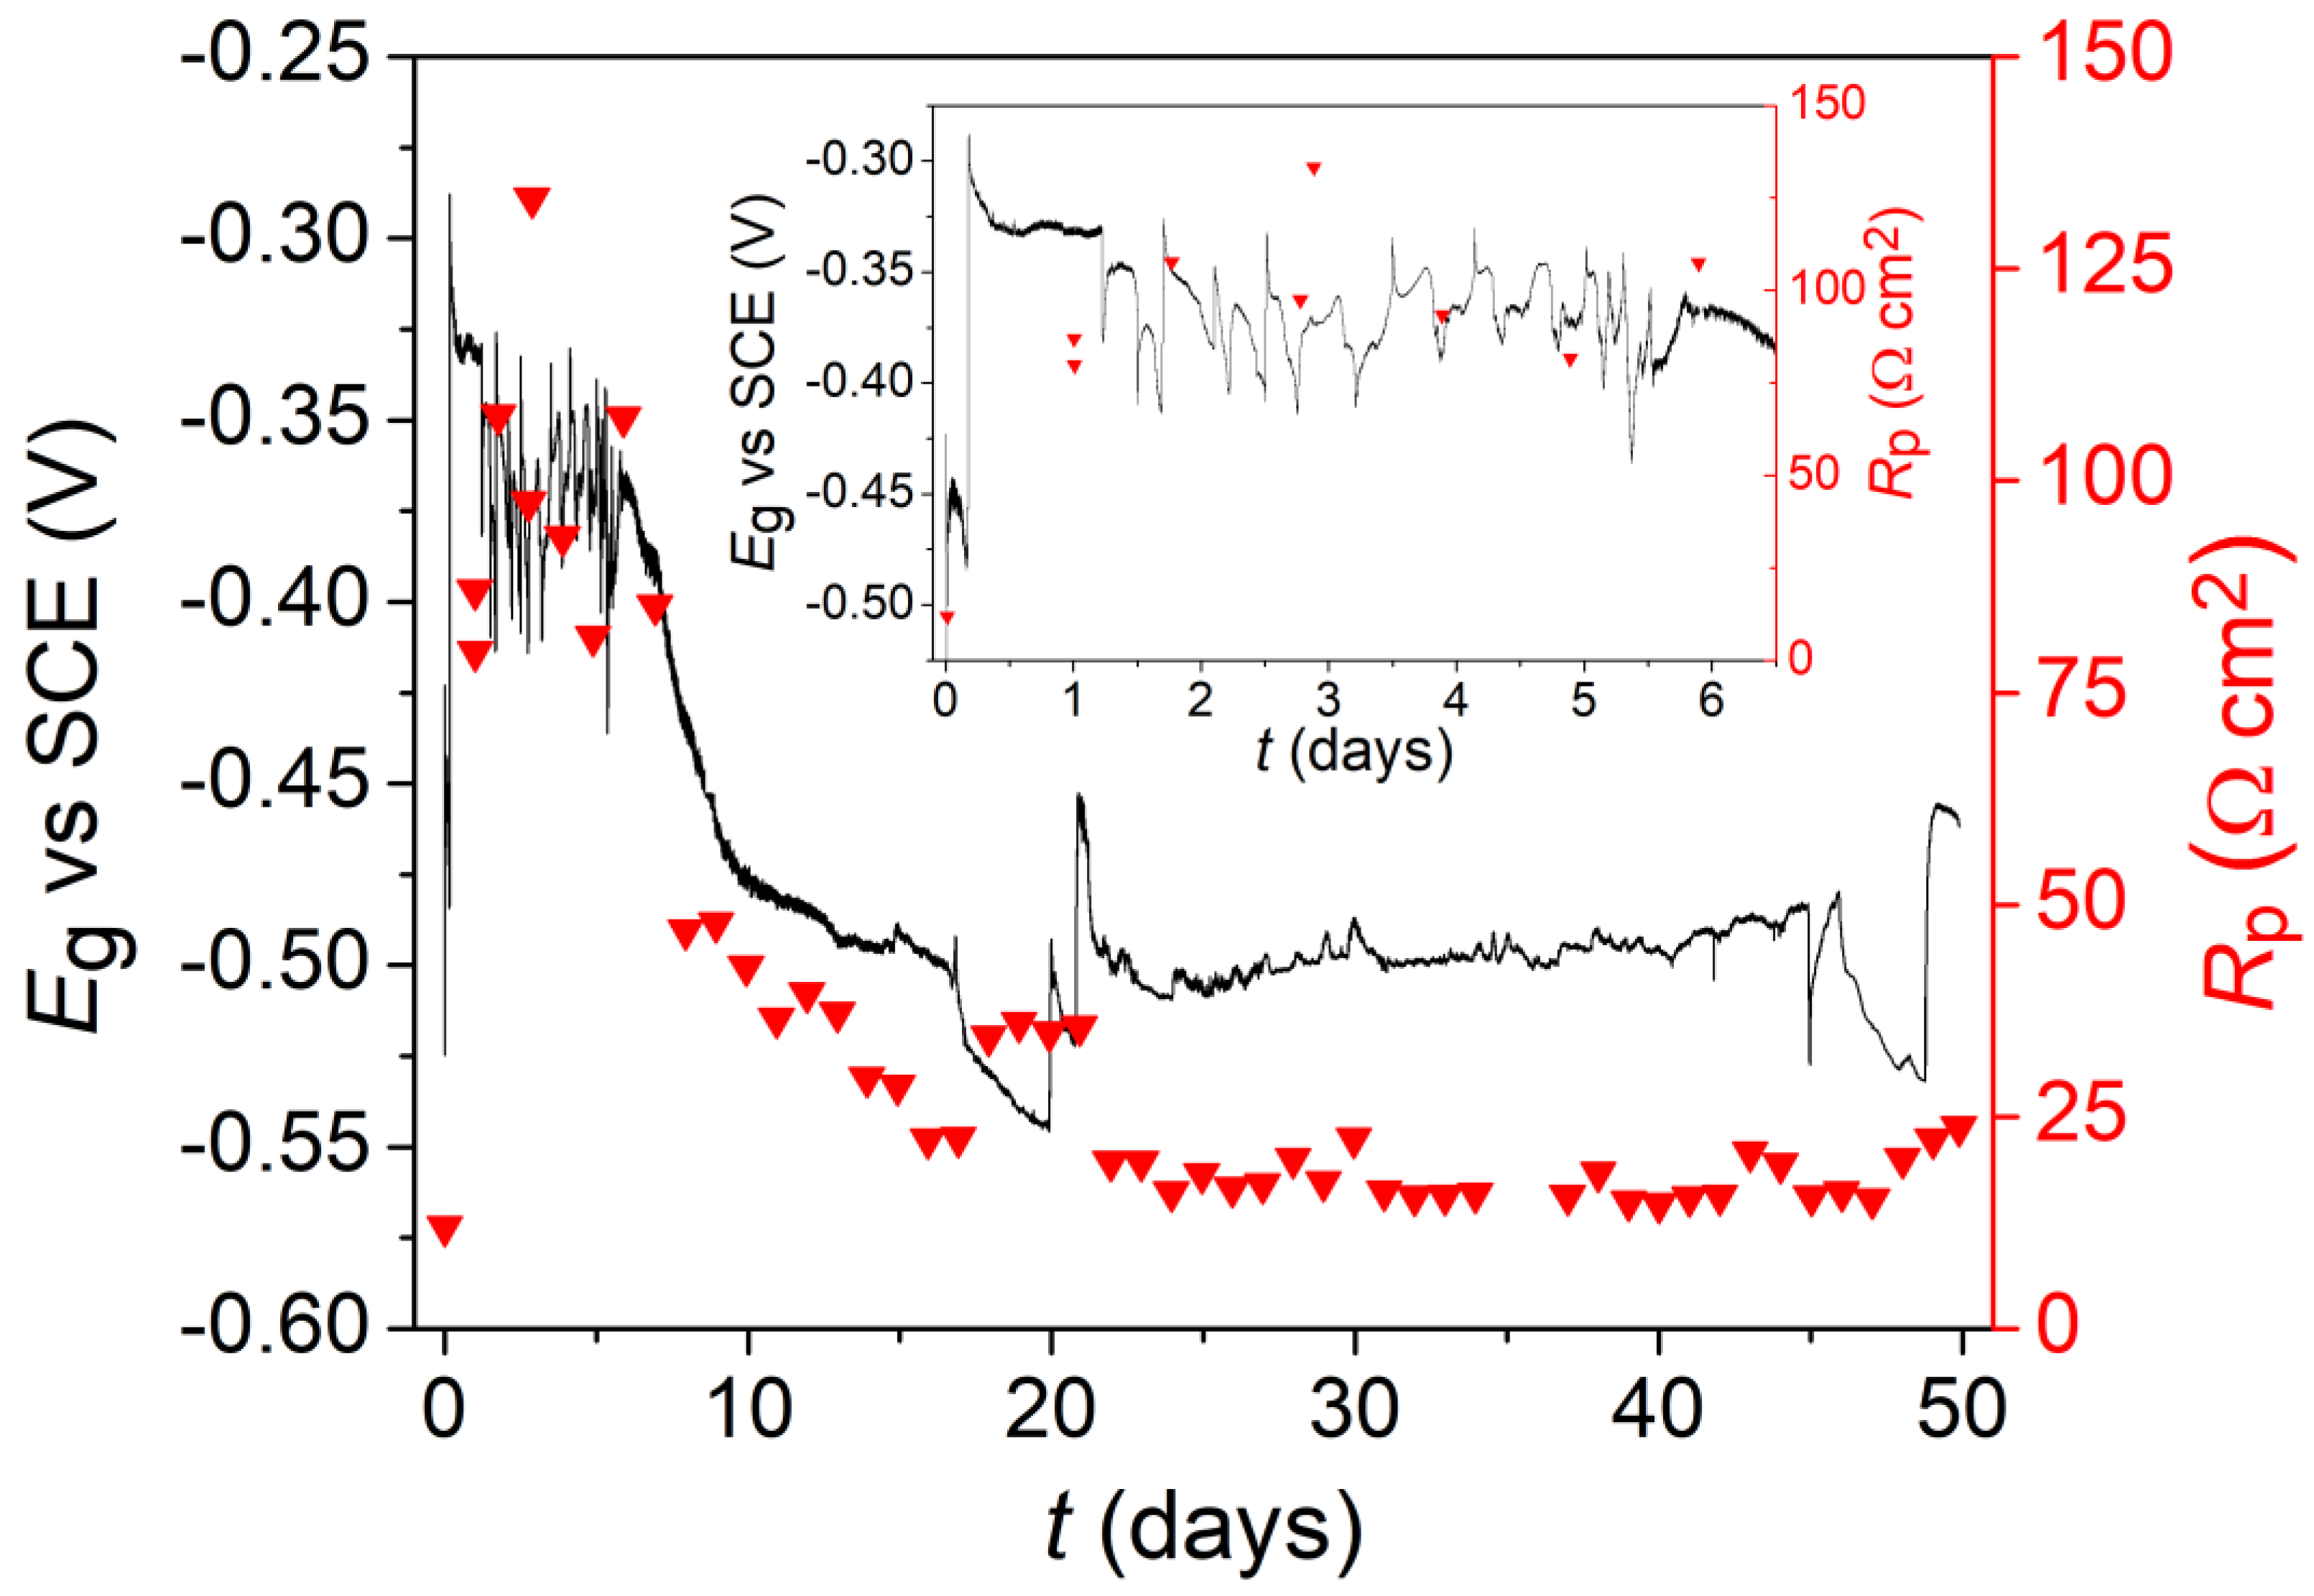
3.1. Electrochemistry

3.1.1. Oxygenated Conditions

The electrochemical data from a cold spray Cu-coated steel sample exposed to an O2-sparged 3.0 mol/L NaCl solution were described previously [1], however, the calculation of the steel surface area at the base of the through-coating defect has been improved, therefore the Rp values have been refined, Figure 3. A summary of the results will be given here. Eg is initially between −0.42 VSCE and −0.52 VSCE and Rp is low, indicating that the steel is freely corroding at this point. After ~4 h, Eg increases to −0.29 VSCE over a span of 20 min accompanied by an increase in Rp. This increase in Eg and Rp is likely due to a decrease in the rate of steel dissolution (i.e., the corrosion reaction is anodically controlled), (corrosion rate ∝ Rp−1). This behaviour is indicative of the formation of a protective oxide film or corrosion product deposit on the steel. Eg subsequently relaxes to −0.33 VSCE and remains steady for 20 h, after which it begins to oscillate while the Rp values become erratic. The drops in Eg and corresponding reductions in Rp are most likely due to intermittent breakdown events in the protective film, which expose the steel surface and increase the corrosion rate. The rises in Eg and Rp suggest that the protective film on steel re-grows at the breakdown site. Similar fluctuating behaviour has been observed previously on carbon steel [11]. Between days 6 and 15, Eg and Rp decreased continually; this can be interpreted as an irreversible loss of protectiveness of the corrosion product film (deposit) leading to an increase in steel dissolution. For the remainder of the exposure period after ~15 days, Eg is effectively stable, as are the Rp values, demonstrating that there is no significant change in the corrosion rate, nor in the oxide film on the steel surface. The temporary excursions in Eg and Rp at days 17 and 46 were the result of interruptions in O2-sparging and indicate that the rate of steel corrosion is controlled by the supply of O2 to the coupled Cu surface (cathodic control) during this stage.

3.1.2. Aerated Conditions

The electrochemical data for a cold spray Cu-coated steel sample exposed to an air-sparged 3.0 mol/L NaCl solution are shown in Figure 4. As in O2-sparged solution, Eg and Rp are initially low, indicating that the steel is undergoing active dissolution. Beginning at day 20, Eg and Rp rise significantly over 2.5 days, suggesting that the steel is attempting to passivate by forming a protective oxide film. However, any protection by this film is temporary, as demonstrated by Eg and Rp decreasing again over the next 6.5 days as reactivation of steel corrosion occurs. Reversals in Eg accompanied by temporary increases in Rp indicate attempts to prevent reactivation, with Eg eventually stabilizing at ~−0.59 VSCE and Rp reaching a constant value of ~40 Ω·cm2. The Eg values are lower and Rp values higher in aerated (as compared to oxygenated) conditions, indicating that the anode, steel, is less polarized by the cathode and the corrosion rate is lower. This is consistent with the interpretation that O2 reduction on Cu is the driving force for the anodic dissolution of steel and is the rate determining reaction, since a lower dissolved [O2] leads to lower Eg and corrosion rate values.
Although values of Eg, Rp, and the timing of events are different in aerated and oxygenated conditions, the overall corrosion behaviour is generally the same. In both conditions, Eg and Rp values respond simultaneously and demonstrate that although a partly protective corrosion product deposit initially forms on the steel, it does not provide effective, nor permanent protection. Breakdown of this protective layer eventually leads to the establishment of steady-state galvanic corrosion conditions.

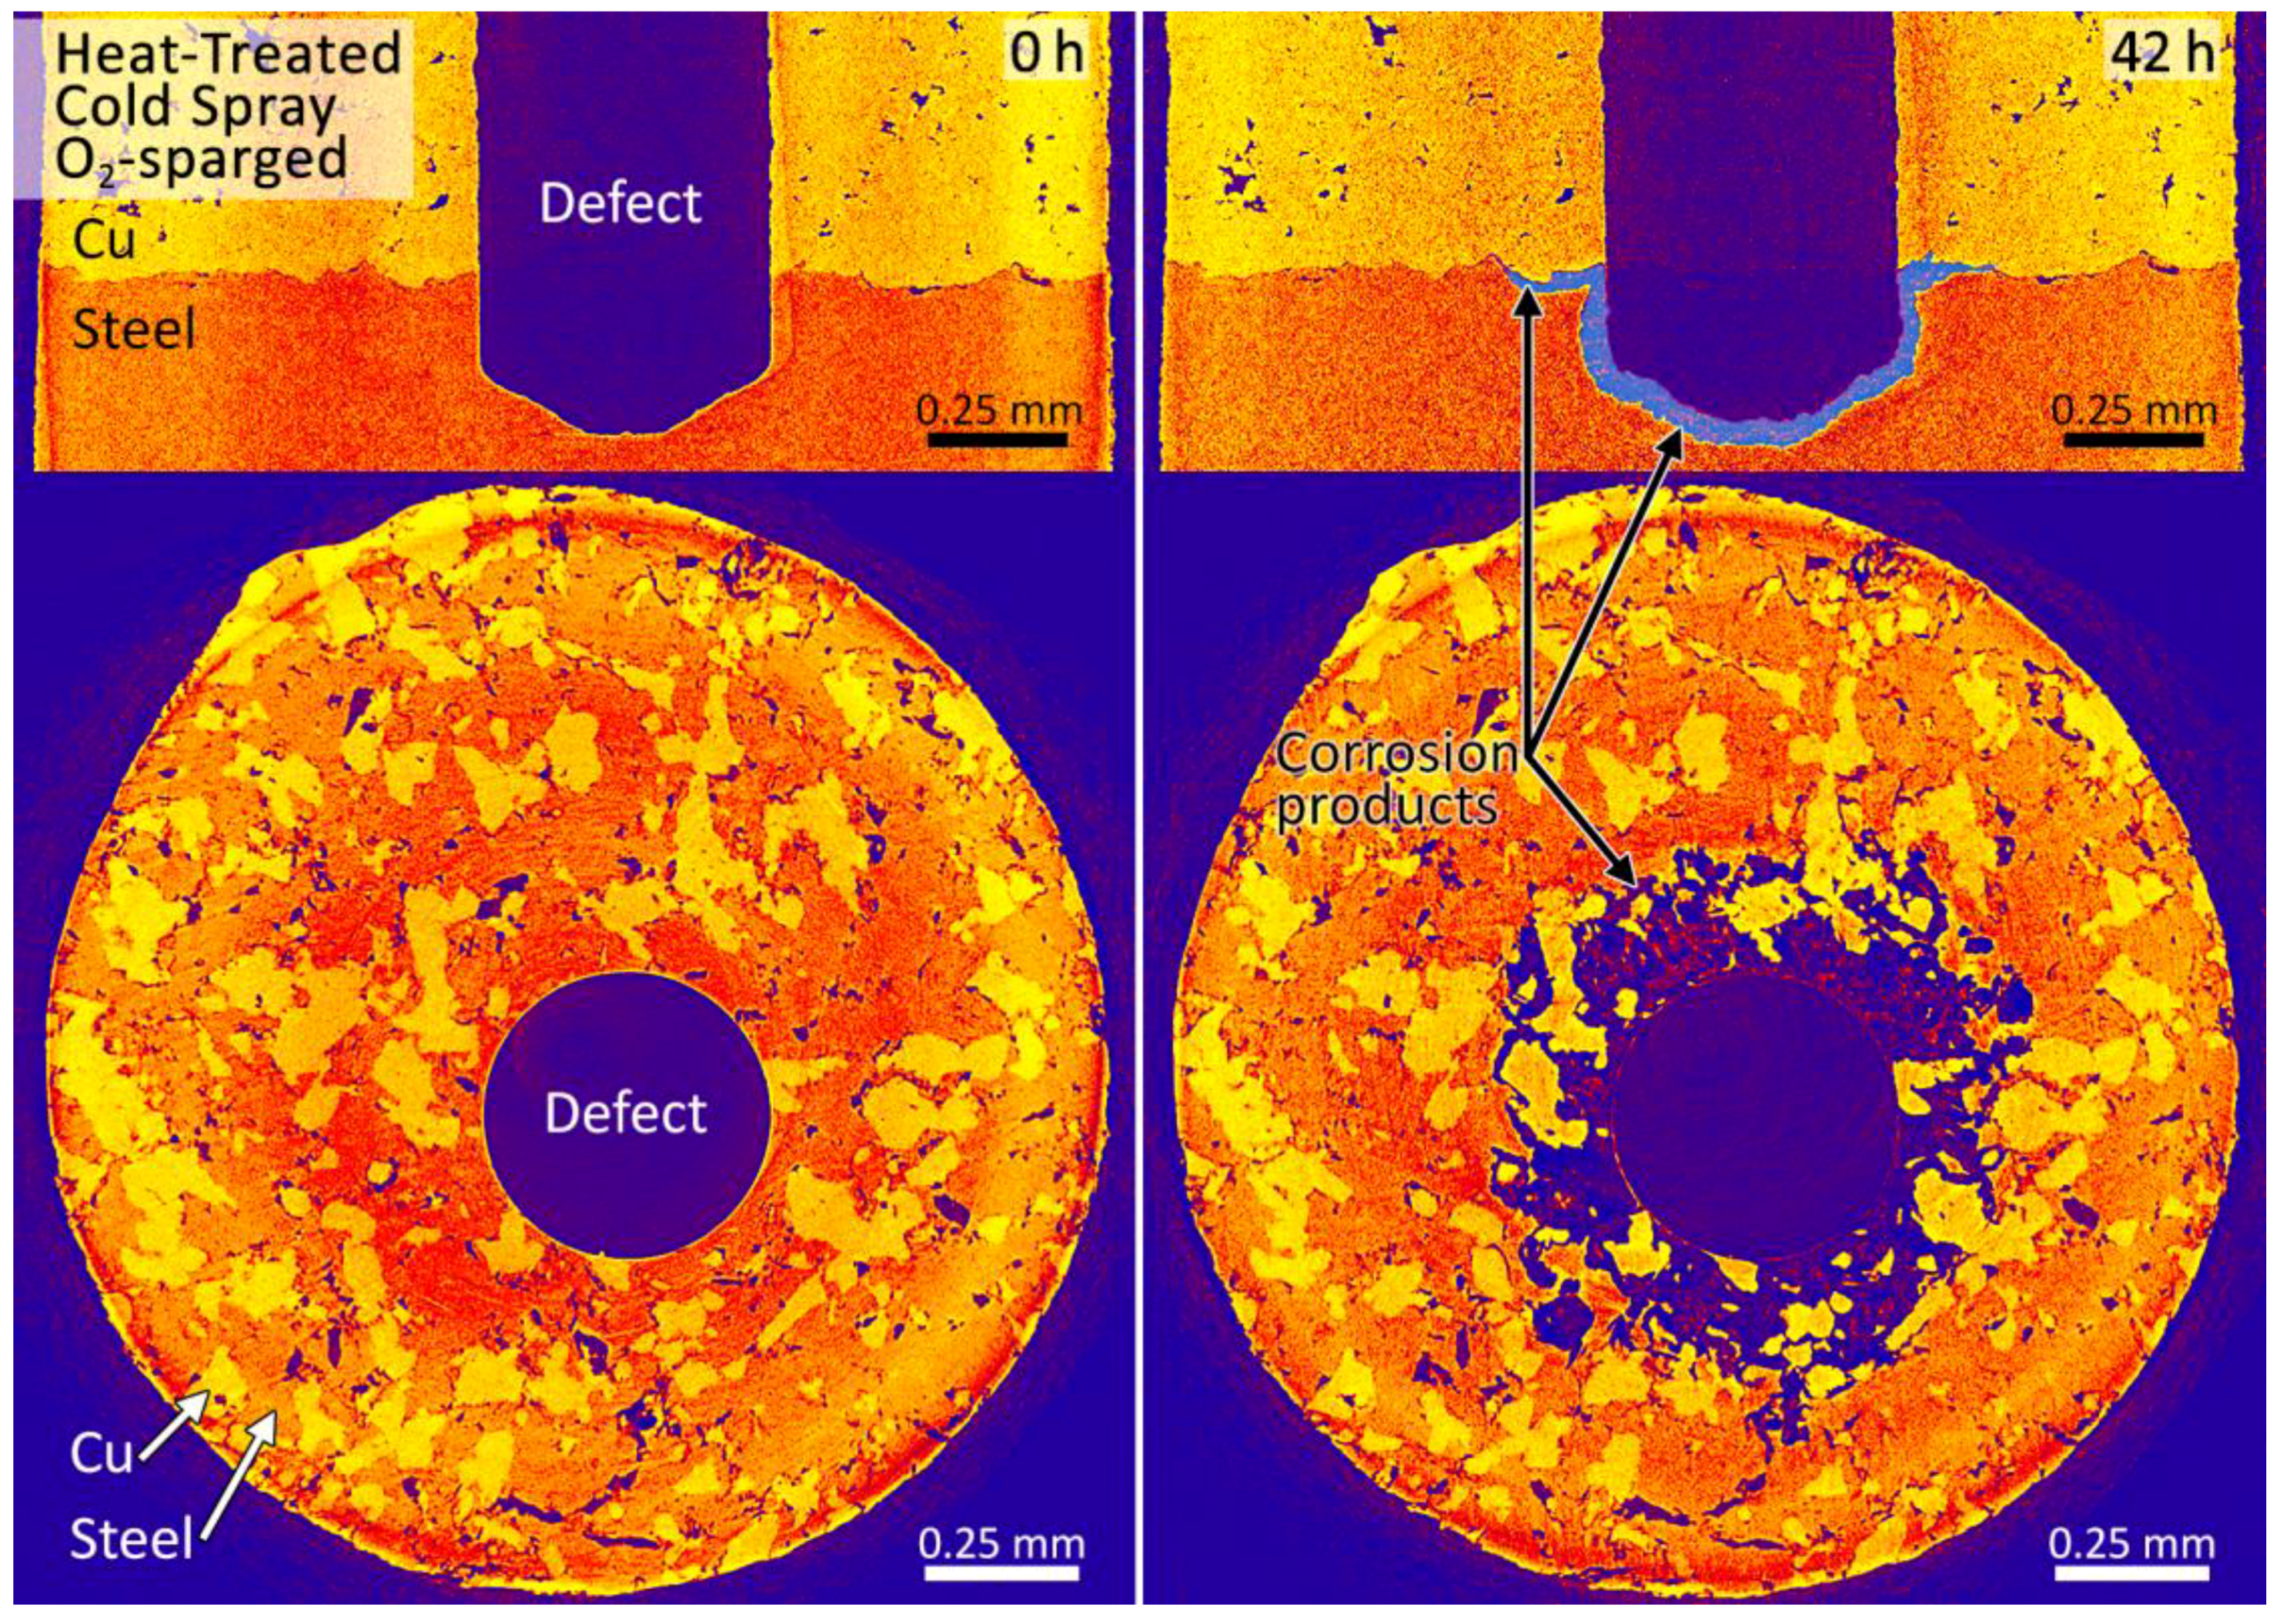
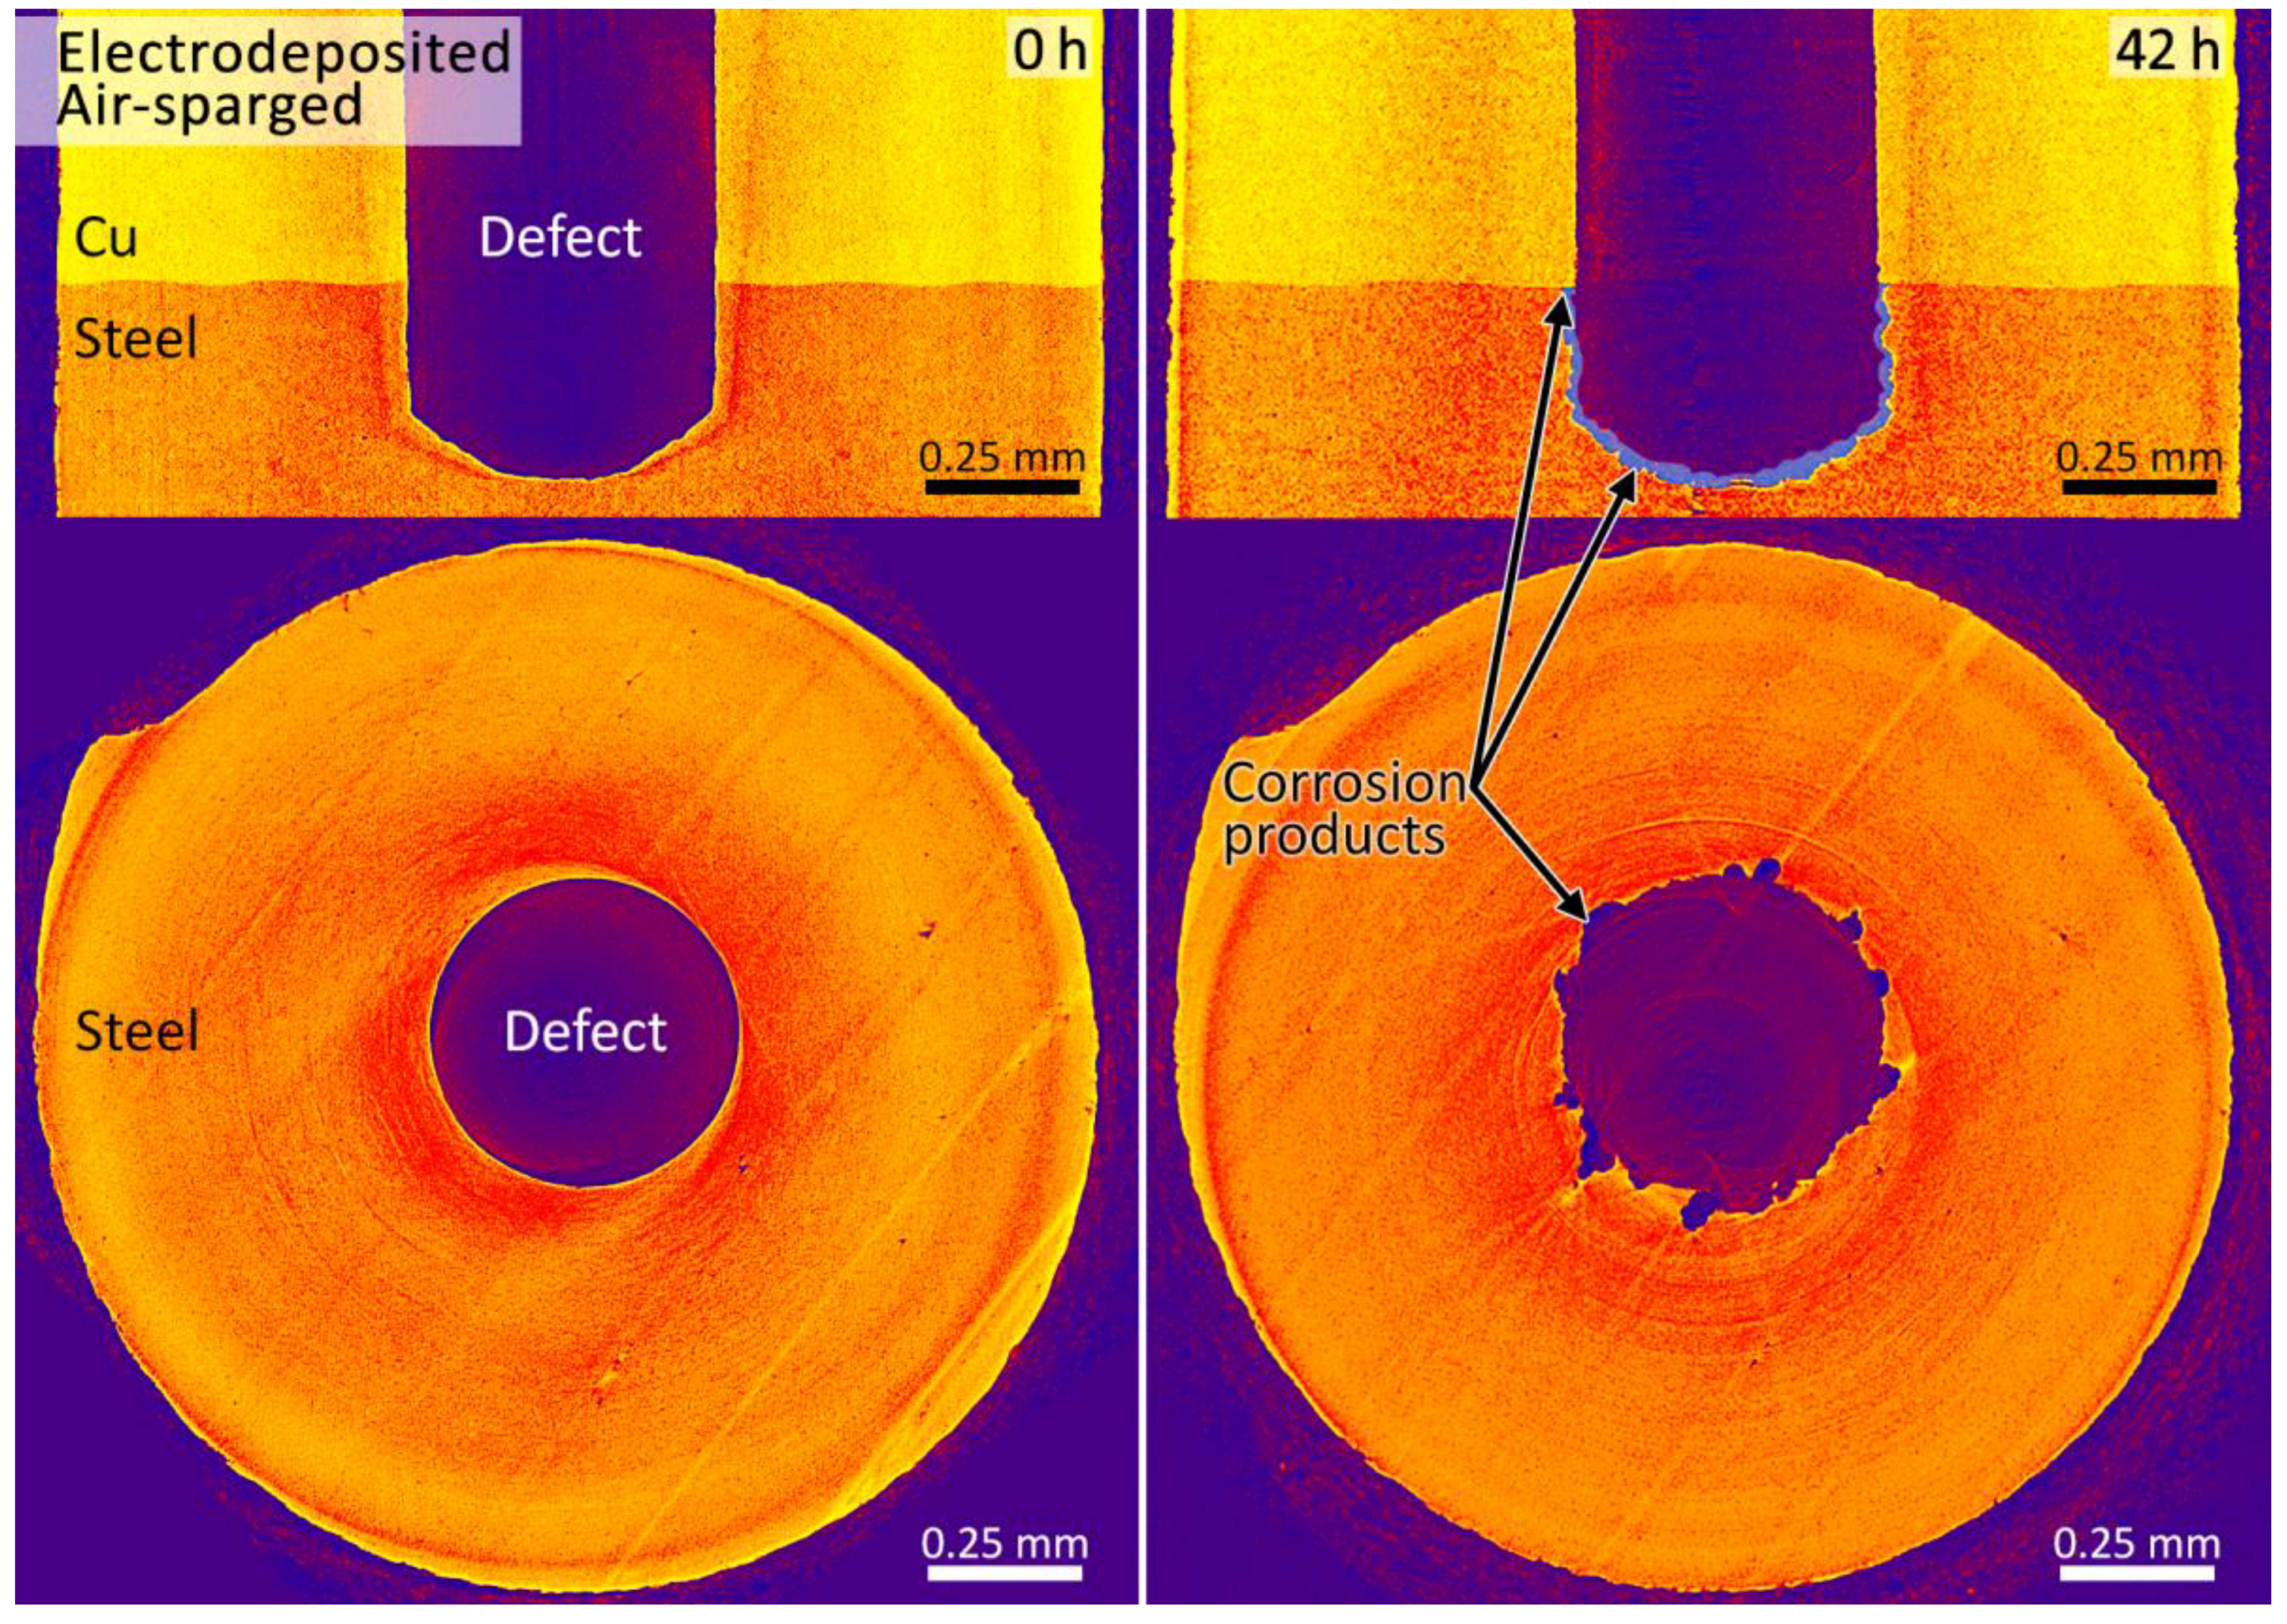
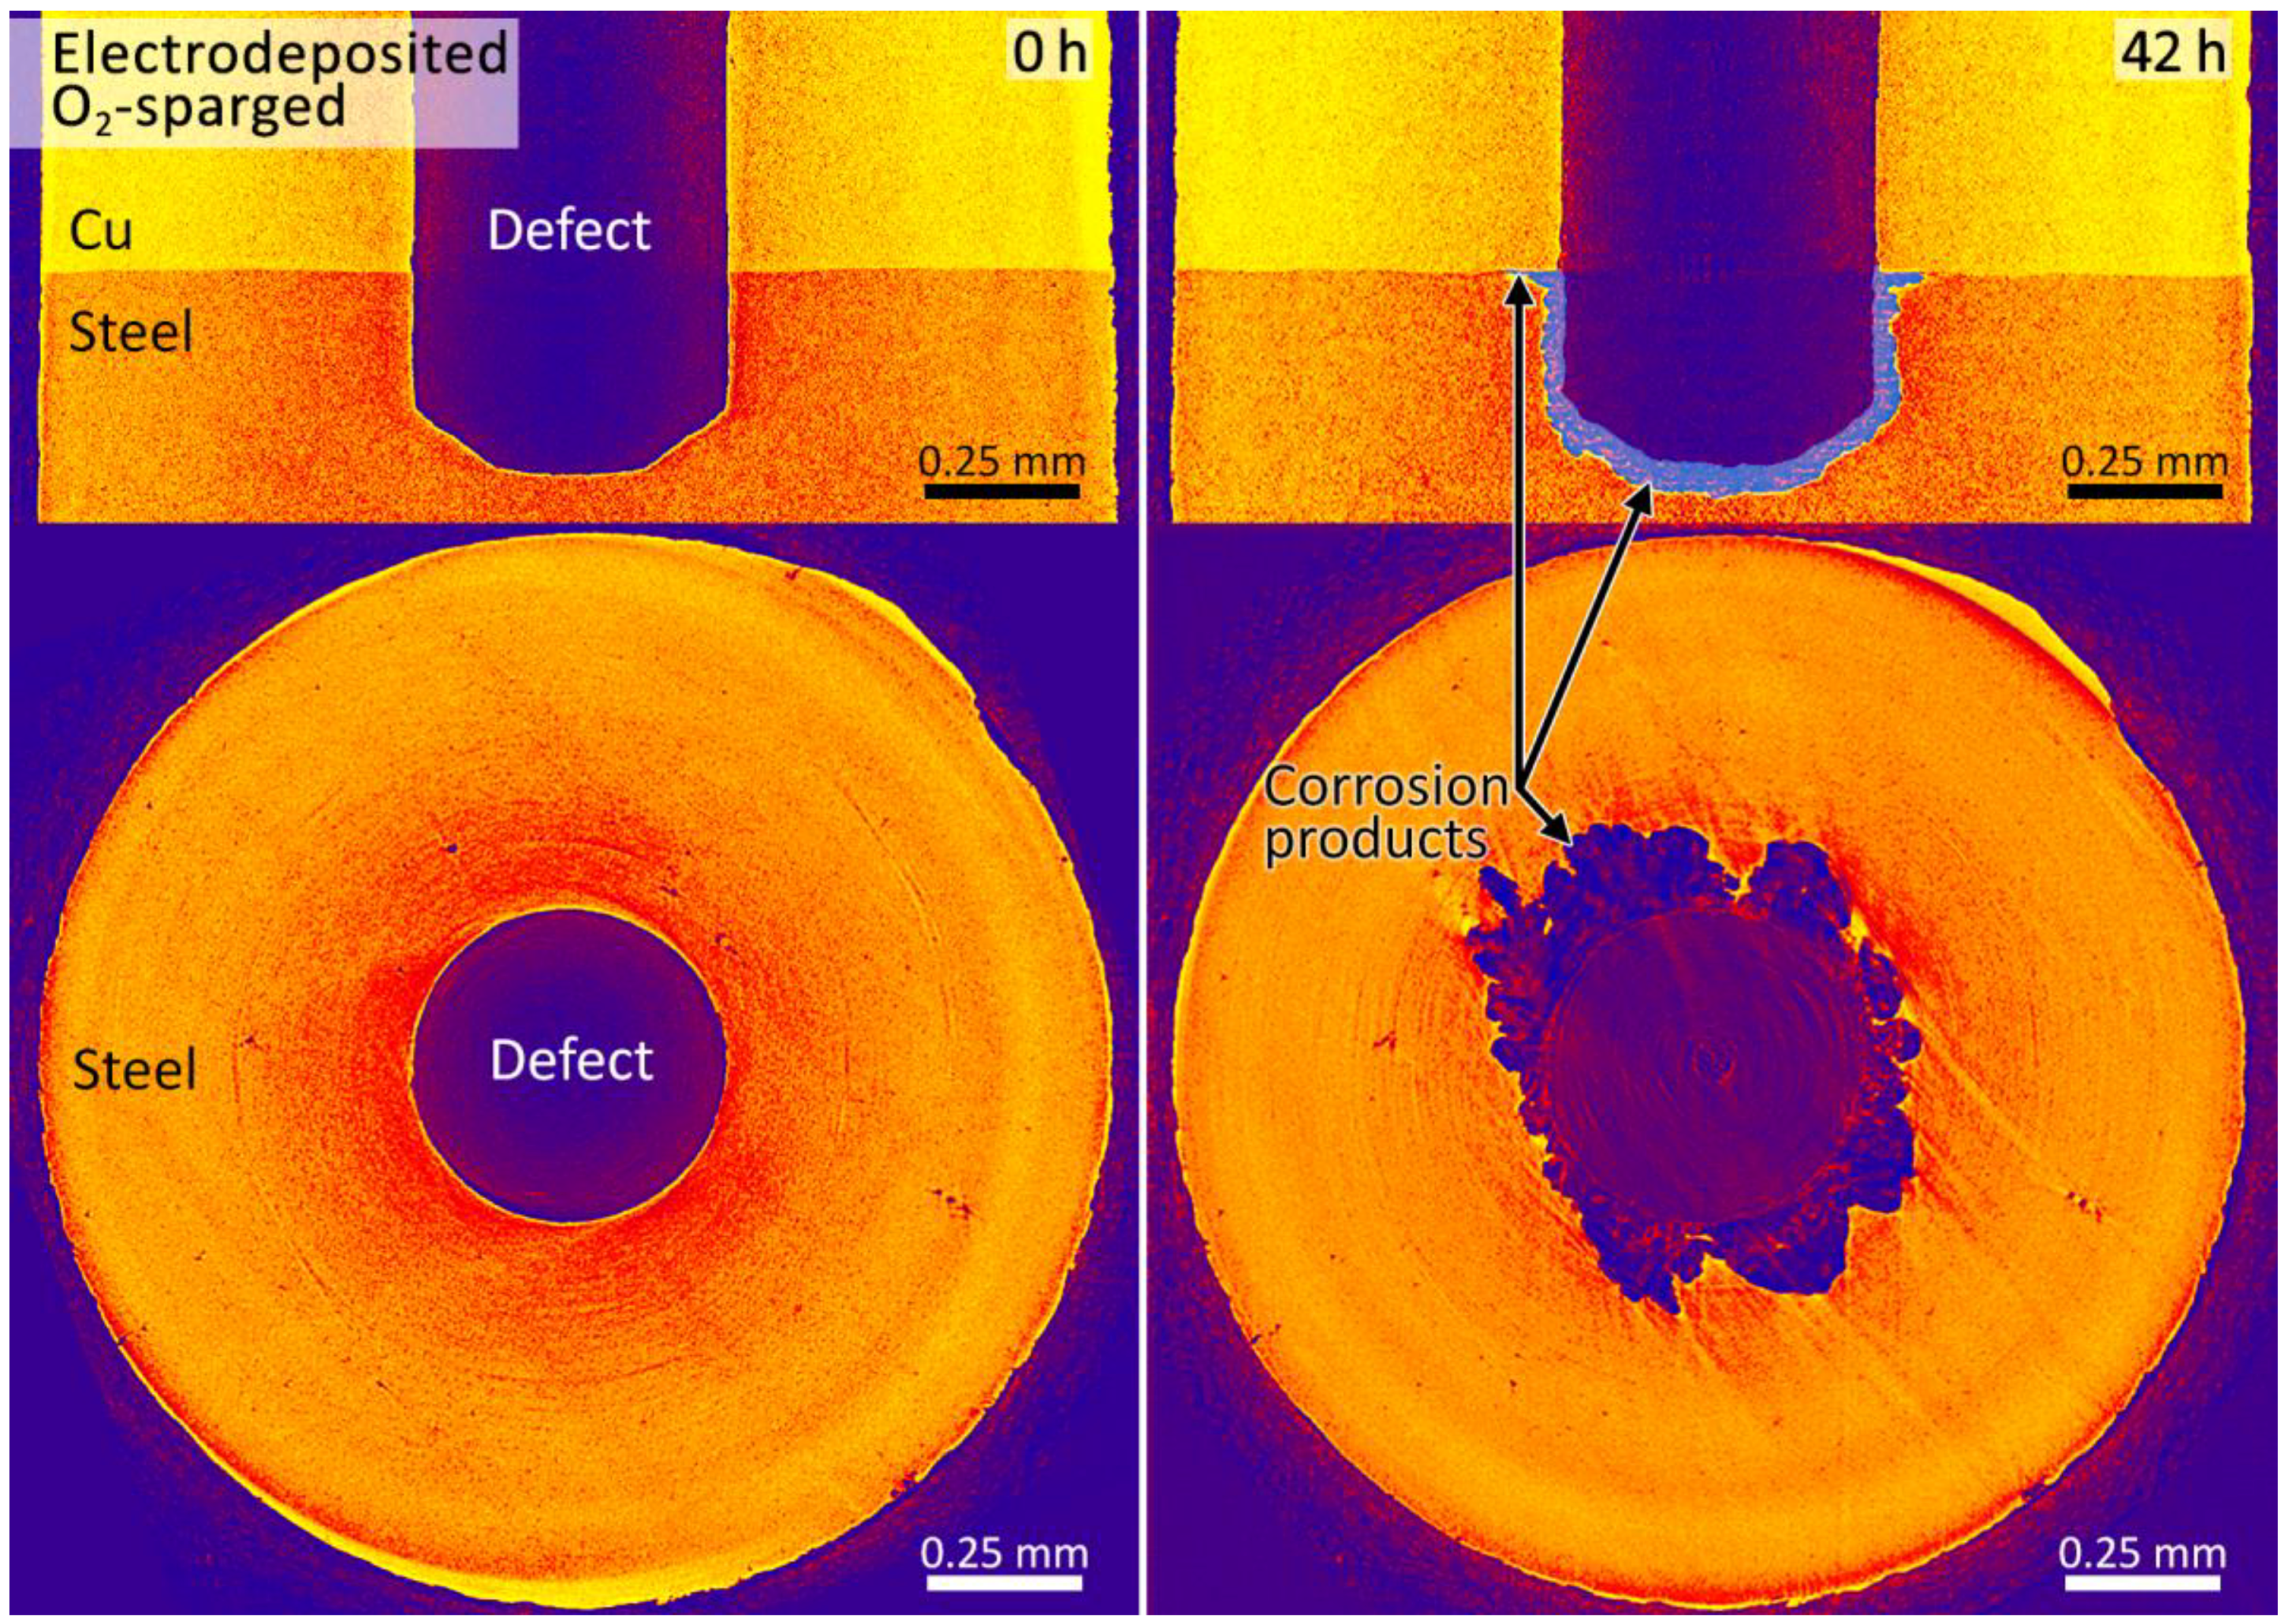
3.2. Synchrotron Micro-CT

The micro-CT image slices of cold spray, heat-treated cold spray, and electrodeposited Cu/steel samples exposed for 42 h to an O2-sparged 3.0 mol/L NaCl solution, Figure 5, Figure 6 and Figure 7, and to an air-sparged 3.0 mol/L NaCl solution, Figure 8, Figure 9 and Figure 10, show how the corrosion front propagated into the steel and along the Cu/steel interface and where corrosion products have been deposited. Selected micro-CT image slices for the samples exposed to O2-sparged solution have been shown previously in a summary article [2]. However, for this systematic study, the image slices included here (Figure 5, Figure 6 and Figure 7) were chosen so that the 0 h and 42 h images showed the same locations within each sample, and all of the micro-CT images have been colour treated to facilitate differentiation among Cu, steel, corrosion products, and voids. Areas of the image corresponding to Cu are the lightest (yellow) because the density and absorption coefficient of Cu are greater than those of carbon steel (which is primarily iron), meaning the X-ray intensity transmitted through Cu will be weaker. Areas corresponding to steel are orange-red, while the blue/purple areas are low-density regions. Within the low-density areas, there are several different features that can be differentiated from each other based on their texture (i.e., distribution of density), shape, and location. The iron corrosion products have non-uniform density and appear blue/purple with red speckles (the speckles are higher density locations within the corrosion product deposit). The corrosion products accumulated at the base of the defect are shown in lighter blue in the 42 h vertical image slices (the top right images in Figure 5, Figure 6, Figure 7, Figure 8, Figure 9 and Figure 10) to highlight their location. The horizontal image slices from the cold spray and heat-treated cold spray samples (the bottom images in Figure 5, Figure 6, Figure 8 and Figure 9) show areas of Cu and areas of steel because the impact of the Cu particles during the cold spray process deforms the steel, producing an uneven interface. The blue/purple patches within the bulk of the cold spray and heat-treated cold spray Cu coatings and the small blue/purple patches at the Cu/steel interface are voids; the larger spots of blue/purple at the Cu/steel interface are low density particles (most likely alumina) left behind by the grit blasting used to prepare the steel surface prior to applying the cold spray Cu coating. For such observations, it is important to note that the coupons analyzed within this study do not represent the final product form; the cold spray coating process has been improved, even since the production of these samples, to reduce the porosity in the Cu and to improve the adhesion between Cu and steel. The improved adhesion is expected to reduce the spread of corrosion along the Cu/steel interface. It is also important to note that in some of the vertical image slices the voids appear to change from 0 to 42 h, likely due to slight differences in the location of the image slice within the sample. This implies there is some error within our methodology of selecting the locations for the image slices, as no actual change in void size was observed during the experiments.
Nonetheless, comparing the images from 0 h and 42 h, the vertical image slices (the top images in Figure 5, Figure 6, Figure 7, Figure 8, Figure 9 and Figure 10) show a generally linear propagation of the corrosion front into the steel. While steel has corroded significantly, there has been no visible loss of Cu. A layer of corrosion products can be seen on the surface of the steel, appearing as a blue/purple region with a higher density of red speckles next to the steel. In addition, the blue space between the Cu and steel is an indicator of damage that has propagated along the interface. The horizontal image slices (the bottom images in Figure 5, Figure 6, Figure 7, Figure 8, Figure 9 and Figure 10), which are taken from the Cu/steel interface, show a radial spread of blue/purple from the defect in the centre, which indicates that corrosion has propagated outward from the defect along the Cu/steel interface. The extent of propagation along the interface is greatest for steel coated with cold spray Cu, less for heat-treated Cu/steel, and least for electrodeposited Cu/steel in all studied conditions. The greater extent of corrosion along the cold spray Cu/steel interface is likely due to its greater roughness and strain, and lower adhesion compared to the electrodeposited Cu/steel, as described previously in more detail [2].
Regarding the geometry of interfacial corrosion, the spread along the cold spray Cu/steel and heat-treated cold spray Cu/steel interfaces has a nearly uniform radius, while there is a favoured direction on the electrodeposited sample; the corrosion along the electrodeposited Cu/steel interface follows the direction of the machining grooves (which are seen as faint diagonal stripes traversing the horizontal image slices in Figure 7 and Figure 10) that were left on the steel prior to the application of the electrodeposited Cu coating. It is unclear at this point exactly what changes the machining process makes to the properties of the steel to induce this directionality in the interfacial corrosion. A possible cause could be the work hardening and plastic deformation near the surface of the steel that results from machining [12], since these microstructural changes have been shown to influence the corrosion behaviour [13,14,15].
Along with the geometry of corrosion, the volume of steel corroded is also of interest. Figure 11 shows the segmented damage volume from each time point for a cold spray sample exposed to an O2-sparged 3.0 mol/L NaCl solution. The 3D images illustrate how the corrosion damage evolved over time and give a more complete picture of how damage is distributed, compared to 2D image slices alone. From the measured damage volume, the amount of Fe oxidized to Fe2+, (nFe [mol]), was calculated using Equation (1):
n Fe = m M = ρ V M ,
where m is the mass of Fe corroded, ρ is the density of carbon steel, V is the volume of steel corroded, and M is the molar mass of Fe. The amount of Fe oxidized, nFe, was then used to calculate the moles of O2 (nO2) consumed, Equation (2):
n O 2 = n Fe 2 + 2 ,
assuming that all Fe oxidation was coupled to O2 reduction, as written in Equation (3):
2Fe + O2 + 4H+ → 2Fe2+ + 2H2O
Plotting the measured corrosion volumes and calculated nO2 over time, Figure 12, we see that there is a linear increase in damage over the 42-h exposure period, confirming a steady-state corrosion rate. The overall extent of corrosion and nO2 consumed is greater in O2-sparged solution than in air-sparged solution, which supports our contention that O2 reduction is driving the anodic dissolution of Fe and shows that greater [O2] does not lead to the formation of a more protective oxide on steel.

4. Discussion

Electrochemical experiments demonstrate that O2 reduction on Cu is the driving force for the galvanic corrosion of steel at a defect in the Cu coating. In the presence of O2, steady-state galvanic corrosion conditions are eventually reached after transitioning through the formation and subsequent breakdown of partially protective oxide films or corrosion product deposits. The corrosion rate is initially high, but the formation of a protective oxide film or corrosion product deposit on steel temporarily reduces the corrosion rate. The protective film or deposit eventually breaks down, increasing the corrosion rate, and over time steady-state galvanic corrosion conditions are established. Galvanic corrosion will be limited, however, by the finite amount of O2 trapped upon closure of the DGR, which has been calculated to be 13 mol/container (293 μmol/cm2) [16] for the current Canadian design. Of this O2, it is probable that only a small portion will be available for driving corrosion, since it will likely be consumed by other oxidation processes in a DGR and it must diffuse to a container surface close enough to a through-coating defect location to couple to steel oxidation.
The image slices and 3D volumes acquired using synchrotron micro-CT provide a detailed insight into the distribution of corrosion damage on the steel surface. The corroded volumes and nO2 consumed are very similar for all samples exposed to the same conditions, indicating that the corrosion mechanism is the same—dissolution of steel coupled to O2 reduction on Cu—regardless of the coating method. This also shows that the amount of O2 available to drive the anodic dissolution of steel is what determines the overall extent of corrosion. However, the geometry of corrosion damage varies between cold spray and electrodeposited Cu-coated steel specimens, which is likely a consequence of differences in the physical properties of the interfaces. Complete annealing of the cold spray samples, and the consequent relief of residual stresses in the material, may decrease the tendency of the material to corrode along the interface, given that less interfacial corrosion was observed on the cold spray Cu/steel sample that was heat-treated to 350 °C, compared to the un-heat-treated cold spray sample. Increasing the adhesion between Cu and steel is also expected to reduce the extent of interfacial corrosion.
The buildup of corrosion products at the base of the defect seen in micro-CT images and previous SEM images of a cross-sectioned sample [1] is in agreement with the electrochemical data showing an active-to-(partially)-passive transition, due to the formation of a protective oxide film or corrosion product deposit. Iron corrosion product deposits were also observed on the outer Cu surface of all of the samples; Raman spectroscopy was used previously to analyze the composition of these corrosion products and of the exposed Cu surface [1]. The corrosion product deposits were composed of FeIII oxides, primarily γ-FeOOH, and spectra from the exposed Cu surface showed that Cu2O was present. Based on the electrochemical measurements, we would expect the corrosion rate to decrease in O2-sparged conditions within the first half-day; although the corrosion volume measurements from micro-CT are quite linear, the first 2–3 data points after the start of the experiments do sit slightly above the line of best fit, indicating a faster corrosion rate during this period, which agrees with the electrochemical data.

5. Conclusions

Electrochemical measurements and synchrotron micro-CT were used to monitor the progression of corrosion at a simulated through-coating defect on Cu-coated carbon steel in O2-containing 3.0 mol/L NaCl solution. A greater availability of dissolved O2 in solution resulted in faster and more extensive corrosion of steel at the base of the through-coating defect. Corrosion damage volume measurements showed that the extent of corrosion did not depend on the Cu deposition and treatment method used, however the geometry of corrosion did depend on these factors. Corrosion propagated radially outward from the defect along the cold spray Cu/steel interface (although the extent was reduced on the heat-treated sample) and in the direction of machining along the electrodeposited Cu/steel interface. These observations, along with the greater extent of corrosion along the cold spray Cu/steel interface, indicate that the physical properties of the interface (strain and adhesion in particular) play an important role in determining the extent of interfacial corrosion.
The long-term aim of this work is to build a numeric database to express the reactions expected in a defect and use this to develop a finite element model to predict the damage to steel at a through-coating defect under DGR conditions. Ongoing work includes investigating the corrosion of Cu-coated carbon steel in the absence of O2 and quantifying the galvanic corrosion current between Cu and carbon steel as a function of oxidant concentration, solution conductivity, and anode-to-cathode area ratio to establish the kinetic details of the corrosion process. The impact of embedding the coating defect in highly compacted bentonite clay must also be determined.

Author Contributions

T.E.S., D.Z., S.R., J.J.N. and D.W.S. conceived and designed the experiments; T.E.S., D.Z., S.R. and P.G.K. performed the experiments; T.E.S. analyzed the data and D.W.S. assisted with interpreting the results; T.E.S. wrote the manuscript and T.E.S., P.G.K, J.J.N. and D.W.S. participated in revising the manuscript.

Acknowledgments

This research is funded by the Nuclear Waste Management Organization (NWMO), Toronto and used the resources available at the Advanced Photon Source (APS), a U.S. Department of Energy (DOE) Office of Science User Facility operated for the DOE Office of Science by Argonne National Laboratory under Contract No. DE-AC02-06CH11357. Assistance provided by personnel at Western University’s Physics and Engineering Machine Shops, Chemistry Department, and Surface Science Western is gratefully acknowledged.

Conflicts of Interest

The authors declare no conflict of interest. The funding sponsors had no role in the analyses and interpretation of data, nor in the decision to publish the results. Dr. Peter Keech from the NWMO assisted with the synchrotron micro-CT experiments and reviewed the manuscript; Dr. Mehran Behazin from the NWMO reviewed the manuscript.

References

  1. Standish, T.; Chen, J.; Jacklin, R.; Jakupi, P.; Ramamurthy, S.; Zagidulin, D.; Keech, P.; Shoesmith, D. Corrosion of copper-coated steel high level nuclear waste containers under permanent disposal conditions. Electrochim. Acta 2016, 211, 331–342. [Google Scholar] [CrossRef]
  2. Standish, T.E.; Zagidulin, D.; Ramamurthy, S.; Keech, P.G.; Noël, J.J.; Shoesmith, D.W. Galvanic corrosion of copper-coated carbon steel for used nuclear fuel containers. Corros. Eng. Sci. Technol. 2017, 52, 65–69. [Google Scholar] [CrossRef]
  3. Keech, P.G.; Vo, P.; Ramamurthy, S.; Chen, J.; Jacklin, R.; Shoesmith, D.W. Design and development of copper coatings for long term storage of used nuclear fuel. Corros. Eng. Sci. Technol. 2014, 49, 425–430. [Google Scholar] [CrossRef] [Green Version]
  4. Jakupi, P.; Keech, P.G.; Barker, I.; Ramamurthy, S.; Jacklin, R.L.; Shoesmith, D.W.; Moser, D.E. Characterization of commercially cold sprayed copper coatings and determination of the effects of impacting copper powder velocities. J. Nucl. Mater. 2015, 466, 1–11. [Google Scholar] [CrossRef]
  5. Boyle, C.H.; Meguid, S.A. Mechanical performance of integrally bonded copper coatings for the long term disposal of used nuclear fuel. Nucl. Eng. Des. 2015, 293, 403–412. [Google Scholar] [CrossRef]
  6. Hall, D.S.; Keech, P.G. An overview of the Canadian corrosion program for the long-term management of nuclear waste. Corros. Eng. Sci. Technol. 2017, 52, 2–5. [Google Scholar] [CrossRef]
  7. Harinipriya, S.; Sangaranarayanan, M.V. Hydrogen evolution reaction on electrodes: Influence of work function, dipolar adsorption, and desolvation energies. J. Phys. Chem. B 2002, 106, 8681–8688. [Google Scholar] [CrossRef]
  8. Stoulil, J.; Kouřil, M.; Pavlova, L.; Dobrev, D.; Gondolli, J. 1D simulation of canister galvanic corrosion in saturated compacted bentonite. Mater. Corros. 2018, 1–7. [Google Scholar] [CrossRef]
  9. Vo, P.; Poirier, D.; Legoux, J.-G.; Keech, P.G.; Irissou, E. Application of copper coatings onto used fuel canisters for the Canadian nuclear industry. In High Pressure Cold Spray: Principles and Applications; Karthikeyan, J., Kay, C., Eds.; ASM International: Materials Park, OH, USA, 2016; pp. 253–276. ISBN 978-1-62708-096-5. [Google Scholar]
  10. Gürsoy, D.; De Carlo, F.; Xiao, X.; Jacobsen, C. TomoPy: A framework for the analysis of synchrotron tomographic data. J. Synchrotron Radiat. 2014, 21, 1188–1193. [Google Scholar] [CrossRef] [PubMed]
  11. Sherar, B.W.A.; Keech, P.G.; Shoesmith, D.W. Carbon steel corrosion under anaerobic-aerobic cycling conditions in near-neutral pH saline solutions. Part 2: Corrosion mechanism. Corros. Sci. 2011, 53, 3643–3650. [Google Scholar] [CrossRef]
  12. Wang, F.; Zhao, J.; Li, A.; Zhang, H. Effects of cutting conditions on microhardness and microstructure in high-speed milling of H13 tool steel. Int. J. Adv. Manuf. Technol. 2014, 73, 137–146. [Google Scholar] [CrossRef]
  13. Prakash, M.; Shekhar, S.; Moon, A.P.; Mondal, K. Effect of machining configuration on the corrosion of mild steel. J. Mater. Process. Technol. 2015, 219, 70–83. [Google Scholar] [CrossRef]
  14. Ghosh, S.; Kain, V. Microstructural changes in AISI 304L stainless steel due to surface machining: Effect on its susceptibility to chloride stress corrosion cracking. J. Nucl. Mater. 2010, 403, 62–67. [Google Scholar] [CrossRef]
  15. Lyon, K.N.; Marrow, T.J.; Lyon, S.B. Influence of milling on the development of stress corrosion cracks in austenitic stainless steel. J. Mater. Process. Technol. 2015, 218, 32–37. [Google Scholar] [CrossRef]
  16. Hall, D.S.; Standish, T.E.; Behazin, M.; Keech, P.G. Corrosion of copper-coated used nuclear fuel containers due to oxygen trapped in a Canadian deep geological repository a Canadian deep geological repository. Corros. Eng. Sci. Technol. 2018, 53, 309–315. [Google Scholar] [CrossRef]
Figure 1. Possible galvanic corrosion process at a through-coating defect, illustrated here at the weld location, on a used nuclear fuel container in a DGR.
Geosciences 08 00360 g001
Figure 2. Cu-coated steel sample with a hole drilled through the Cu to the steel, (a) uncoated, (b) with a wire connector covered with heat-shrink PTFE tubing and coated with Torr Seal. Dimensions are in mm. Reproduced with permission from [2].
Geosciences 08 00360 g002
Figure 3. Eg (line) and Rp (triangles) data for a cold spray Cu-coated steel sample in O2-sparged 3.0 mol/L NaCl solution. The inset shows an expanded view of the Eg and Rp data from the beginning of the experiment to day 6.5.
Geosciences 08 00360 g003
Figure 4. Eg (line) and Rp (triangles) data for a cold spray Cu-coated steel sample in air-sparged 3.0 mol/L NaCl solution.
Geosciences 08 00360 g004
Figure 5. Synchrotron micro-CT vertical and horizontal image slices of the cold spray Cu/steel interface after exposure to O2-sparged 3 mol/L NaCl solution for 0 h (left column) and 42 h (right column).
Geosciences 08 00360 g005
Figure 6. Synchrotron micro-CT vertical and horizontal image slices of the heat-treated cold spray Cu/steel interface after exposure to O2-sparged 3 mol/L NaCl solution for 0 h (left column) and 42 h (right column).
Geosciences 08 00360 g006
Figure 7. Synchrotron micro-CT vertical and horizontal image slices of the electrodeposited Cu/steel interface after exposure to O2-sparged 3 mol/L NaCl solution for 0 h (left column) and 42 h (right column).
Geosciences 08 00360 g007
Figure 8. Synchrotron micro-CT vertical and horizontal image slices of the cold spray Cu/steel interface after exposure to air-sparged 3 mol/L NaCl solution for 0 h (left column) and 42 h (right column).
Geosciences 08 00360 g008
Figure 9. Synchrotron micro-CT vertical and horizontal image slices of the heat-treated cold spray Cu/steel interface after exposure to air-sparged 3 mol/L NaCl solution for 0 h (left column) and 42 h (right column).
Geosciences 08 00360 g009
Figure 10. Synchrotron micro-CT vertical and horizontal image slices of the electrodeposited Cu/steel interface after exposure to air-sparged 3 mol/L NaCl solution for 0 h (left column) and 42 h (right column).
Geosciences 08 00360 g010
Figure 11. Images of the damage volume segmented from the micro-CT data sets acquired over 42 h for a cold spray Cu/steel sample exposed to O2-sparged 3.0 mol/L NaCl solution. Image slices for the same sample are shown in Figure 5.
Geosciences 08 00360 g011
Figure 12. Measured volume of steel corroded at the base of a through-coating defect and the corresponding nO2 consumed over 42 h in O2-sparged (dots) and air-sparged (squares) 3.0 mol/L NaCl solutions. The solid lines are the linear regression fits and the dashed lines show the 95% confidence interval.
Geosciences 08 00360 g012

