When seeking to recognize historical components of current landscapes on remotely sensed imagery, the chances of identification can vary sensibly due to the nature of the elements that make up the past territorial organization and their preservation. One of the major issues faced by archaeologists when tackling the recognition of centurial systems in any sort of teledetected imagery is the identification of the land division boundaries as, in the past, they might have been formed by a variety of different natural or artificial elements, such as roads, fences/hedges, ditches, drainage and irrigation channels, tree lines and other landmarks [
23,
24] and they might be preserved in the modern-day territory by a likewise wide variety of artificial or natural markers. The issue is particularly intense in areas where later urban transformation has altered information embedded in the landscape and spatial signatures are obscured by the noise of more modern systems. This requires the use of the broadest possible range of geospatial data (including imagery) in order to ensure that their availability make up for shortcomings and voids rooted in each dataset and that all the landscapes elements relevant to centurial grid identification can be highlighted and properly considered.
2.1. Project Data Sources
Accordingly, the project has acquired a broad array of geospatial data ranging from base and thematic maps to remote sensing imagery, historic cartography and legacy data, all providing the necessary context to validate or expunge detected linear features.
Accurate base cartography is provided as freely accessible datasets made available by the Cartographic Division of the Regional Government of Friuli Venezia Giulia [
25], the administrative Region within which Aquileia is located. The project has acquired shapefile datasets (RDN2008/TM33) at both 1:5000 and 1:25,000 scale as well as terrain height points and Lidar based DTMs (respectively 10 m and 1 m resolution) generated using airborne data collected in the past decade; in addition, previous digital and printed topographic maps (these last scanned and georeferenced by the project) have been acquired to avail a detailed sequence of modifications to the landscape as recorded in topo-maps of the last 40 years.
Much of the information relative to the landscape morphological arrangement needed for the goals of the project already appears in these basemaps. However, they are generally obtained via aero-photogrammetry: given the inherent subjectivity embedded in the image-interpretation process, the mapping of topographic elements ends up biased by the selection of the relevant mappable features made by the photogrammetric operators. As a consequence, only landscape elements deemed relevant to the mapping exercise are recorded. Thus produced, topographic maps do not, and often cannot, include information that is highly relevant to centurial grid detection, for example, cropmarks and soilmarks (visible on imagery) that can be referred to centuriation or ancient settlements; or features like tree lines made up by plants that in many cases were cyclically replanted over previous vegetation boundary markers used for many centuries to separate properties; or minor pathways and tracks that might preserve ancient ones. This makes using Remote Sensing imagery crucial in order to enable systematic recording of all the potential components of the centurial grid, irrespectively of how they have been preserved.
To prevent loss of information, the VEiL project has collated a vast remote sensing dataset, including imagery captured by various sources and sensors: these comprise (i) Black/White historical photographs; (ii) multispectral and hyperspectral imagery; (iii) RGB high-resolution aerial orthorectified images of different periods; (iv) Lidar data. For the specific goals of the work here described; data (i) to (iii) have been employed.
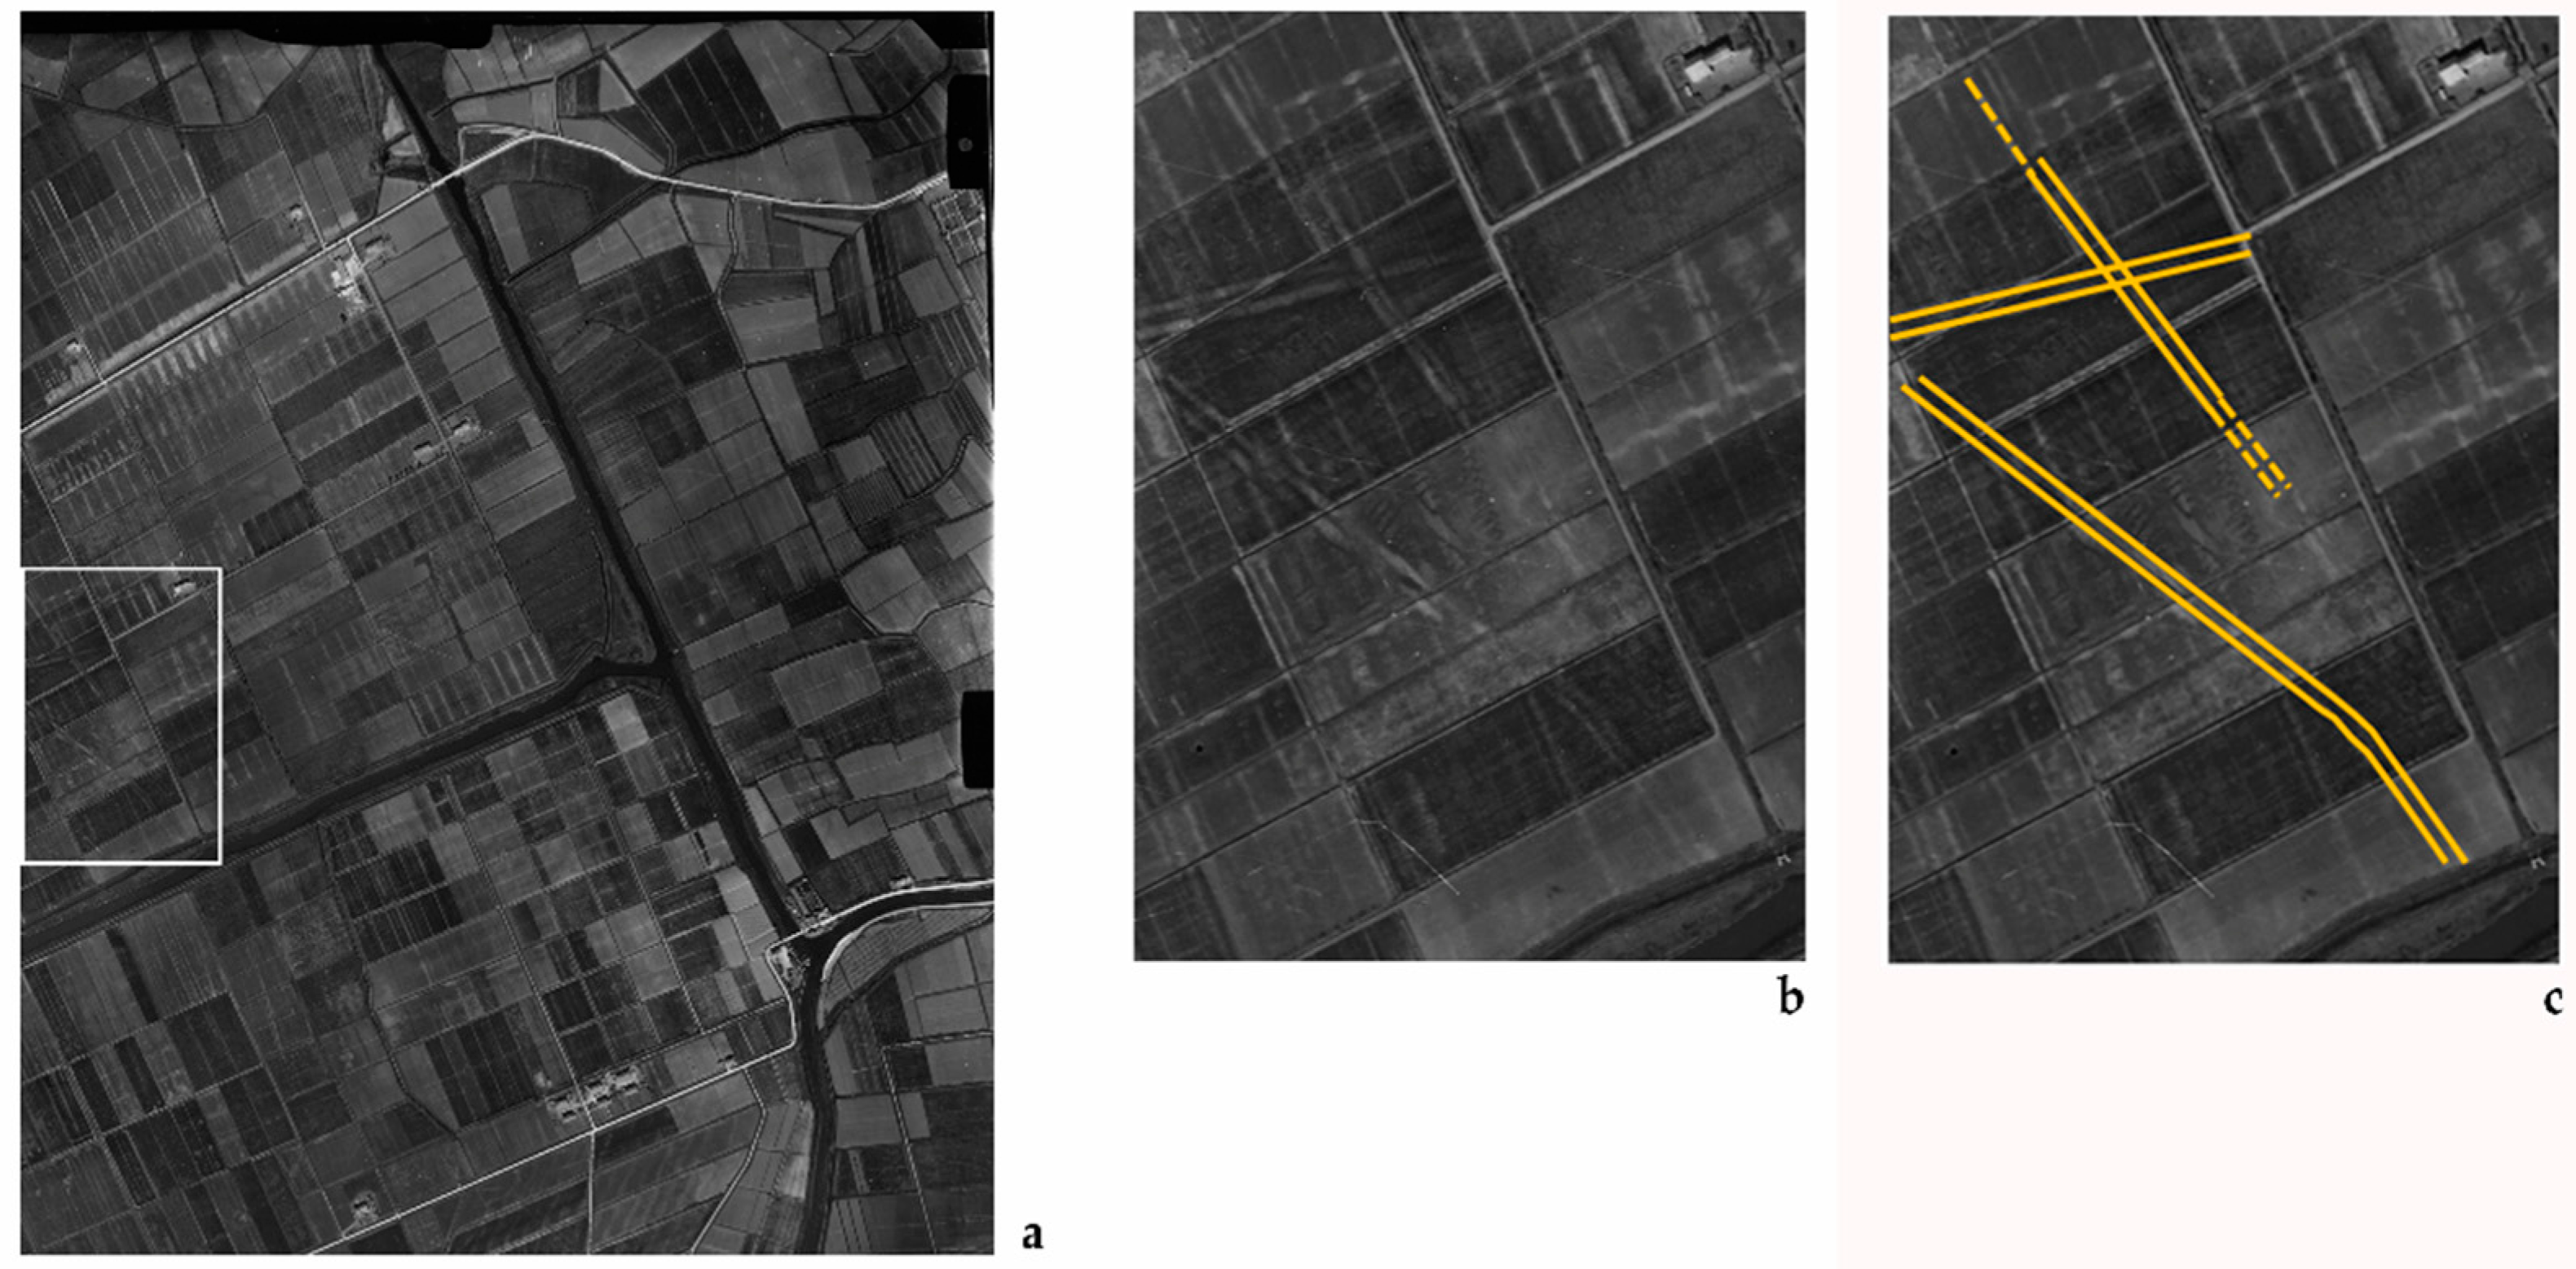
Historical aerial photographs (recorded starting in 1938), with a ground resolution varying from 1.5 to 3–4 m according to shooting period, represent a valuable source of information in that they provide information still embedded in the landscape in the second part of last century, but often no more visible on the ground nowadays due to later transformations (
Figure 2). Soil and crop marks potentially related to the centurial grid are very visible in this type of imagery as well as are land boundaries and landscape arrangements superseded by more recent land reorganizations.
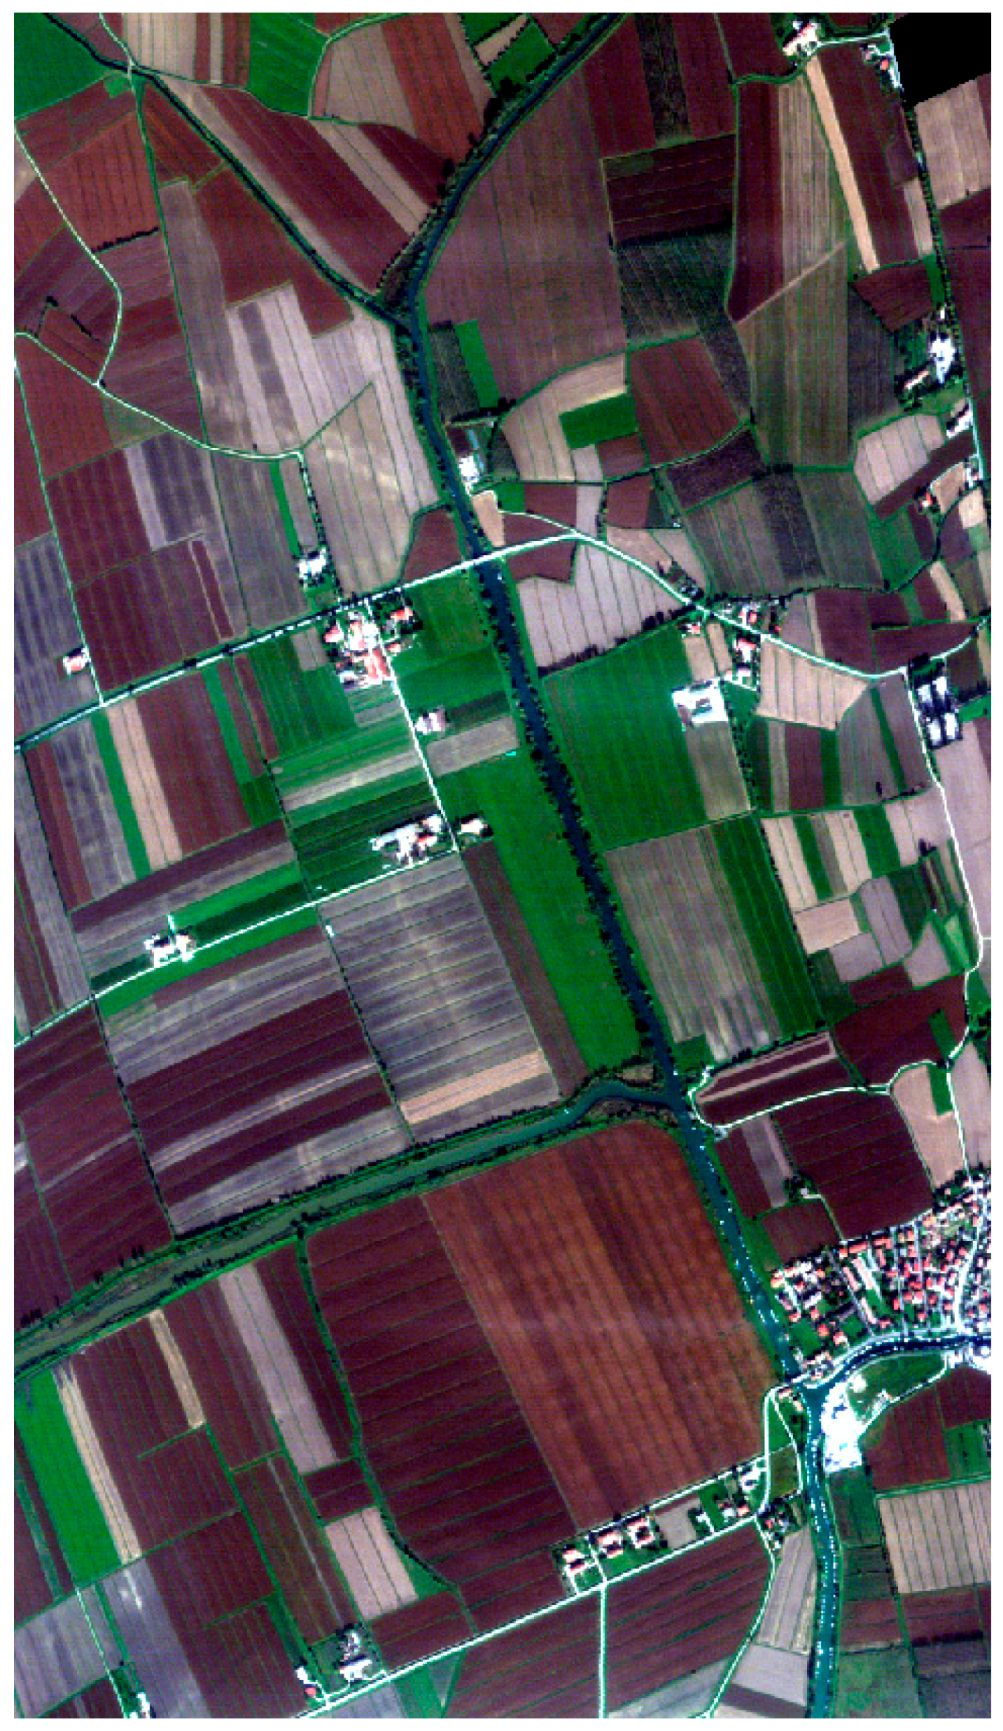
The hyperspectral data available to the project were acquired using MIVIS (Multispectral Infrared and Visible Imaging Spectrometer), a simultaneous spectral system that operates in the range of wavelengths from visible to Thermal infrared regions of the electromagnetic spectrum, with a surface spatial resolution of about 3 m × 3 m and an elevated number of channels (102) enabling a high spectral resolution (
Figure 3). The images have been captured on two subsequent days during October 1998 in two acquisitions: a daytime shot (about 12 PM) and a so-called “night shot” (about 9–10 AM) that provided thermal values similar to the nocturnal ones.
The spectral characteristics of MIVIS data enables their use for monitoring vegetation health status using vegetation indexes and, therefore, provide the ability to identify alterations in the subsoil potentially related to archaeological deposits, which are reflected in the growth and biophysic parameters of the vegetation developing on top of them. Spectral characteristics can also be exploited by using soil indexes to increase the optical distinction between the wetness or the dryness of a portion of the ground, thus enabling the recognition of voids or artefacts lying immediately under the surface soil. Within the area covered by the acquisition (about 88 km
2 in extent, distributed in a polygon extending around 6.75 km in width and 12.56 km in length) over 600 multi-shaped and multi-oriented marks of potential anthropogenic origin (several of which oriented with the city plan) have been mapped using routine processing (vegetation indexes—Normalized Difference Vegetation Index (NDVI), Difference Vegetation Index (DVI), Modified Soil-adjusted Vegetation Index (MSAVI2), Generalized Difference Vegetation Index (GDVI), Green Normalized Difference Vegetation Index (GNDVI), etc. soil indexes—Principal Component Analysis PCA and Selective Principal component analysis or SPCA, Tasseled Cap) and visual detection combined with manual mapping. Besides, the MIVIS imagery displays abundance of modern landscape features aligning with the Aquileian Roman grid that, for their characteristics, can be automatically extracted with the workflow presented below (
Section 2.2): the coarseness of these data enables more accurate feature extraction as the algorithm is not misled by the abundance of fine details as in the case of RGB Orthophotos. The images, however, are affected often by strong geometric distortions that alter the straightness of linear elements of the landscape, distortions that are hard to compensate for without forcing rectification procedures that dramatically alter the original aspects of the features, thus potentially misrepresenting the real geometry of landscape elements.
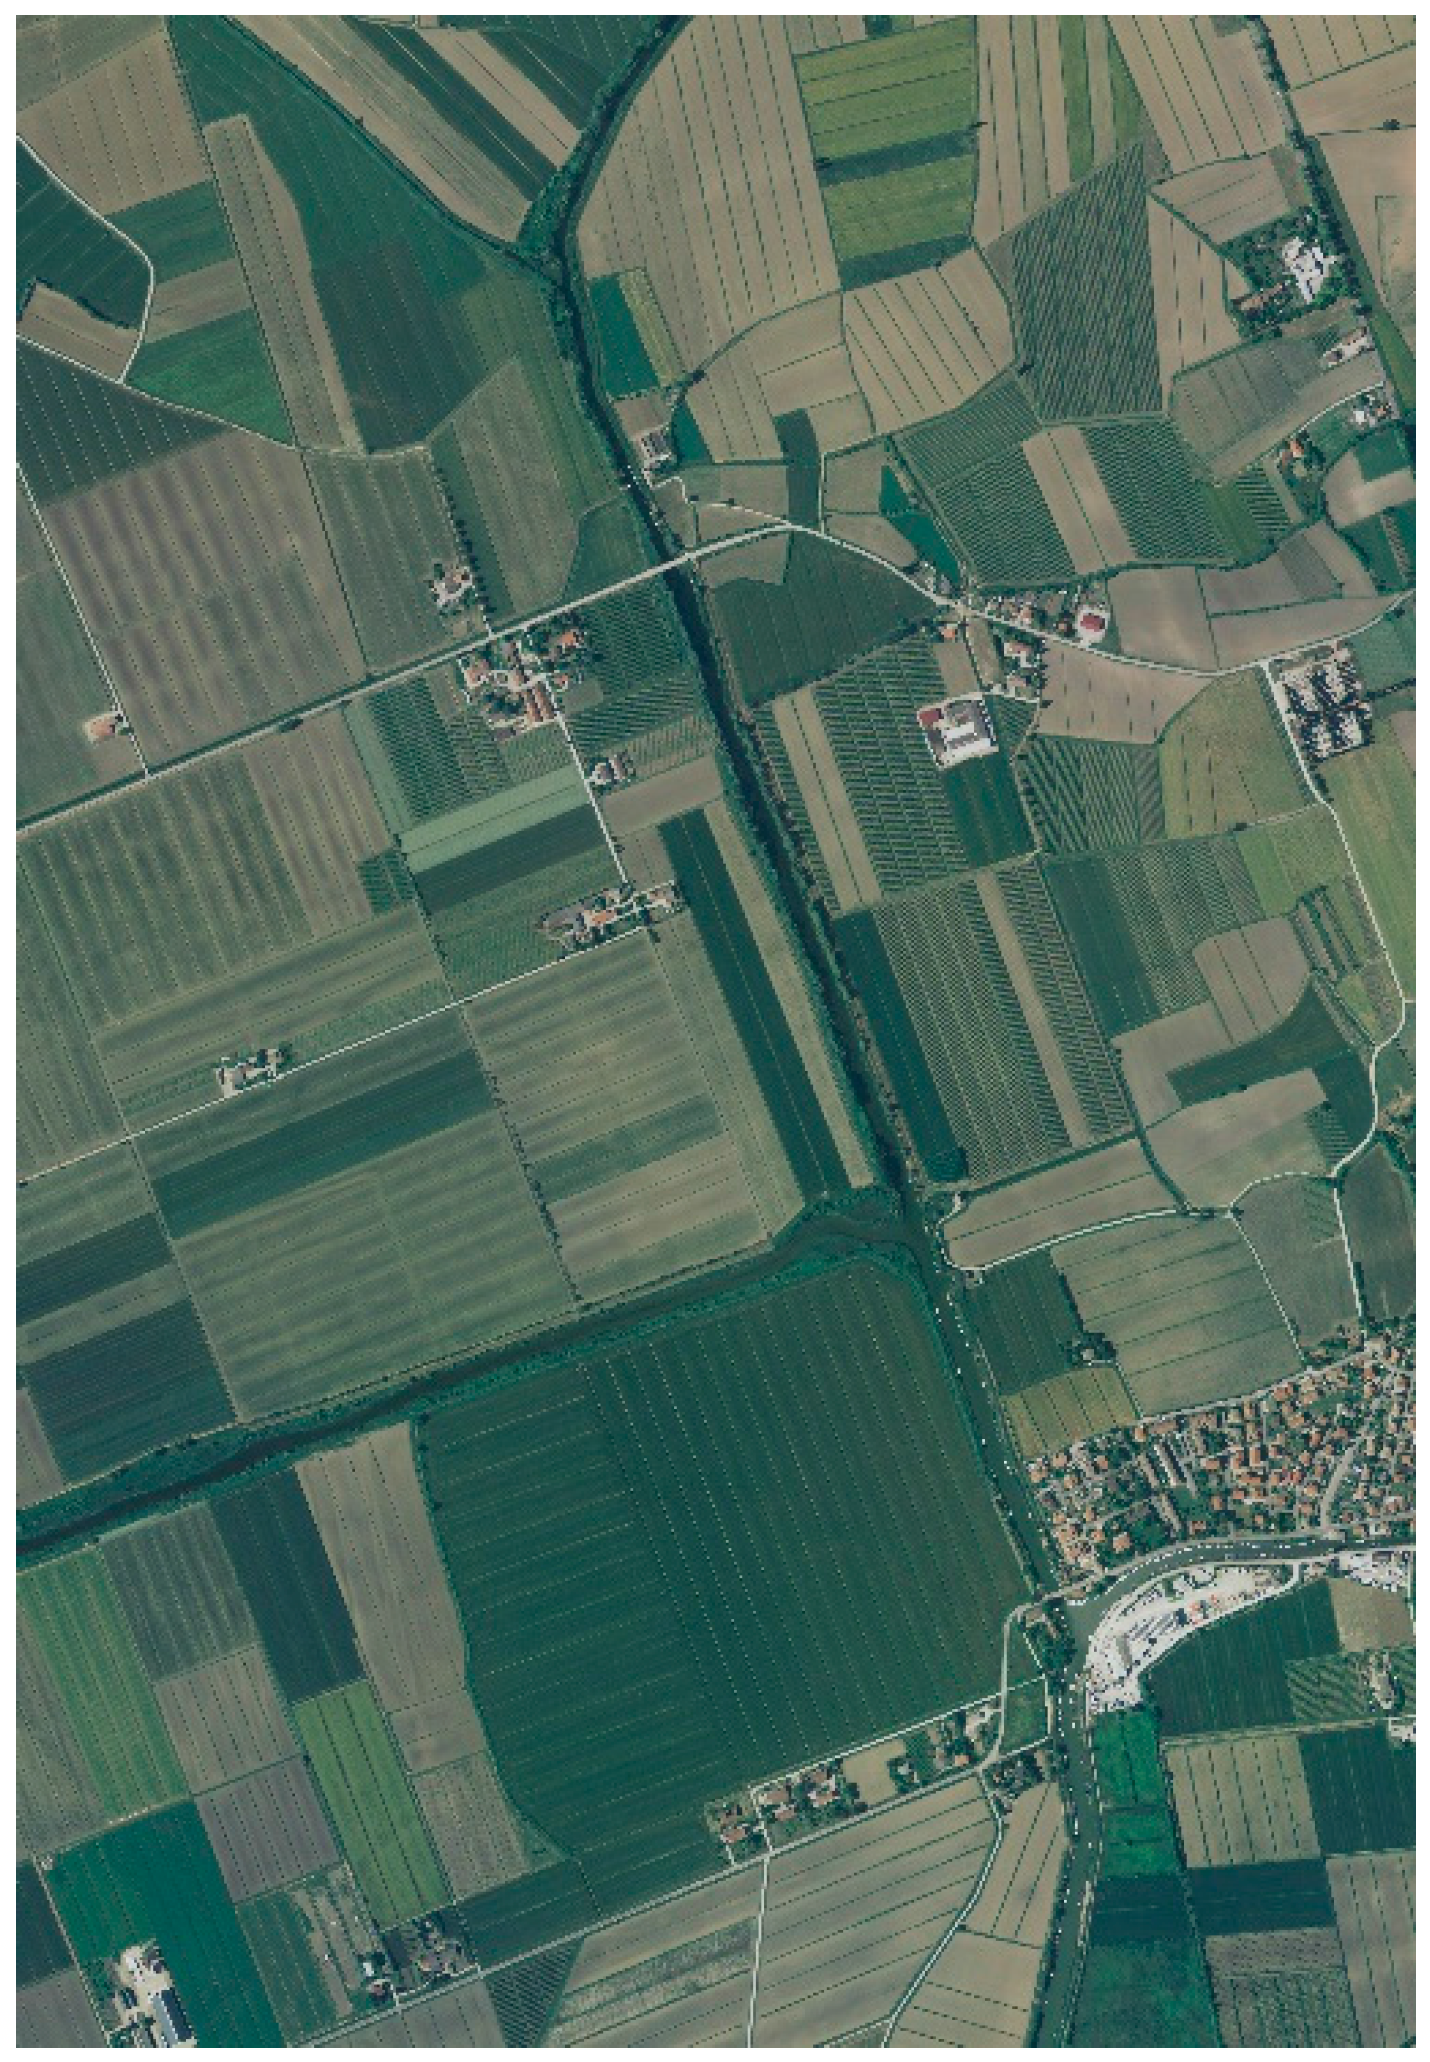
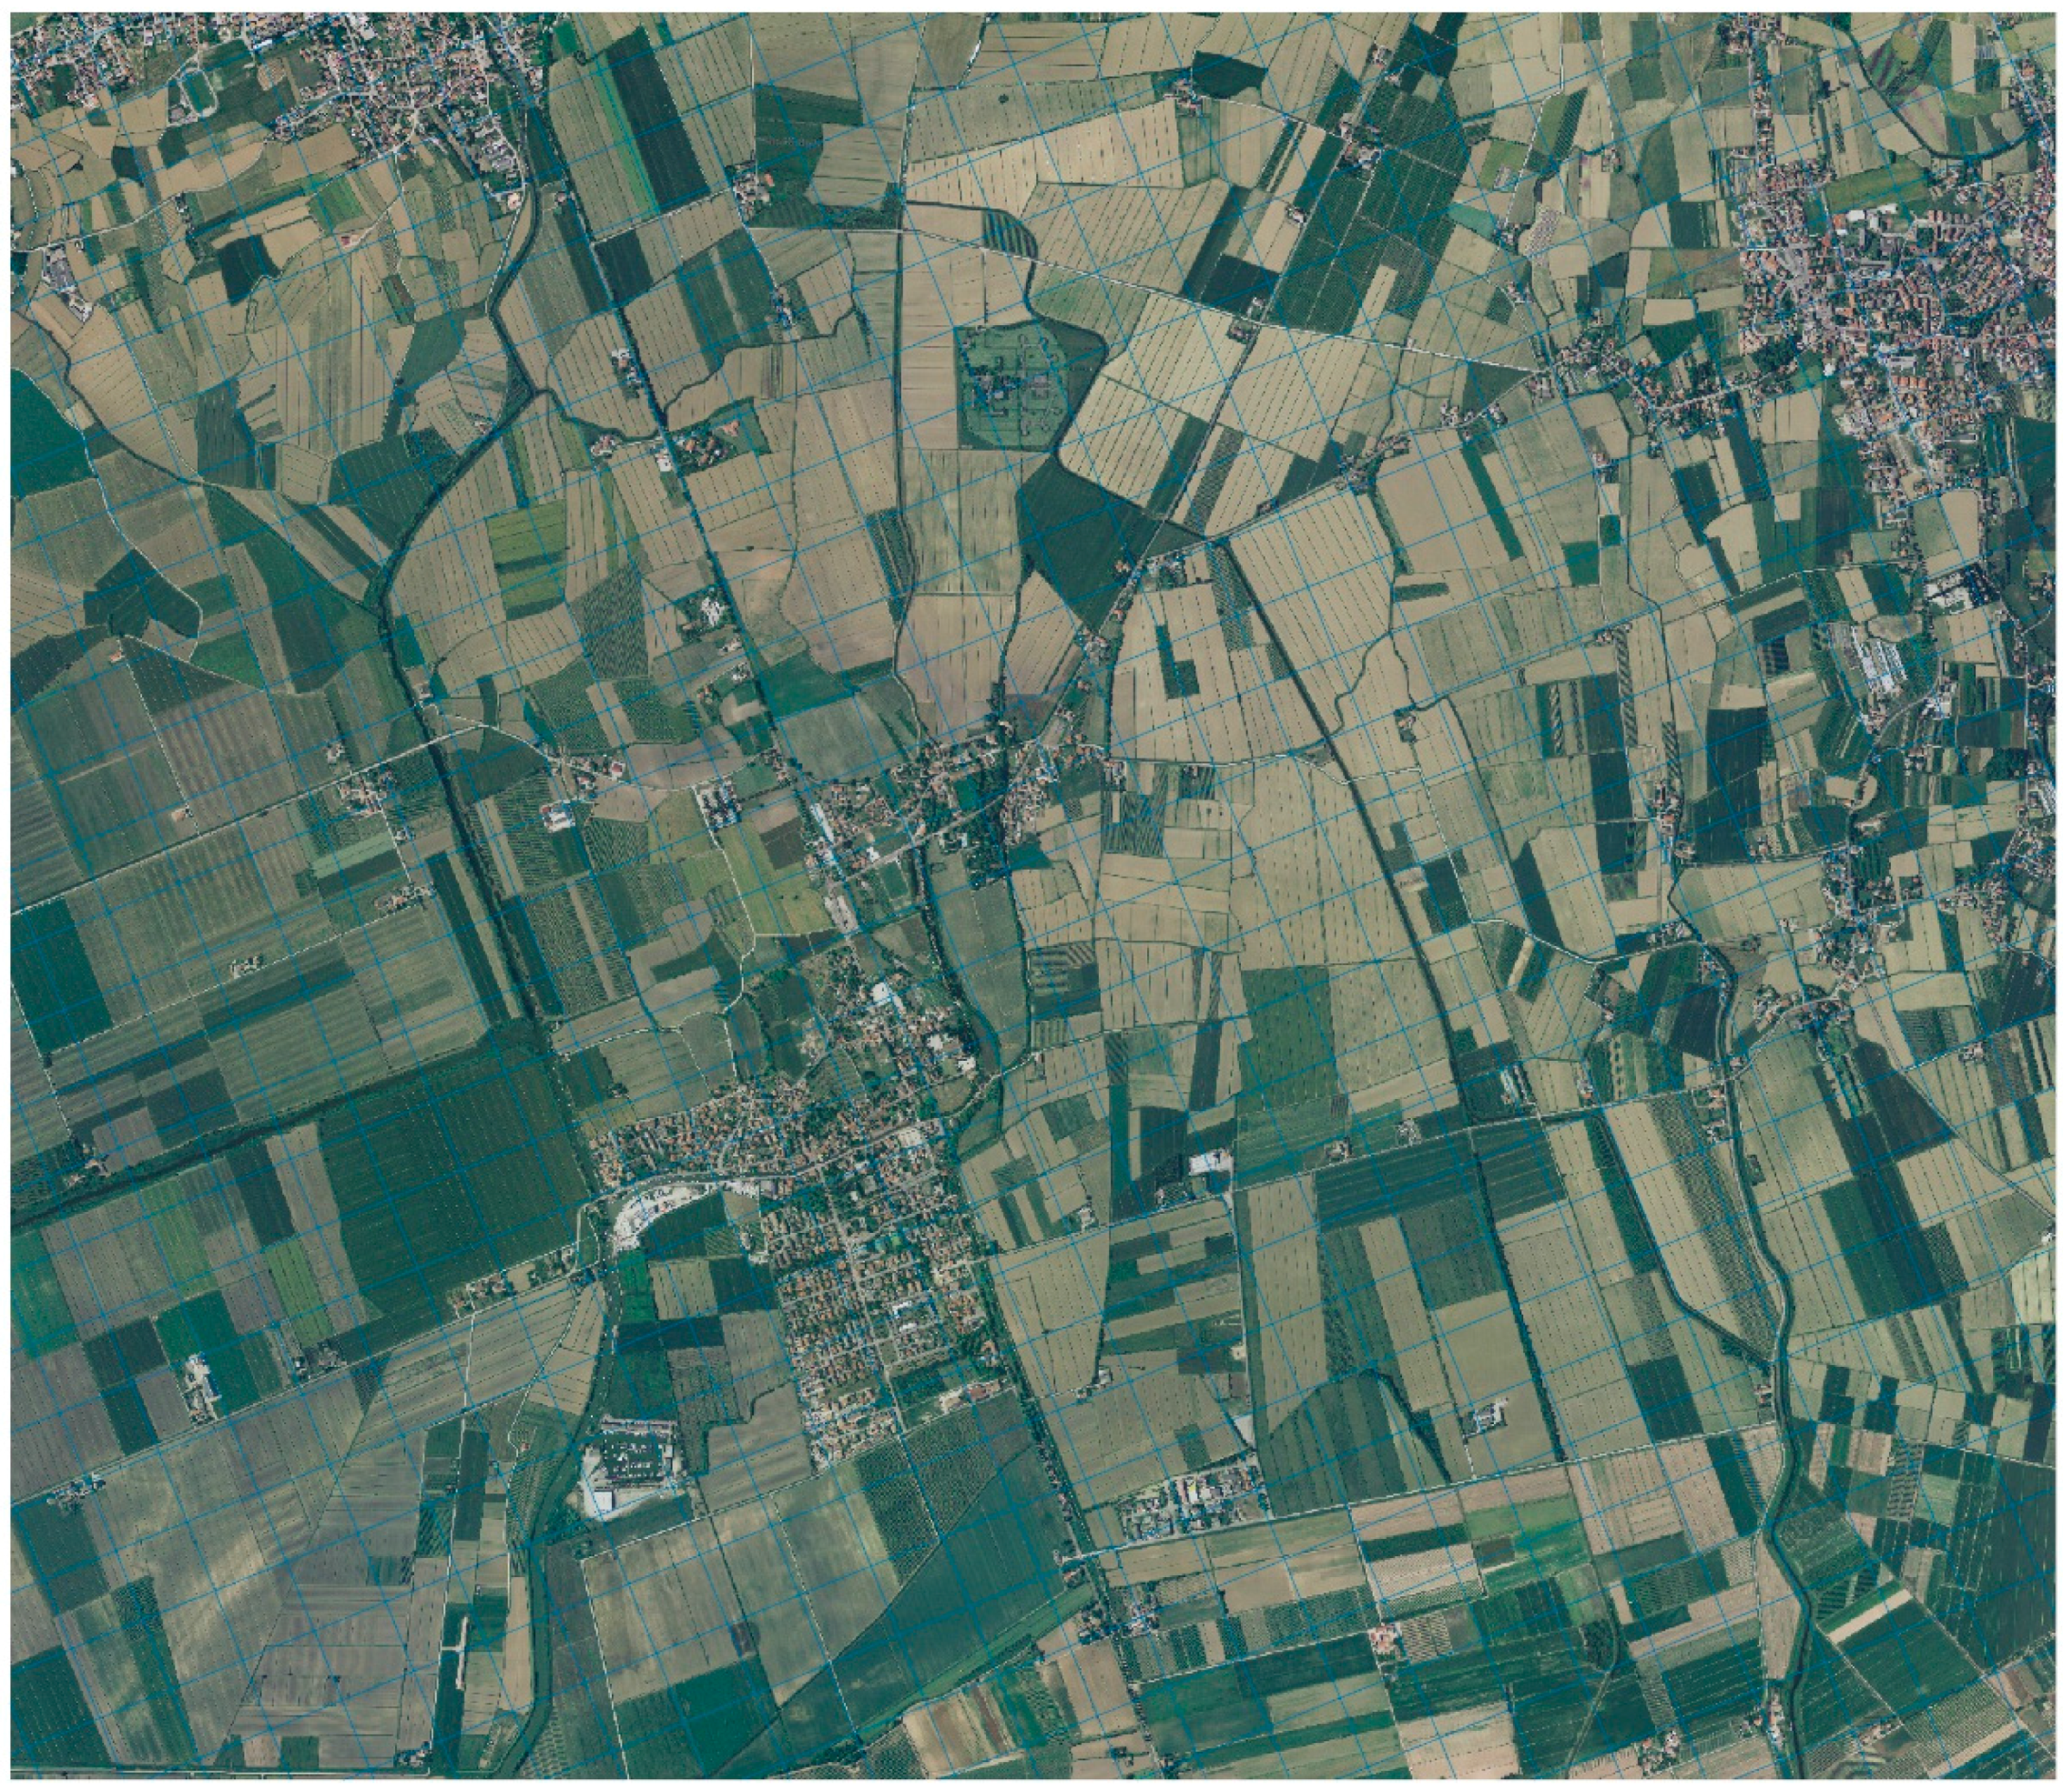
RGB Ortho-Imagery includes coverages from 2000, 2003, 2007 and 2011 with respectively 100, 80, 70, 50 cm ground resolution, and forms the Remote Sensing dataset with the highest spatial resolution available in this project (
Figure 4). This represents the most useful set of imagery for the present work as a coverage for the whole region is available for multiple years and for the increased ground resolution of the data.
A custom-designed workflow has been applied on these photographic datasets in order to automatically detect similarly angled or orthogonal landscape elements having an orientation congruent with the Aquileian cadaster. As, clearly, not all correctly oriented features of the landscape have a correlation with the centurial grid, and orientation is not the only characteristic that linear features have to have in order to be considered parts of a cadaster, the extracted linear features have been filtered to remove those that do not carry a strong weight, i.e., those that are unlikely to be ancient, for example the majority of the minor drainage channels that follow the 22° W from N or 22° S from W (=248°) directions (respectively aligned with the major axes of the Centuriation, the Cardo Maximus and Decumanus Maximus) and that are likely to be simply later additions, kept parallel to a landscape dominated by Roman arrangements designed to be the most appropriate to ensure efficient water drainage. After they have been filtered, the frequency of the remaining elements oriented to the Roman grid is estimated from the images in order to compute the module with highest probability.
The goal of this and similar approaches is to examine a large set of hypotheses, to quickly exclude those with little promise and to provide reasonable candidates for further investigation based on more traditional archaeological approaches. Indeed, the automatic extraction of features can in no way provide direct confirmation or guarantee of identification, but can be used to reduce the amount of fieldwork and other investigation required to confirm elements of current landscape as ancient land division. To this effect, the proposed approach was based on hypotheses with no more than a simple range of acceptable values for the cadaster modules and a few well documented assumptions like the orientation of cardo and decumanus. Rather than being hypothesis-driven, the approach was oriented to evaluate what could be extracted, resulting in multiple hypotheses of which we deemed one more plausible than the others. It remains as a given that all of them need to be verified on the basis of a variety of other criteria and validation procedures, including fieldwork activities, legacy data re-evaluation and spatial analysis. However, thus reduced, verification can be performed on a very limited number of hypotheses vs a continuum.
2.2. Method
The workflow of feature extraction and detection implemented in © Matlab (R2016b, MathWorks Natick, MA, USA) seeks to estimate location and periodicity of dominant linear features on georeferenced images. In order to do that, the system needs to extract dominant lines aligned along the 22° W from N and 22° S from W (=68° E from N) directions, accumulate the georeferenced linear features from all images and fit the correct location and size of the centuriation on the dominant responses. For this reason, the workflow involves three processes: (i) filtering; (ii) thresholding and linear feature extraction; (iii) feature accumulation and periodicity estimation.
2.2.1. Filtering
The filtering process aims to estimate the presence of linear features by looking at the response of edge detection linear filters at various locations, orientations, and scales. To this end we independently convolved each image with a bank of Gabor filters at various orientations and scales.
Gabor filters [
26] are directional wavelet filters that can detect the presence of specific frequencies at a given orientation, localized around a given location. This ability to detect directional high frequency locally periodic patterns made them the tool of choice in several image processing and applications such as character recognition [
27] and fingerprint recognition [
28]. These characteristics make them also perfectly suited for the present task, where drainage ditches in fields and other current land division components result in repetitive aligned linear features.
The spatial response of the filter is defined as follows:
where
and
θ is the filter’s orientation,
λ is its frequency, σ the scale of the filter,
γ its aspect ratio, i.e., scale ratio along the direction versus orthogonal to the direction, and, finally,
ψ is a phase offset, which will result in a phase shift in the complex response and is irrelevant for our analysis since we are interested in the absolute value of the response.
The bank of filters includes filters computed at various scales and orientations: the scales of the filters were 5, 10, 20, and 30 m, which include the fundamental scales of the sought after linear features, i.e., roads, canals, drain-lines, crop-marks, etc. The orientations were selected in a relatively narrow band around the known centuriation axes, i.e., 12°, 17°, 22°, 27°, and 32° W from North for the lines aligned with the cardo, and 12°, 17°, 22°, 27°, and 32° S from West for the ones aligned to the decumanus.
The spatial frequency was linked to the scale such that period length was equal to the scale, i.e., σ/λ = 1; while the aspect ratio was set to 1/3 so that the filter was fairly elongated in order to (i) increase directional accuracy; (ii) limit general high feature response; and (iii) concentrate on sizable aligned edges. Finally, the phase offset ψ was ignored (set to 0) as it does not have an effect on the absolute response value.
Given this filter bank each image was convolved with 40 filters resulting in 120 responses for RGB images (40 per channel). These responses were divided into two groups of 60 responses each: one for the filters with orientations around the
cardo direction (22° W from N) and one for orientations around the
decumanus direction (22° S from W). Then, we non-linearly accumulated the response across channels and scales. Here we accumulated by summing the square norm of the response at each location and direction (
Figure 5). The goal of the non-linear accumulation is to perform a soft-max, i.e., obtain a continuous response that enhances the maximum values across channels and scales. The end result is 5 responses per dominant direction providing response in the location-orientation space.
2.2.2. Thresholding and Linear Feature Extraction
In order to extract linear feature candidates, we performed selective thresholding in the location-direction space. For each directional group, we retained locations (pixels), if the current location was a local maximum at the central direction (22° W from N for the cardo oriented group, 22° S from W for the decumanus oriented group) and its accumulated response was above an adaptive threshold. In particular, location (x,y) was retained if:
location maximality
resp(x,y;θ) ≥ resp(x + k dx, y + k dy; θ)
with
and
θ being the group’s dominant direction (22° or 112° W from N)
directional maximality
resp(x,y;θ) ≥ resp(x, y; θ + dθ)
with dθ = −10°, −5°, 5°, 10°
adaptive thresholding
with the threshold parameter c being set to 0.1 in our experiments.
The result was two sets of pixel locations for each image corresponding to strong edge responses along either the
cardo direction (22° W of N) or
decumanus direction (22° S from W). Note that
cardo and
decumanus sets are independent and a pixel can appear in both sets (
Figure 6).
2.2.3. Feature Accumulation and Periodicity Estimation
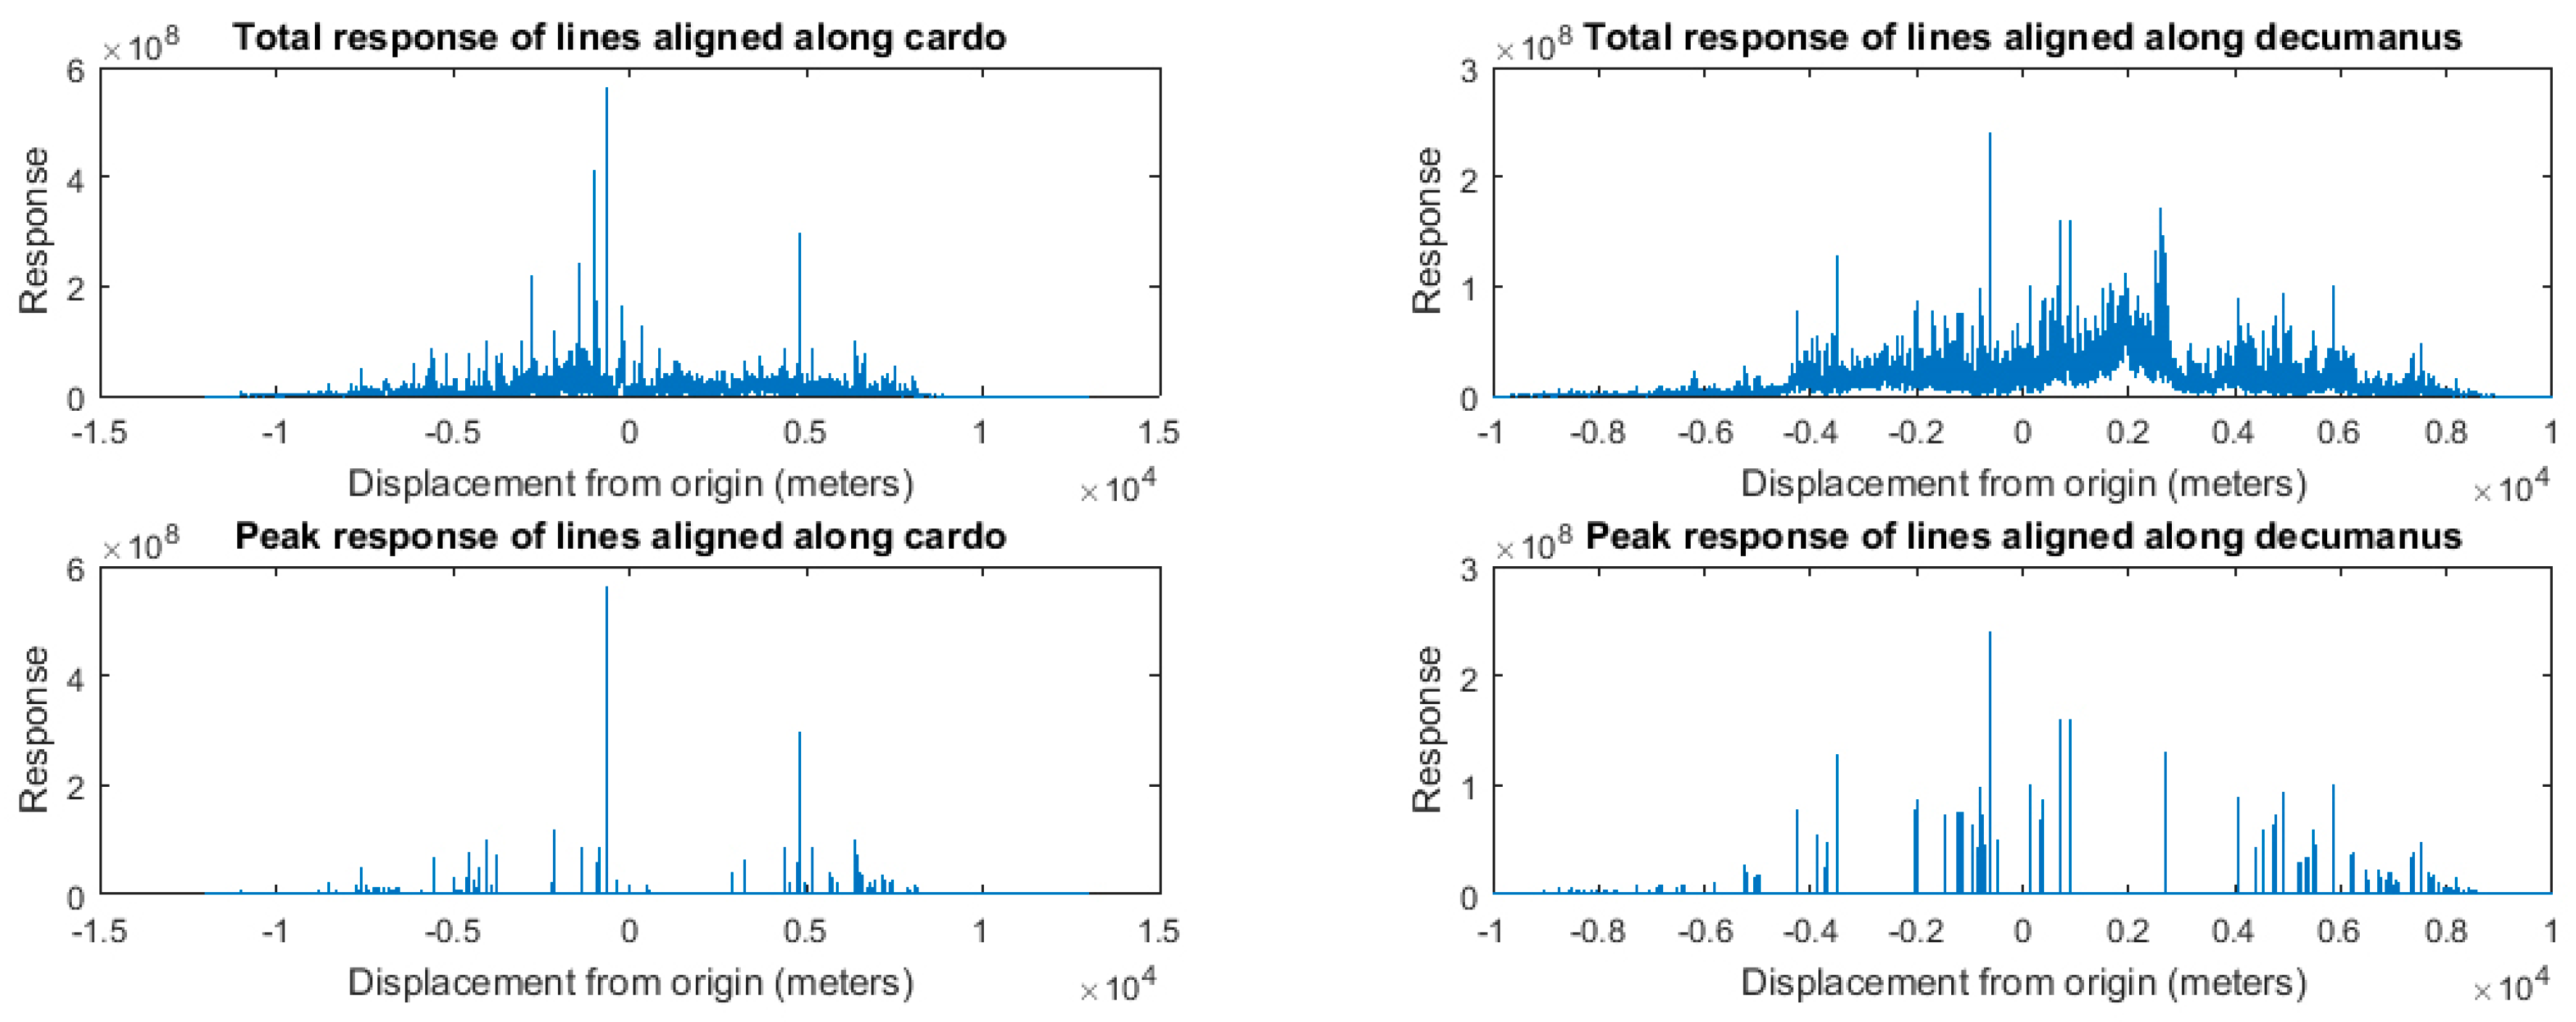
Given pixel-wise feature locations in each georeferenced image, we computed the geolocation of each point feature and accumulate those throughout all image sets, obtaining a set of georeferenced feature locations and their responses. In order to find the center and periodicity of such responses, first each linear response was down-projected and accumulated along the direction orthogonal to the group’s direction, i.e., cardo’s direction responses were accumulated along a line in the 22° S from W direction, while decumanus lines were accumulated along a linear space of orientation 22° N from W, thus resulting in two response histograms along the two orthogonal directions.
For ease of computation, the origin of this projected system was set at the intersection of the
via Julia Augusta (State Route 352) and the virtual extension of the Anfora Canal (which flows toward SW, W of Aquileia) toward E, which is considered to be the most likely point of intersection of the
cardo Maximus and
decumanus Maximus [
20].
These response histograms (
Figure 7) take into account the locations of all coherently aligned responses, andare strongly influenced by the geometry of the spatial coverage, exhibiting a systematic size bias of the baseline responses visible in the histogram. However, we were not interested in the baseline responses, but rather in the peaks of the distribution, which correspond to directions with higher-than-usual aligned response. For this reason, we eliminated the baseline response by computing a centered average of the response over 50 m (smoothing with a centered average filter of size 50 m) and maintaining only the responses that were greater than 2.5 times the smoothed response.
The use of peaks provides the added advantage of making the approach more robust with respect to missing signals. Indeed, gaps due to missing alignments would simply result in fewer votes and, thus, smaller peaks, which are, however, still likely to be of much larger magnitude than the average response as a result of limited and localized lack of signal, and thus identifiable.
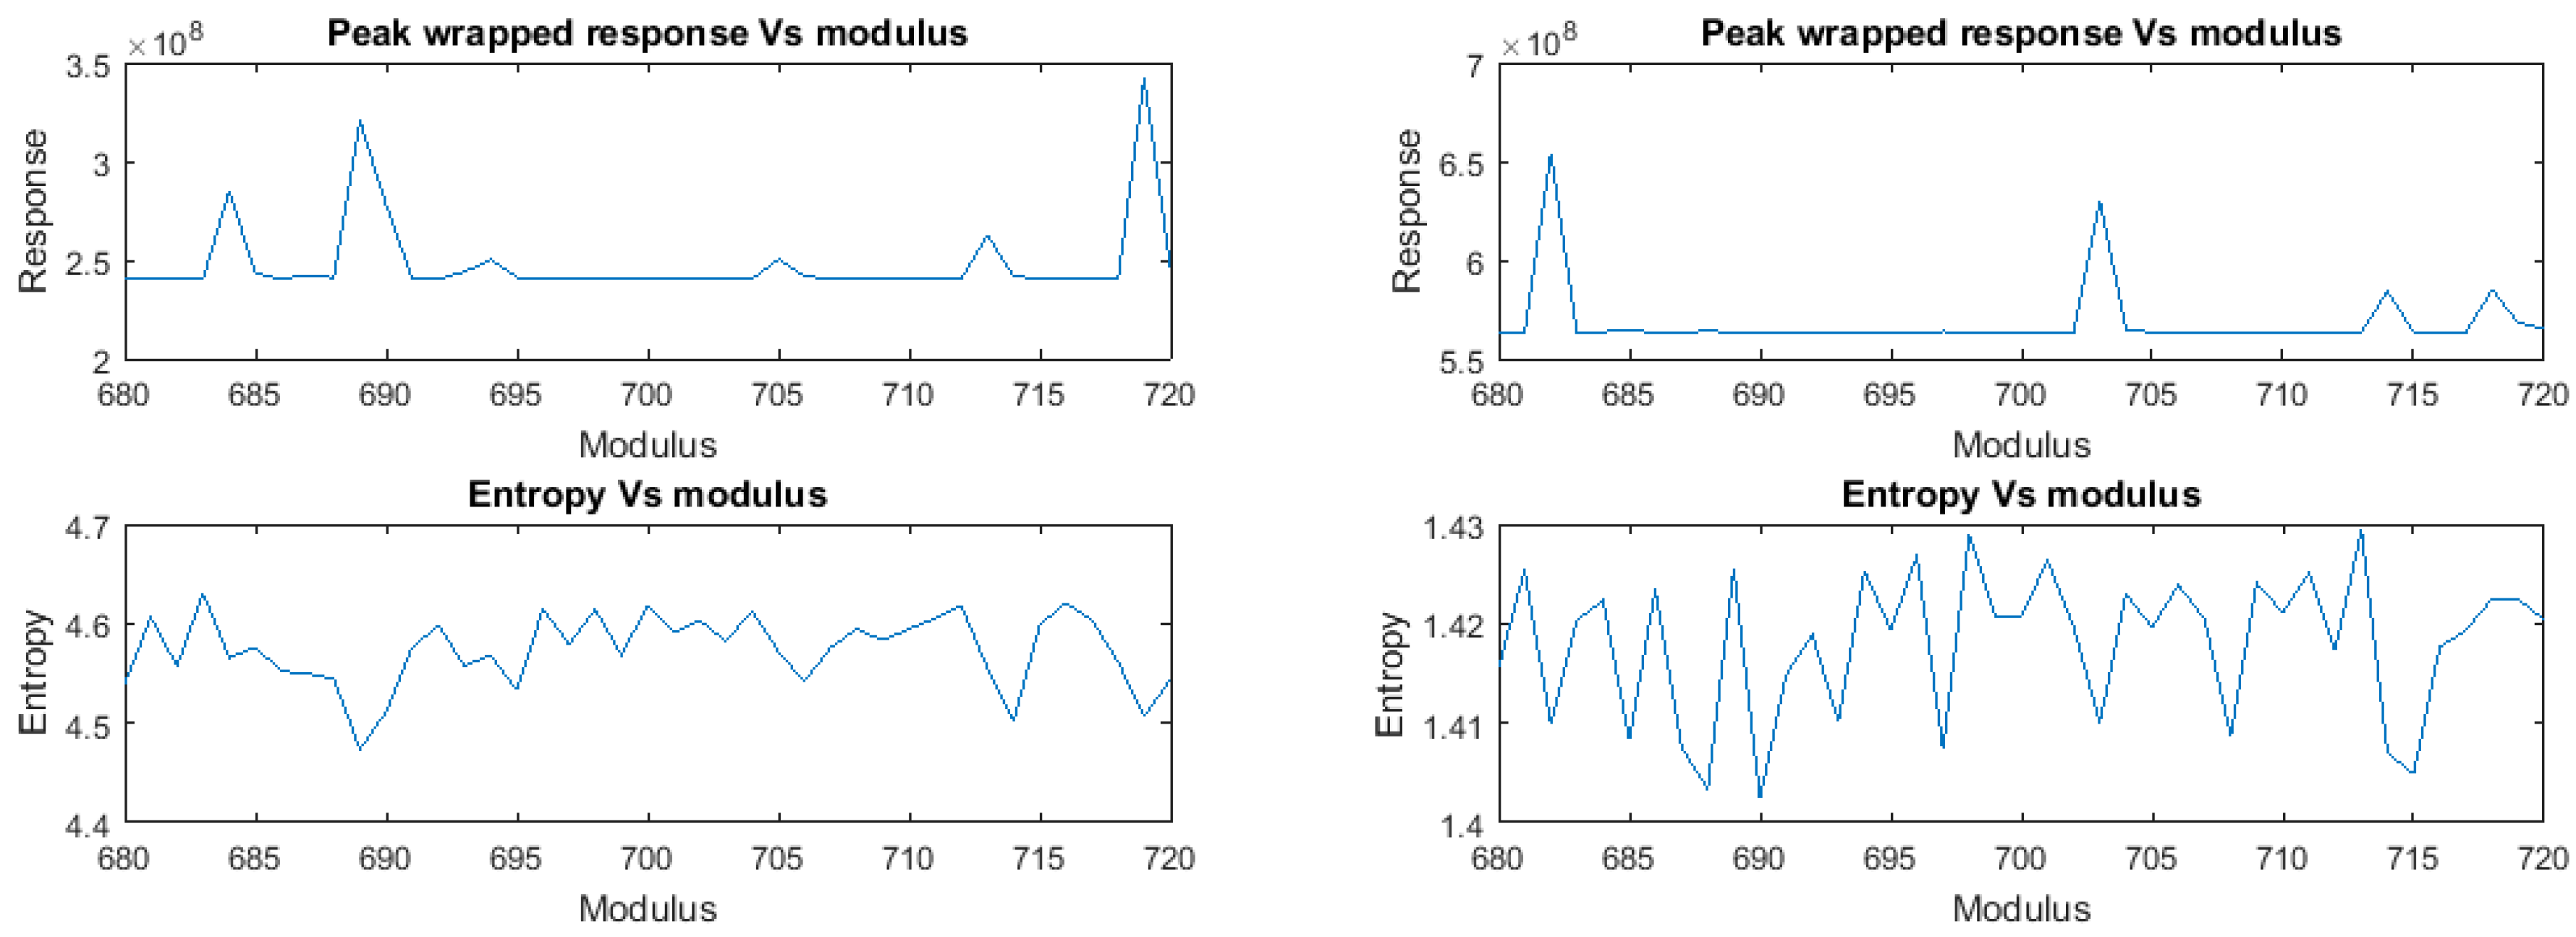
With the histograms of peak responses in hand, we sought to estimate the center location and periodicity of repeated aligned linear features, with the hope that these would correspond to location and module of centuriation patterns. To this end we tested centurial modules ranging from 600 m to 750 m in a 1 m increment. We operated on the two main orientations independently, and for each tested module we accumulated the response cyclically, wrapping around the accumulation with a period equal to the module.
with
t = 0...module − 1.
For each module, we retained peak value, peak location and entropy of the wrapped histogram. The Entropy is a measure of disorder or lack of information in a distribution and has maximal values when the distribution is concentrated in a few states
where
.
The expectation was that the correct module would exhibit better modular alignment of (peak) directional responses, resulting in a wrapped histogram with a stronger and better localized peak in correspondence to the modular location of the center of the centuriation pattern and relatively little response elsewhere. Hence, the correct module would be characterized by a maximal value in the peak value and a minimal value in the entropy associated with the corresponding wrapped histogram. Once this optimal module was detected, the location offset along the orthogonal direction could be extracted from the peak location at that module value.
Note that, due to aliasing phenomena, we would have expected similar peaks to appear at any multiple of the correct modulus. However, the limits in the search range hided such effects. Indeed, to observe them we would require the maximum value of the range to be at least twice as big as the smallest modulus, while our range went from 680 to 720 m.
