Abstract
The EAMENA (Endangered Archaeology of the Middle East and North Africa) project is a collaboration between the Universities of Leicester, Oxford and Durham; it is funded by the Arcadia Fund and the Cultural Protection Fund. This paper explores the development of the EAMENA methodology, and discusses some of the problems of working across such a broad region. We discuss two main case studies: the World Heritage site of Cyrene illustrates how the project can use satellite imagery (dating from the 1960s to 2017), in conjunction with published data to create a detailed set of database records for a single site and, in particular, highlights the impact of modern urban expansion across the region. Conversely, the Homs Cairns case study demonstrates how the EAMENA methodology also works at an extensive scale, and integrates image interpretation (using imagery dating from the 1960s to 2016), landuse mapping and field survey (2007–2010) to record and analyse the condition of hundreds of features across a small study region. This study emphasises the impact of modern agricultural and land clearing activities. Ultimately, this paper assesses the effectiveness of the EAMENA approach, evaluating its potential success against projects using crowd-sourcing and automation for recording archaeological sites, and seeks to determine the most appropriate methods to use to document sites and assess disturbances and threats across such a vast and diverse area.
1. Introduction
As a result of innovations in open source geospatial and database technologies and software, archaeologists can now collect and analyse data at unprecedented scales e.g. [1,2]. As Hritz [3] (p. 229) recently pointed out, these developments have also enabled us to develop strategies to ensure better documentation and management of landscapes that are under threat or rapidly disappearing. Despite these advances, access to the data, technology and software required to query, analyse and manage threats is very uneven across the Middle East and North Africa (MENA) region.
The Endangered Archaeology of the Middle East and North Africa (EAMENA) Project [4,5] is documenting archaeological sites and the threats posed to them in an online database that spans 20 countries (an area of roughly 10,000,000 km2, see Figure 1). The project uses two main methodological approaches, both designed to promote the recording, protection and understanding of cultural heritage at risk across the MENA region as a whole. First, we focus on accessible, user-friendly and open-source remote sensing technologies and tools. Second, we seek to enhance our data and understanding of risk/damage to sites with more specific analyses using high-resolution data where possible.
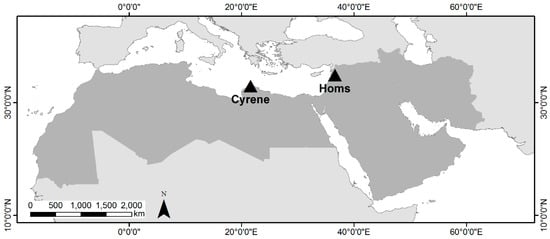
Figure 1.
Endangered Archaeology of the Middle East and North Africa (EAMENA) study area (highlighted in grey) and the location of the case studies discussed in this paper.
EAMENA is a collaborative project between the Universities of Oxford, Leicester and Durham, directed by a group of archaeologists with significant experience of remote sensing and archaeological survey in the MENA region, and supported by a team of post-doctoral researchers who undertake data entry, remote sensing analysis and prepare fieldwork based studies, and who will deliver training. To date, the project has focused on:
- the construction of our database, using the open-source Arches software, and the creation of over 150,000 records
- the detailed analysis of specific causes of damage to archaeological sites in the MENA region
- the initial stages of our training programme [6].
In a second phase of the project, we will develop a series of intensive training courses in the EAMENA methodologies to be attended by heritage professionals from eight MENA region countries.
This article explores the underlying methodological approaches adopted by the EAMENA project. We discuss how EAMENA focuses on the production of accurate and accessible data by applying well established techniques to promote standardisation and replicability; ensuring openness, ease of training, and adoption across the MENA region as a whole. We evaluate this methodology alongside other geospatial methods for heritage recording such as crowd-mapping and automation. The challenges of measuring and dealing with uncertainty are also addressed.
Remote Sensing and Heritage Recording in the MENA Region
The use of historical aerial photography and satellite imagery has a considerable legacy in the MENA region, developing from the work of Poidebard [7], Stein [8], and others in the early 20th century. Recent projects have revisited historical aerial images [9,10,11], and conducted new programmes of image collection (for example, the APAAME (Aerial Photographic Archive for Archaeology in the Middle East) project [12,13,14]). The use of these resources, alongside drone photography, photogrammetry and satellite imagery analysis, is now fairly commonplace. For Middle Eastern landscapes in particular, the declassification in the 1990s of Cold War satellite photography collected in the 1960s–1970s revolutionised this sub-field. This facilitates the mapping of features, especially as many sites have been damaged or destroyed during phases of agricultural and urban expansion in the last 40 years [15,16,17,18,19]. In North Africa, projects focusing on Libya initially made use of the Landsat sensors which have been collecting data since the 1970s (e.g., the Libyan Valleys Project, [20]).
The greater availability of high-resolution modern satellite data since the early 2000s, such as Spot 5/6 and Ikonos, and more recently from sensors with spatial resolutions as high as 0.30 m, such as WorldView 3 and 4, has also allowed projects working in the MENA region to undertake detailed recording of archaeological sites across discrete sub-regions [5,11,15,18]. While these data enable the mapping of complex features to be undertaken, their high cost is prohibitive for most archaeological projects. Free data, such as Google Earth, have allowed the mapping of more extensive areas and have been widely used by archaeologists to identify sites (for example by the Fragile Crescent Project in the Middle East (Durham), and the Trans-Sahara Project in North Africa (Leicester)).
There has also been a growing awareness of the potential of remote sensing to detect and monitor damage and disturbances to archaeological sites and thus a growing emphasis on its use for these purposes [21,22,23]. Archaeologists in this region increasingly rely on space-borne data to give a wide-scale view of heritage. For example, projects have made use of imagery offering a wide spectral range, for example mapping causes of damage using the multispectral properties of datasets such as Landsat, Sentinel, and higher resolution images (at a cost). SAR (Synthetic Aperture Radar) is also now being used by archaeologists to map problems such as looting (for example [23]).
Heritage projects are currently using several different methods to populate their databases quickly and efficiently in the face of the huge geographical areas involved. For example, photogrammetry and crowd-sourced images are being used to reconstruct the proportions of specific sites (e.g., Curious Travellers [24]), whilst other projects utilise a combined approach, including GIS and remote sensing, to study specific sites or regions (e.g., ASOR (American Schools of Oriental Research) [25]). Crowd mapping projects have developed exciting and innovative training packages to go along with their calls for help (see [26,27]). Crowd-source mapping takes advantage of the easy availability of appropriate technology to turn non-specialists into ‘citizen sensors’ of geospatial data [28], including information about archaeological sites. It also allows the rapid production of huge amounts of data, though local knowledge and repeated error checking/correction are necessary quality assessment measures [29,30]. There are some problems with using these methods, including errors caused by limited training of mappers, lack of authentication and standardisation, and unequal access to the necessary technology [28]. Before any interpretations of the data can be made, some kind of validation of its quality is necessary. Indeed, from our experience, techniques of image interpretation applied to archaeology have to be learnt over a considerable period of time, practised, refined, applied and re-applied to different areas and environments. Identification of sites based on automated and machine-learning methods to locate the spectral signatures of archaeological sites have also been explored in recent years [31,32,33,34]. These methods rely on detecting particular materials identified by a detailed understanding of the nature of archaeological deposits (such as their spectral properties and the shapes of features) in any given location. Menze and Ur [34], for example, used multispectral image-based classification of soils they interpreted as archaeological, and classification of mounded features using DEMs (Digital Elevation Models), to identify tell sites in Syria. While effective at recognising this specific type of site, other archaeological features that exist in the same landscapes are not so easy to classify using algorithms. Moreover, whilst their multispectral image classification was correct 73–97% of the time, when compared with field data, it also produced false positives, identifying features which turned out not to be sites [34] (pp. 781–782). Bennett et al. [33] suggest that automatic feature recognition performed by a computer is arguably more objective than human interpretation. The rapidity of recording that machine learning allows for is also significant, and given the accelerating loss of archaeology that EAMENA is identifying, is a factor to be taken into consideration. There are, however, also some good reasons for skepticism [17].
As with crowd-mapping methods, validation using field data and/or manual checking of the results is required. It can also be difficult to obtain affordable high-resolution satellite imagery covering large areas, while to be really effective high-resolution imagery and elevation data are needed. Another significant issue is the assumption that archaeological sites have standardised, homogenous spectral signatures: Beck et al. [15] dispute this idea. Instead, they argue that spectral properties are a representation of a wide variety of structural forms, building materials, soil and geological conditions, especially across a region as large as the MENA area, and that contrast, i.e., difference from background, is an important determinant of ease of detection [35]. This can lead to the omission of important features, especially when relying solely on automation. Automated detection algorithms also need building and checking by remote-sensing experts, with adaptations for each different region required.
The scale of heritage recording initiatives again varies, from highly detailed assessments of single sites (e.g., ASOR [25], Tapete et al. 2016 [23]), to initiatives similar to our own, which are trying to assess and collate data on disturbances and threats to archaeological sites across the entire MENA region, from Mauritania to Iran [5]. EAMENA is the only project, however, specifically taking an open-source approach using trained interpreters to record the whole region systematically. Whilst there are a number of different projects undertaking similar work we seek, where possible, to minimise any duplication or repetition of data collection. In an effort to avoid duplication, the dataset that was created through the French-British collaborative programme “Historic Environment Record for Syria” is currently being prepared for inclusion within the EAMENA database, while the project is working in collaboration with groups such as SHIRIN (Syrian Heritage in Danger) [36] and the ASOR Syrian Heritage Initiative to encourage the exchange and sharing of data when appropriate. However, the need to work closely with in-country heritage organisations, who may view archaeological inventories as a national resource, requires caution in a situation where digital data can be transferred onwards at the click of a mouse. Even in cases where specific sites or locations are repeatedly analysed by different projects, this work does not devalue the overall goals or success of our project; rather, it opens up opportunities for collaboration and enhancement of data in order to maximise the protection of these sites.
2. Materials and Methods
EAMENA’s interdisciplinary, remote-sensing driven methodology has been developed from techniques employed by previous archaeological projects in the MENA region; the Trans-Sahara Project e.g., [11], the Fragile Crescent Project e.g., [1,2], and APAAME e.g., [13,14] amongst others [37]. Our image interpretation methodology, which primarily relies on Google Earth and Bing maps, feeds directly into user-friendly and standardised data entry, ultimately facilitating on-going and future recording of archaeology across the whole MENA region. In addition, the EAMENA project also undertakes detailed assessment and analysis of damage using high-resolution satellite and aerial data for selected areas [5,38]. By doing this, we are able to attain a greater understanding of the main types of damage affecting archaeology and identify the kinds of modern activities that most threaten archaeological sites.
Recording across such an extensive region presents several challenges. A key issue is the need to develop an approach which is consistent. As we will discuss in more detail below, the ways in which different researchers and specialists interpret and record the archaeological record, and in particular interpret aerial/satellite imagery, vary. These difficulties are compounded by the fact that image-interpreters also have to take into account massive geological/environmental variations across the region, which can limit or enhance the visibility of archaeological features and disturbances. The terminologies used to describe archaeological sites also need to be standardised and to account for local variations (for example, the multiple uses of the term Qasr/Qsur for a range of mostly fortified sites) across the whole MENA region.
2.1. Datasets Used by EAMENA for Identifying Sites and Mapping Change
One key factor which helps to make our methodology replicable across different parts of the MENA region is our use of open-source data and software. We principally use imagery that is freely available via Google Earth and Bing maps. Importantly, these platforms are accessible in the majority of the MENA region countries, and offer a range of images representing different dates of acquisition. Recording features from a satellite image is subjective, with visibility dependent on both ground and atmospheric conditions at that particular moment in time [15]. EAMENA’s use of sources of data which offer a range of images increases the possibility of recording a site, even where ground survey data is lacking. This also allows for a process of validation to be undertaken where the initial data needs checking e.g., see [39]. The successful identification of many sites that were previously unknown (e.g., many cairn fields across the MENA region), was aided by the use of multiple images. For example, the use of imagery from different years or seasons meant that ground observation could take place under multiple types of crop-cover, or varied levels of soil moisture.
Given the inherent subjectivity of image-interpretation, EAMENA has developed methodologies to guide analysts through the decision-making process. Through comparison with existing digitised datasets, analysts are able to make interpretations about what the features observed via imagery might represent. Figure 2 and Figure 3 illustrate the typical decision-making process that an analyst will go through, and how they assess and interpret visible feature types.
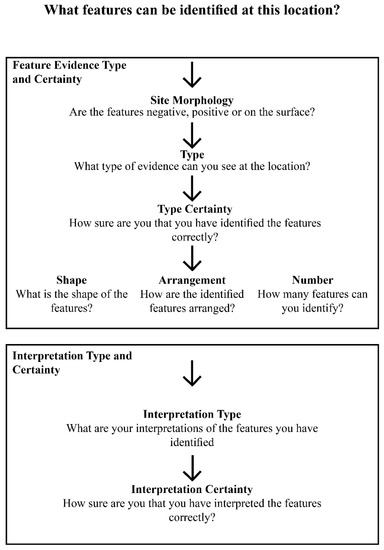
Figure 2.
Flow chart of decision making process-draft described above.
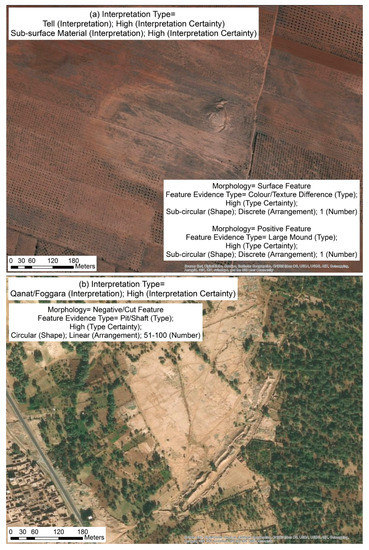
Figure 3.
The EAMENA Interpretation of sites and features, using example terminologies from our Evidence Type and Interpretation glossaries. (a) In this case the team have identified a tell site (Syria) and (b) a qanat/foggara system (Morocco).
Imagery is first examined systematically by trained analysts and recorded using a system based on geographic longitude and latitude and quarter-degree grid squares (each covering roughly 20 km × 30 km). Recording including drawing lines, points and polygons is done within Google Earth and using data which can be imported into GIS packages such as ArcMap and QGIS (e.g., orthorectified satellite images, data available as basemaps etc). Users record any potential features of archaeological interest recognised from these datasets by marking their location before setting up a database record. The parameters which describe the feature, including shape, arrangement, and morphology are then entered, as well as more complex interpretations dealing with form, function and date [38] (Figure 2).
One obvious weakness with the methodology described above is the limited time depth allowed by this approach; high resolution imagery available via Google Earth rarely pre-dates 2004, impacting our ability to interpret or identify sites disturbed or destroyed prior to this date. Coverage and availability of high resolution imagery via Google Earth and Bing can also vary across the region. Moreover, in some cases, sites are not visible in any kind of imagery, but have been recorded by published surveys. In other instances, sites have been completely destroyed and historical satellite imagery or field reports are the only remaining sources of information. As demonstrated by Cunliffe [22], damage to archaeology in the MENA region has been taking place over a long timescale. In order to understand when changes might have occurred (or may take place in the future), EAMENA, where possible and cost effective, also uses a range of other freely available and purchased satellite and aerial imagery (Table 1). This allows our mapping in some areas to extend back to the 1940s–1950s. For example, we use historical aerial images held in archives, such as that of the Society for Libyan Studies in Leicester and those freely available on the APAAME website [12]. Hard copies are scanned and georeferenced using appropriate camera models, so that they can be integrated into a GIS and directly compared with more recent imagery.

Table 1.
Image datasets used by EAMENA.
We also make use of declassified satellite imagery (KH7, KH4B) collected for surveillance purposes during the Cold War, which is a useful resource for mapping archaeological features in the condition they were in during the 1960s–1970s [40,41,42,43]. With accessibility and open access again in mind, the online Corona Atlas and Referencing System is an important resource [17]. Additional images can also be purchased at a relatively low cost from United States Geological Survey (USGS).
Higher resolution recent digital satellite imagery is particularly useful for more arid areas, where the outlines of many archaeological sites are still visible as standing structural features. EAMENA is using higher resolution imagery from sensors such as the WorldView satellites, the Pléiades constellation, and GeoEye to sample locations in North Africa and the Middle East. Georeferencing is straightforward using sensor models bundled with the imagery, and in some cases high resolution multispectral imagery can be obtained. The main limitation of these data is their high cost which prohibits extensive use of the original images for archaeological purposes (for example, as of 2017, WorldView-3 imagery cost $18 per km2). However, there is a growing body of material that can be viewed free of charge via Google Earth and used for simple image interpretation. Lower-resolution multi-spectral imagery such as Landsat can be used to map land-cover and land-use since the 1970s. For many locations, comparing all these different images allows changes to a site over a period of at least 50–70 years to be recorded and analysed (see below); the opportunities this offers for future heritage management and conservation should not be underestimated. When deciding whether to purchase new satellite imagery, an assessment of the cost effectiveness and also the potential added value has to be considered. The project does have a small budget to cover the purchase of new areas of satellite imagery, but where possible we aim to use as many freely available or low costs sources as possible. This means that our methods can be reproduced even where there are funding constraints.
Although automated detection of sites is not appropriate to our aims, at a coarser scale EAMENA is utilising semi-automated methods to explore the main threats posed by modern landuse [38]. Importantly these approaches need to be capable of mapping threats across large regions. A standard way of mapping landuse is by the semi-automated classification of multispectral satellite images.
As a starting point, the EAMENA project uses the multispectral properties of imagery including Landsat and Sentinel-2 to map land-use. To identify irrigated cultivation automatically, for example, we have used vegetation index algorithms applied to Landsat images covering a period from the 1970s to the present day. The images were obtained via Google Earth Engine or directly from USGS and GLCF (Global Land Cover Facility) and processed to represent Top-Of-Atmosphere Reflectance. The algorithms used were NDVI (Normalised Difference Vegetation Index) and SAVI (Soil Adjusted Vegetation Index). Based on the properties of vegetation in different spectral bands of the imagery these algorithms identify pixels in the Landsat images most likely to contain vegetation e.g., see [44]. In arid areas (much of our study area) these represent irrigated crops. By performing the SAVI algorithm for multiple images of the same location of different dates we can quantify and measure how the agricultural area has increased over time and identify when any areas of archaeological sites could have been damaged. We are also examining the impact of urban expansion on archaeological sites and have applied algorithms such as NDBI (Normalised Difference Built-up Index) and change analyses to measure modern settlement growth (see Section 3.1 below).
We applied these methods to several areas, including the oasis of al-Jufra in central Libya [38], collaborating with the Trans-Sahara project of Leicester University. The analysis of the cultivated area using the vegetation indices revealed that by 2017 it had expanded by c.9500 ha from an initial c.600 ha in 1975. Of around 90 archaeological sites recorded in al-Jufra, 47 had been damaged by modern agricultural activity. EAMENA is now developing a methodology using Google Earth Engine see [45] to apply these methods more widely across the MENA region in order to identify the most significant land-use impacts affecting each area.
2.2. Interpretation and Enhancement of Data and Record Creation
For its database [4] the project uses Arches, a freely available open source platform created by the Getty Conservation Institute and World Monuments Heritage Fund. Arches is a customisable platform and we have modified it for our specific project requirements. Data entry can be carried out either manually, or via bulk upload. Our analysts prepare data for batch-upload, or enter them directly into the EAMENA database. With either approach there are important control mechanisms (e.g., standard terminologies and glossaries using drop-down menus) that encourage analysts to check through their data in terms of consistency and accuracy. Once loaded into the database, records can then be further enhanced. Most of the fields in the database use standardised terminologies derived from drop-down menus, and free text fields are used only when absolutely necessary (e.g., for toponyms etc.). This ensures that data are consistent and comparable and thus searchable, even when the database is translated into other languages: it is possible to identify ‘equivalent’ terms in different languages on a one-to-one basis. Doing so has facilitated the translation of the database into Arabic, and the production of Arabic-language training and support materials.
All EAMENA staff and volunteers are trained image interpreters and there is continual discussion about the identification of both archaeological sites. As Casana [17] (pp. 226, 228, 230–231) highlights, large training samples, weeks of training and, where possible, a first-hand understanding of local settlement histories, archaeologies and environments are all important tools that an image interpreter will be required to use within their work.
In addition to identifying and interpreting archaeological sites, we have developed an approach to assessing damage and threats, both remotely and on the ground. Our analysts first make an assessment of the condition of the site, and the percentage area that has been affected by anything classed as a disturbance. It is important to differentiate between these two variables. A site submerged under the centre of a lake may be 91–100% disturbed (that is, totally covered by the lake), but it may still be classed as being in “Good” condition. Conversely, partially submerged sites located at the edge of a lake, may be recorded as 31–60% disturbed, yet due to their location, at the active edge of the lake, may be classified as in “Poor” overall condition.
Specific disturbance events are also identified via imagery and recorded in the database, including not only the cause of disturbance, but also any identifiable effects. For example, we may identify the cause of the disturbance as inundation, with the possible effects of this including erosion, compaction, waterlogging, as well as structural collapse. Using imagery of multiple dates we can record temporal information about when different disturbance events took place (Figure 4).
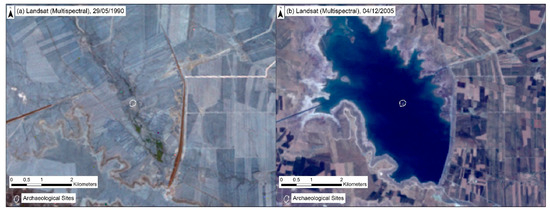
Figure 4.
Al-Hasakah, Syria. (a) The site of Tell Abu Hufur in 1990; (b) The site has since been inundated by the West Hasakah dam. However, due to droughts in the area in 2013, the waters receded and the site was again exposed, causing erosion to the deposits.
We also record any identifiable threats and indicate the likelihood of these threats being realised. For example, construction would be recorded as a probable threat for an archaeological site currently located on the edges of a modern town, as with several ancient cemeteries surrounding the Libyan site of Cyrene (record EAMENA-0116807). In contrast, if the nearest town or settlement is several kilometres away from a site, construction may not be considered an imminent threat. Identifying the causes and effects of specific types of disturbance based on remote sensing can be done rapidly, but it does have potential challenges and drawbacks. Causes and/or effects can be wrongly identified or attributed, and in some cases, depending on the resolution of the imagery, certain causes might not be identifiable at all (see case studies for further discussion).
Geospatial interpretations are not without uncertainties, and can be error-checked [1,46,47,48,49,50]. Our project has therefore integrated the concept of ‘certainty’, into its data-recording models. Using set terminologies (definite to negligible), analysts can indicate how confident they are that something is, for example, archaeological (this is most obviously an issue with potential sites that are identified from imagery alone, i.e., for which there is no confirmation through ground observation) (Figure 5), rather than natural or modern; or how precisely it is located in terms of geographical space and/or correctly interpreted in terms of archaeological categorisation. Certainties can be assigned to locations and extent. This is especially useful in the case of information recorded during field survey where paper maps used were imprecise, the data was collected before accurate GPS data could be gathered (i.e., before selective availability was turned off in 2000), or where the locations recorded are simply incorrect. Building the concept of ‘certainty’ into our data recording methodology provides an important tool for both researchers and heritage specialists alike, and in particular those who may work with, and seek to refine this information some way into the future. For example, for researchers certainty can also be a tool through which to test hypothetical data extrapolations [1] (pp. 1008–1009), while for heritage specialists certainties can be used as a way to prioritise management and intervention strategies. The various issues outlined above are important if the EAMENA database is to provide an initial basis for Historic Environment Records (HER), which should help national heritage agencies to record, manage and protect cultural heritage in the future.
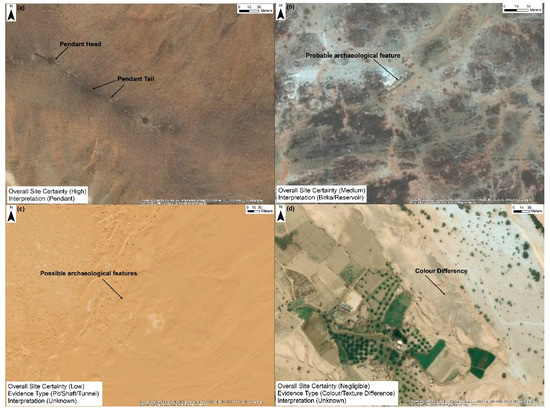
Figure 5.
Different examples of site types and archaeological certainty. All sites have been identified and classified from imagery as (a) a site where there is a high likelihood of the feature being archaeological; (b) a site where there is a medium likelihood of the feature being archaeological; (c) a site where there is a low likelihood of the feature being archaeological; (d) a site where there is a negligible likelihood of the feature being archaeological.
3. Results
As the number of trained and authorised users throughout the MENA region increases, the EAMENA database has the potential to be mined for the analysis of large-scale patterns by researchers and policy makers. The concept of “big data” is currently a fashionable topic in many sectors, facilitated by technological advances, and has already been applied to archaeological research [51]. The term “big data”, the origins of which are unclear, and its exact parameters hard to define, describes the huge collections of digital data created and stored by any particular organisation, which often transcend normal software and analysis methods, and which offer immense potential for research [52,53].
To date, our project has created detailed records for over 20,000 sites from a total of c.150,000 identified sites with partial records. Of the detailed records, over c.20% are previously known sites, documented from published surveys or excavations. A further c.65% are sites identified from satellite imagery and classed as having a medium or high certainty of being an archaeological ‘site’ or “feature”. The remaining c.15% are those with a low or negligible certainty of being archaeological. The database also contains over 50,000 records providing details about the sources (e.g., satellite imagery, aerial photographs or bibliographic sources) consulted by the project. This work is constantly developing, and the team is currently in the process of evaluating many thousands of potential new archaeological sites.
Table 2 presents initial results for a sample of the site interpretations in our glossary, showing that burial features, enclosures and settlements represent a significant proportion of sites. Unsurprisingly, in view of its primary reliance upon remote sensing methods, the project has recorded far fewer rock art sites or temporary camp sites, as these are predominantly not visible from satellite imagery. There are potential implications for the relative interpretability of different site types; for example, settlement sites represented by a collection of buildings are easy to identify and interpret from a satellite image; temporary camps and rock art sites, on the other hand, are less easy to distinguish, both on the ground and via imagery, and as a result are likely to be substantially under-represented in our data. Over time, as the number of records grows and we integrate more field and published data, our database should facilitate an improvement in the documentation, interpretation, and monitoring of site classes that were previously poorly understood.

Table 2.
Examples of resource interpretation types (including site types and features).
It is already possible to make interpretations about the impacts of particular disturbance types on cultural heritage. For example, our recording process shows that agricultural activity is one of the main causes of damage to archaeological sites across the region (Table 3). While no great surprise perhaps, it is important that decisions around heritage protection are made on the basis of hard evidence, rather than assumptions, or the publicity around infrequent, but high-profile, events. This includes ploughing and damage from levelling in newly-irrigated areas. Figure 6 shows sites damaged by agriculture superimposed over land-cover classes across the MENA region mapped from MODIS NDVI and VIIRS [54,55] derived using Google Earth Engine. Surviving sites in areas conducive to modern agriculture are at significant risk.

Table 3.
Examples of disturbance types.
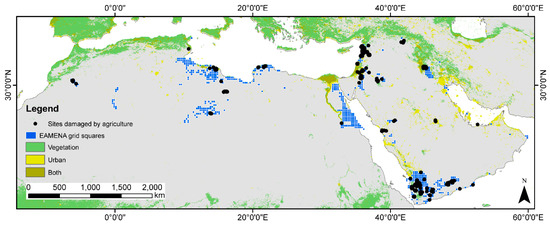
Figure 6.
Distribution of EAMENA records with damage caused by agriculture recorded and grid squares with records entered by EAMENA superimposed on land-cover derived from data obtained via Google Earth engine: vegetation (MODIS NDVI, [54]) and areas of human activity based on night-time radiance data (VIRS, [55]).
As our work progresses, we will need to remain critically aware of the implications for researchers of utilising such a large, standardised dataset [53]. Care must be taken to avoid misleading interpolations (e.g., see Fradley and Sheldrick’s [56] commentary on Parcak [57]). For example, statistical variations in site density will need to take into account differential preservation levels which depend on landscape contexts. Although recording every possible archaeological site is impossible, as the project continues to develop, we will have to ensure our data are representative of trends across different regions, landscapes and periods. Subjectivity, inherent in many processes of archaeological interpretation, also needs to be taken into account and mitigated against using standardised terminologies.
3.1. Case Study 1: Cyrene: The Impacts of Modern Development on a World Heritage Site and Its Immediate Hinterland
The site of Cyrene in Eastern Libya is a UNESCO (United Nations Educational, Scientific and Cultural Organization) World Heritage site (designation number 190). It faces significant problems arising from present-day activities including expansion of the adjacent town of Shahat and limited enforcement of planning regulations. While the gradual degradation of the archaeology has been an issue for many years, damage to archaeological features has accelerated because of the civil war of 2011 and the subsequent instability.
Cyrene’s monuments were first recorded by travellers in the 18th and 19th centuries [58], with more extensive archaeological investigations over the course of the 20th and 21st centuries e.g., [59,60,61,62,63,64,65]. Cyrene developed from a Greek colony in the 7th–4th centuries BC, with occupation continuing through the Roman and Byzantine periods [66]. Located beside the modern town of Shahat, Cyrene has a walled circuit although much of the ancient city is outside this area, including large suburban cemeteries (Table 4) and sanctuaries (Figure 7). The site lies on the edge of an escarpment, 8 km from the coast, and is surrounded by arable fields and modern farms. The urban core is fenced and protected, but the suburban zones are vulnerable to a variety of threats [67].

Table 4.
Cemeteries of Cyrene. Details from Cassels’ notebooks [68].
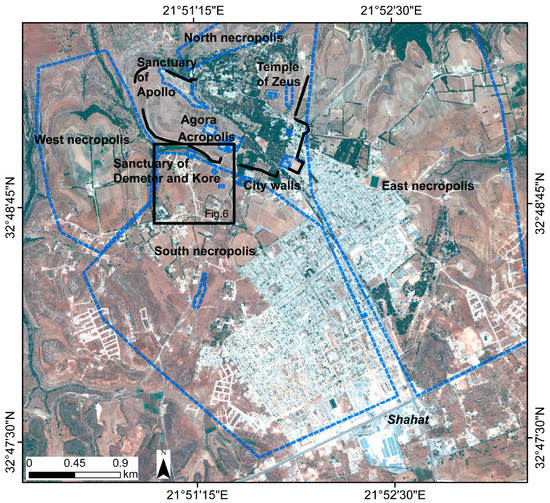
Figure 7.
Map of Cyrene showing areas with specific EAMENA records so far. GeoEye-1 image 5 July 2016 © DigitalGlobe, Inc. All Rights Reserved.
Despite current difficulties of access for foreign archaeologists, approaches that combine remote sensing and GIS survey undertaken by Libyan archaeologists have highlighted the severity of the threat (for example, [69]). Several recent projects concerned with heritage protection have examined the risks faced by Cyrene and worked to document it; their published reports have been cited in our database where applicable and instances of damage they describe logged. The Cyrenaica Archaeological Project has undertaken a holistic approach including recording and training [70]. They have noted specific instances of damage, for example caused by weathering and vegetation, also recorded in the EAMENA database. They worked collaboratively with the Department of Antiquities in Shahat to develop a sites and museums database. The Curious Travellers Project [24] is also gathering data to make 3D models of Cyrene using photogrammetric methods.
3.1.1. EAMENA’s Methodology for Recording Cyrene
EAMENA has created a detailed set of records describing the site of Cyrene, the nature of the damage and the risks that are affecting it. The site consists of one “parent” record and over 30 sub-records which represent individual structures/features which are part of the overall complex and surrounding features. To build each record, we have used multiple sets of data including aerial photographs and satellite imagery and published and unpublished reports from archaeologists. Details were recorded from these data including the form, morphology, location, interpretation and condition of these features; for example, whether they were of good or poor condition according to the latest information and to what extent they had been impacted on by modern landuse.
A historical analysis of images (Table 5) of Cyrene and its immediate hinterland highlights the impacts that development related expansion has had on archaeology, and the value of examining this over a long period of time (1949–2016). We can map the site and its immediate hinterland in detail using aerial photographs collected by Hunting Surveys dating to 1949 [65]. A KH7 satellite image from 1967 allows further mapping. 39 images on Google Earth dating from 2006–2017 allowed detailed identification of the archaeological features and modern changes. A GeoEye-1 image from 2016 has allowed mapping and spectral analysis. Changes in the size of Shahat over time were made using Landsat images (1986 and 2000) and a Sentinel-2 image (Figure 8). This broad dataset highlights EAMENA’s use of a range of sources to populate our database. Some features were detectable in data such as the satellite imagery, but others could only be recorded using the published data. Using both these types of information in conjunction allowed details of instances of damage to be established.

Table 5.
Datasets used for recording Cyrene.
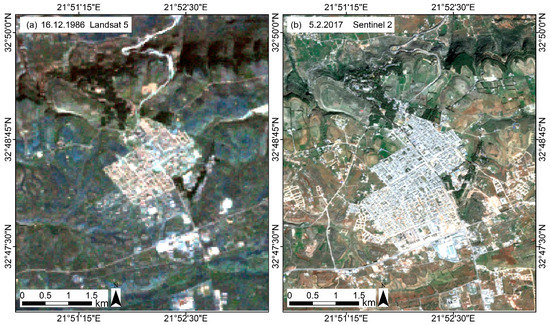
Figure 8.
Shahat has expanded significantly in size since 1986. (a) A landsat 5 TM image (USGS) 16 December 1986; (b) A Sentinel-2 image (ESA), 5 February 2017.
While many features are visible in the high-resolution satellite images and aerial photographs, there are features which cannot be easily recorded in this way. These include tombs of several different types and morphologies, including rock-cut structures and sarcophagi. Some are located on the slopes of the escarpment and side of wadis, making them particularly invisible to remote sensing methods. There are also specific instances of damage that cannot be identified remotely. This highlights the necessity for EAMENA to use a variety of datasets, where possible backed up by field work. In this case, several sources of published information deriving from surveys, excavations, guides and archival research have been consulted [65] and we have worked closely with a Libyan PhD student at the University of Leicester, Mohamed Omar, who is studying Cyrene’s suburbs.
3.1.2. Antiquity to Mid-20th Century AD
Evidence for events which damaged Cyrene prior to the 20th century comes from excavations and historical texts rather than from satellite imagery. Damage to structures in the Mediterranean region were caused in antiquity by earthquakes in the mid-third century AD and in AD 365 [71,72]. These are mentioned in historical sources and confirmed by archaeological and geological evidence [62]. Archaeological excavations, ongoing since the 19th/early 20th century, have disturbed components of the site and have been logged in the EAMENA database as events which may have affected the site’s preservation. Restoration and landscaping efforts undertaken during this era have also had a deleterious impact on Cyrene, including tree planting to the north and east of the acropolis during the Italian colonial period [66] (p. 148). The potential effects of vegetation on archaeological features have been noted in our database.
3.1.3. Mid-20th–21st Century AD
In addition to other sources, aerial and satellite images can be used to record changes from the first half of the 20th century. The 1949 aerial photographs show that the ancient city and its suburbs were relatively undisturbed by construction and development work at that time, and that Shahat was a small village. It had originally been located on the northern part of the ancient town, but on the advice of the archaeologist Goodchild, its focus was shifted to the south-east, outside the walls [66]. The KH7 image (1967) shows that Shahat had started to expand in its new location by the late 1960s, but the cemeteries and other suburban features still appear to have been relatively unaffected by construction-related work. Since then, however, this area has been particularly at risk, and tomb robbing and vandalism has been recorded by archaeologists from the 1960s onwards [65]. By the 1980s the expansion of Shahat had destroyed most of the Southern Necropolis [66] (p. 151), [68]. That this process is continuing is clearly documented on satellite imagery and confirmed by Libyan archaeologists [69,73]. The recent developments include construction of houses, farms and infrastructure, with evident impacts on structures outside the ancient city walls, especially the cemeteries and the sanctuary of Demeter. Some ancient structures have been bulldozed or otherwise damaged to make way for new constructions, whilst others have been exploited for building materials [69].
The expansion of the present-day town is very apparent on imagery dating from 2006 onwards. Modern roads and farms have encroached on the area of the southern and eastern cemeteries in particular. Structural robbing for building materials is part of this unregulated expansion and is recorded in our database as a source of damage and future risk. Published and unpublished records and reports have also highlighted other issues which affected the site during this period, such as pollution by sewage and rubbish dumping, which are less visible on satellite imagery [69].
3.1.4. Recent Changes
Activities affecting the preservation of Cyrene and its immediate hinterland have accelerated even further over the past five years following the recent conflict, which has seen much illegal and unregulated construction work in Libya [38,67]. The satellite images indicate a further massive increase in the extent of Shahat, for example, demonstrated by a Landsat 5 image (1986) and a Sentinel 2 image (2017) (Figure 8).
Unsupervised classifications of Landsat and Sentinel-2 images were calculated using ERDAS (Figure 9). Other than a detection of part of the archaeological area on the acropolis, they have picked out pixels representing modern urban activity. These show how the urban area has grown between 1986–2017. The impact of this development was recorded for the sites in our database affected by it. The core area of the town has expanded slightly, especially towards the south-west; however, more dispersed structures and associated infrastructure has spread in all directions, directly threatening the archaeological features in these areas. In the southern necropolis, in particular, there are new farms, buildings and roads. Al-Raeid et al. [69] (pp. 8–9) reported robbing of ancient structures for building materials in this area and the looting and vandalism of tombs. They also noted the effects of continued lack of conservation on these structures. The pattern is similar in the other suburban areas. The impact of processes less identifiable from satellite imagery, including damage caused by vandalism, and water pollution, have also been noted by other sources and are listed by the World Heritage Committee in its most recent documentation [74].
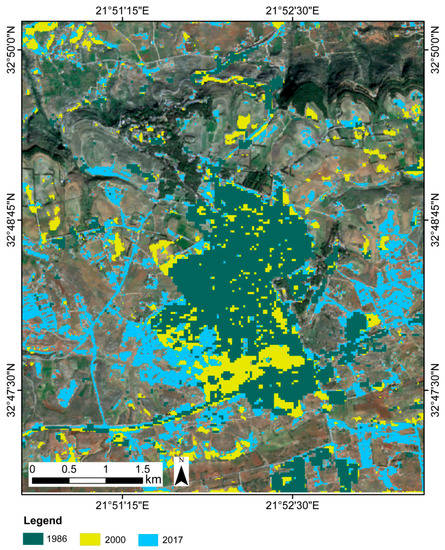
Figure 9.
Unsupervised classifications (represented in 3 colours) highlighting the urban areas around Cyrene produced from a Landsat 5 image (1986), a Landsat 7 image (2000), and a Sentinel-2 image (2017). The background is the Sentinel-2 image (2017).
3.1.5. Damage Statistics
The systematic recording by EAMENA of the causes of damage and potential threats allows these problems to be measured. Table 6 presents the results from 38 site records, which were created from interpretation of aerial and satellite images, information from published reports and guides, and from discussions with our Libyan colleagues. It is worth noting that although counted only once here, some of these sites represent large areas containing multiple archaeological features. Table 7 records the proportion of sites recorded as being destroyed, damaged, or of unknown condition.

Table 6.
Disturbance types logged at Cyrene.

Table 7.
Condition state of sites logged at Cyrene.
Archaeological excavations since the 19th–20th centuries have affected at least 24 sites. However, one of the most significant causes of damage to archaeology at Cyrene is modern development which comprises construction of buildings and related infrastructure/transport and utilities (24 sites affected by these categories so far—63% of the records). While the area inside the walls, including the acropolis, the main urban area and the sanctuary of Apollo, is protected from this type of damage, the features outside this zone including the cemeteries are being encroached upon by modern constructions including roads, tracks, farms and houses (Figure 10). This problem has been mapped and recorded across the wider area of Cyrene and Shahat using satellite images showing expansion since the 1960s (e.g., see Figure 8 and Figure 9).
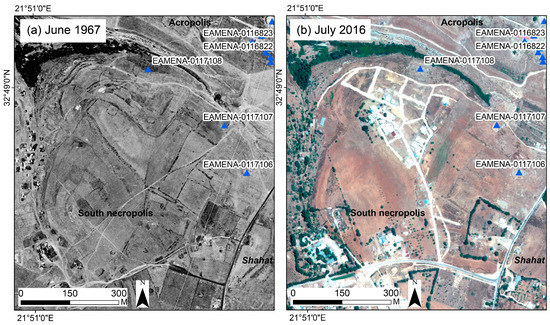
Figure 10.
Comparison of (a) KH7 (7 June 1967) and (b) GeoEye-1 (5 July 2016) images showing damage to the area to the west of Shahat and immediately to the south of Cyrene. GeoEye-1 image 5 July 2016 © DigitalGlobe, Inc. All Rights Reserved.
Although difficult to identify using imagery alone, structural robbing of tombs, as well as deliberate vandalism has affected many sites. Several have been recorded as having been looted (at least seven); a figure that may rise when individual tombs can be logged.
Agricultural activity has also affected the areas surrounding the site. The hippodrome (EAMENA-0116827) has been damaged by long-term agricultural activity including planting and ploughing. Since the recent conflict, the inability to enforce regulations has led to clearing of remains to make way for new fields [67] (p. 156). The category ‘natural’ is also a significant cause of damage (13 sites so far). This comprises recent issues such as tree growth but also known instances of damage caused by earthquakes in antiquity.
The condition of the sites was recorded using EAMENA terminologies and was assessed using the analysis of the satellite imagery and classifications and the reports of recent visitors. 23 (65%) of the sites could be described as “Good” to “Fair” (Table 7), especially sites nominally protected by their location on the acropolis ridge. This means that they can be regarded as being reasonably stable. However sites surrounding the acropolis were less well preserved with signs of severe structural instability/missing and deteriorating features and were suffering from the consequences of ongoing activity such as structural robbing. In some cases it was not possible to identify the current condition of sites other than noting that they were likely to have been impacted by disturbances.
As described above, EAMENA also records potential threats and risks (Table 8) which could affect archaeological sites in the future. These are recorded based on problems currently affecting sites and analysis of continuing issues in the vicinity. The urban growth identified using the multispectral satellite images (Figure 8 and Figure 9) is an urgent issue. For example, the westward expansion of Shahat is likely to cause further damage to archaeological features in that area, including the tombs of the southern and western cemeteries. Larger features in that zone, including the Sanctuary of Demeter (EAMENA-0117108), are at high risk, for example from structural robbing or even demolition.

Table 8.
Potential threats which may affect Cyrene in the future.
Cyrene achieved World Heritage Site status in 1982. The World Heritage Committee has recognised the ongoing threats to the site and have proposed satellite monitoring, field recording, additional security measures and identification of the boundaries of the designated site [74]. However, World Heritage status has not provided tangible protection to Cyrene. Since 2011, often at considerable personal risk, Libyan archaeologists and local people have worked to protect archaeological sites and museums at Cyrene, but so far it has not been possible to enact a solution to the problems [67] (pp. 155–156). Overall, our analysis of multiple datasets shows that while development in the vicinity of Cyrene has been taking place since the 1960s at least, it is now occurring at an especially rapid rate, one that directly threatens surviving features in the hinterland of the site including rock-cut tombs. Archaeological sites close to urban areas should therefore be monitored and recorded as a priority and regular classifications of multispectral imagery performed to track Shahat’s growth.
3.2. Case Study 2: Homs Cairns: The Benefits and Challenges of Monitoring Stone Monuments via Remote Sensing
From 2007–2010 a fieldwork project undertaken by one of the current authors mapped and analysed 525 potential burial cairns to the north-west of the modern city of Homs (Syria). This project was undertaken within the framework of the Syrian-British landscape project Settlement and Landscape Development in the Homs Region, and the field data was recorded within its GIS framework. Published overviews of the archaeology of the Homs basalt region in Graeco-Roman [75] and earlier periods [76] contextualise the various monuments in relation to settlement activity and the wider landscape; readers should consult these for further information. Cairns are visible on the ground as piles of stone (Figure 11), and vary considerably in terms of size, structure and form. A well-documented form of monument found throughout the Levant and North Africa, they are also visible via satellite imagery, and can be distinguished as small circular or oval features, in many cases associated with enclosures and other archaeological traces. Additional research as part of a PhD thesis [77,78] identified a further 169,000 potential cairns from an area of c.21,000 km2 (Figure 12) using remotely sensed data spanning the late 1960s to the early 2000s (Corona KH4-B, KH7, historic aerial photographs, Ikonos (panchromatic and multi-spectral). The majority of these (over 90%) were found in association with the local basalt flows to the north and south-west of the modern city of Homs [77,78], whilst a much smaller percentage was found in association with lacustrine marls, limestones, clays and sands.
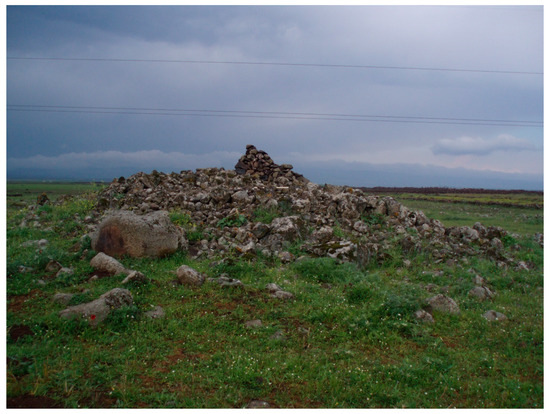
Figure 11.
Image of cairn surveyed in the field in spring 2007. The cairn has a modern shelter constructed on top of it, and areas of structural collapse are visible in the image.
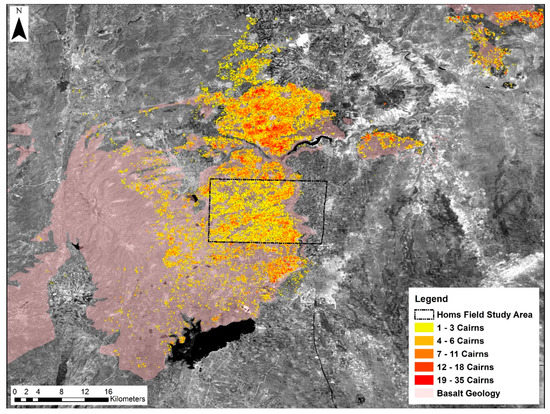
Figure 12.
Distribution of cairns identified from remote sensing. Most are found in areas of basalt geology. The area surveyed in the field is indicated by a black rectangle. Cairns are plotted against panchromatic Landsat 7 mosaic (10 April 2005 and 26 June 2007).
Details recorded during the fieldwork included the form, morphology, location and interpretation of these features. These were all collated in a project database, alongside basic information about levels of preservation. For example, a rough measure of “percentage intactness” was recorded for each cairn surveyed in the field (less than 50% intact; more than 50% intact; 100% intact), and notes were made about the potential causes and effects of any identifiable disturbances. A preliminary assessment of recent, pre-conflict, land-use practices (Figure 13), carried out in 2010 using Ikonos panchromatic imagery (from 2002), indicated that over 60% of the archaeological features, including cairns, enclosures and other features, identified from the Corona satellite imagery have been either partly or totally destroyed by clearance or ‘de-rocking’ operations using heavy machinery, often bulldozers, noted in the field by the authors during fieldwork, with the intention of increasing the cultivable area [79]. The irony is that a practice that was originally supported by development organisations to increase agricultural productivity has been widely adopted at a local level, often on a ‘freelance’ basis and with little technical or administrative oversight, and now poses a serious risk to the preservation of cultural heritage. Assessments carried out using this imagery, however, also indicated that areas of the study region were still being used for grazing activities and had, as yet, not been cleared or bulldozed.
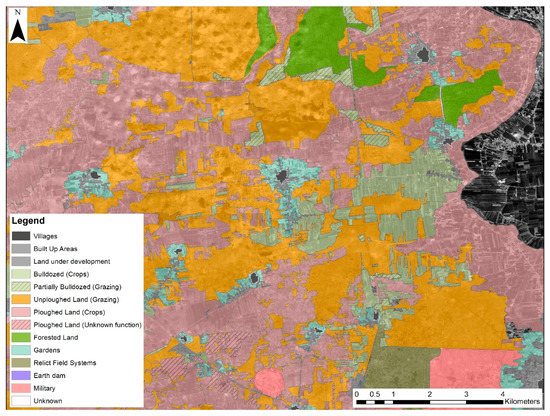
Figure 13.
Modern landuse practices based on an assessment of Ikonos panchromatic imagery, acquired 2 March 2002.
In 2016 these field records (525 in total) were loaded into the EAMENA database, and updated using the EAMENA methodology. Preliminary disturbance and threat assessments were also recorded for a sample (6975) of the 169,000 potential cairns, identified from satellite imagery, bringing the total recorded from this area in the EAMENA database up to 7000.
In the case of the surveyed cairns, disturbance assessments were generated from the field survey records, which recorded landuse and landcover at the time of data collection. This information was then double checked against the most up to date imagery in Google Earth (2014–2016). For those cairns not visited in the field, a remote characterisation assessment was made, by assessing groups of cairns in relation to their association with different types of landuse.
As the original 2010 study had indicated, this work demonstrated that whilst 59% of potential cairns showed “No Visible/Known” disturbance causes (Figure 14), nearly 40% were affected by bulldozing or clearance activities (Figure 15). Clearance destroys even substantial surface and sub-surface archaeological features, and creates a “cleared” field, bordered by newly constructed field walls composed of huge basalt boulders, which can easily be identified from satellite imagery. In total 2683 (38%) of digitised cairns were recorded as “Destroyed”, while 4159 (59%) were recorded as being in ‘Good’ condition.
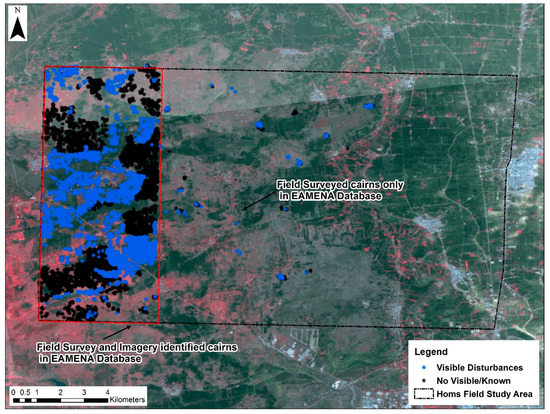
Figure 14.
Distribution of disturbed cairns across the study area. Cairns are plotted against a multispectral Landsat 7 image (14 January 2000) processed in Erdas to show landcover. The area marked in red represents the area of cairns identified from satellite imagery, and not visited in the field, which have currently been assessed and recorded in the EAMENA database. Data entry for the cairns identified to the east of this sample area is currently on-going.
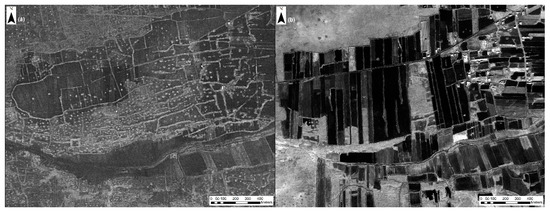
Figure 15.
Comparison between Corona KH4-B (17 December 1969) and Panchromatic Ikonos (2 March 2002) showing the changes, and areas of de-rocking and areas that remain ‘un-cleared’.
This preliminary and basic assessment has a number of limitations. For example, whilst some cairns identified during ground survey were recorded as being in either a “Fair” or “Poor” condition, the resolution of the imagery means that, more often only two basic condition states can be identified in remote sensing analysis: “Destroyed” or “Good”. Using this “broad brush” approach also limits the range of disturbance causes and effects that can be identified. In particular, clearance activities appear as a major disturbance factor. Moreover, the size of the features (generally between 2 m–20 m in diameter), means that the different types of disturbance causes which can be identified from satellite imagery alone are limited. As a result, the number of features affected by other disturbance causes, such as looting, construction and dumping is probably a significant under-estimate.
For example, out of the 104 cairns which were recorded in field survey as having identified disturbance causes, over 70% were affected by recent construction activities, such as the erection of small hides or shelters or modern dumping of cleared material or rubbish. A much lower percentage (c.17%) were recorded as having been disturbed by illicit excavations, whether recently or in antiquity, although dumping might have concealed earlier looting activity. Based on the field notes, just under 8% of recorded cairns were associated with a disturbance cause of clearance/bulldozing activities. This low figure is due to a number of factors; firstly, as one of the field survey’s main aims was to understand the morphology, chronology and location of these features, the research specifically targeted cairns in areas where they were better preserved, based on 2002 imagery. Thus, while c.8% of cairns were categorised as damaged by clearance or bulldozing activities in the intervening five-eight years, based on satellite imagery analysis, this number probably significantly underestimates the overall impact of this disturbance cause at the regional level. It is also apparent that a number of disturbance causes and effects identified by the field survey cannot be identified from satellite imagery alone. By way of example, EAMENA-0059581 was recorded in 2006 as a fully intact, large cairn. The survey returned to the same location in 2007 to find that the feature in question had been illicitly excavated and was most likely not a cairn, but instead a mausoleum dating to the Roman period. The excavation exposed the internal structure of the monument and material, mostly consisting of pottery sherds, was strewn across the area, but no evidence of this disturbance is visible via Google Earth (Figure 16).
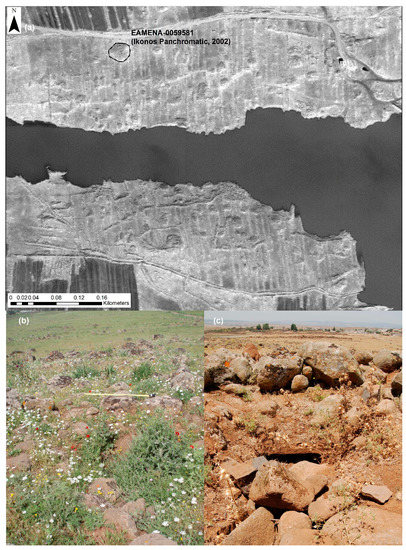
Figure 16.
EAMENA-0059581 ((a) Panchromatic Ikonos 2 March 2002; (b) 2007; (c) 2008).
Despite these limitations, recent remote sensing analysis allows us to identify broad-scale changes and while the ongoing conflict has rendered these features inaccessible on the ground, we have taken our analysis further. Using imagery from Google Earth, we have been able to revise overall condition assessments for the original surveyed cairns. Out of a total of 525 field-recorded cairns, 127 (24%), required an updated re-assessment, whilst the remaining 398 (76%) showed no significant changes over the seven years since the original study was completed. Unfortunately, the majority of cases involved updates to the disturbance extent and overall condition state. Most required a re-classification of the overall state from “Good”, “Fair” or “Poor” to “Destroyed”.
Overall, based on these re-analyses, the percentage of cairns listed as ‘91–100% disturbed’ increased to 66% of the sample, with the number of cairns with an ‘Unknown’ or ‘1–10% disturbance’ extent also increasing (Table 9). This reveals fairly significant changes, with the total number of cairns recorded as showing “91–100% disturbance” increasing from 0 to 85 (16%). Due to the poor resolution of some of the latest available imagery in Google Earth, the number of cairns for which assessment was not possible (e.g., disturbance extent or condition recorded as ‘Unknown’) also increased.

Table 9.
Disturbance Extent (%) based on field survey and remote assessment. The category ‘No Visible/Known’ includes sites where it was possible to make a disturbance assessment, but no disturbances were visible. ‘Unknown’ indicates sites were it was not possible to make a disturbance assessment due to lack of data, cloud cover and/or poor imagery resolution.
The pattern for the overall condition state is very similar (Table 10), with the total number of cairns identified as being in ‘Good’ condition decreasing from 368 (70%) to 272 (52%) of surveyed cairns. Conversely, the number of ‘Destroyed’ cairns has increased from 0 (0%) to 84 (16%) during this period.

Table 10.
Overall Condition State based on field survey and remote assessment.
This updated analysis also allowed us to confirm, and quantify, a number of disturbance causes which were not originally recorded in the field, although were noted as possibilities. These included evidence for flooding, a disturbance cause that was identifiable through the use of multi-temporal imagery which showed that a number of cairn clusters found in the vicinity of seasonal lakes were likely to have been affected by flooding.
Despite the limitations of using satellite imagery to record and monitor disturbances such as the illicit excavation of stone monuments, this case study illustrates the benefits of using EAMENA’s simple remote sensing techniques to continue to monitor monuments and update records in currently inaccessible areas. As the most recent imagery available for this area in Google Earth dates to 2015/2016, it is likely that the disturbance patterns identified here have continued since then.
3.3. Remote Sensing and Field Survey
Field-based validation for many archaeological features in the database may be possible in the long term: the EAMENA database is being made available to individuals and institutions with responsibilities for cultural heritage throughout the MENA region. Its uptake is being facilitated by dedicated training courses and collaborative working. As with any monuments record, database entries can be revisited and updated in the future as necessary.
Over a more immediate timescale, however, we need to ensure that our image interpretation methodology is producing viable data which will help, rather than hinder, the protection efforts of archaeologists in the MENA countries. Ultimately, each filled-in record needs to be a starting point for future detailed recording of site location, ideas and interpretation, and the identification of potential threats. As a cross-check on our methodology we are systematically comparing field-based and remote-based interpretation for select samples of sites. EAMENA is actively collaborating with several projects conducting field survey, for example the Middle Draa Project [80] and Koubba Coastal Survey [81]. Ground survey allows further details about many sites to be added to the database. However, most significantly, it allows us to assess the accuracy of EAMENA’s remote-sensing methodology of standardised interpretations and terminologies.
Validation of remote sensing methods by comparing results to interpretations made on the ground is a well-accepted process in the wider field, and there are established statistical and descriptive methods in remote sensing for assessing the accuracy of data such as image classifications [82,83]. Accuracy assessments need clear plans, an unbiased and consistent sampling procedure, and a process of analysing the data. “Classes” assigned to the site from both ground collected data (fieldwork) and image interpretation can be compared, for example by using an error matrix [82] (p. 3) [83]. Although adopted by some projects [34], the process of quantifying the accuracy of image interpretation and remote-sensing has not been widely used by archaeologists, and can be challenging when dealing with multiple levels of image interpretation. In many cases, some archaeological information simply cannot be known without field-based investigation.
While it is beyond the scope of this article to discuss this at length, we outline our field-based validation strategy here. The data comparison below was made by getting an analyst not familiar with the areas concerned, but trained in the EAMENA methods, to identify sites and damage threats in two sample areas for which we have ground data in Morocco and Lebanon. We compared the site records made separately using Google Earth images with interpretations made on the ground, using a simple table to reflect key terminology from our database. We counted the number of sites which matched, had a full or partial match, or did not match. The concordance between the numbers identified using each method is then established (Table 11).

Table 11.
Concordance of interpretations table N = 50 sites surveyed with EAMENA methodology.
The results of this exercise are presented in Table 11. This shows the number of exact matches between image and ground interpretations and, given the difficulties of making detailed interpretations from imagery alone, we also counted correlated matches, including instances where the image interpreter simply made a broader interpretation (e.g., “building”) than the field-based interpreter (e.g., “house”). The morphology, form and functional interpretation of a site were often easy to identify using imagery. While we were often correct in recognising that a site had been damaged in some way, it was much more challenging to identify the type of damage which had affected it.
A key factor to note is that the EAMENA site terminology extends beyond what may be visible on satellite imagery, as it incorporates categories that derive from ground survey, but are meaningful in an archaeological sense. By the same token, analysts are trained not only in the EAMENA methodologies, but also in the regional archaeological typologies and dating frameworks, which are generally derived from a long history of ground based investigation of sites. In our blind tests, we required an analyst with expertise in the field archaeology of Lebanon but unfamiliar with Morocco to look at that area and one with experience in Morocco to look at the Lebanese data. This probably accounts, in-part, for the lack of exact matches and emphasises the importance of local knowledge, and so highlights some of the significant challenges faced by crowd mapping and automated methods.
As we increase the number of samples used for this validation process, we will be able to refine our methodology based on these results and so identify error thresholds appropriate for application to assessments of archaeological remote recording. Remote classification of modern land-use, for example, can be relatively straightforward and its accuracy easily assessed. Given that many archaeological sites cannot be fully interpreted without ground-based work, especially excavation, EAMENA will seek to establish a more nuanced methodology that is attuned to assessing accuracy of archaeological interpretations. Whilst the details of this are beyond the scope of the current paper, the project is developing its field and imagery validation methods via further blind tests. We will explore the different factors affecting our ability to accurately identify and categorise site types, disturbances and threats, and determine whether our methodology needs to be adapted or refined as a result of this. As archaeological work is likely to rely increasingly upon remote sensing for making interpretations, robust assessment of accuracy is necessary, especially for the large-scale data collection undertaken by our project.
4. Discussion
We have outlined and evaluated three main methods of large-scale heritage recording projects: crowd-mapping; automated detection; and our own methodology which relies on trained image interpreters and the incorporation of a variety of data. These represent different approaches for mapping large regions. There are elements of uncertainty deriving from any of these approaches, because of the need to make decisions about the nature of archaeological features, often remotely. Our comparison of a sample of ground- and image-based interpretations shows that even for trained analysts recording archaeological sites and their condition using imagery can be difficult. Knowledge of local archaeological specifics is clearly as important as technical skills. Dealing with uncertainty is a significant issue for our project because it is inherent in geospatial recording as well as in making archaeological interpretations. Uncertainty arises as a result of missing information, user mistakes, and incorrect information and interpretation. We not only need to recognise features in imagery, taking into account image properties, the sensor’s characteristics [84] and seasonal conditions [15] (p. 167), but we need to make decisions about their function in the past. Ultimately, the EAMENA project has developed a standardised and user-friendly way of quantifying levels of thematic certainty in order to avoid presenting misleading information and to allow users of the data to decide how to interpret it. It is necessary to differentiate between interpretations that have been made using a variety of reliable sources, including data gathered in the field, and our recording of features with an unknown function that have been logged only from a single satellite image. In some cases, information simply cannot be known [48].
It is also important to recognise potential limitations of EAMENA’s remote-sensing based recording methods. Remote sensing is not always the most appropriate method for identifying archaeological sites. Even the application of labour intensive remote-sensing visual analysis or ‘brute force’ methods as Casana [17] (p. 231) has termed them is in some regions simply not the best option for large-scale site detection and monitoring. For example, trials carried out by the EAMENA team using their methodology in Kuwait revealed that large numbers of ‘known’ archaeological sites could not be identified via imagery, even when given precise locations for these sites. This is, in part, a result of the limited resolution of imagery available in Google Earth across this area; however, other factors also play a role.
As discussed above, certain types of archaeological sites are simply less readily visible in imagery than others, which could lead to under-recording. Such sites include lithic and pottery scatters and shell middens; the latter being a characteristic site type from Kuwait’s coastal environs. As scholars have also clearly demonstrated, the application of remote-sensing techniques in regions with, for example, active sand dunes is also particularly challenging [34,85]. In these cases, remote sensing can aid in pointing towards likely locations for archaeological sites, but cannot necessarily be directly utilised in their detection, mapping and interpretation, without field visits having taken place.
Freely available imagery such as Google Earth has limited potential for spectral analysis, with images being displayed in “true colour” [86]. However, it is clear that, for now at least, the benefits of using freely available satellite imagery in Google Earth and Bing Maps outweigh the negatives. By and large the use of open source software and data allows us to meet our aim of conducting at least a preliminary analysis for most countries in the MENA region. It also ensures that training in our methodology can be carried out at a regional and pan-regional scale. Training and use of the methodology can also be sustained without the continual need for investment by each country or heritage agency in expensive software.
Among the alternatives to our methodology, we believe the scale of the MENA region and diversity of its heritage make automation and crowd mapping approaches quite problematic. We emphasise the importance of analysts working on regional Historic Environment Records to have both a high level of technical skills and relevant knowledge of the regional archaeological record. This requires in-depth and sustainable training initiatives. We are not implying that there is no place for crowd-mapping (for example see [26]) and automated recording within projects using remote sensing. However, we do offer a note of caution, pointing towards the necessity of the rigorous evaluation of any data collected and the need for interpreters familiar with the archaeology of the region they are working in. As the use of remote sensing for site monitoring moves into the mainstream of heritage management, there is also a clear need to develop methods and models for the consistent and comparable recording of damage and disturbances to archaeological sites within specific countries, but also at a wider regional scale.
5. Conclusions
The case studies and results discussed above show that it is possible to apply a standardised recording methodology to the archaeology across the MENA region. Our analyses have revealed that the future shape of the heritage base (i.e., what will remain in existence two decades hence) will be determined less by the spectacular incidents perpetrated by terror groups, than by the widespread and continuing attrition that results from poorly controlled development-related activities, in particular agricultural intensification and urban expansion. These problems have been exacerbated by the reduction in both the monitoring of heritage sites and regulatory enforcement by governmental organisations, and the increased opportunities for land grabbing and unauthorised development that result from recent conflicts. Our database and methodologies, if adopted in MENA countries, will provide heritage agencies there with tools that will enhance both their monitoring and management of heritage assets.
It will not be possible to map everything, but by the end of the current phase of the project in 2020 we hope to have fully enhanced database records completed for a sample of grid squares in each of the countries we are working in. We are also actively seeking and making contact with researchers who are willing to contribute data from their own work and research into the database. Importantly, this work is not just going to be carried out by researchers in the UK and Europe. Data entry will be supported and enhanced by a programme of training courses, with each trainee contributing to and adding new sites to the database (e.g., see [6]). Training is fundamental, not only in terms of image interpretation, but also in terms of data recording and terminologies. In addition, using fieldwork to validate remote recording methods is crucial to increasing the accuracy of the process of assigning interpretation.
Supplementary Materials
The EAMENA database of archaeological sites is available online at http://eamenadatabase.arch.ox.ac.uk/.
Acknowledgments
The EAMENA project is a collaboration between the Universities of Oxford, Leicester, and Durham, under the leadership of Robert Bewley (Project Director, Oxford), Professor Andrew Wilson (Principal Investigator, Oxford), David Mattingly (Co-Investigator, Leicester), and Graham Philip (Co-Investigator, Durham). EAMENA is funded by the Arcadia Fund for documentation, database development and fieldwork, as well as the DCMS/British Council’s Cultural Protection Fund (2017–2020) to train heritage professionals from seven countries in the EAMENA methodology. We would like to thank all the members of the EAMENA team for their work and contributions, especially Martin Sterry for his advice and Michael Fradley for the inspiration provided by his blog post (http://eamena.arch.ox.ac.uk/the-difficulty-of-verifying-heritage-damage-reports/). We are grateful to all those who commented on drafts of this paper; any errors remain our own.
Author Contributions
The data for the Cyrene case study was analysed and described by Louise Rayne. The Homs case study data was analysed and described by Jennie Bradbury. The fieldwork validation experiment was designed, analysed and described by Louise Rayne and Jennie Bradbury. The paper was written collaboratively between all six authors. The authors declare no conflict of interest. The founding sponsors had no role in the design of the study; in the collection, analyses, or interpretation of data; in the writing of the manuscript, and in the decision to publish the results.
Conflicts of Interest
The authors declare no conflict of interest.
References
- Lawrence, D.; Philip, G.; Wilkinson, K.; Buylasert, J.P.; Murray, A.S.; Thompson, W.; Wilkinson, T.J. Regional Power and Local Ecologies: Accumulated Population Trends and Human Impacts in the Northern Fertile Crescent. Quat. Int. 2017, 437 Pt B, 60–81. [Google Scholar] [CrossRef]
- Wilkinson, T.J.; Philip, G.; Bradbury, J.; Dunford, R.; Donoghue, D.; Galiatsatos, N.; Lawrence, D.; Ricci, A.; Smith, S. Contextualizing Early Urbanization: Settlement Cores, Early States and Agro-Pastoral Strategies in the Fertile Crecent during the Fourth and Third Millennia BC. J. World Prehist. 2014, 27, 43–109. [Google Scholar] [CrossRef]
- Hritz, C. Contributions of GIS and Satellite-based Remote Sensing to Landscape Archaeology in the Middle East. J. Archaeol. Res. 2014. [Google Scholar] [CrossRef]
- EAMENA. Available online: www.eamena.org (accessed on 22 July 2017).
- Bewley, R.; Wilson, A.; Kennedy, D.; Mattingly, D.; Banks, R.; Bishop, M.; Bradbury, J.; Cunliffe, E.; Fradley, M.; Jennings, R.; et al. Endangered archaeology in the Middle East and North Africa: Introducing the EAMENA project. In Proceedings of the 43rd Annual Conference on Computer Applications and Quantitative Methods in Archaeology, Siena, Italy, 30 March–3 April 2015; Campana, S., Scopigno, R., Carpentiero, G., Cirillo, M., Eds.; Archaeopress Publishing Ltd.: Oxford, UK, 2016; pp. 919–933. [Google Scholar]
- Nikolaus, J.; Mugnai, N.; Rayne, L.; Zerbini, A.; Mattingly, D.; Walker, S.; Abdrbba, M.; Alhaddad, M.; Buzaian, A.; Emrage, A. Training, partnerships, and new methodologies for protecting Libya’s cultural heritage. In Atti del “Red Castle and Museum of Tripolitania" Workshop, Tenutosi a Zarzis (Tunisia), 8–11 Giugno 2015 (Quaderni di Archeologia Della Libya, 21); La Rocca, E., Ed.; “L’Erma” di Bretschneider: Rome, Italy, 2017; in press. [Google Scholar]
- Poidebard, R.P.A. La Trace de Rome Dans le Désert de Syrie: Le Limes de Trajan a la Conquête Arabe, Recherches Aériennes, 1925–1932; Haut-commissariat de la République Francaise en Syrie et au Liban, Service Des Antiquités et des Beaux-arts. Bibliothèque Archéologique et Historique, Tome 18; Geuthner: Paris, France, 1934. [Google Scholar]
- Gregory, S.; Kennedy, D. Sir Aurel Stein’s ‘Limes Report; BAR International Series 272; BAR Publishing: Oxford, UK, 1985. [Google Scholar]
- Edwards, D.N. The archaeology of the southern Fazzan and prospects for future research. Libyan Stud. 2001, 32, 49–66. [Google Scholar] [CrossRef]
- Kennedy, D. Aerial Archaeology in the Middle East. AARG News 1996, 12, 11–15. [Google Scholar]
- Mattingly, D.J.; Sterry, M. The first towns in the central Sahara. Antiquity 2013, 87, 503–518. [Google Scholar] [CrossRef]
- Apaame. Available online: www.apaame.org (accessed on 22 July 2017).
- Kennedy, D.; Bewley, R. Ancient Jordan from the Air; CBRL: London, UK, 2004. [Google Scholar]
- Kennedy, D.; Bewley, R. Aerial archaeology in Jordan. Antiquity 2009, 83, 69–81. [Google Scholar] [CrossRef]
- Beck, A.; Philip, G.; Abdulkarim, M.; Donoghue, D. Evaluation of Corona and Ikonos high resolution satellite imagery for archaeological prospection in western Syria. Antiquity 2007, 81, 161–175. [Google Scholar] [CrossRef]
- Casana, J.; Cothren, J.; Kalayci, T. Swords into Ploughshares: Archaeological Applications of CORONA Satellite Imagery in the Near East. Internet Archaeol. 2012, 32. [Google Scholar] [CrossRef]
- Casana, J. Regional-scale archaeological remote sensing in the age of big data. Automated site discovery vs. brute force methods. Adv. Archaeol. Pract. J. Soc. Am. Archaeol. 2014, 222–233. [Google Scholar] [CrossRef]
- Galiatsatos, N.; Donoghue, D.N.M.; Philip, G. High resolution elevation data derived from stereoscopic CORONA imagery with minimal ground control: An approach using IKONOS and SRTM data. Photogramm. Eng. Remote Sens. 2008, 74, 1093–1106. [Google Scholar] [CrossRef]
- Ur, J.A. Urbanism and Cultural Landscapes in Northeastern Syria: The Tell Hamoukar Survey, 1999–2001; Oriental Institute Publications No, 137; Oriental Institute of the University of Chicago: Chicago, IL, USA, 2010. [Google Scholar]
- Barker, G.; Gilbertson, D.; Jones, B.; Mattingly, D. Farming the Desert: The UNESCO Libyan Valleys Archaeological Survey. Volume 1: Synthesis; Society for Libyan Studies: London, UK, 1996. [Google Scholar]
- Bjørgo, E.; Boccardi, G.; Cunliffe, E.; Fiol, M.; Jellison, T.; Pederson, W.; Saslow, C. Satellite-Based Damage Assessment to Cultural Heritage Sites in Syria. UNITAR/UNOSAT. Available online: http://www.unitar.org/unosat/chs-syria (accessed on 1 October 2017).
- Cunliffe, E. Remote assessments of site damage: A new ontology. Int. J. Herit. Digit. Era 2014, 3, 453–473. [Google Scholar] [CrossRef]
- Tapete, D.; Cigna, F.; Donoghue, D.N. ‘Looting marks’ in space-borne SAR imagery: Measuring rates of archaeological looting in Apamea (Syria) with TerraSAR-X Staring Spotlight. Remote Sens. Environ. 2016, 178, 42–58. [Google Scholar] [CrossRef]
- Curious Traveller’s. Available online: http://www.visualisingheritage.org/locateheritage.php (accessed on 8 September 2017).
- ASOR. Available online: www.asor-syrianheritage.org/ (accessed on 22 July 2017).
- Terrawatchers. Available online: http://terrawatchers.org/ (accessed on 22 July 2017).
- Global Explorer. Available online: www.globalxplorer.org/about (accessed on 22 July 2017).
- Harris, T.M. Interfacing archaeology and the world of citizen sensors: Exploring the impact of neogeography and volunteered geographic information on an authenticated archaeology. World Archaeol. 2012, 44, 580–591. [Google Scholar] [CrossRef]
- Goodchild, M.F.; Li, L. Assuring the quality of volunteered geographic information. Spat. Stat. 2012, 1, 110–120. [Google Scholar] [CrossRef]
- Heipke, C. Crowdsourcing geospatial data. ISPRS J. Photogramm. Remote Sens. 2010, 65, 550–557. [Google Scholar] [CrossRef]
- Kvamme, K. An examination of automated archaeological feature recognition in remotely sensed imagery. In Computational Approaches to Archaeological Spaces; Bevan, A., Lake, M., Eds.; Left Coast Press: Walnut Creek, CA, USA, 2013; pp. 53–68. [Google Scholar]
- Harrower, M.J. Survey, Automated Detection, and Spatial Distribution Analysis of Cairn Tombs in Ancient Southern Arabia. In Mapping Archaeological Landscapes from Space; Comer, D., Harrower, M., Eds.; Springer: New York, NY, USA, 2013; pp. 259–268. [Google Scholar]
- Bennett, R.; Cowley, D.; De Laet, V. The data explosion: Tackling the taboo of automatic feature recognition in airborne survey data. Antiquity 2014, 88, 896–905. [Google Scholar] [CrossRef]
- Menze, B.H.; Ur, J.A. Mapping patterns of Long-Term Settlement in Northern Mesopotamia at a Large Scale. Proc. Natl. Acad. Sci. USA 2012, 109, E778–E787. [Google Scholar] [CrossRef] [PubMed]
- Beck, A. Archaeological site detection: The importance of contrast. In Proceedings of the Annual Conference of the Remote Sensing and Photogrammetry Society, Newcastle upon Tyne, UK, 11–14 September 2007; pp. 307–312. [Google Scholar]
- Syrian Heritage in Danger (SHRIN). Available online: http://shirin-international.org (accessed on 11 September 2017).
- Kennedy, D.; Bishop, M. Google Earth and the archaeology of Saudi Arabia. A case study from the Jeddah area. J. Archaeol. Sci. 2011, 38, 1284–1293. [Google Scholar] [CrossRef]
- Rayne, L.; Sheldrick, N.; Nikolaus, J. Endangered Archaeology in Libya: Recording Damage and Destruction. Libyan Stud. 2017, 1–27. Available online: https://www.cambridge.org/core/journals/libyan-studies/article/endangered-archaeology-in-libya-recording-damage-and-destruction/59C240F04F16EE257ED76D27E02A482C (accessed on 1 October 2017).
- The Difficulty of Verifying Heritage Damage Reports, EAMENA Blog. Available online: http://eamena.arch.ox.ac.uk/the-difficulty-of-verifying-heritage-damage-reports/ (accessed on 22 July 2017).
- Casana, J.; Cothren, J. Stereo analysis, DEM extraction and orthorectification of CORONA satellite imagery: Archaeological applications from the Near East. Antiquity 2008, 82, 732–749. [Google Scholar] [CrossRef]
- Conesa, F.C.; Madella, M.; Galiatsatos, N.; Balbo, A.L.; Rajesh, S.V.; Ajithprasad, P. CORONA photographs in monsoonal semi-arid environments: Addressing archaeological surveys and historic landscape dynamics over North Gujarat, India. Archaeol. Prospect. 2015, 22, 75–90. [Google Scholar] [CrossRef]
- Kennedy, D. Declassified satellite photographs and archaeology in the Middle East: Case studies from Turkey. Antiquity 1998, 72, 553–561. [Google Scholar] [CrossRef]
- Rayne, L. Water and Territorial Empires: The Application of Remote Sensing Techniques to Ancient Imperial Water Management in Northern Mesopotamia. Ph.D. Thesis, Durham University, Durham, UK, 2014. [Google Scholar]
- Huete, A.R. A Soil Adjusted Vegetation Index. Remote Sens. Environ. 1988, 25, 295–309. [Google Scholar] [CrossRef]
- Google Earth Engine Team, Google Earth Engine: A Planetary-Scale Geospatial Analysis Platform. Available online: https://earthengine.google.com (accessed on 1 October 2017).
- Mowrer, H.T.; Congalton, R.G. (Eds.) Quantifying Spatial Uncertainty in Natural Resources: Theory and Applications for GIS and Remote Sensing; CRC Press: Boca Raton, FL, USA, 2003. [Google Scholar]
- Crosetto, M.; Tarantola, S. Uncertainty and sensitivity analysis: Tools for GIS-based model implementation. Int. J. Geogr. Inf. Sci. 2001, 15, 415–437. [Google Scholar] [CrossRef]
- Couclelis, H. The certainty of uncertainty: GIS and the limits of geographic knowledge. Trans. GIS 2003, 7, 165–175. [Google Scholar] [CrossRef]
- Wang, G.; Gertner, G.Z.; Fang, S.; Anderson, A.B. A methodology for spatial uncertainty analysis of remote sensing and GIS products. Photogramm. Eng. Remote Sens. 2005, 71, 1423–1432. [Google Scholar] [CrossRef]
- De Runz, C.; Desjardin, E.; Piantoni, F.; Herbin, M. Using fuzzy logic to manage uncertain multi-modal data in an archaeological GIS. In Proceedings of the International Symposium on Spatial Data Quality-ISSDQ, Enschede, The Netherlands, 13–15 June 2007. [Google Scholar]
- Cooper, A.; Green, C. Embracing the complexities of ‘big data’ in archaeology: The case of the English Landscape and Identities Project. J. Archaeol. Method Theory 2016, 23, 271–304. [Google Scholar] [CrossRef]
- Manyika, J.; Chui, M.; Brown, B.; Bughin, J.; Dobbs, R.; Roxburgh, C.; Byers, A.H. Big Data: The Next Frontier for Innovation, Competition, and Productivity, 2011. Available online: http://www.mckinsey.com/business-functions/digital-mckinsey/our-insights/big-data-the-next-frontier-for-innovation (accessed on 23 June 2017).
- Boyd, D.; Crawford, K. Critical questions for big data: Provocations for a cultural, technological, and scholarly phenomenon. Inf. Commun. Soc. 2012, 15, 662–679. [Google Scholar] [CrossRef]
- Didan, K. MOD13A1 MODIS/Terra Vegetation Indices 16-Day L3 Global 500m SIN Grid V006. NASA EOSDIS Land Processes DAAC. 2015. Available online: https://doi.org/10.5067/modis/mod13a1.006 (accessed on 1 October 2017).
- Mills, S.; Weiss, S.; Liang, C. VIIRS day/night band (DNB) stray light characterization and correction. In Proceedings of the SPIE Optical Engineering+ Applications, International Society for Optics and Photonics, Prague, Czech Republic, 23 September 2013; p. 88661. [Google Scholar]
- Fradley, M.; Sheldrick, N. Satellite imagery and heritage damage in Egypt: A response to Parcak et al. Antiquity 2017, 91, 784–792. [Google Scholar] [CrossRef]
- Parcak, S.; Gathings, D.; Childs, C.; Mumford, G.; Cline, E. Satellite evidence of archaeological site looting in Egypt: 2002–2013. Antiquity 2016, 90, 188–205. [Google Scholar] [CrossRef]
- Beechey, F.W.; Beechey, H.W. Proceedings of the Expedition to Explore the Northern Coast of Africa: From Tripoly Eastward in MDCCCXXI. and MDCCCXXII., Comprehending an Account of the Greater Syrtis and Cyrenaica; and of the Ancient Cities Composing the Pentapolis; John Murray: London, UK, 1828. [Google Scholar]
- Luni, M. La Scoperta Di Cirene: Un Secolo di Scavi (1913–2013); “L’Erma” di Bretscnheider: Rome, Italy, 2014. [Google Scholar]
- Goodchild, R.; Reynolds, J.; Herington, C. The Temple of Zeus at Cyrene. Pap. Br. Sch. Rome 1958, 26, 30–62. [Google Scholar] [CrossRef]
- White, D. Cyrene’s Sanctuary of Demeter and Persephone: A Summary of a Decade of Excavation. Am. J. Archaeol. 1981, 85, 13–30. [Google Scholar] [CrossRef]
- White, D.; Reynolds, J. The Extramural Sanctuary of Demeter and Persephone at Cyrene, Libya: Final Reports: The Sanctuary’s Imperial Architectural Development, Conflict with Christianity, and final days; University of Pennsylvania Museum of Archaeology and Anthropology Philadelphia, for The Libyan Department of Antiquities: Philadelphia, PA, USA, 2012. [Google Scholar]
- White, D. The Pennsylvania Museum’s Demeter and Persephone Sanctuary Project at Cyrene: A Final Progress Report? Libyan Stud. 1989, 20, 71–77. [Google Scholar] [CrossRef]
- Cassels, J. The cemeteries of Cyrene. Pap. Br. Sch. Rome 1955, 23, 1–43. [Google Scholar] [CrossRef]
- Thorn, J.C. The Necropolis of Cyrene: Two Hundred Years of Explorations; L’Erma di Bretschneider: Rome, Italy, 2005. [Google Scholar]
- Kenrick, P. Cyrenaica. Libya Archaeological Guides; Society for Libyan Studies, Silphium Press: London, UK, 2013. [Google Scholar]
- Abdulkariem, A.; Bennett, P. Libyan heritage under threat: The case of Cyrene. Libyan Stud. 2014, 45, 155–161. [Google Scholar] [CrossRef]
- Thorn, D.; Thorn, J.C. A Gazeteer of the Cyrene Necropolis: From the Original Notebooks of John Cassels, Richard Tomlinson and James and Dorothy Thorn; L’Erma di Bretschneider: Rome, Italy, 2009. [Google Scholar]
- Al-Raeid, F.; Di Valerio, E.; Di Antonio, M.G.; Menozzi, O.; Abdalgadar El Mziene, M.A.S.; Tamburrino, C. The main issues of the Cyrene necropolis and the use of remote sensing for monitoring in the case of the eastern necropolis. Libyan Stud. 2016, 47, 7–30. [Google Scholar] [CrossRef]
- Cyrenaica Archaeological Project. Available online: http://www.cyrenaica.org/ (accessed on 8 September 2017).
- Goodchild, R. Earthquakes in ancient Cyrenaica. In Geology and Archaeology of Northern Cyrenaica, Libya; Barr, F.T., Ed.; Petroleum Exploration Society of Libya: Tripoli, Libya, 1968; pp. 41–44. [Google Scholar]
- Di Vita, A. Archaeologists and earthquakes: The case of 365 AD. Annali Geofisica 1995, 506, 971–976. [Google Scholar]
- Mohamed, O.A. (University of Leicester). Personal communication, 2017.
- Archaeological Site of Cyrene. Available online: http://whc.unesco.org/en/soc/3399 (accessed on 22 July 2017).
- Newson, P.; Abdulkarim, M.; McPhillips, S.; Mills, P.; Reynolds, P.; Philip, G. Landscape study of dar es-salaam and the wa’ar basalt region north-west of homs, syria. Report on work undertaken during 2005–2007. Berytus 2009, 10, 1–35. [Google Scholar]
- Philip, G.; Bradbury, J. Pre-classical activity in the basalt landscape of the Homs region, Syria: The development of “sub-optimal” zones in the Levant during the Chalcolithic and Early Bronze Age. Levant 2010, 42, 136–169. [Google Scholar] [CrossRef]
- Bradbury, J. Landscapes of Burial? The Homs Basalt, Syria in the 4th–3rd Millennia BC. Ph.D. Thesis, University of Durham, Durham, UK, Unpublished work. 2011. [Google Scholar]
- Bradbury, J.; Philip, G. The world beyond the tells: Pre-classical activity in the basalt landscape of the Homs region, Syria. In Pierres Levées, Stèles Anthropomorphes et Dolmens. Standing Stones, Anthropomorphic Stelae and Dolmens; BAR International Series 2317; Steimer-Herbert, T., Ed.; Maison de l’Orient et de la Méditerranée Jean Pouilloux: Lyon, France; Archaeopress: Oxford, UK, 2011; pp. 169–180. [Google Scholar]
- International Fund for Agricultural Development (IFAD). Syrian Arab Republic: Thematic Study on Land Reclamation through De-Rocking. International Fund for Agricultural Development, Near East and North Africa Division, Programme Management Department. 2010. Available online: www.ifad.org/pub/pn/syria.pdf (accessed on 1 April 2010).
- Mattingly, D.J.; Bokbot, Y.; Sterry, M.; Cuénod, A.; Fenwick, C.; Gatto, M.; Ray, N.; Rayne, L.; Janin, K.; Lamb, A.; et al. Long-term History in a Moroccan Oasis Zone: The Middle Draa Project 2015. J. Afr. Archaeol. 2017, in press. [Google Scholar]
- Bradbury, J.; Sader, H.; McPhillips, S.; Kennedy, M.; Banks, R.; Hoffman, D.; Mardini, M.; Vafadari, A.; Wannessian, B. The Kubba Coastal Survey: First Season Report. Bull. d’archéol. d’archit. Liban. submitted 2016.
- Congalton, R.G.; Green, K. Assessing the Accuracy of Remotely Sense Data Principles and Practices, 2nd ed.; Taylor and Francis: Hoboken, NJ, USA, 2008. [Google Scholar]
- Congalton, R.G. A review of assessing the accuracy of classifications of remotely sensed data. Remote Sens. Environ. 1991, 37, 35–45. [Google Scholar] [CrossRef]
- Fisher, P. The pixel: A snare and a delusion. Int. J. Remote Sens. 1997, 18, 679–685. [Google Scholar] [CrossRef]
- Casana, J.; Herrmann, J.T.; Qandil, H.S. Settlement history in the eastern Rub al-Hali: Preliminary Report of the Dubai Desert Survey (2006–2007). Arab. Archaeol. Epigr. 2009, 20, 30–45. [Google Scholar] [CrossRef]
- Corrie, R.K. Detection of ancient Egyptian archaeological sites using satellite remote sensing and digital image processing. Proc. SPIE 2011, 8181, 81811B. [Google Scholar] [CrossRef]
© 2017 by the authors. Licensee MDPI, Basel, Switzerland. This article is an open access article distributed under the terms and conditions of the Creative Commons Attribution (CC BY) license (http://creativecommons.org/licenses/by/4.0/).