1. Introduction
Many scientists and common people had shown their interests in volcanic mountains since a long time ago, because volcanic areas are prosperous and provide plenty of resources for humans. The researchers were more concerned with the substantial fact that the volcanic eruptions represent humans’ life. Therefore, the science of the activities of a volcanic mountain is now being promoted in several aspects, including the evolution and the history of the volcanic system. The evolutional pattern and the volcanic historical system have to be read in a more careful manner. The patterns have to be predicted accurately to reduce the impacts on humans and the surrounding environment. Here we use Mount Samalas in the Rinjani Volcanic Complex in Indonesia as an example. The history and the volcanic system of Mount Samalas since its 1257 AD plinian eruption [
1] can be identified from the sedimentary map and the spatial context. In the last two decades, the understanding of the sedimentation of volcanic plume has been growing significantly. The models of plume sediment have been elaborated and are synchronous with the field data [
2]. Generally, sediment from a volcanic eruption contains both falls and current deposits. Both types of sediments supply an important insight related to the volcanic activities in the past, including the dynamics of eruption’s column. The main dangers of an eruption are the intensity and the scale of the eruption. The estimated value of the tephra fall volume is one of the essential keys to predicting how dangerous the eruption of a volcanic mountain is. However, the inadequate data from outcrops underestimate the calculation of the tephra volume. The potential solution to solve the problem is an availability of indirect investigations methods such as geophysical ones. This method can greatly help in the mapping of volcanic plume sediments at affordable/reasonable costs, especially the geoelectrical resistivity method.
In order to appraise the volcanic sediment, it is important to construct isopach maps. The combination of geoelectrical technique, rock outcropmapping, and drilling data are appropriate methods to solve this problem. The geoelectrical method has been widely used to investigate those matters beyond the superficial, such as geological, environmental, geotechnical, and hydrogeological matters [
3]. The Vertical Electric Sound (VES) method has been used in differentiating the deposition of Quarter paleo-climate sediments [
4]. VES application is used for mapping the pyroclastic thickness [
5] on a morphological situation where the mountain slopes are steep and inaccessible as an affordable and flexible method. Shallow Quaternary volcanic sediment was measured using the geoelectric method [
6].
The characteristics of volcanic sediment on the bedrock level obtained from VES data inversion showed a unit of high and low resistivity [
7]. Bedrock is a solid rock exposed at the surface or underlying soil; has a shear-wave velocity greater than 795 m/s at small (0.0001 percent) strains.
The 2D mapping has been utilized to visualize the ventilation and the volcanic embankment, volcanic geological tuff contact, and basaltic rock [
8].
The integrated information between geophysics and geology can be applied to characterize the sediment composition around lakes [
9]. Is the combination of geophysical methods, outcrop observation, and drilling efficient for the isopach mapping of the volcanic sediment? Do the topographic condition and the distance from the crater influence the value of isopach?
3. Results
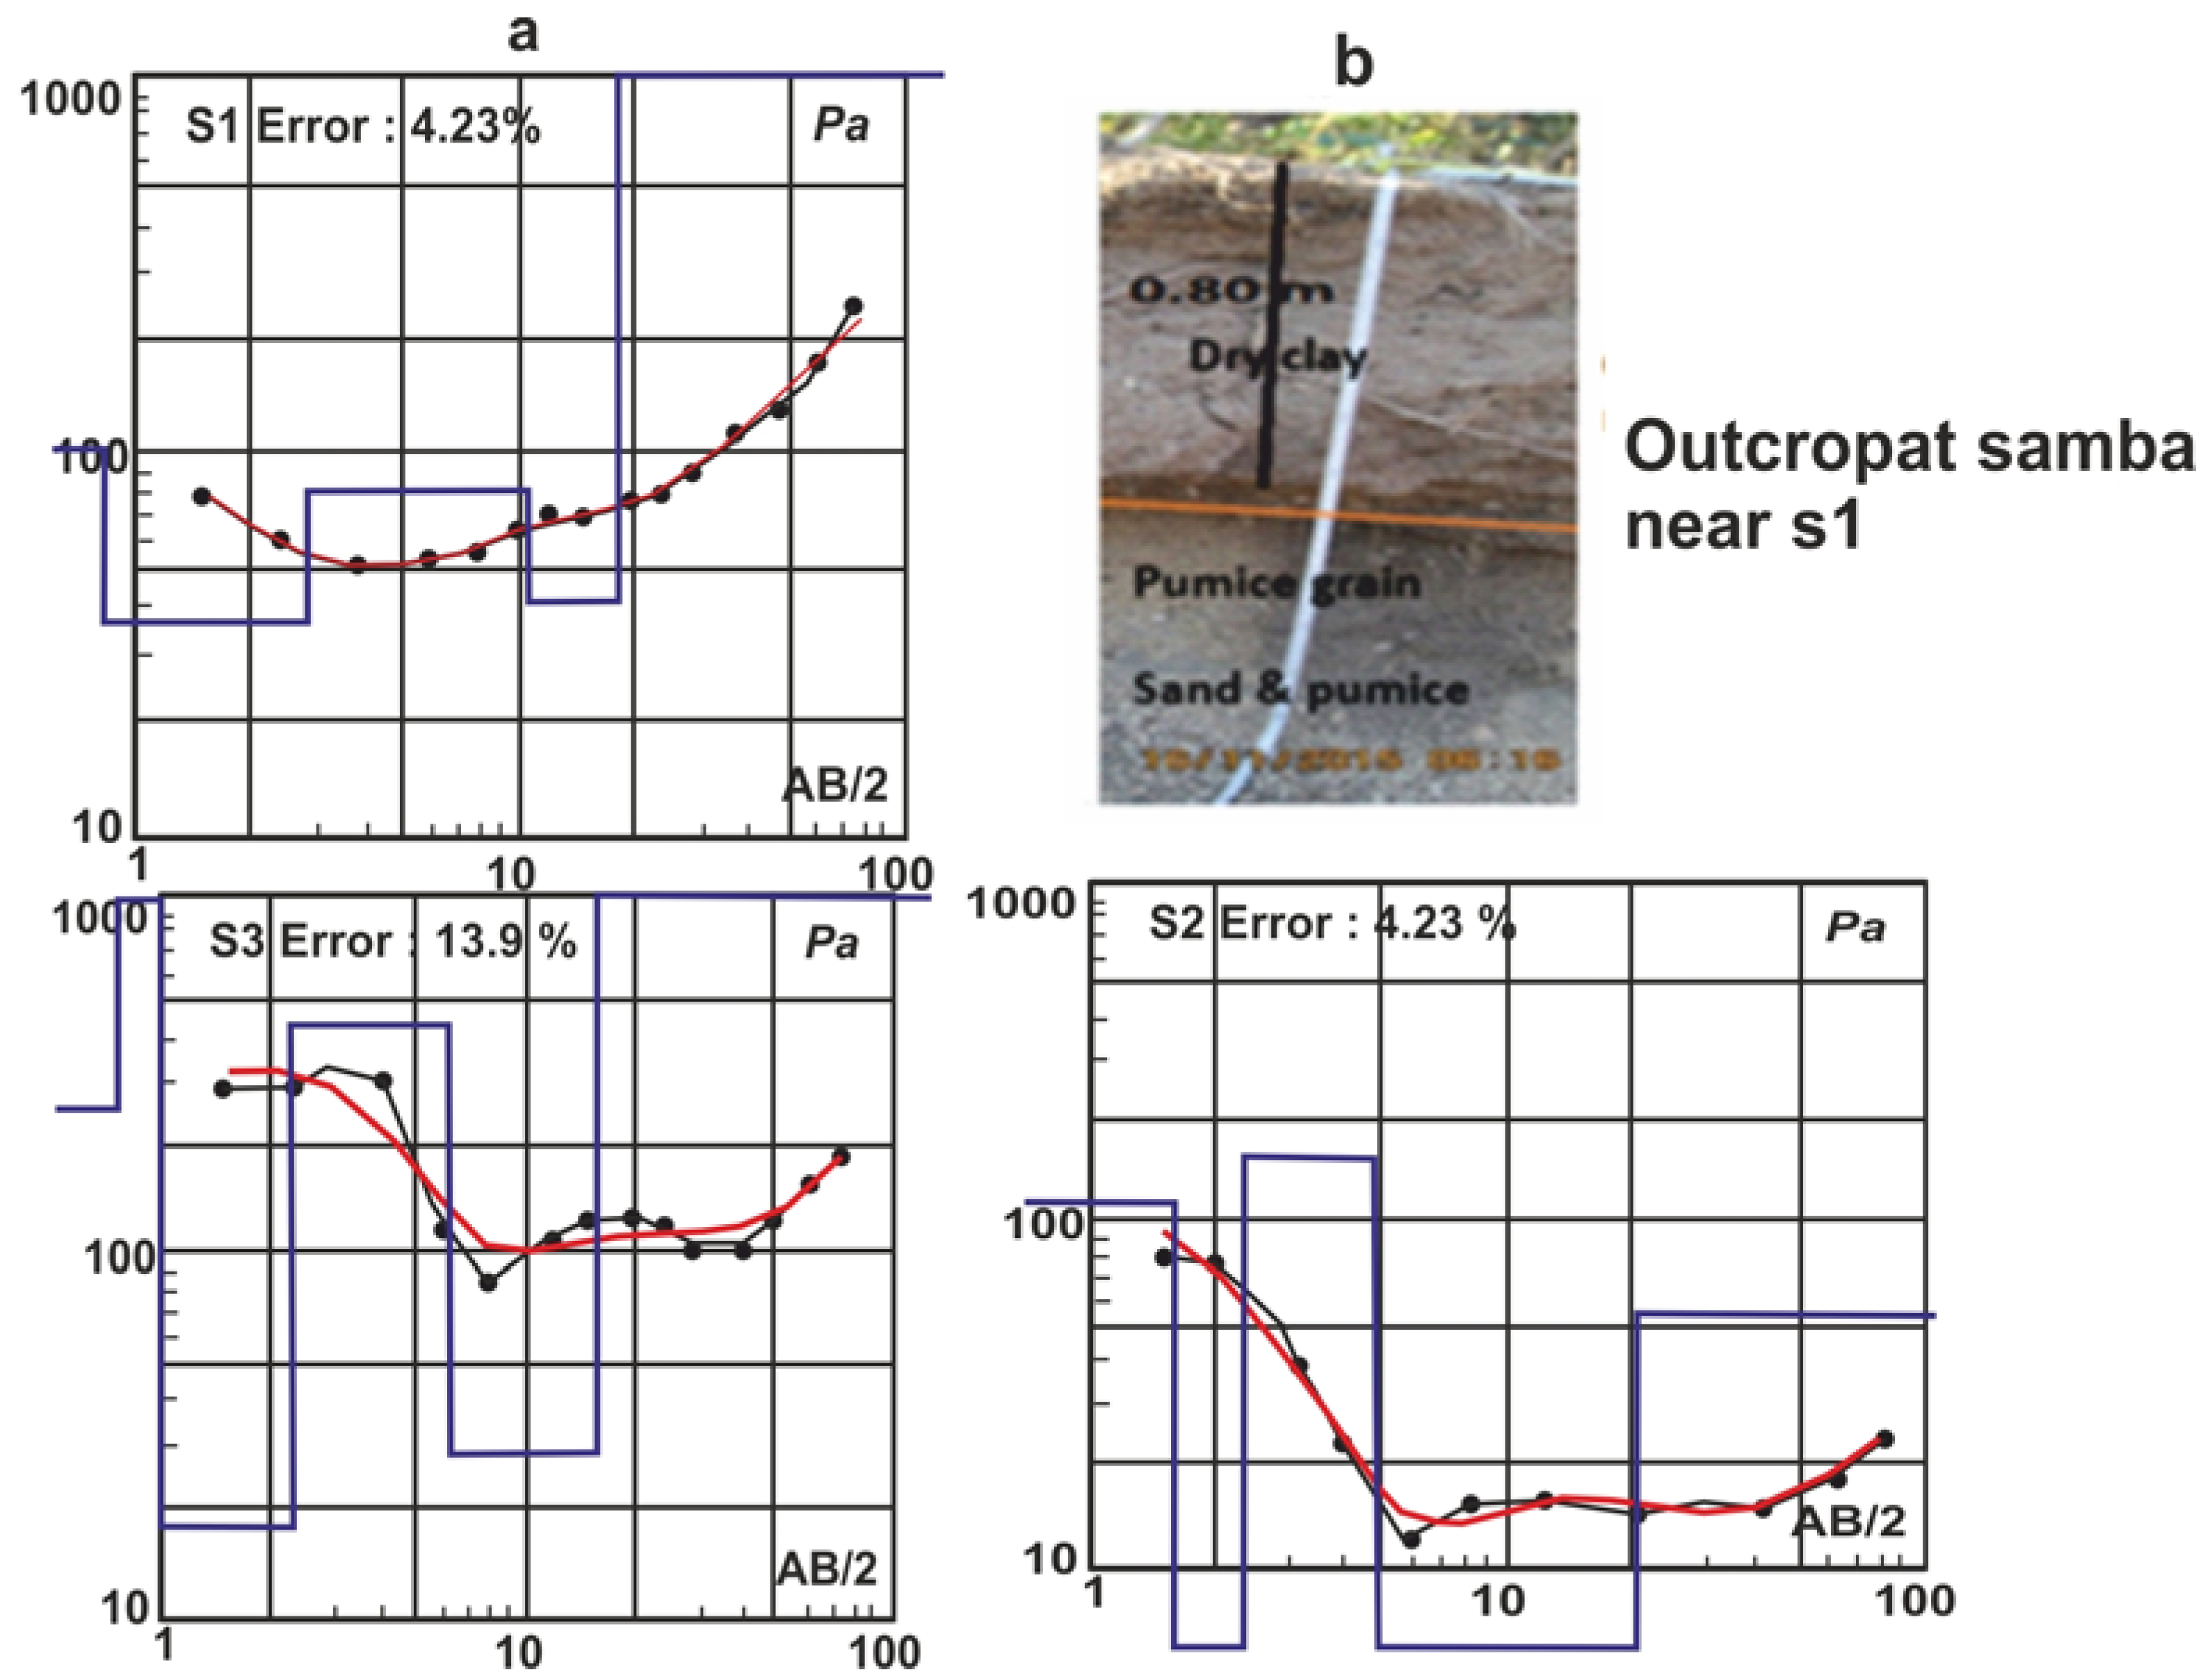
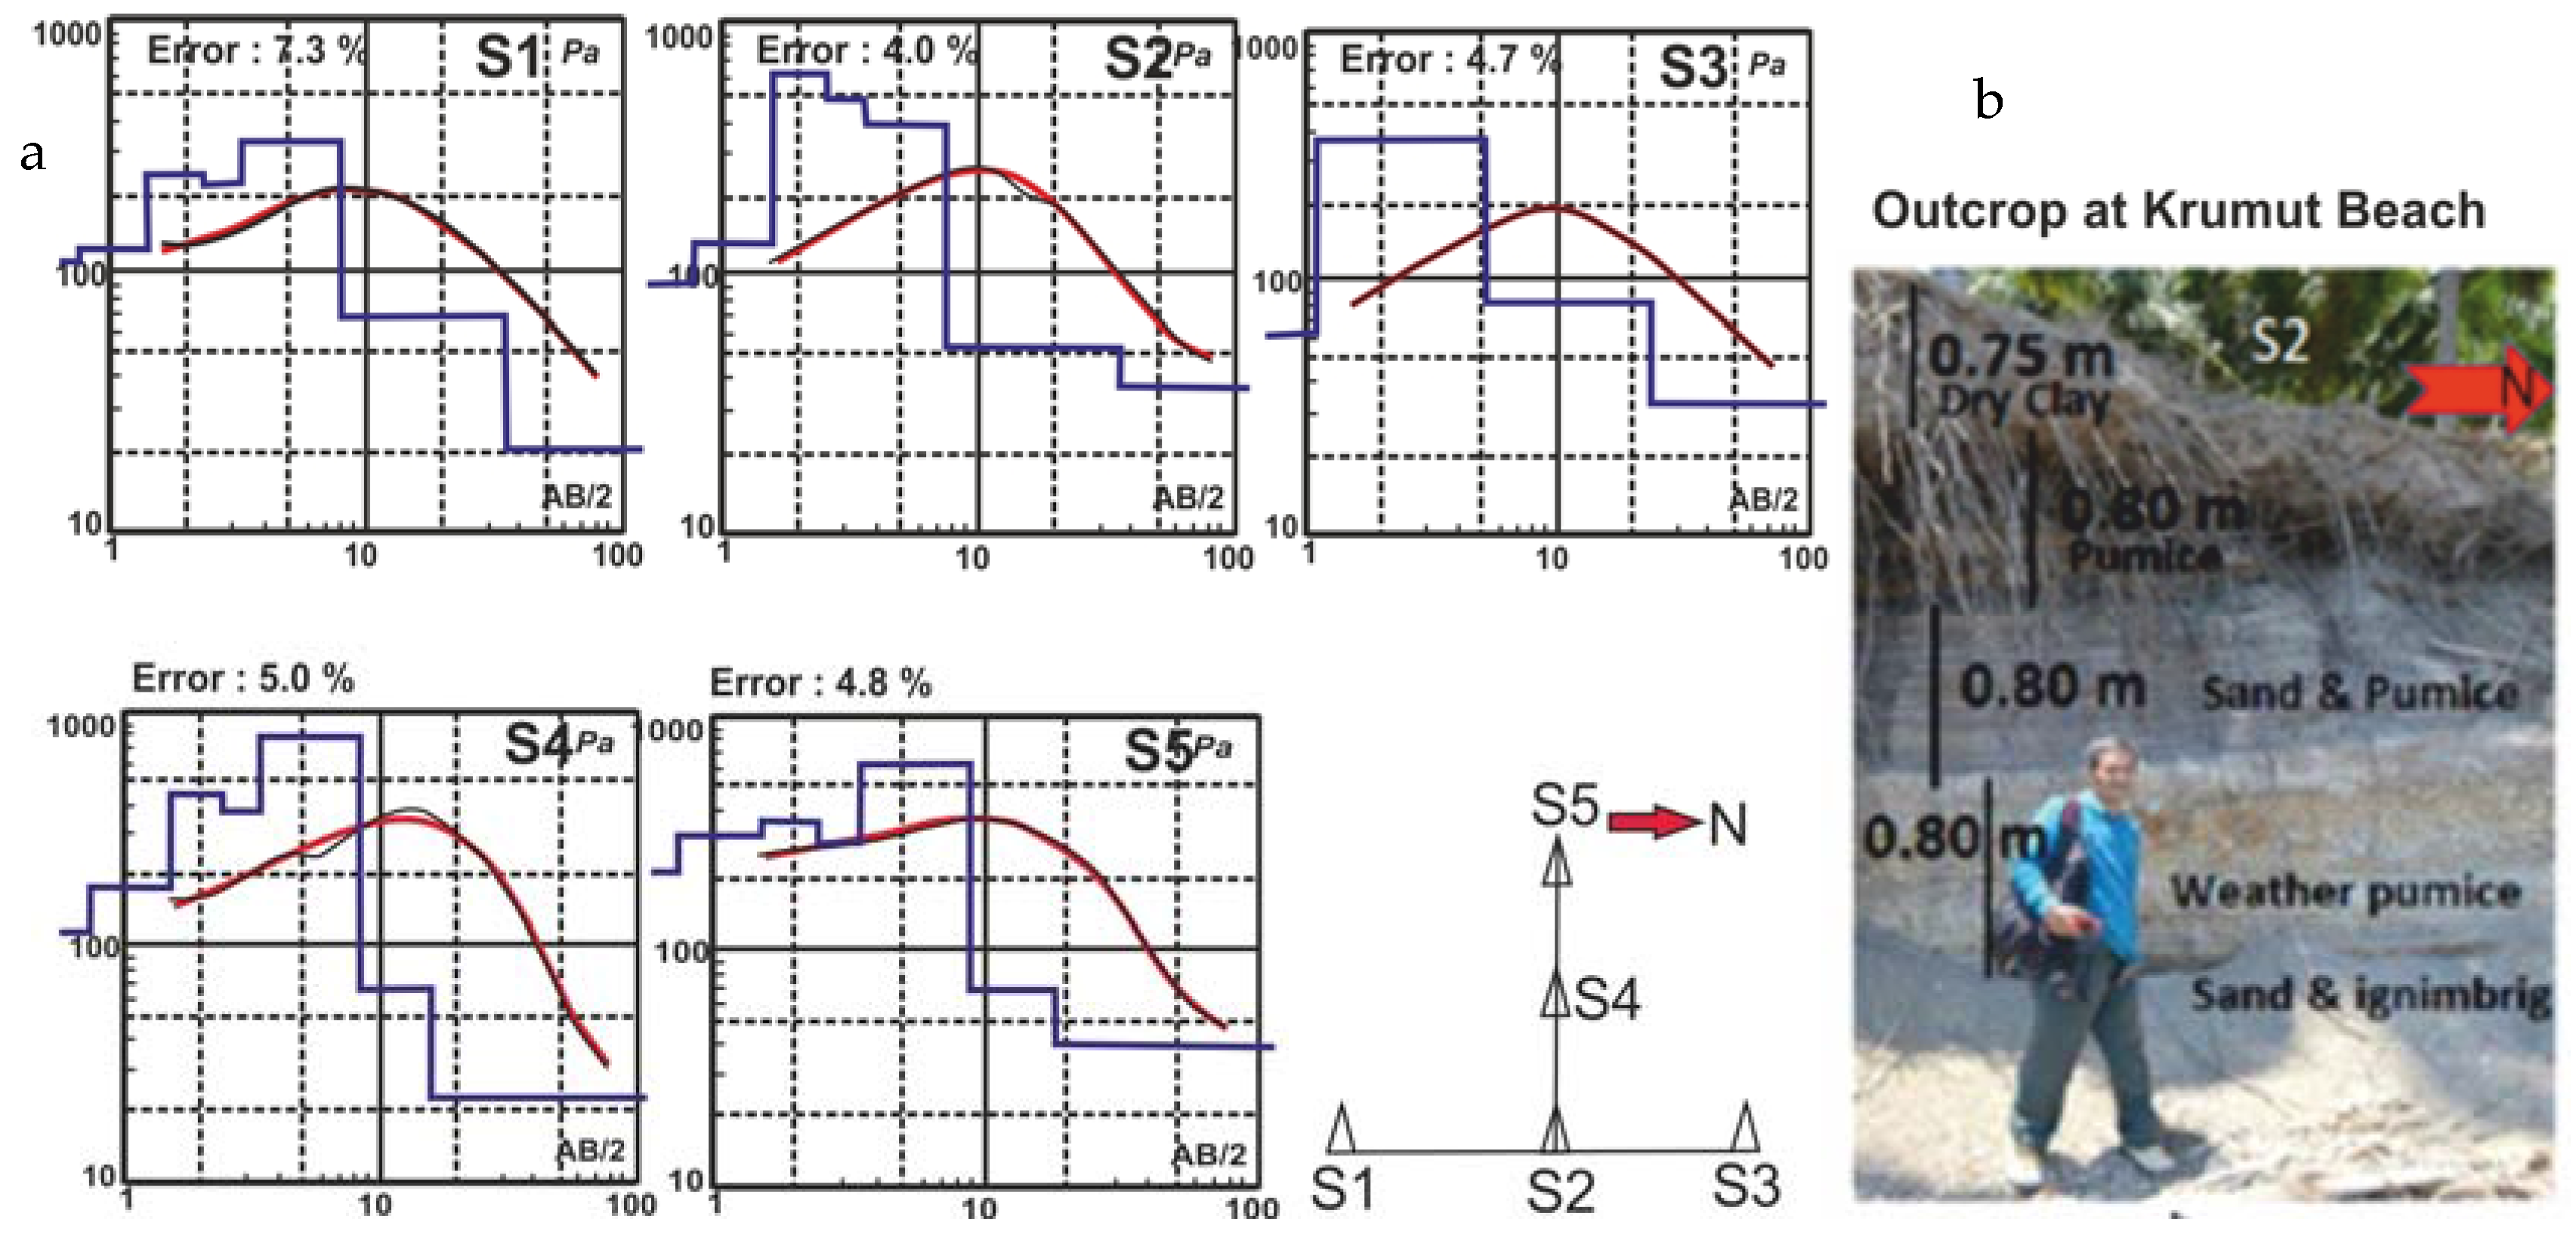
Field observation data, which had been inverted form VES resistivity, is shown in
Figure 3 and
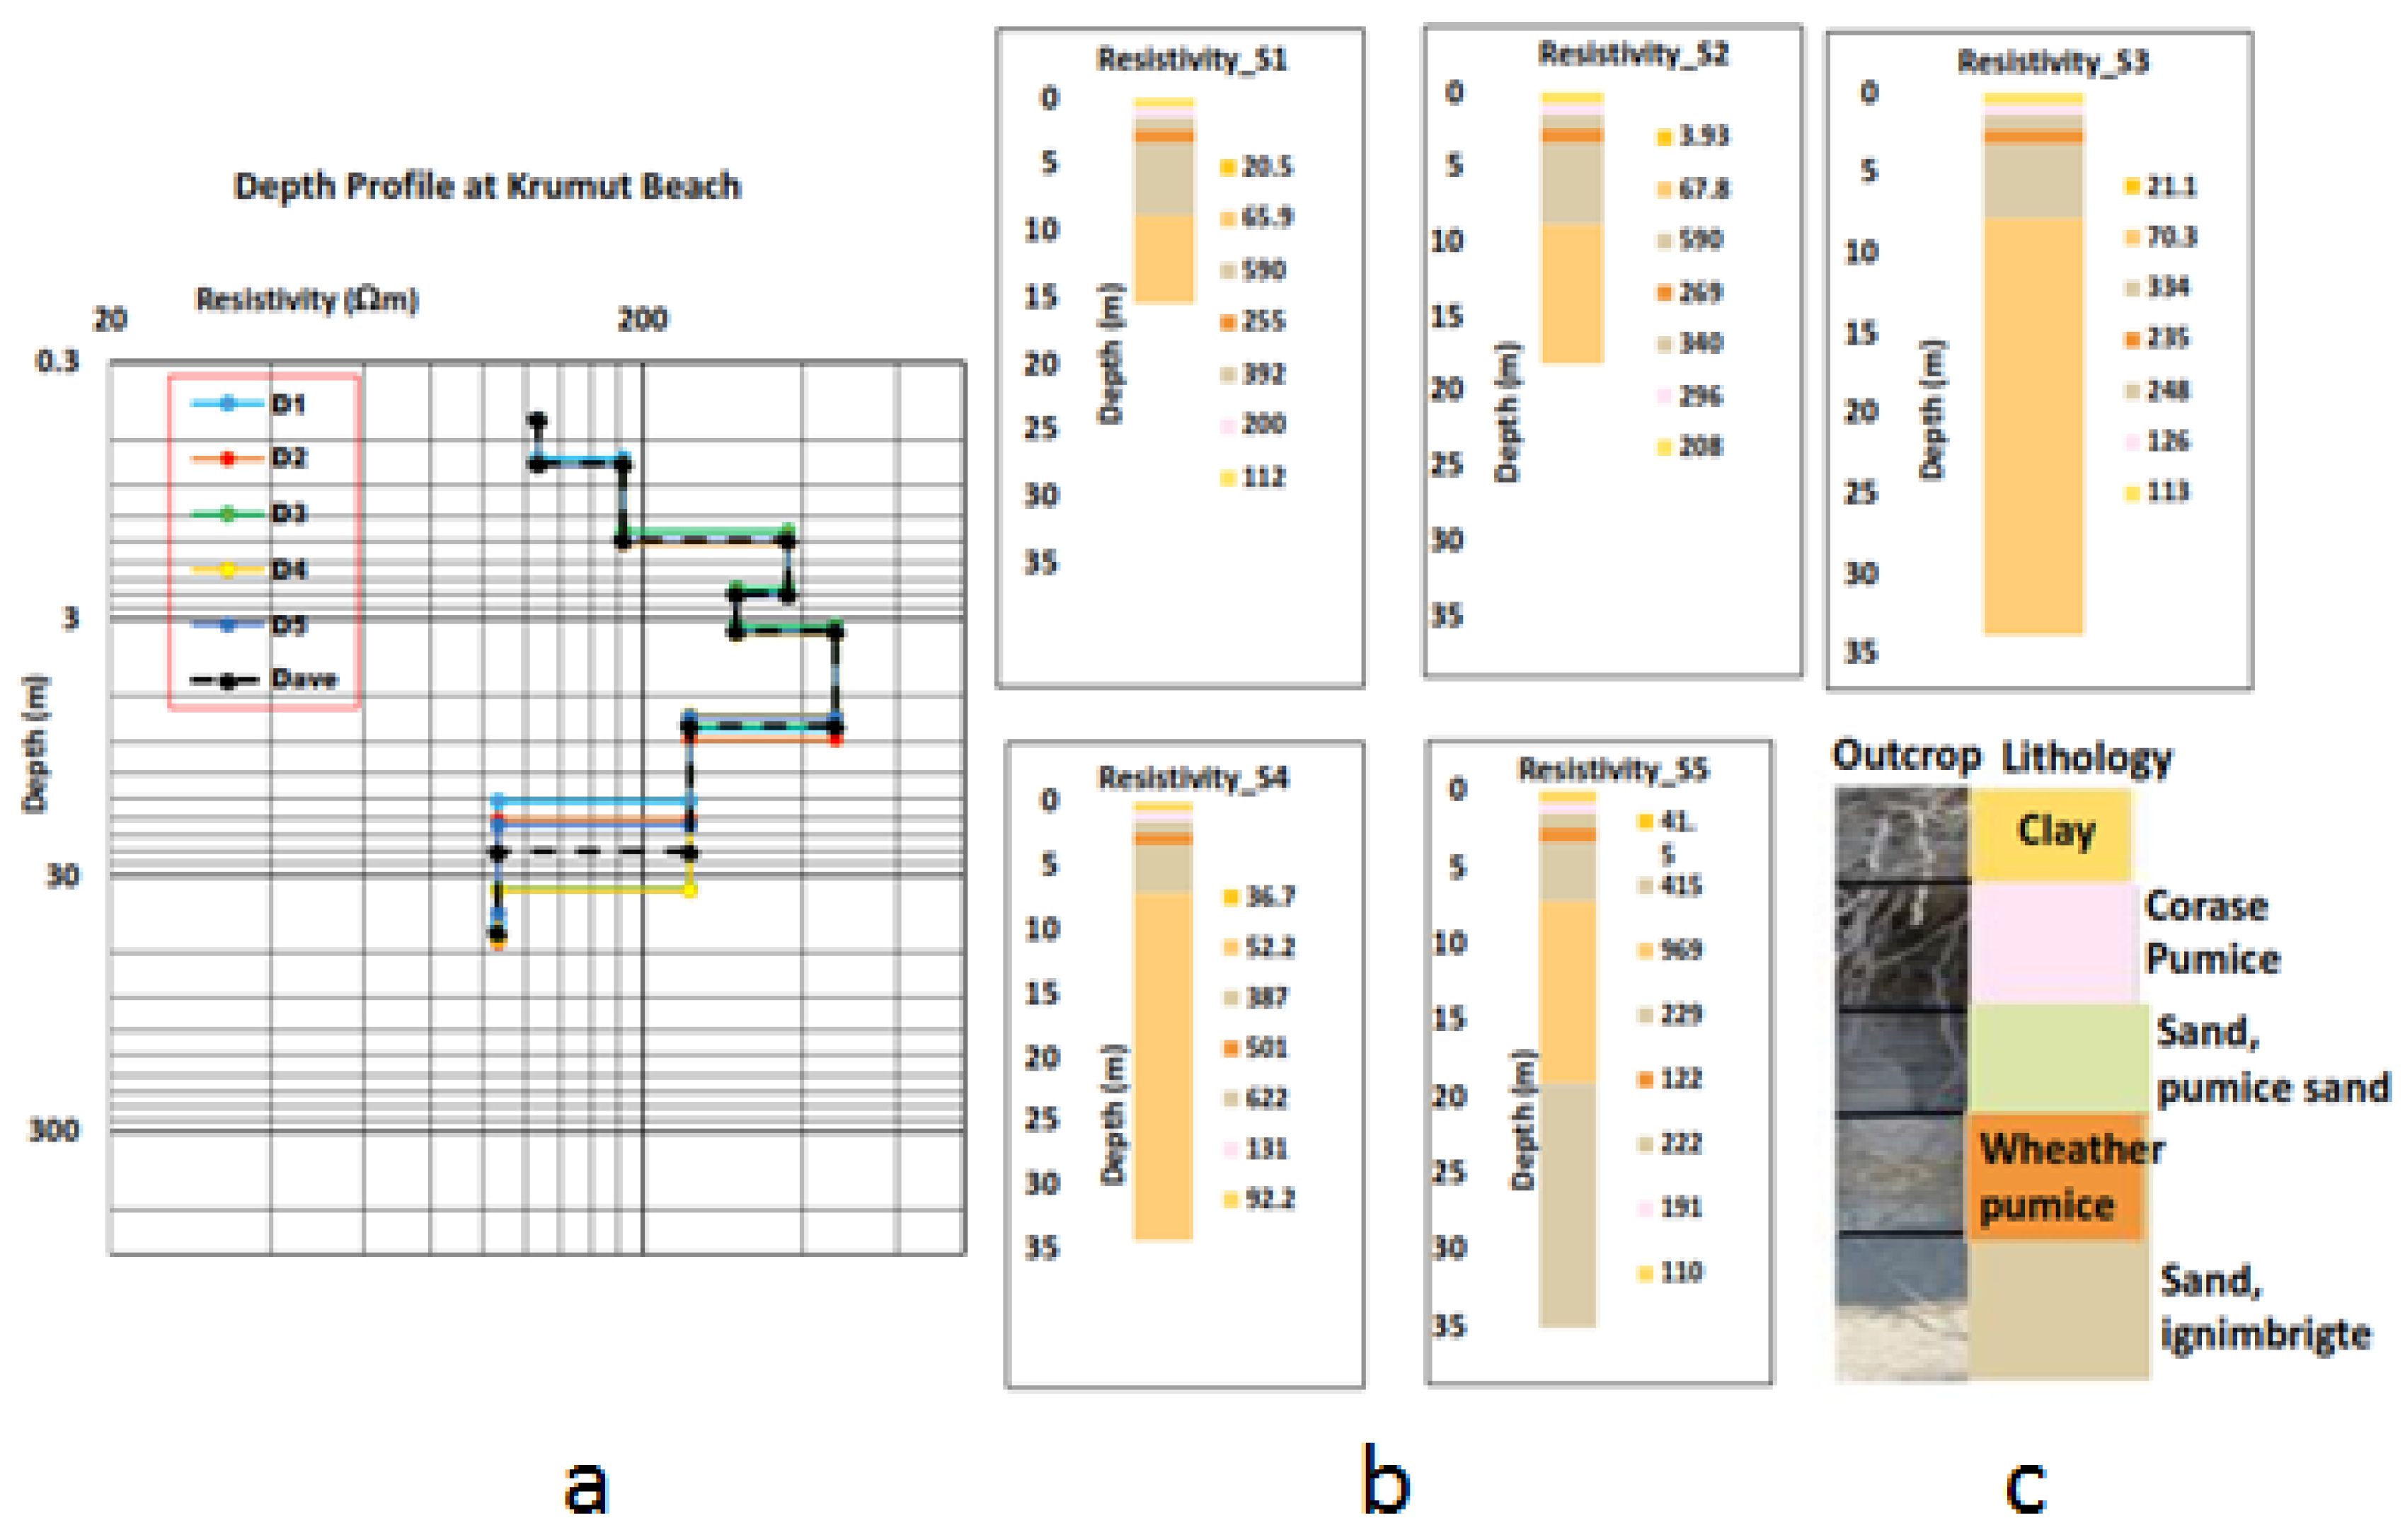
Figure 5. Meanwhile, the depth profile (
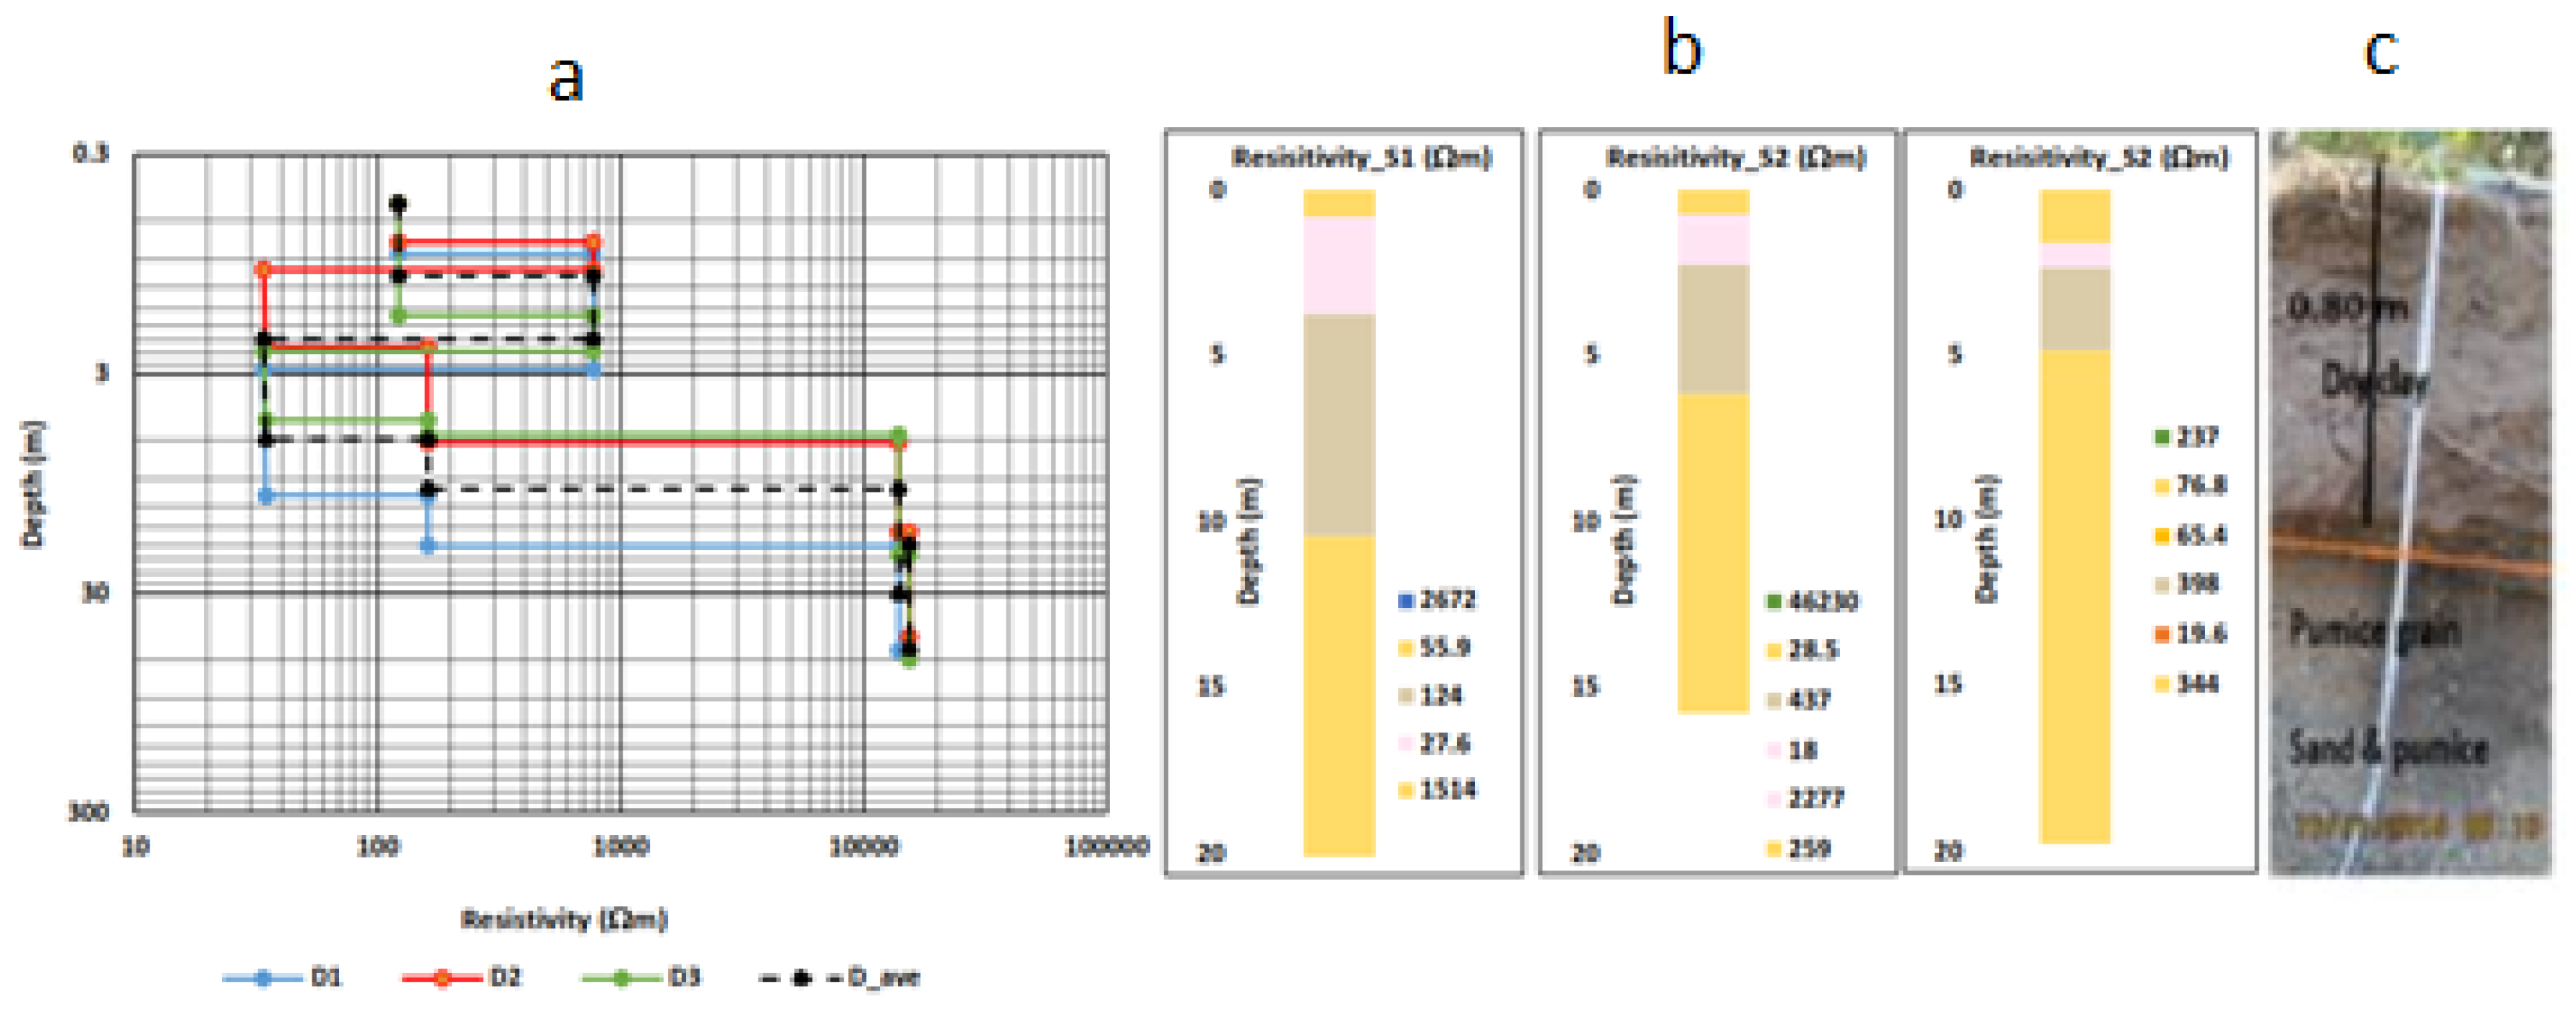
Figure 3) and resistivity logs (
Figure 6) was constructed from the VES inversion.
Figure 7,
Figure 8 and
Figure 9 are cross-sectional 2D ERT. 2D mapping was conducted in Mataram, Tanjung, and Korleko.
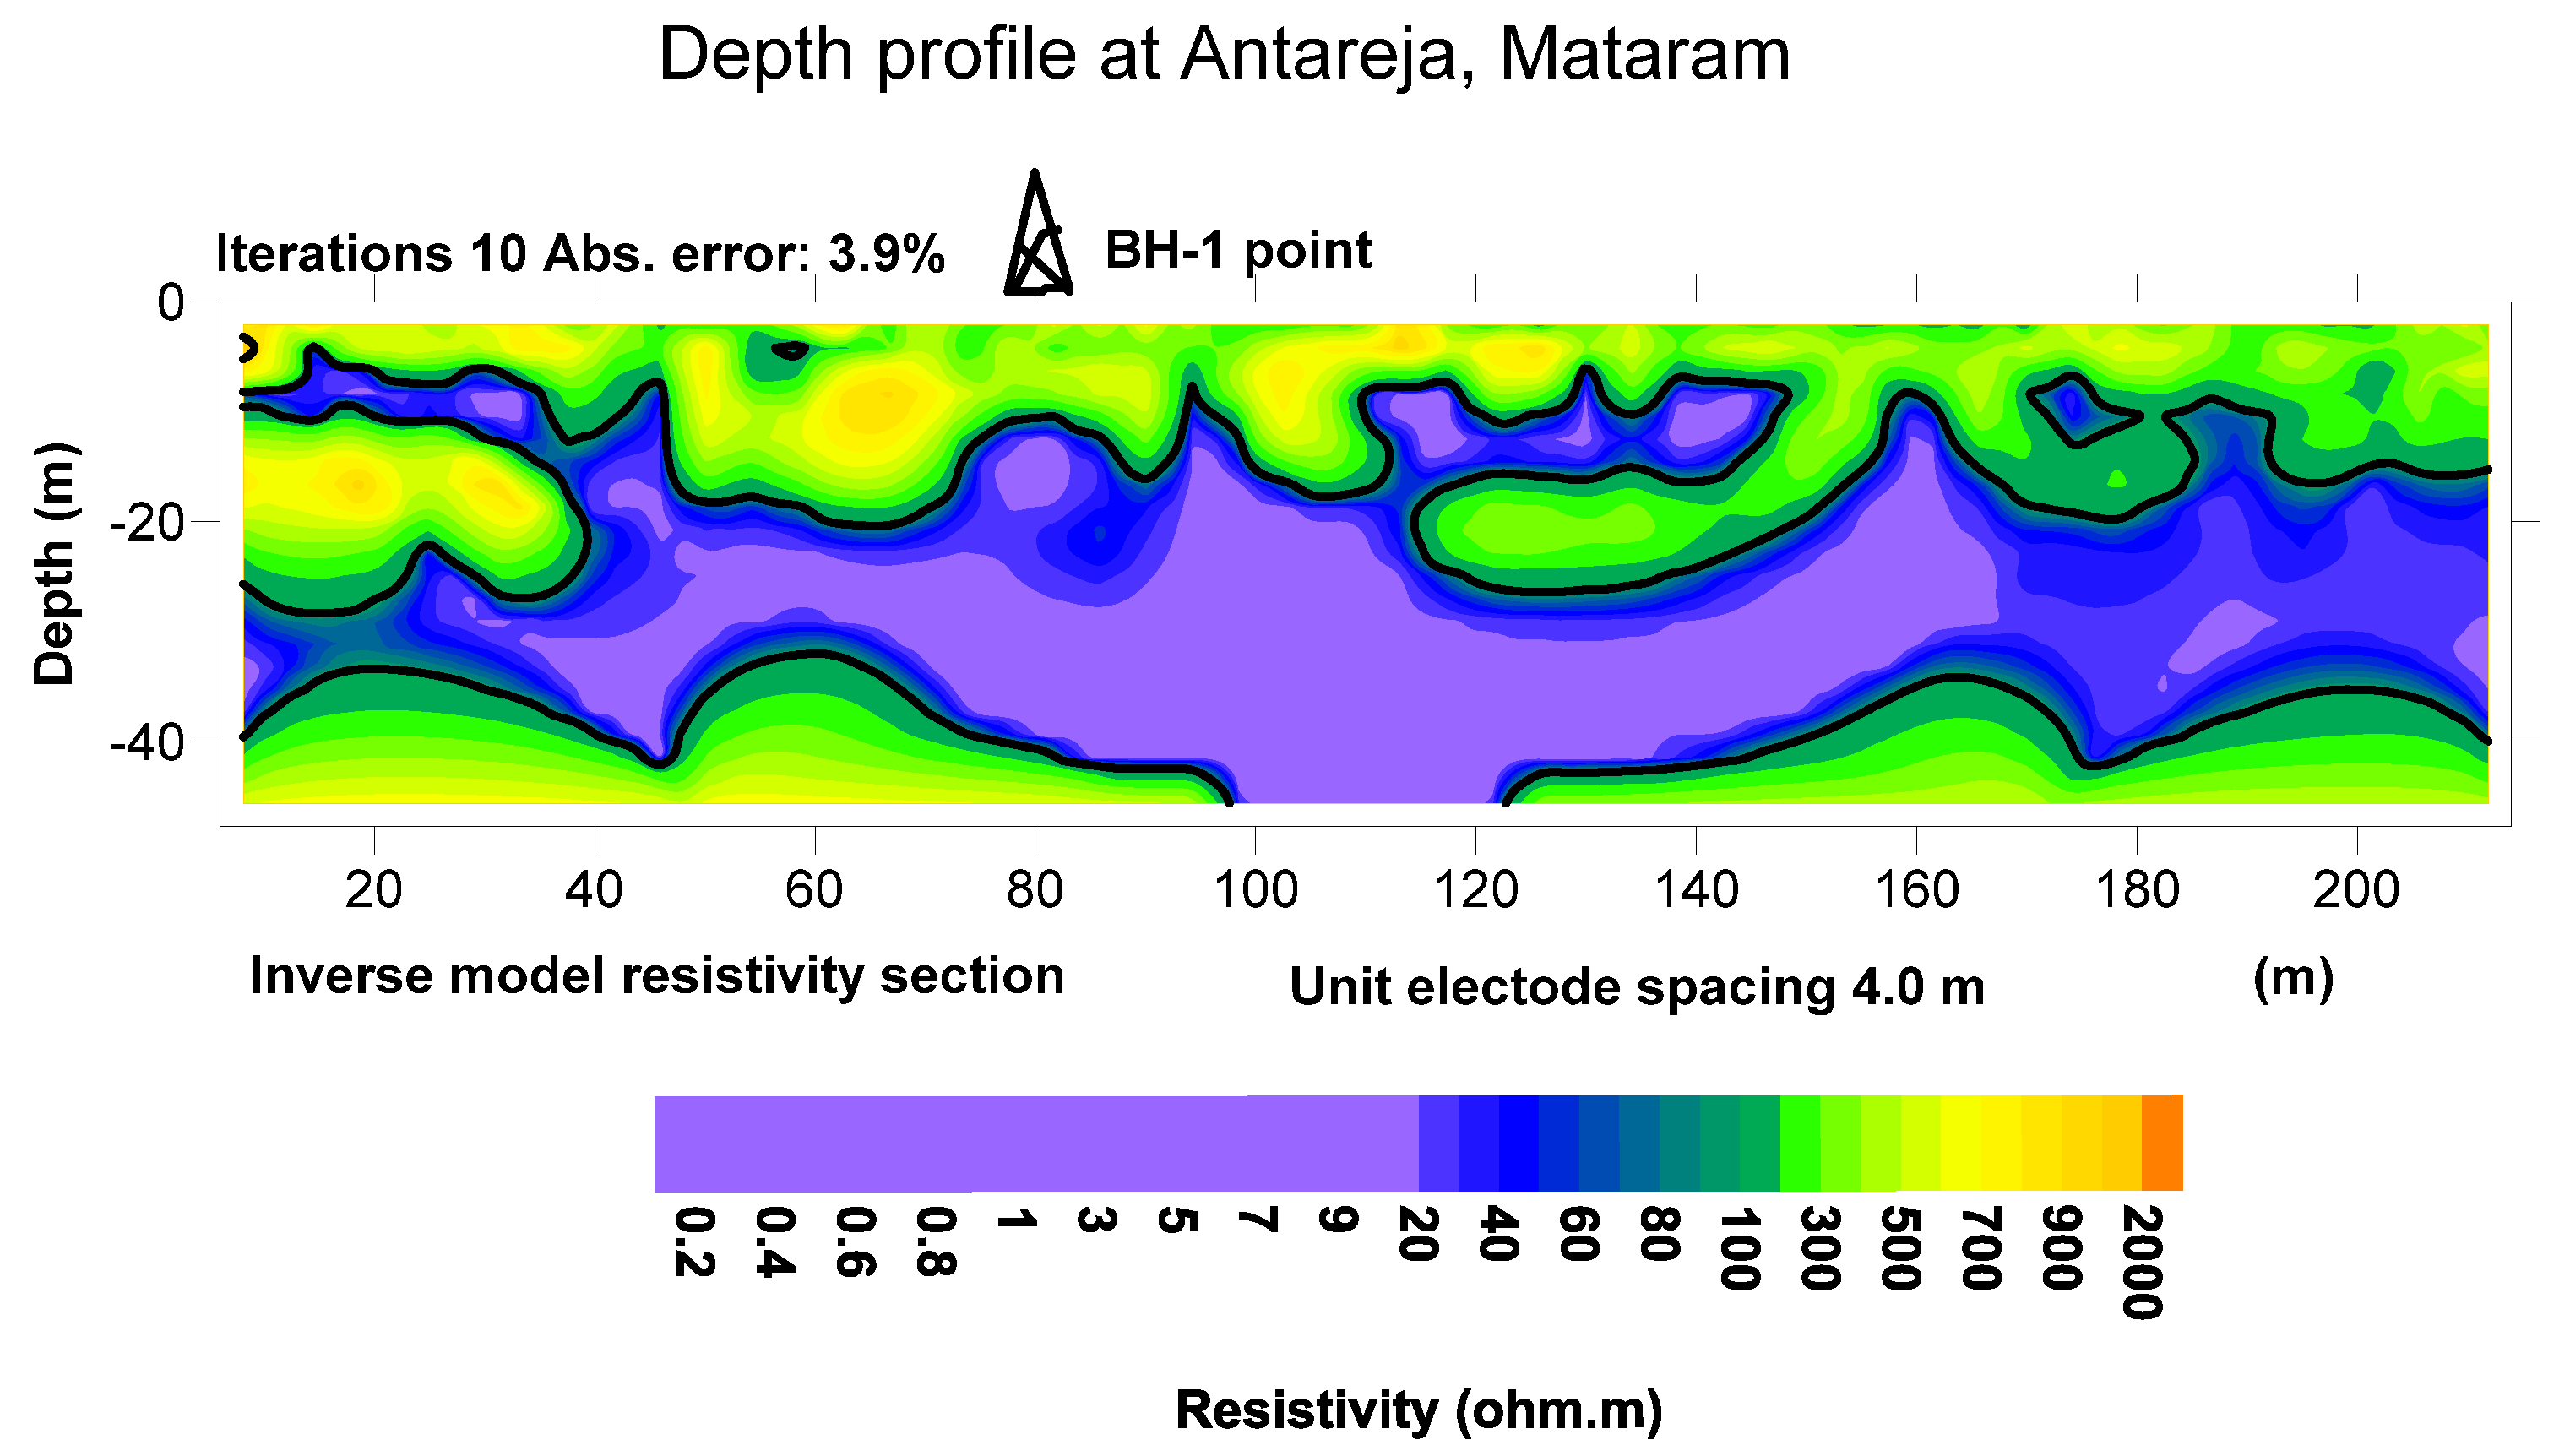
Table 3 and
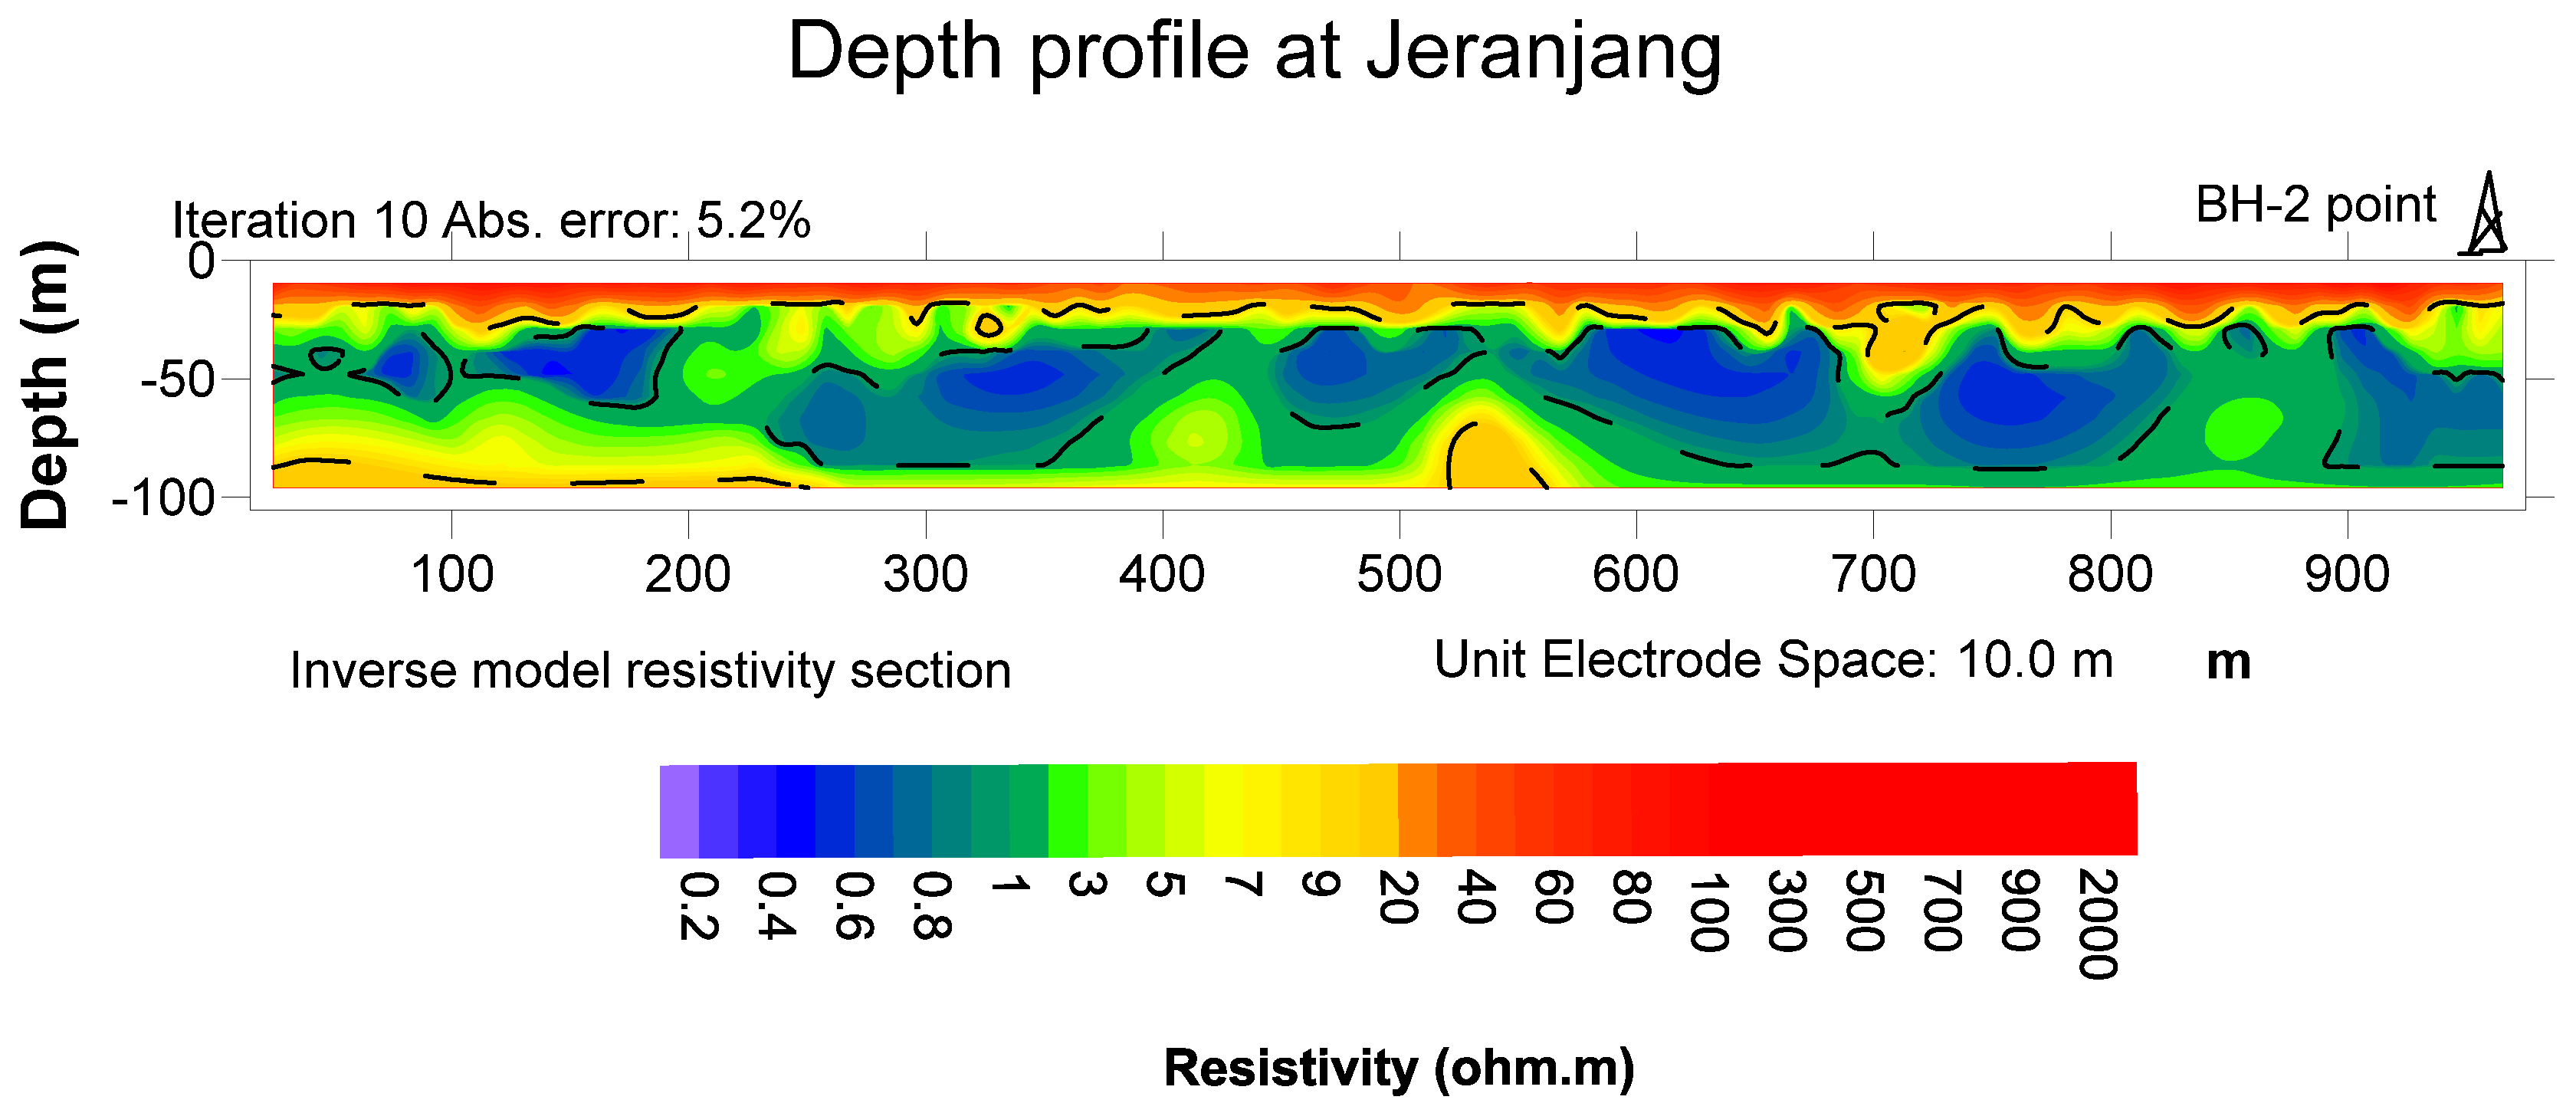
Table 4 and
Figure 7 and
Figure 8 describe samples BH-1 and BH-2 (
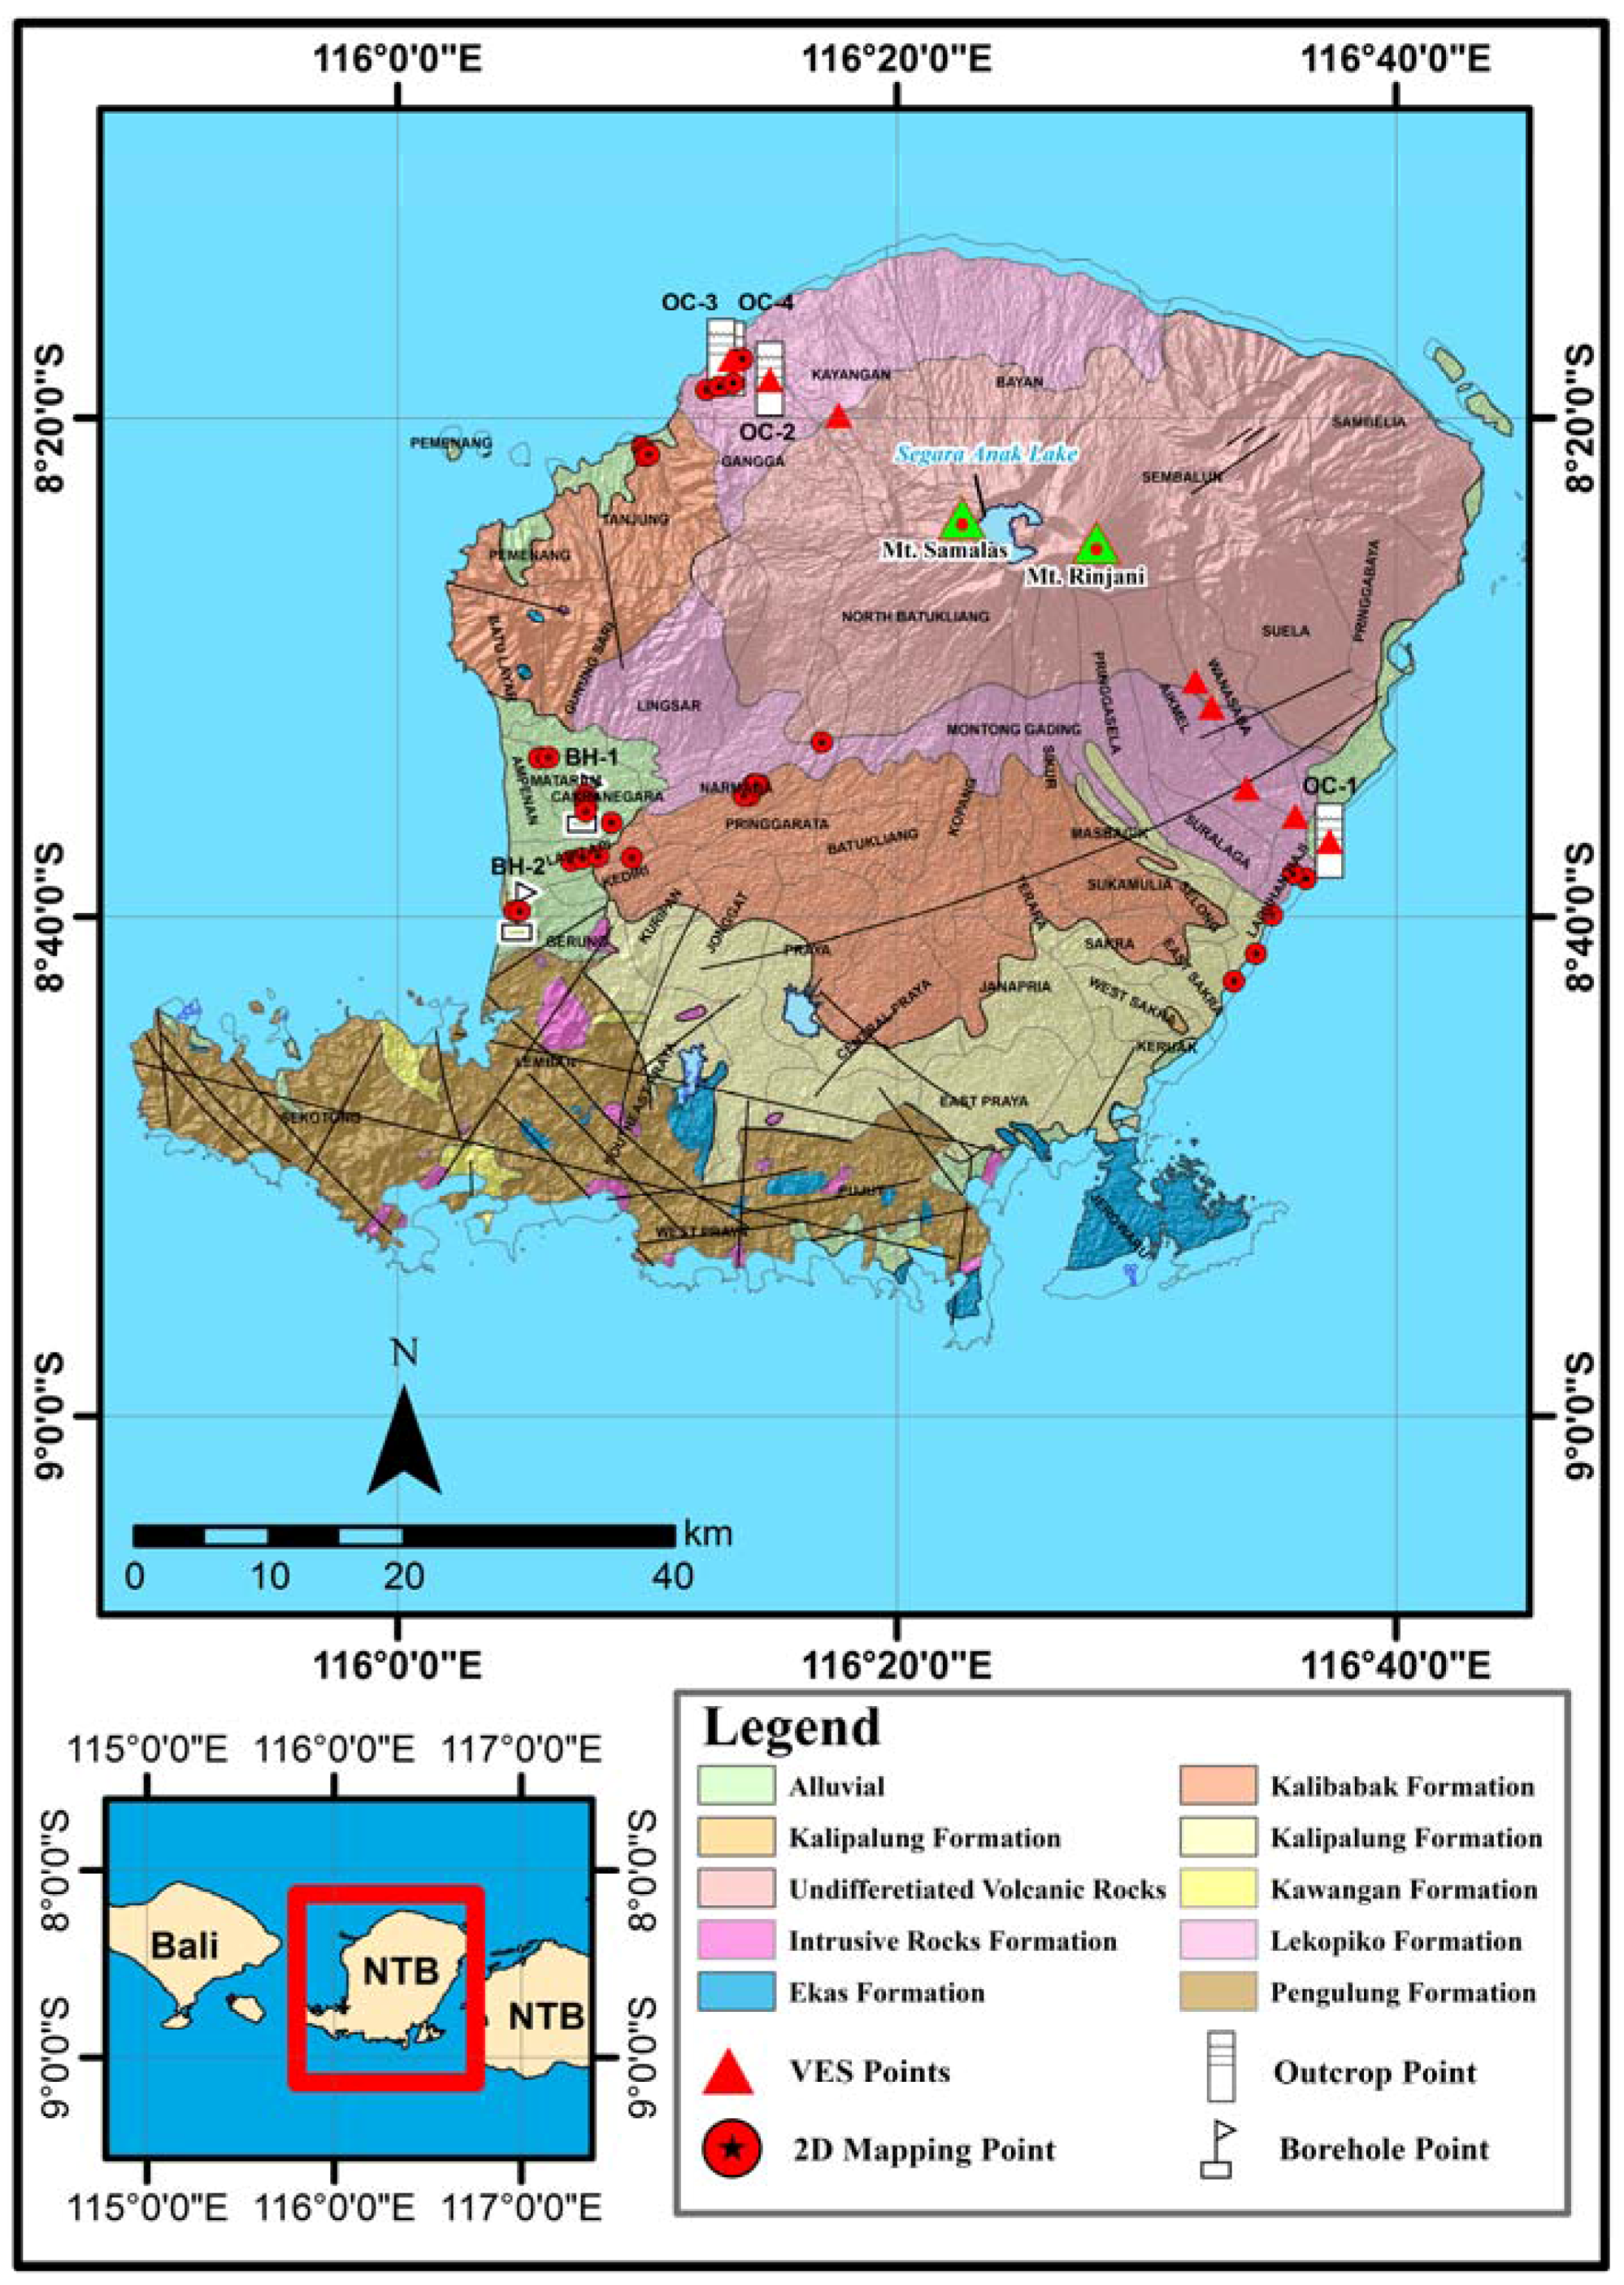
Figure 1 and
Figure 10) in Antareja, Mataram, and in Jeranjang, West Lombok. Furthermore, the data inversion results were interpreted, validated, and then analyzed to create an isopach map as in
Figure 10. The next job was to analyze the geomorphological effects on the isopach value to create an isopach profile of the Lombok Island (
Figure 11). While the distance to the source of isopach site was used to analyze the profile distance function of the isopach to the source (
Figure 12).
VES data which had been processed (
Figure 3 and
Figure 5) were validated by the outcrop-based observations (
Figure 3b and
Figure 5b). Thus, the actual value of the resistivity and thickness of each layer were then obtained. Profile depth as shown in
Figure 3 was the result of the correlation of the three 1D inversion models S1, S2, and S3 (
Figure 3). The value of each of the three 1D inversion models (
Figure 4b), was synchronized with the Log lithology (
Figure 4c). Five resistivity soundings were conducted in Krumut beach (
Figure 5) in the same manner, obtaining the in-depth resistivity profile (
Figure 6a), which matched with the outcrop (
Figure 5b), and then the average Log-resistivity was obtained (
Figure 6b).
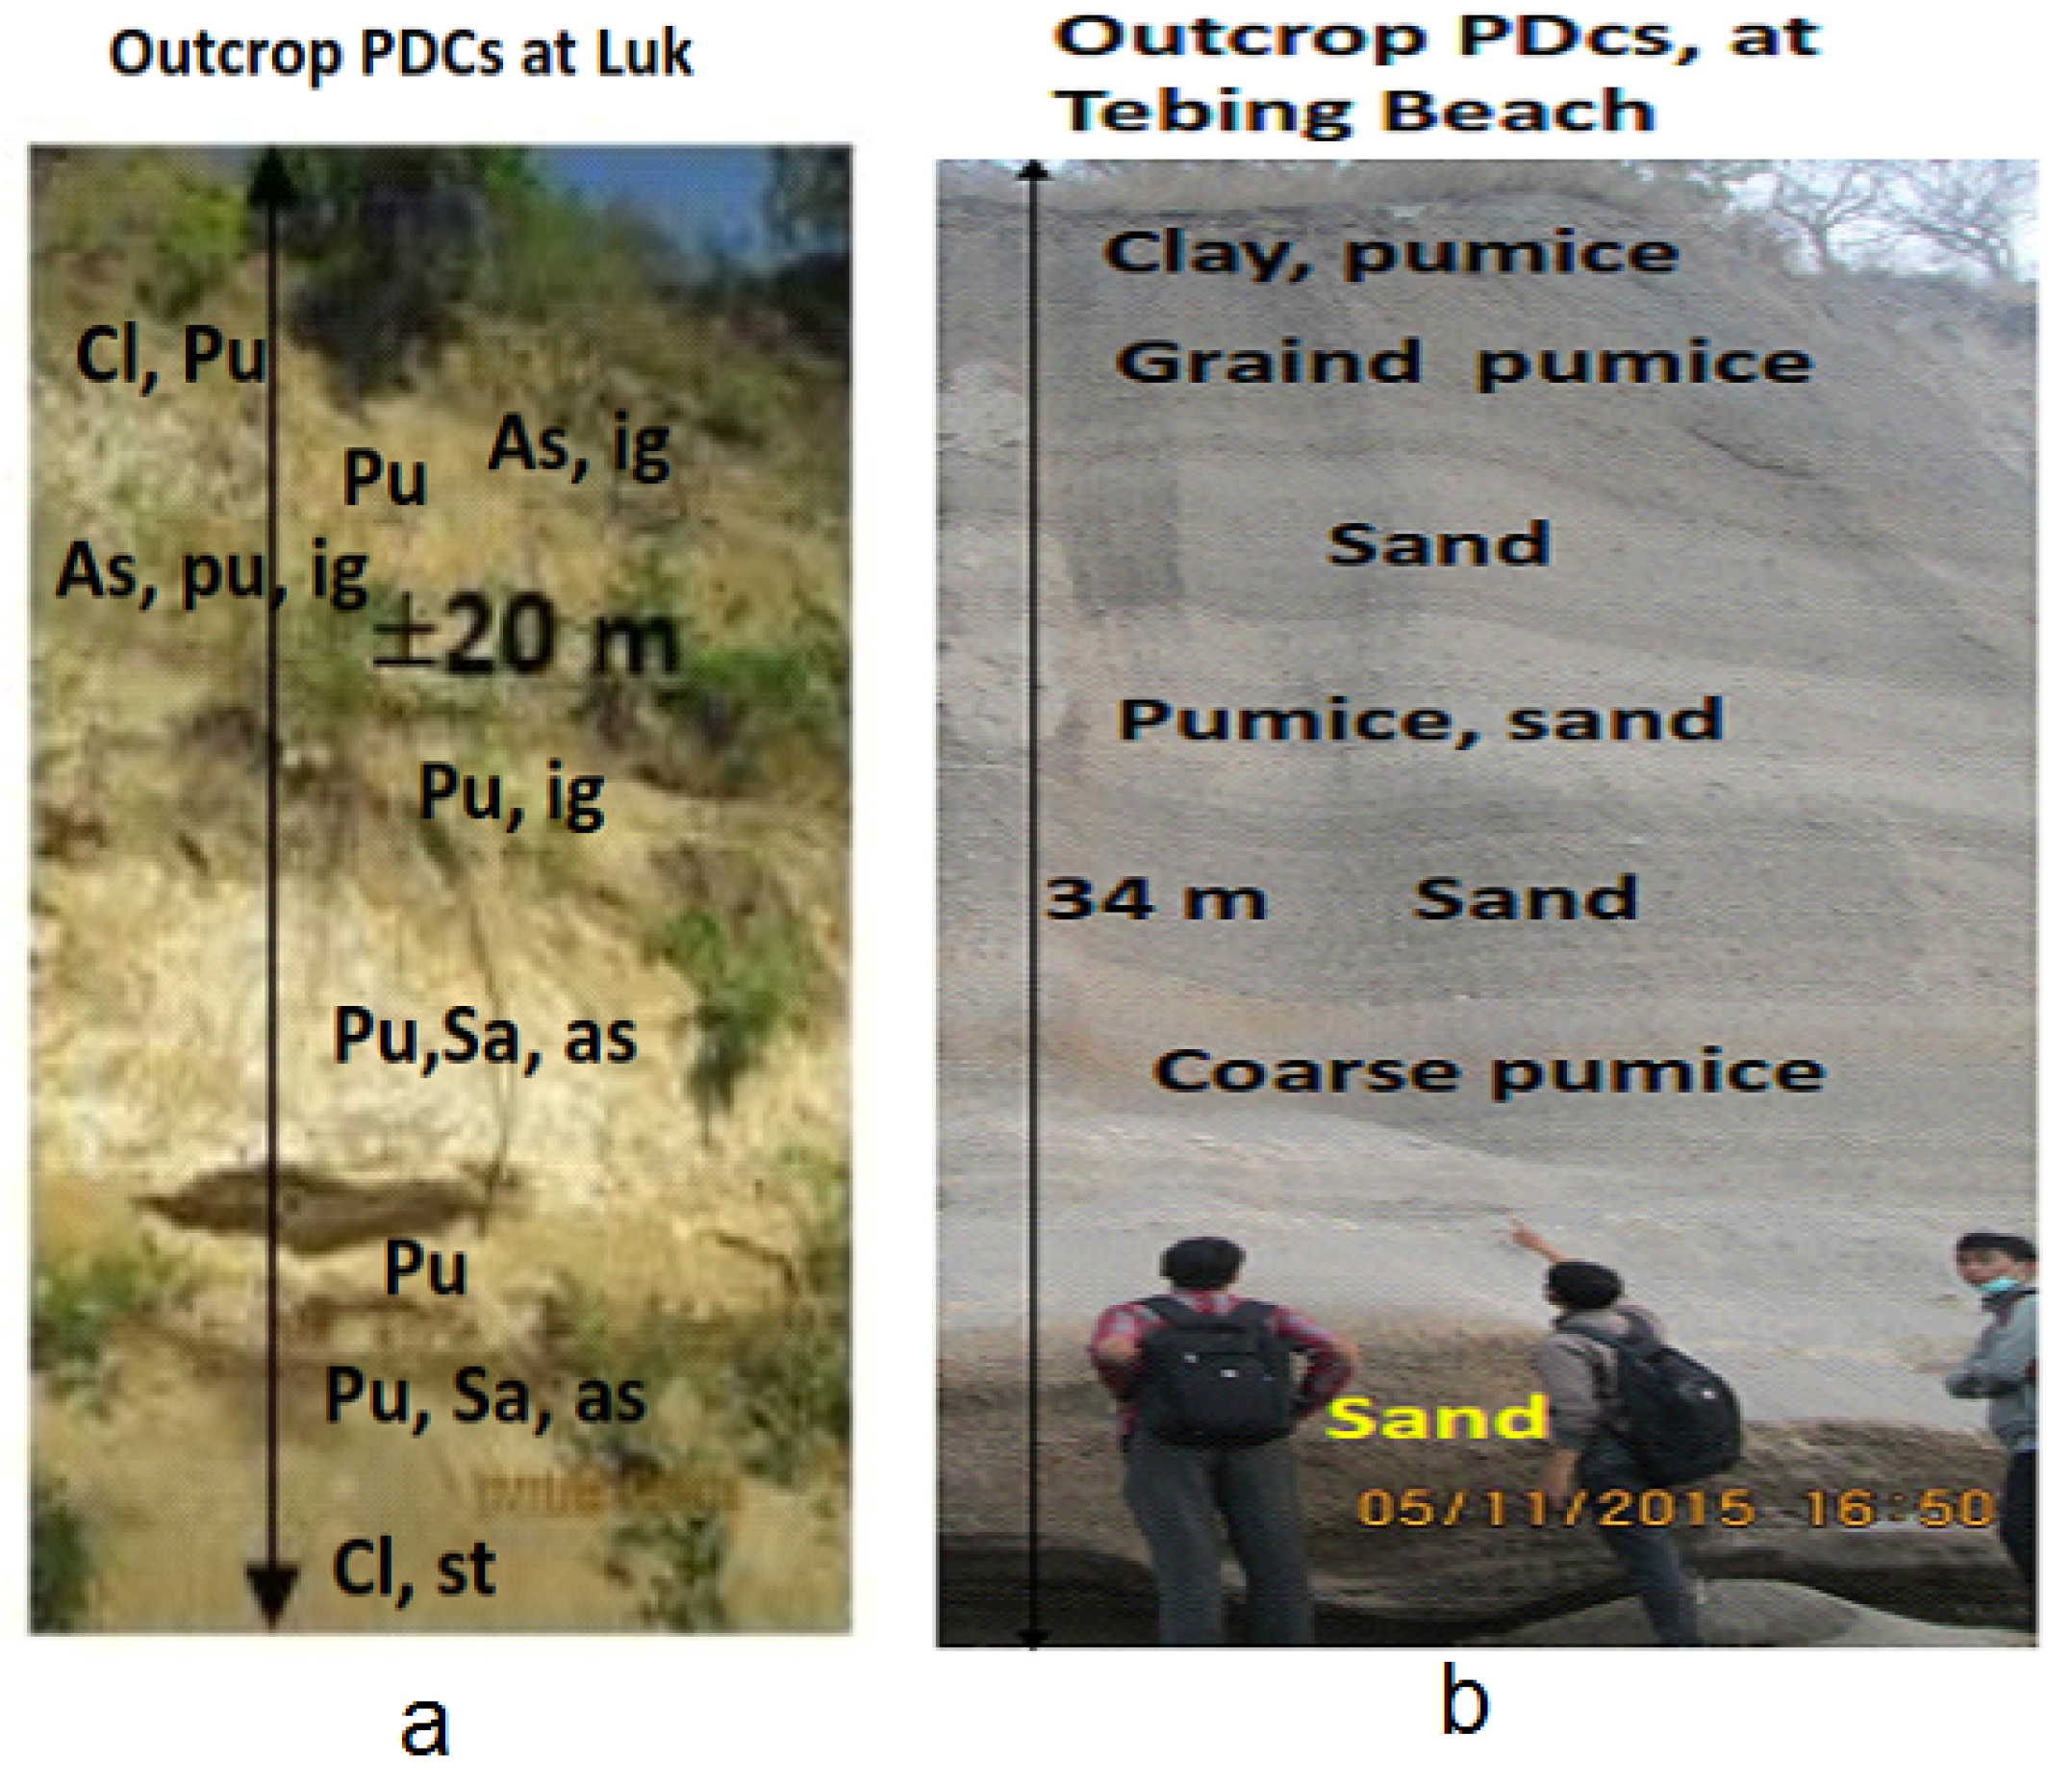
PDCs outcrop stratigraphy in Lokok Meang-Luk and Tebing Beach is shown in
Table 1 and
Table 3. The outcrop stratigraphy is composed of rocks: clay, coarse and fine pumice, sand, and ignimbrite inserts (
Table 1 and
Table 2). The strata layers were alternating between clays, pumice, sand ignimbrites inserts.
The results of VES data inversion in
Figure 2 and
Figure 3, were interpreted as follows: the first layer with a resistivity of 706 Ohm.m value was dry clay with pumice stone inserts (outcrop of 0.80 m thick, close to the calculated average, 1.06 m). The second layer corresponds to granular pumice with 1.30 m thick and 775 Ohm.m of detainees’ value. The third layer was composed of sand and pumice stone inserts, with a thickness of 2.48 m and resistivity value of 180 Ohm.m. Next was a mud layer with a pumice stone inserts, a thick layer of 5.66 m and resistivity value of 186 Ohm.m and an average depth of 9.14 m. The fifth layer was a 11.86 m thick claystone with resistivity values of 926 Ohm.m and was located at a depth of 17.52 m. The outcrop in
Figure 3 and
Figure 4 was located near the audible S1.
Profiles in
Figure 5a showed the bedding level of Krumut beach a 0.75 m thick layer of clay with resistivity value of 127.04 Ohm.m (
Figure 5b). The second layer consists of pumice with a resistivity value of 188.80 Ohm.m and thickness of 0.73 m (0.80 m on outcrop). The thickness of the third layer is 0.92 m (0.80 m thick) and 364.80 Ohm.m in resistance value which consists of alternating layers of sand with a thin layer of pumice sand. The fourth layer was filled by a thick layer of pumice by 0.95 m (0.80 m on riel value) and resistivity value of 276.40 Ohm.m. The fifth layer had a resistivity of 447.60 Ohm.m and 4.62 m thick sand and ignimbrite insert, and the sixth layer, defined as a rock with a thick clay 16.20 m and 245.04 Ohm.m. The innermost layer (23.21 m) had a resistivity value of 99.45 Ohm.m which could be detected and interpreted as sandstone. The next job was to interpret the 2D mapping data, as many as 35 lines at 9 locations.
The first section of the 2D resistivity was Antareja crossroad in Mataram (
Figure 7). This measurement site was the largest alluvial area with an average altitude of 15–16 m a.s.l. The 2D trajectory mapping was performed with electrodes spaced 4 m and 220 m long track to the North-South direction. The results of 2D inversion (
Figure 7) had a wide range of resistivity values from 0.2 to 2000 Ohm.m with an error rate of 3.9%. The results were validated by drilling samples (
Table 3). Drilling at this location was taken at 80 m from the starting point of the track at a depth of 21 m from the surface.
Another 2D mapping was performed in Jeranjang, West Lombok (
Figure 8). The location was close to the Jeranjang beach. Data acquisition’s trajectory was directed perpendicularly toward the beach with the electrode spacing of 10 m and a total length of the trajectory of 970 m. Results of mapping 2D inversion (
Figure 8) at this location had a wide range of resistivity values of 0.2–2000 Ohm.m with error 5.2%. In this area, 1020 m was drilled in a position with a depth of 10 m. Drilling results and each lithologic log are shown in
Table 4.
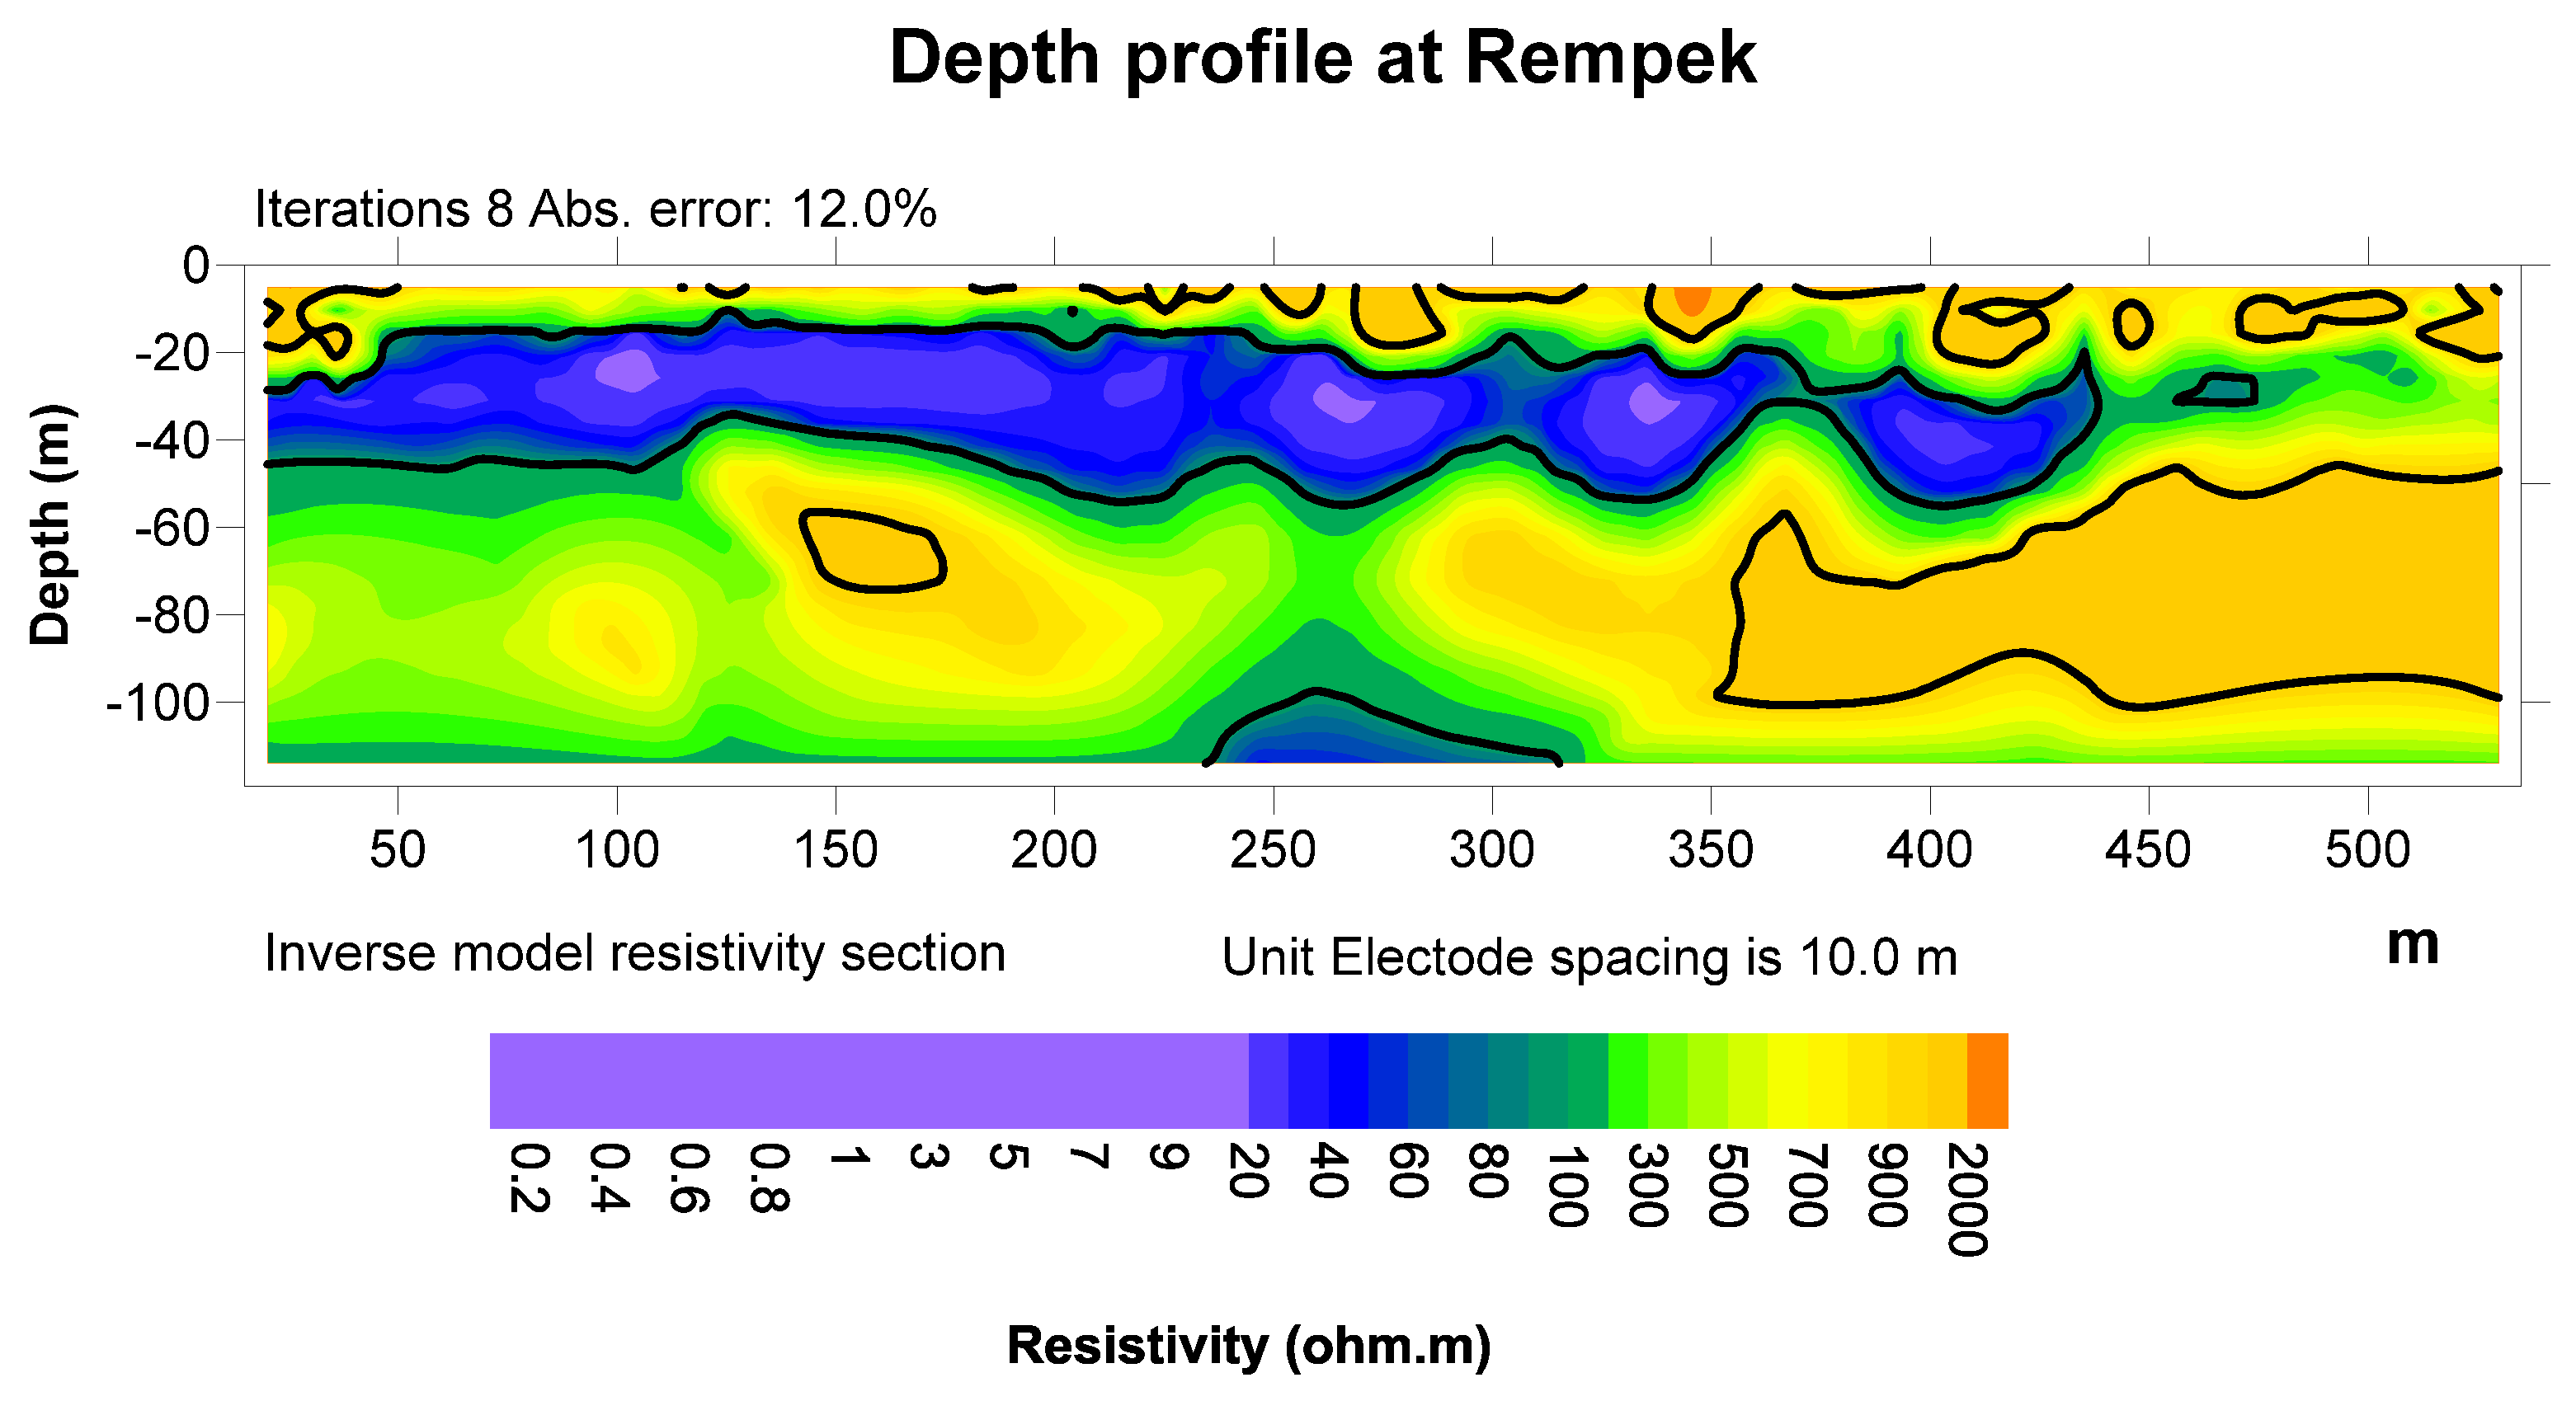
2D mapping was carried out well in some upland areas (>600 m a.s.l.) for example on Batu Ginjang-Rempek (≥900 m a.s.l.) Northwest of Mount Rinjani. This area is quite flat and wide. The data acquisition at this location were: two lines spaced 2.5 m and 4 lines spaced 10 m. Tracks 137.5 m minimum and maximum 1390 m. 2D geoelectric cross-section (
Figure 9) is one of the inversion results at this location, with error 12.0%. Resistivity values ranging from 0.2–2000 Ohm.m and a maximum depth of 119 m were the maximum depth of investigation detected. Furthermore, the interpretation of the results of the mapping of 2D inversion is described as follows.
The 2D resistivity’s cross-section in
Figure 7 was grouped into three layers. The top layer has resistivity values ranging (150–2000) Ohm.m with an average thickness of 13 m. The first layer was composed of rocks: clay, sand, gravel, coarse grains of pumice stone, mud, black sand and smooth (see
Table 3 and
Figure 10a), alternately until a depth of 28 m. The second layer with resistivity values from (0.2–150) Ohm.m defined as fine sand, black mud and at a depth of (7–13) m. The third layer having resistivity values: (150–2000) Ohm.m, defined as silt and fine sand saturated with water. This lithology filled the layer to a depth of 47.0 m and was interpreted as paleo-topography. Paleo-topography is the topography of area before the massive eruption of Mount Samalas. High resistivity values (≥150 Ohm.m) was found in the third layer at a depth of 47 m. As elsewhere, this layer was interpreted as the bedrock.
The 2D cross-section’s resistivity in
Figure 8 was interpreted as follows: the first layer has a resistance value from (20–2000) Ohm.m with an average thickness of 17.0 m. Based on the drilling data, this layer was filled with clay, sand, pumice granules, fine sand, silt and coarse pumice stone, filling depth of (0–17) m. The second layer had a resistivity value of (0.2–20) Ohm.m. This low resistivity values occupied a depth of (17–27.9) m. The final layer with the depth of 81.9 m and a value of resistivity more than (1.5–20) Ohm.m. The same thing in
Figure 9, with a high resistivity value: (150–2000) Ohm.m, was located on the surface to a depth of 17 m and was defined as a layer of volcanic deposits. Second, the value of resistivity: (0.2–150) Ohm.m with a thickness of 29 m. The third layer had a high resistivity of (150–2000) Ohm.m with the depth of 45 m. The second and third layers were treated respectively as paleo-topography and bedrock. The phenomenon of high resistivity values in the first and third layers also occurred in 35 other cross-sectional resistivities. The first layer was interpreted as a layer of volcanic deposits and the third layer as the bedrock. Low resistivity values in the second layer were interpreted as paleo-topography.
4. Discussion
Inversion models from 24 VES which cross the island of Lombok (
Figure 1), composed of type curves [
20,
21]: type HKH, 25%, KHKQ, 12.5%, Type HK and KQH respectively 8.3% and 11 other types respectively 4.2%. The VES inversion model in
Figure 3 and
Figure 5, both of are, showing the resistivity values of level bedding with high, medium and low, as the characteristics of the sediment. The data of VES model in
Figure 3 was acquired from the slopes, and in
Figure 7 was acquired from alluvial areas. Both data VES models were very helpful in mapping the layer of volcanic deposits with great details in the vertical direction. A layer of volcanic deposits as described above, particularly a layer of pumice in
Figure 4, had a resistivity value of 700 Ohm.m, while pumice in
Figure 6 reflects the value of resistivity of 180 Ohm.m. The values’ comparison was much smaller than that in the slope areas.
This condition could be explained because of the physical characteristics of pumice itself and environmental conditions of deposition. Resistivity values are influenced by saturation, alteration and porosity variation together with mineralogical compositions. Pumice, in both slopes and alluvial areas, has the same various porosity and composition because it was acquired simultaneously in one event time and the same source, Mount Salamas. Pumice in both areas also was altered. Pumice stone in sloping areas possesses physical characteristics: over the shaft, the pores are filled with air, more rugged, shape and geometry various and waterless as we see in
Table 1 and
Table 2. These characteristics are contributed to increasing resistivity value. Meanwhile, the physical characteristics of pumice in alluvial areas (
Figure 6) was more compact and saturated where its pores were filled with clay or water. Both clay and water contribute to reducing resistivity value.
Secondly, the drier the depositional environment was, the more homogeneous and shaft it would be. They were the factors that caused the higher value of resistivity of pumice on the higher slopes. On the contrary, in alluvial depositional was relatively more humid and heterogeneous, as we see in
Table 3 and
Table 4, characteristics lithologic of the sample borehole in Antareja, Mataram (BH-1) and Jeranjang, West Lombok (BH-2). The borehole data was used to constrain models. Such is the case with alteration, where the rock started having reduced resistivity value treat. The same thing, if rocks contain water or clay.
The outcrops of volcanic deposits were at Krumut beach (
Figure 6), particularly the layer of pumice in the second and fourth layers. The second layer had different physical characteristics compared with the fourth layer. The differences in these characteristics showed there was an eruption event in two different phases. The first stage, pumice which was located on the fourth layer had the following characteristics: oval, reddish, size of (106.25 × 78.65) mm, porous, and could be destroyed by finger. The thickness of the layer was 0.5 m and was located at a depth of 1.80 m. The average resistivity value was 276.40 Ohm.m. At the second stage, characteristics of pumice layers of oval, rough, porous, brown, very pivot and fresh. These outcrops were located on the second layer with an average thickness of 0.30 m and resistivity value of 188.90 Ohm.m. Other similar outcrops were found in the northwest of Mount Rinjani, in Tebing beach (OC-4), Lokok Meang (OC-3), Lokok Piko and Anyar beach.
The second type of outcrops, which had different characteristics from the previous outcrops, was located at Medana, Samba, Sanjajak, Batu Ginjang, and Sembalun. The outcrops generally became the topographic coat and closer to the source. Outcrops came in the form of clay, pumice, and sand. The pumice’s physical characteristics: oval, fresh, and sorrel. The third kind of outcrops was found in the southern part of Mount Rinjani at Benang Kelambu, Benang Stokel, South Batukliang, and Barabali-Kopang as well as in the Southwest of Penimbung to Bukit Tinggi. To the next, we were discussion the result of ERT.
The 2D inversion models indicated three unit layers with high resistivity contrast as shown in
Figure 7,
Figure 8 and
Figure 9. The
Figure 7 and
Figure 9 showed three units of the layer where a layer of volcanic deposits located in the uppermost layer with high resistivity values more than 150 Ohm.m, while in
Figure 8 the uppermost layer has high resistivity of more than 20 Ohm.m. Meanwhile, low resistivity (<150 Ohm.m) in Antareja and Rempek while in the Jeranjang, the resistivity less than 20 Ohm.m. The second layer, we interpreted as the
Paleo-topography. The third layer is a layer of bedrock with high resistivity values (20–2000) Ohm.m.
For the 2D geo-electric cross-section, the inversion results show the same layering pattern, characterized by a contrasting resistivity pattern. The changing pattern in the value of resistivity was in sharp contrast to the vertical direction, i.e., from a high value to low resistivity value. Then followed by a change from a low value to high value again. In contrast to the variation of the horizontal direction and isopach thickness, the resistivity almost had the same value. High resistivity values (>150 Ohm.m) in the uppermost layer showed the volcanic deposits. Volcanic deposits consisted of clay, sand, pumice, ash, and PDCs. Low resistivity values (<150 Ohm.m) in the second layer was a reflection of the fine sand and black mud. The second layer was interpreted as Paleo-topography that existed before the eruption in 1257 AD. High resistivity values (20–2000) Ohm.m in the third layer was interpreted as bedrock consisting of sandstone and mudstone. To the next, we discussed about the influence of geomorphology, topography, and distance to isopach volcanic deposits. To answer this question, here is the isopach map analysis: an analysis of isopach across the source area and the function of distance from the source is shown in
Figure 11 and
Figure 12 below.
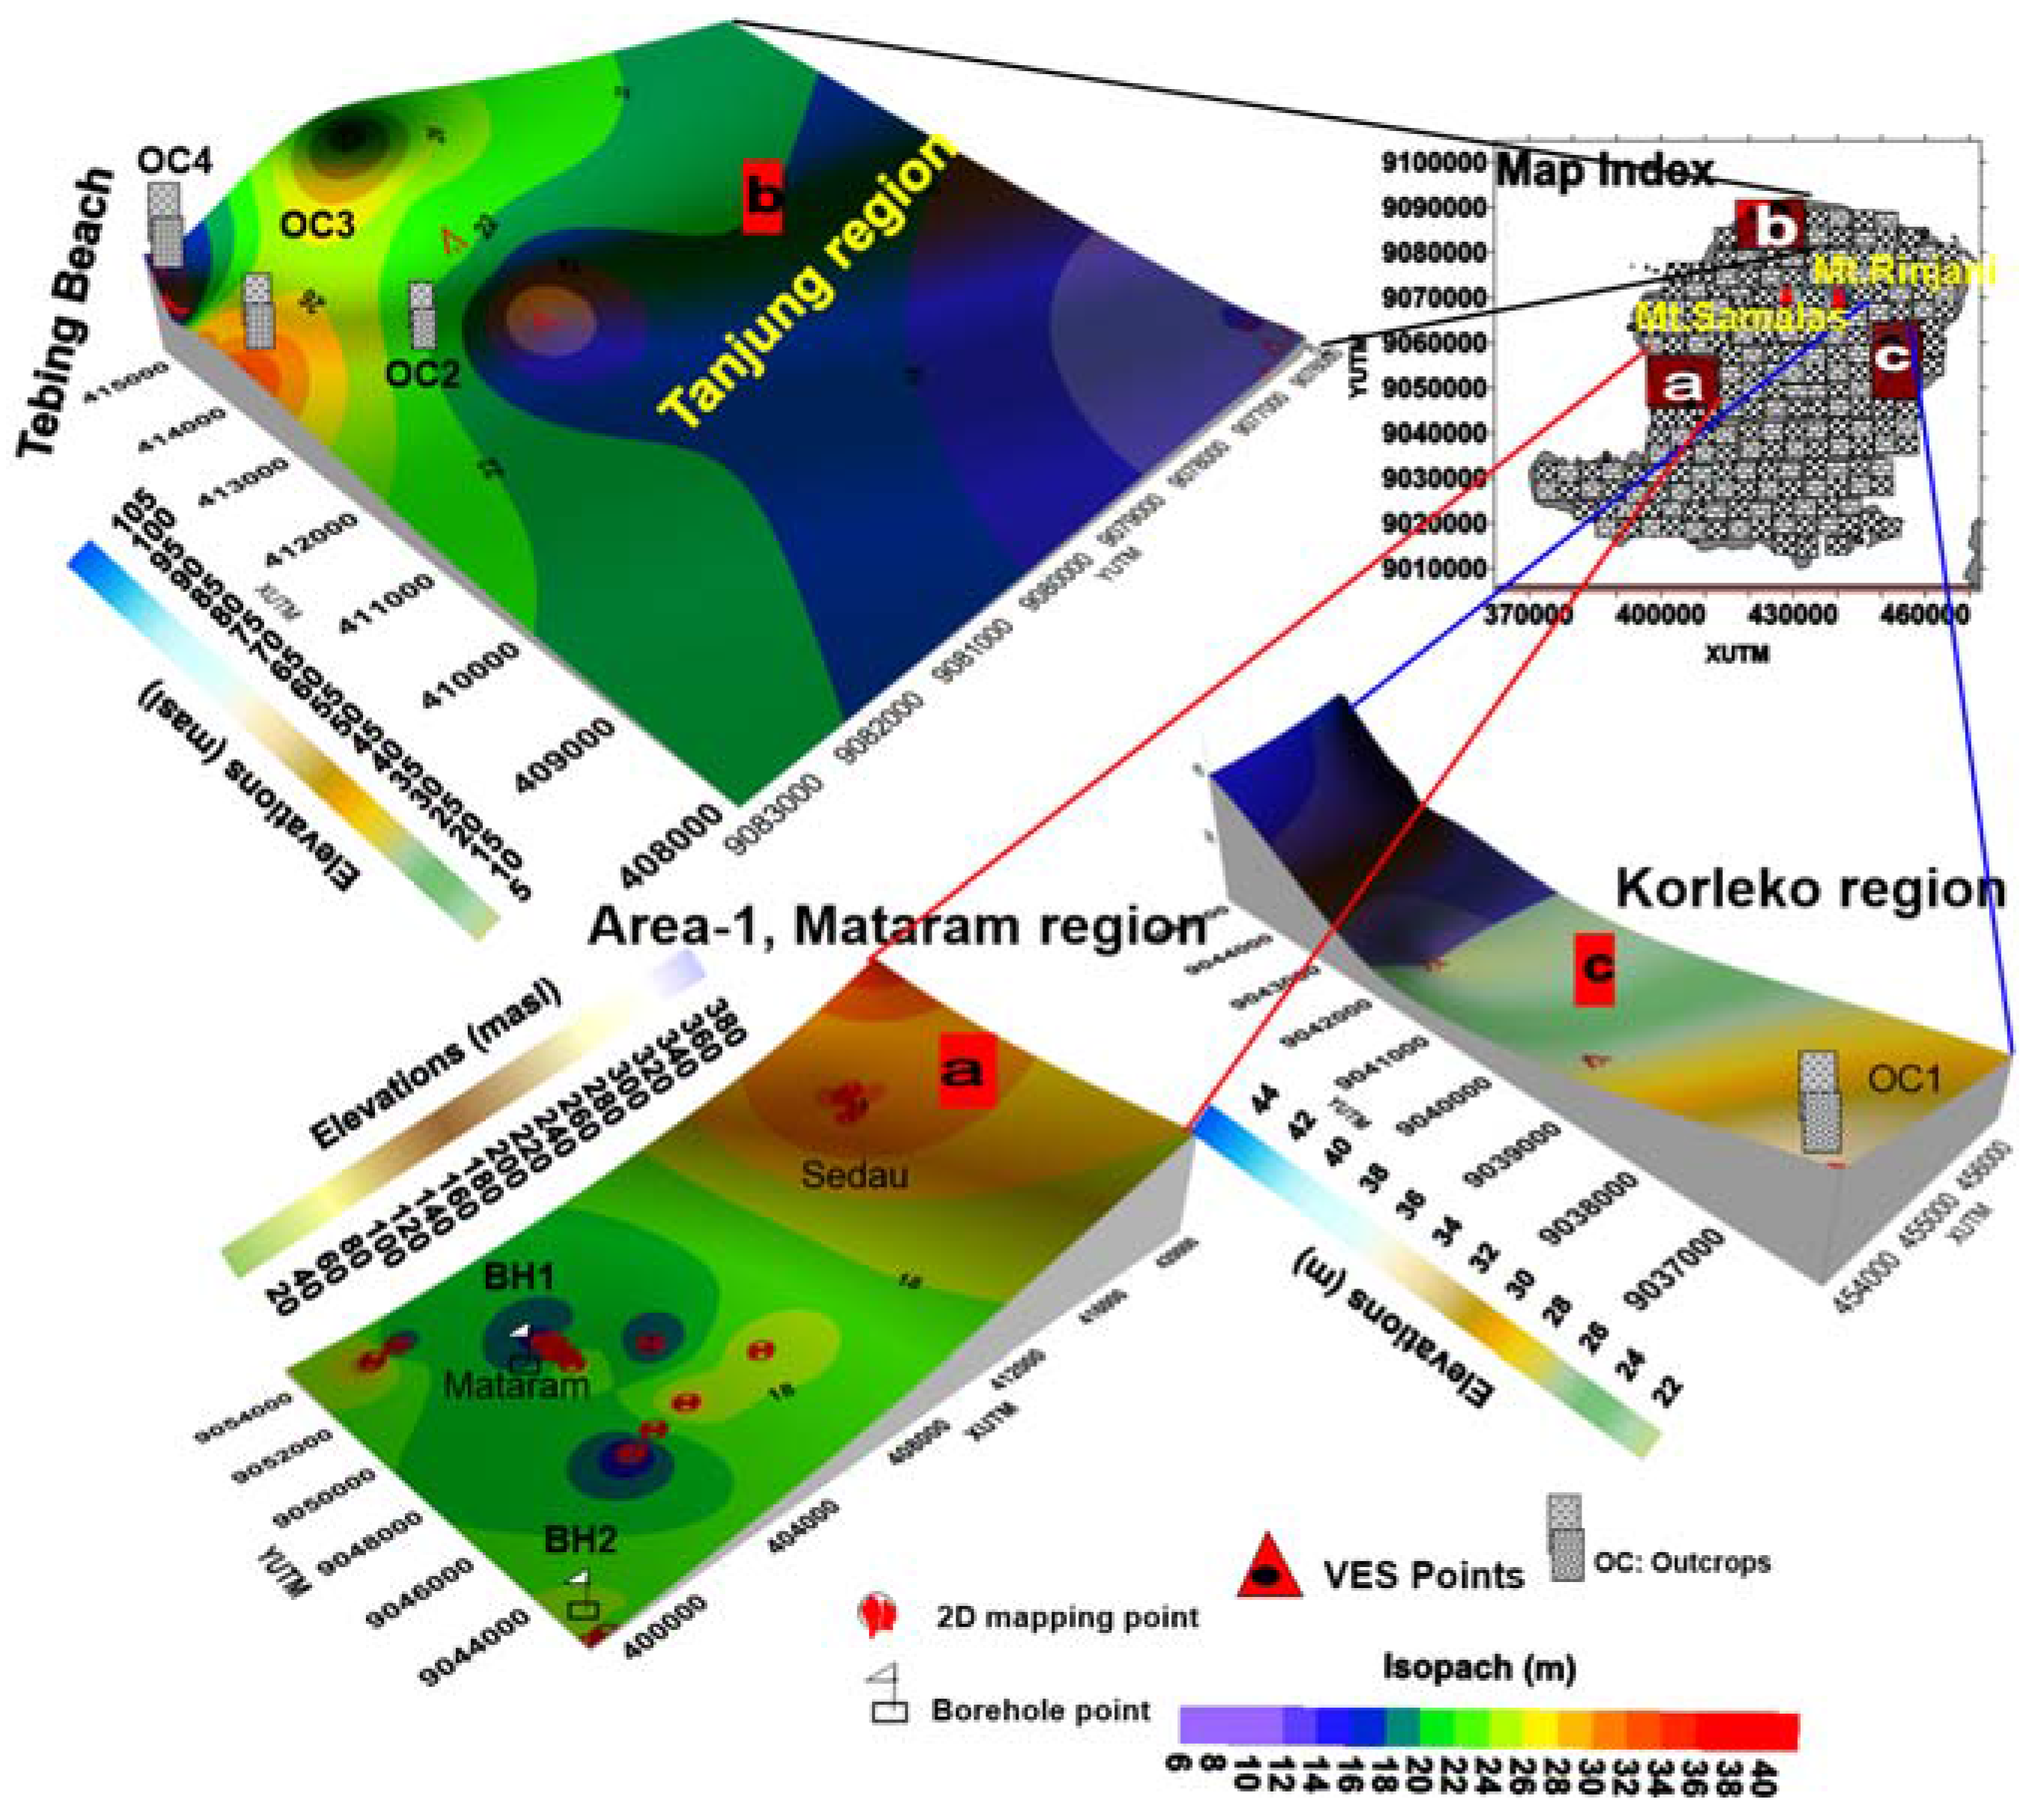
The isopach mapping of volcanic deposits (
Figure 11) was constructed from the interpretation of VES and 2D geo-electric mapping. Isopach map was divided into three main areas: Mataram, Tanjung, and Korleko. Thin isopach (<25 m) generally occupied an area of alluvial deposits, such as Mataram, Tanjung, and Korleko. Instead, thick isopach (>25 m) was found on the slopes, for example in Sedau, at Tebing beach, Luk, Rempek, and Mamben. The next thing is how influential the distance to the isopach value was?
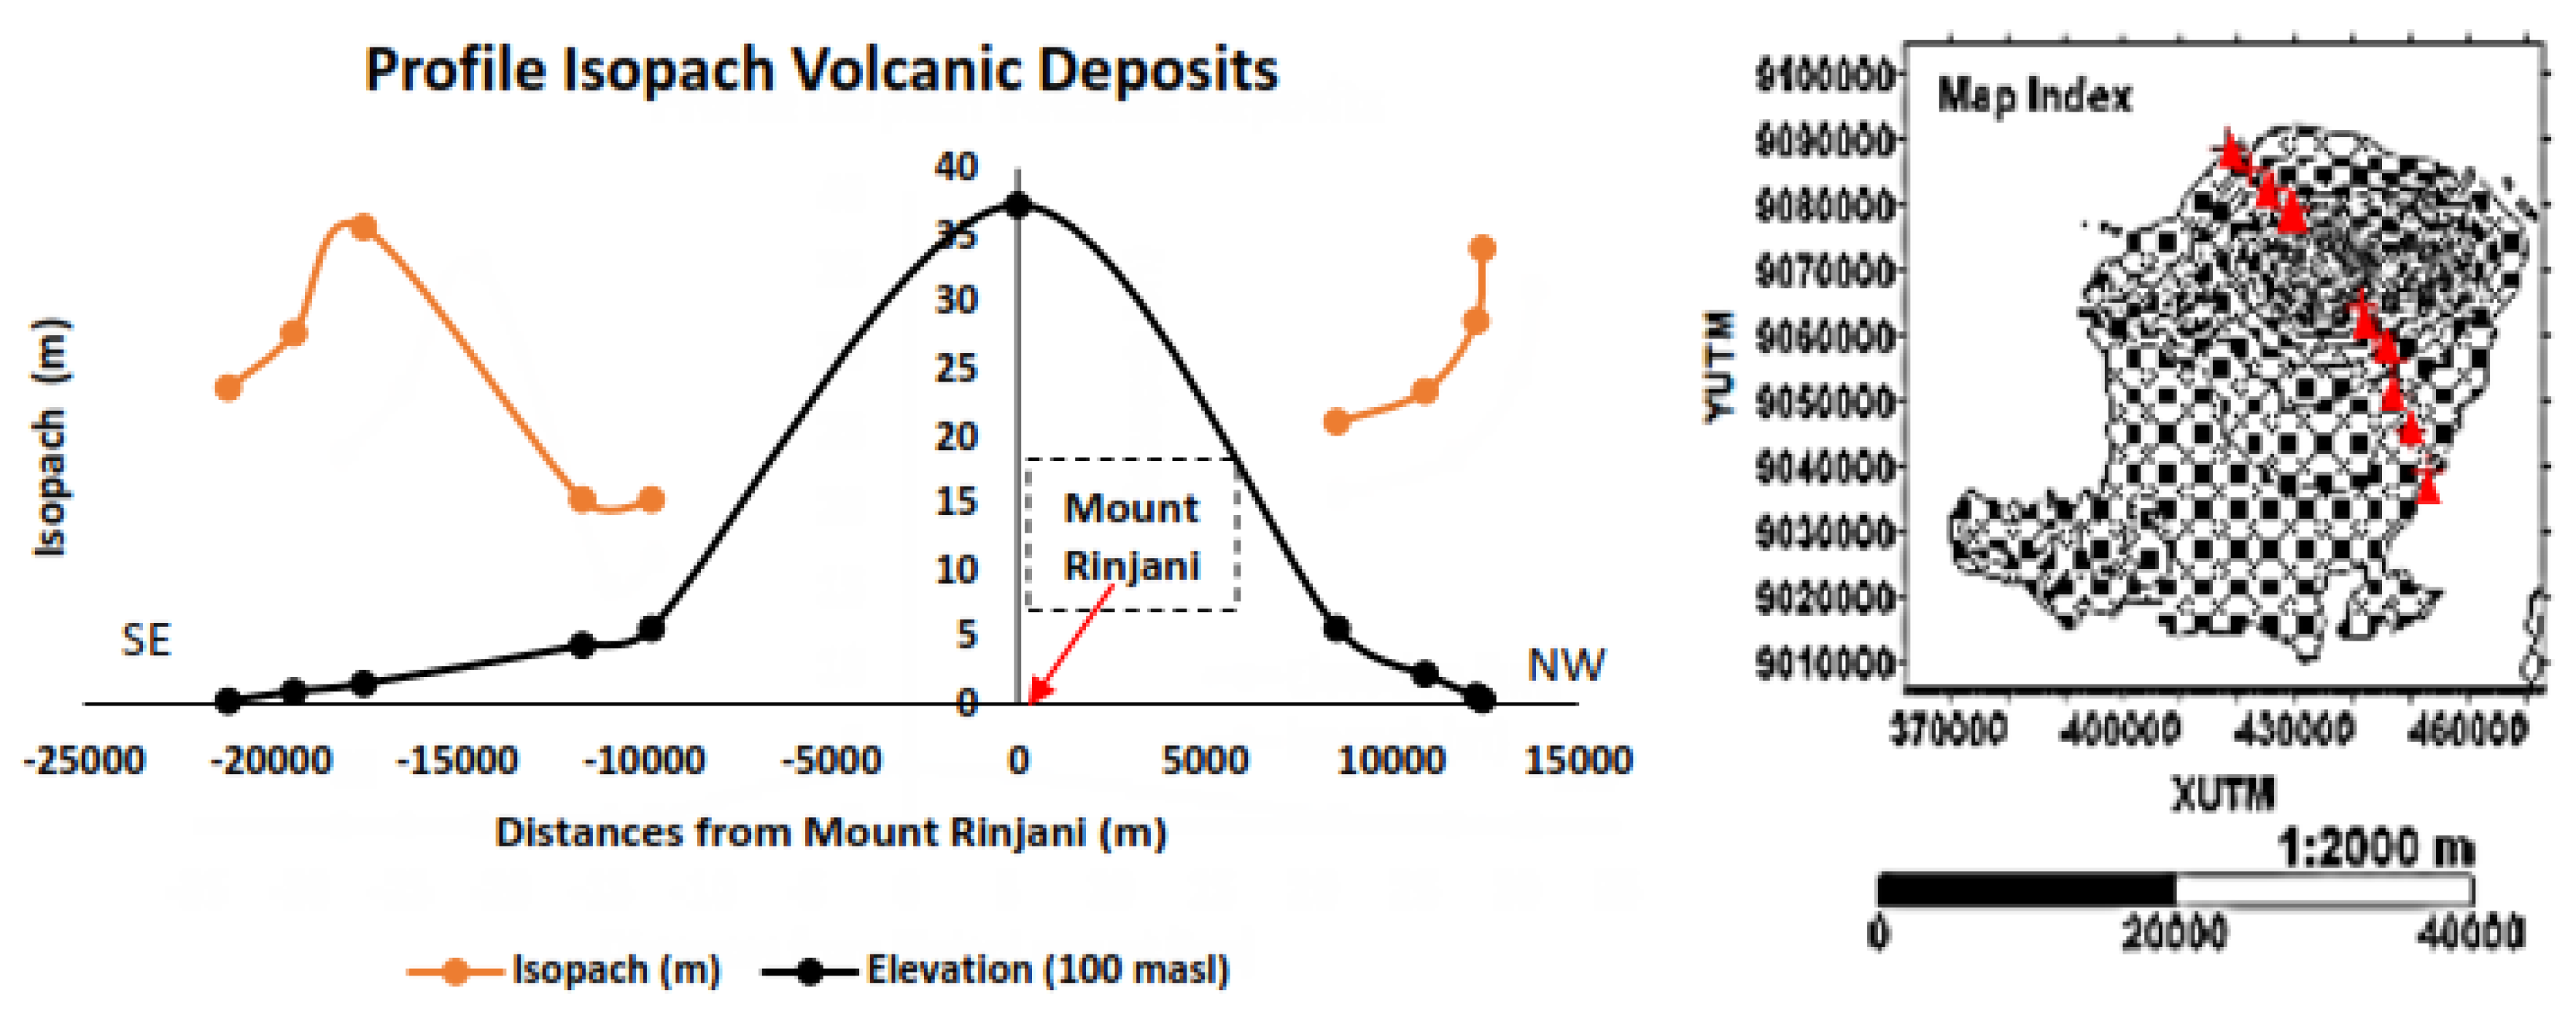
The isopach profile of volcanic deposits that crosses the island of Lombok was shown in
Figure 10. The profile was obtained from the inversion of 24 points of VES and 2 site outcrops in the direction of Southeast-Northwest. Isopach seemed not linear from the source (zero distance) to the beach in both crossed directions. Isopach from a distance of 21 to 31 km to the North-West and in the 15 to 21 km to the southeast, both rose sharply. Conversely, at a distance of 21 to 28 km, the depletion of isopach was too steep. The maximum isopach in Southeastern was found in Mamben at a distance of 21.17 km, and in the Northwest that was in Tebing beach at a distance of 31 km.
The geomorphological condition of measurement location in the southeast of Karang Baru until Kembang Kerang was quite steep (see
Figure 10c). Furthermore, from Kembang Kerang to Krumut Beach, the geomorphological conditions tend to be ramps and flat areas. Thick outcrops (± 20 m) were found in the area of the ramps precisely in Ladon-Mamben Lauq. While the geomorphology at Northwestern of Mount Rinjani from Sanjajak to Tebing beach was a fairly steep. A thick PDCs was found at northwestern like: in Lokok Meang_Luk (OC-3) is 20 m and Tebing Beach (OC-4) is 34 m (
Figure 1,
Figure 11 and
Figure 13).
The thick outcrops above were generally dominated by PDCs, both in the East and in the West Sea. PDCs layers consisted of clay, pumice stone, and alternated with layers of sand and volcanic ash and inserts of ignimbrite. These thick isopachs were located at specific points. It showed that the topography did not affect the value of the isopach (see
Figure 10). In the next paragraph, we discuss the affects of distance sites to the isopach value.
The profile of isopach geomorphology function (
Figure 12), which are the distance measured from sites to the source, is shown in
Figure 1. The distance was measured based on the position of the measuring point from Mount Rinjani, as the source. The consecutive point of measurement: 24 VES, two outcrops, and 35 geoelectric 2D mapping. The note is that isopach rose sharply to the NW from a distance of 21.20–30.83 km, and to the east SE at a distance of 14.76 to 21.17 km. A maximum isopach (34 m) occurred at a distance of 30.83 km to NW, precisely at the Tebing Beach, and isopach 35.60 m at a distance of 21.17 km to the SE, especially in Mamben. Isopach was sharply reduced from a distance of 30.83 to 50.36 km to the NW and at a distance of 21.17 to 30.51 km (
Figure 12) in the SE Mount Rinjani and Mount Samalas.
Isopach deployment directions showed the dominant effect of the wind at the time of eruption [
1]. The isopach of volcanic deposits on slopes was greater than in the alluvial areas. The sufficient distance to the source became the factors that affect the value of isopach of volcanic deposits. However, the effect of isopach value was not very significant on the geomorphology for the fallout of deposition.
The field observations indicated that the main volcanic sediment, which consisted of precipitation of the fall, stream sediment and PDCs sediment as described by [
1]. The precipitated fallouts spread widely and evenly throughout the Lombok. Debris deposits generally cover (coat) topography, parallel layers (beds), good order, both relegated, a grain size of multi-mode, and widespread and evenly, as described by [
14]. The fall deposition was interspersed with sporadic wave (surge) pyroclastic, particularly in the area of alluvial re-deposition. The type of rock layers that made up the beds volcanic deposits included: clay, gravel, pumice sand, sand, pumice granules rough, silt and black fine sand, as described by [
15].
The VES data provided important information about isopach and paleo-topography. The applications of VES were very effective in mapping the volcanic deposits. The same thing had been performed by [
4,
20]. The 2D resistivity of geoelectric mapping was useful in distinguishing layers of volcanic deposits and the essential sediments, as had been conducted by [
8,
9,
20].
The results of this study were the first geophysical research in Lombok Island particularly the research associated with volcanic deposits of Mount Samalas. The application of geoelectrical method was one of the geophysical innovations especially for isopach mapping of volcanic deposits on the slope areas which were difficult-to-access areas. However, this research data was still lacking, especially to the South, Northeast, and Southwest as well as in the area of Segara Anak caldera. Preferably in the same study, the geoelectrical method, combined with another geophysical method, such as seismic refraction, seismic reflection and Multi Channel Analysis of Surface Waves (MASW). Second, further study of this research will be the analysis of the eruption’s dynamics of Mount Samalas in the past.
