Abstract
The western part of the island of Milos, Greece has undergone widespread, intense alteration associated with a range of mineralization, including seafloor Mn-Fe-Ba, sub seafloor Pb-Zn-Ag, and epithermal Au-Ag. The surrounding country rocks are a mixture of submarine and subaerial calc-alkaline volcanic rocks ranging from basaltic andesite to rhyolite in composition, but are predominantly andesites and dacites. The current surface spatial distribution of the alteration mineralogy is a function not only of the original hydrothermal, but also subsequent tectonic and erosional processes. The high relief and the excellent rock exposure provide ideal conditions to evaluate the potential of Advanced Spaceborne Thermal Emission and Reflection Radiometer (ASTER) satellite remote sensing data to identify and differentiate the different styles of alteration mineralisation. Laboratory spectral reflectance and calculated emittance measurements of field samples, supported by XRD analysis and field mapping, were used to support the analysis. Band ratio and spectral matching techniques were applied to the shortwave-infrared (SWIR) reflectance and thermal-infrared (TIR) emissivity imagery separately and were then integrated with topographic data. The band ratio and spectral matching approaches produced similar results in both the SWIR and TIR imagery. In the SWIR imagery, the advanced argillic, argillic and hydrous silica alteration zones were clearly identifiable, while in the TIR imagery, the silicic and advanced argillic alteration zones, along with the country rock, were differentiable. The integrated mineralogical–topographic datasets provided an enhanced understanding of the spatial and altitude distribution of the alteration zones when combined with conceptual models of their genesis, which provides a methodology for the differentiation of the multiple styles of alteration.
1. Introduction
Milos island is a young (<3 Ma) and recently emergent submarine volcano that records a range of contemporaneous mineralisation styles, from seafloor Mn-Fe-Ba [1], to sub seafloor Pb-Zn-Ag mineralisation [2], to epithermal Au-Ag mineralization [3,4]. It also shares similarities with active submarine mineralization associated with the volcanic centres of Palinuro [5] and Kolumbo [6] in the Aeolian and Aegean arcs (Figure 1A). Moreover, this shallow submarine volcanic–hydrothermal environment is where large gold and silver volcanic massive sulfide deposits such as Eskay Creek are thought to form [7].
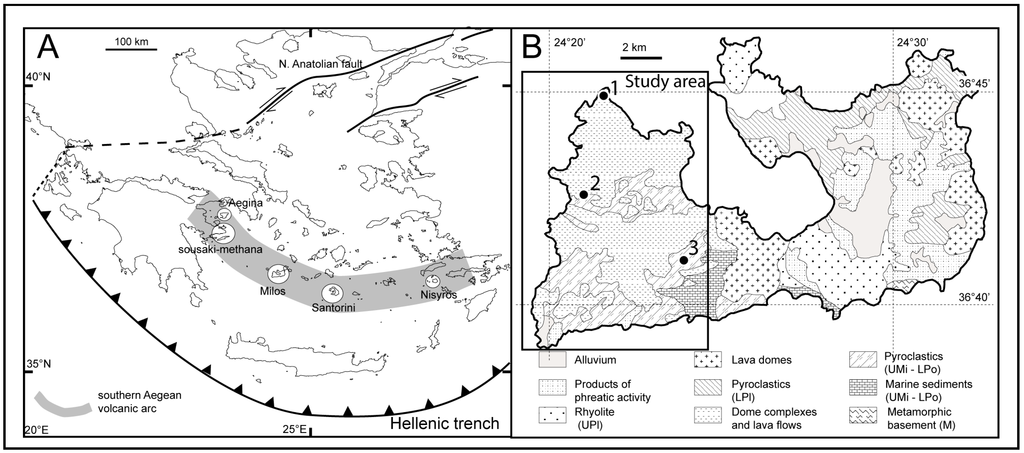
Figure 1.
(A): Main geotectonic elements of eastern Mediterranean with volcanic centers and regions of geothermal activity; (B): Main geologic features of Milos: 1—Cape Vani; 2—Triades-Galena-Kondaros; and 3—Profitis Ilias and Chondro Vouno. UPl—upper Pleistocene; LPl—lower Pleistocene; UPo—upper Pliocene; LPo—lower Pliocene; UMi—upper Miocene; M—Mesozoic (Adapted from [3]).
A sequence of submarine and subaerial volcanism, followed by hydrothermal alteration, significant tectonic activity, and subsequent erosion, has resulted in an area of high relief (Figure 2). The combination of the high spatial compositional heterogeneity of the mineralisation, the scale of the study area (100 km2), and the high relief pose a significant challenge to field-based studies. The excellent rock exposure and the very dry climate, with resultant lack of vegetation (Figure 3), makes Milos an ideal location to study the complex interactions between these different mineralization styles and the efficacy of remote sensing approaches to detect a range of mineralization styles, with applications to mineral exploration for gold-rich volcanic massive sulfide systems.

Figure 2.
Topography of western Milos (in meters) with sample locations.
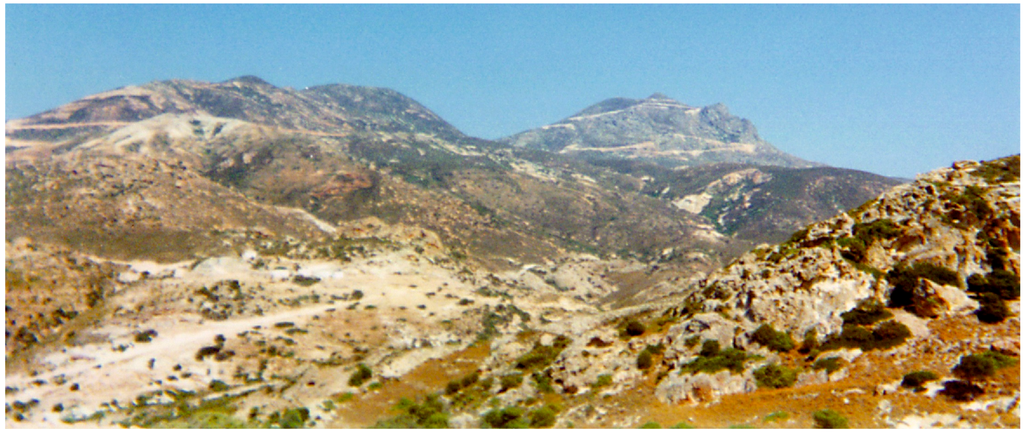
Figure 3.
Topography and vegetation of western Milos—looking northeast to Profitis Ilias.
Remote sensing in the solar reflective spectral range visible and near infrared (VNIR; 0.52–0.86 μm) and shortwave infrared (SWIR; 1.60–2.43 μm) has been widely demonstrated to be an invaluable methodology in the mapping of mineral absorption features occurring within transition metals (i.e., Fe, Mn, Cu, Ni, Cr, etc.) and alteration minerals that display absorption features associated with Mg-OH and Al-OH bonds [8,9,10,11,12,13,14,15,16,17,18,19,20]. Although these reflectance-based datasets have been successful, there are significant limitations in the range and quality of the geological parameters that can be retrieved, as many important rock-forming minerals (e.g., silicates) do not display diagnostic absorption features at VNIR/SWIR wavelengths [9,20,21].
This study evaluates the utility of band ratio and spectral matching techniques to Advanced Spaceborne Thermal Emission and Reflection Radiometer (ASTER) SWIR reflectance and thermal emissivity integrated with topographic data to identify and differentiate the multiple styles of alteration in the western part of the island of Milos.
2. Geological Setting of the Study Area
The island of Milos, located in the Aegean arc (Figure 1A), is associated with a zone of Pliocene to modern volcanism related to active backarc extension caused by the subduction of the African plate beneath the Aegean microplate [3]. It is built on continental crust, comprises seven major volcanic centers, and is located 120–250 km north of the Hellenic Trench (Figure 1A). The volcanic rocks are calc-alkaline with localized high-K variants and range from basalt to rhyolite in composition, but are predominantly andesites and dacites [22]. Present-day hydrothermal activity comprises both low-enthalpy (Aegina, Sousaki, Methana, Greece) and high-enthalpy (Milos, Nisyros, Santorini, Greece) systems. Late Pliocene submarine and late Pleistocene to Holocene subaerial volcanic rocks overlie Mesozoic metamorphic basement and upper Miocene–lower Pliocene marine sedimentary rocks, recording a transition from a shallow submarine (200 m) to subaerial volcanic setting (Figure 1B). Emergence probably occurred in the middle to late Pleistocene [22]. Plutonic rocks are not known on Milos and have only been reported as ignimbrite hosted granitic xenoliths from the nearby islet of Kimolos [22].
The oldest submarine volcanic rocks occur on western Milos and host low sulfidation gold-silver mineralization—the Profitis Ilias (5.5 Mt at 4.4 g/t gold and 43 g/t silver) and Chondro Vouno (1.2 Mt at 1 g/t gold and 124 g/t silver) deposits (Figure 1B), which constitute a 20 km2 epithermal system with a combined resource of 0.8 Moz gold and 12.4 Moz silver. Mineralization is hosted by silicified, sericitized, and adularized rhyolitic tuffs and ignimbrites and consists of crustiform or colloform-banded quartz (or chalcedony), adularia, barite, and sericite veins related to quartz, adularia, sericite (or illite) wall-rock alteration. Mineralized veins extend to depths of at least 300 m below the current surface. Hypogene metallic minerals include pyrite, galena, chalcopyrite, sphalerite, marcasite, tetrahedrite, native gold, electrum and rare tellurides. Sulfides mainly occur deep in the system as disseminated stockwork mineralization of unknown vertical extent. Elevated gold values are concentrated above the base-metal zone and are spatially related to boiling [3,4].
Milos island hosts several hydrothermal mineral deposits, and the host volcanic rocks have undergone intense hydrothermal alteration. Alfieris, et al. [2] state that alteration zones are similar to those described in high- and intermediate/low-sulfidation epithermal mineralizing systems. On the basis of alunite grain size and habit, they also distinguish hypogene and steam heated advanced argillic alteration. However, this distinction cannot be determined from multi-spectral satellite datasets such as ASTER. Therefore, for the purposes of this study, we are only examining the distribution of advanced argillic alteration and do not make any reference to its origin. In the north of western Milos, they identify NE-trending silicic alteration outcrops. These grade laterally and vertically into advanced argillic, argillic, and propylitic alteration and fresh rock. In addition, there is localized phyllic (sericitic) alteration. Silicic alteration comprises fine-grained quartz, TiO2 polymorphs, alunite, and pyrite, and occurs as vuggy and massive-silica types. Advanced argillic alteration is typified by intergrowths of alunite, quartz, chalcedony, opal-CT, kaolinite, halite, dickite, pyrophyllite, diaspore, pyrite, chalcedony, and jarosite. Towards the south of western Milos are blanket-like zones of advanced argillic alteration. Locally, in the northern part, this style of alteration overprints the hypogene advanced argillic alteration [2]. Argillic alteration comprises illite ± kaolinite ± smectite ± sericite. Its main occurrence is marginal to the main centers of advanced argillic alteration. However, it can also occur in fault zones [2]. In terms of abundance of individual alteration minerals, kaolinite is generally more widespread in the advanced argillic alteration associated with sub-seafloor Pb-Zn-Ag mineralization in the Triades–Galana–Kondaros area (Location 2, Figure 1B), in contrast, illite is more abundant in the middle and southern part of the study area, and is associated with epithermal Au-Ag mineralization in the Chondro Vouno–Profitis Ilias area (Location 3, Figure 1B). Phyllic alteration is restricted to the area around Galana, and is typified by the presence of sericite, quartz, and pyrite. Adularia-sericite alteration—typical of epithermal Au mineralization—envelopes quartz veins at Profitis Ilias, Chondro Vouno, Galena, and Triades [2].
3. Materials and Methods
3.1. Field Mapping and XRD Analyses
Two sets of field and XRD datasets were utilized in this study. An extensive field campaign was carried out by the authors in May 2010, and a representative set of field samples was acquired (Figure 2). XRD analyses were carried out on these of samples, with a subset of the results presented in Table 1. In addition, Alfieris et al. [2] present a map of the alteration zones of western Milos produced using field mapping and XRD analysis [2], Figure 4.

Table 1.
Description of the field sites, samples collected, and the results of the XRD analyses.

Figure 4.
Alteration Map of western Milos, adapted from [2].
3.2. VNIR-SWIR Reflectance Spectroscopy
VNIR-SWIR (λ = 0.4−2.5 μm) reflectance spectra were collected using an Analytical Spectral Devices (ASD) FieldSpec Pro FR spectroradiometer. The ASD has a spectral range of 0.35–2.5 μm. Spectra were collected at sampling intervals of 1.4 nm at 0.35–1.0 μm and 2 nm at 1.0–2.5 μm, with the following full width half maximum (FWHM) spectral resolutions: 6 nm on average at VNIR wavelengths (though up to 3 nm at ~0.7 μm) and 11 nm at SWIR wavelengths. Absolute reflectance values were calculated by calibrating each batch of ~20 repeat measurements against a Spectralon white reference panel that was also measured at the end of each batch to monitor for instrumental drift. Individual measurements sample an ellipse approximately 10 × 5 mm in size. In order to maximize the quality of VIS-SWIR spectra, ~50 × 50 mm flat surfaces were cut into the samples and polished coarsely in order to ensure good optical coupling with the ASD contact probe. The effect of compositional heterogeneity on sample spectra was mitigated by averaging over up to 94 evenly spaced repeat measurements taken from across sample surfaces. The typical precision of individual spectra estimated from repeat measurements of an identical field of view is <0.5.
3.3. ASTER Satellite Remote Sensing Dataset
ASTER datasets covering the SWIR and thermal-infrared (TIR) waveranges (Table 2) were used in the study [22]. An ASTER SWIR surface reflectance data product (AST-07XT) was downloaded from the Earth Remote Sensing Data Analysis Center in Japan. The AST-07XT imagery was used, as it already has the CROSSTALK correction applied and has been found to be more reliable than previous ASTER products for discriminating hydrothermal alteration minerals and mineral groups without the use of additional spectral data from the site for calibration [18,23]. The ASTER spectral emittance data used in this study was the standard product (AST_05), which was produced at the EROS Data Center using a MODTRAN-based atmospheric correction and the Temperature–Emissivity Separation TES) algorithm developed by [24]. The spectral emittance data were co-registered with the SWIR data by applying a 6× pixel duplication of the TIR data.

Table 2.
Advanced Spaceborne Thermal Emission and Reflection Radiometer (ASTER) Spectral waverange (μm) and Spatial Resolution specifications [8].
3.4. ASTER Data Processing
Band Ratios (Table 3), [18,19,20,25] and spectral matching [26] analyses were applied to the SWIR and TIR datasets. The ASTER satellite has 14 spectral bands offering many permutations of Band Ratios [18,19,20,25], and spectral matching [26] analyses were applied to the SWIR and TIR datasets.

Table 3.
Lithologic and mineralogical indices applied.
The spectral matching algorithm implemented in this study was the Constrained Energy Minimisation (CEM) technique [26]. It performs a matched filtering (MF) of multispectral/hyperspectral images, which minimises the response of background materials by projecting each pixel vector onto a subspace—which is orthogonal to the background spectra—and then maximises the response of the endmembers of interest by comparing the residual pixels to each of the reference spectra [26]. It was applied to both the SWIR and TIR ASTER images separately. The spectral matching approach can utilise a range of input spectral profile sources. Acquisition of a representative set of field spectra of the appropriate alteration zones should provide the optimum mapping approach; however, in practice, this is often very difficult to achieve due to sampling-related issues. Alternative approaches are using library spectra (e.g., the ASTER spectral library [27]) or spectral endmembers retrieved from the imagery. There are two pre-processing stages required to retrieve the spectral endmembers from the image dataset. Firstly, a Minimum Noise Function (MNF) transformation must be applied to determine the inherent dimensionality of the image data and to reduce the computational requirements for subsequent processing [28,29]. Secondly, a Pixel Purity Index (PPI) is then applied using the MNF result as the input data, which extracts the image endmembers [28,29].
4. Spectral Results
4.1. Spectral Reflectance
Laboratory spectra covering the visible, near-infrared, and shortwave infrared waveranges of minerals characteristic of hydrothermally altered rocks are shown in Figure 5.
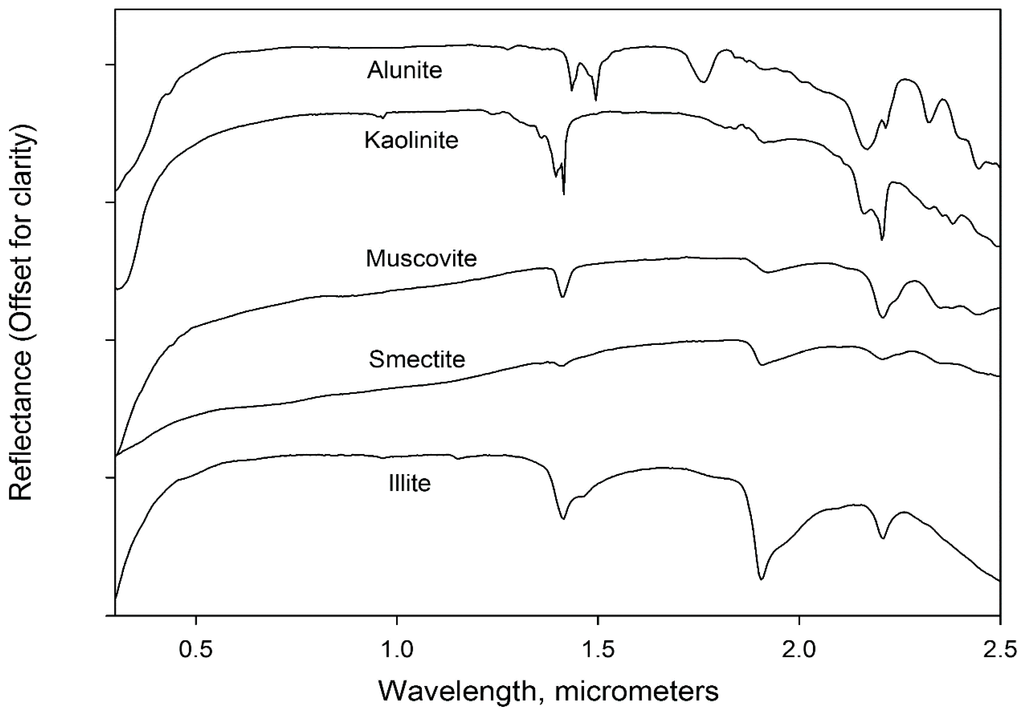
Figure 5.
Laboratory visible, near-infrared, and shortwave-infrared spectra of important hydrothermal alteration minerals [9].
Laboratory spectra of samples collected on Milos representative of the silicic, advanced argillic, argillic, propylitic, and adularia-sericitic alteration zones are shown in Figure 6A. The reflectance spectra of samples MI-05 and MI-27 from the study area indicates that they contain minerals that are typical of advanced argillic alteration, attributed to AL-OH absorption with the kaolinite features at 2.17 and 2.2 μm being very prominent. The reflectance spectra of samples MI-22 and MI-28 from the study area exhibit an intense absorption feature at 2.17 μm, along with secondary features located near 2.32 and 1.760 μm and the doublet O-H feature in the 1.5 μm region, which are diagnostic of alunite. Although kaolinite is present, the intense alunite features obscure the kaolinite features at 2.17 and 2.2 μm. Examination of the reflectance spectra of sample MI-22 and MI-28 from the study area shows a significant absorption feature centered at 2.208 μm with complimentary, less distinct absorption features at 1.765 μm and at 1.415 μm, characteristic of alunite. Examination of the reflectance spectra of sample MI-04 and MI-25 from the study area exhibit absorption features at 1.765 and 2.208 μm, which are indicative of a combination of kaolinite and smectite. These minerals are characteristic of the argillic alteration zone. The reflectance spectrum of MI-26 is relatively smooth, with one distinguishable absorption feature centered at 2.215 μm, which indicates the presence of illite. These minerals are characteristic of the propylitic alteration zone. Sample MI-02 exhibits a minor absorption feature at 2.205 μm and secondary absorption features at 2.345 and 2.44 μm. Al-phyllosilicate minerals (such as muscovite) have intense AL-OH absorption features near 2.2 μm and secondary features near 2.35 and 2.44 μm. These minerals are characteristic of the adularia-sericite alteration zone. The laboratory reflectance spectrum of MI-21 exhibits a relatively smooth profile with a significant, asymmetric absorption feature centered at 2.2 μm.
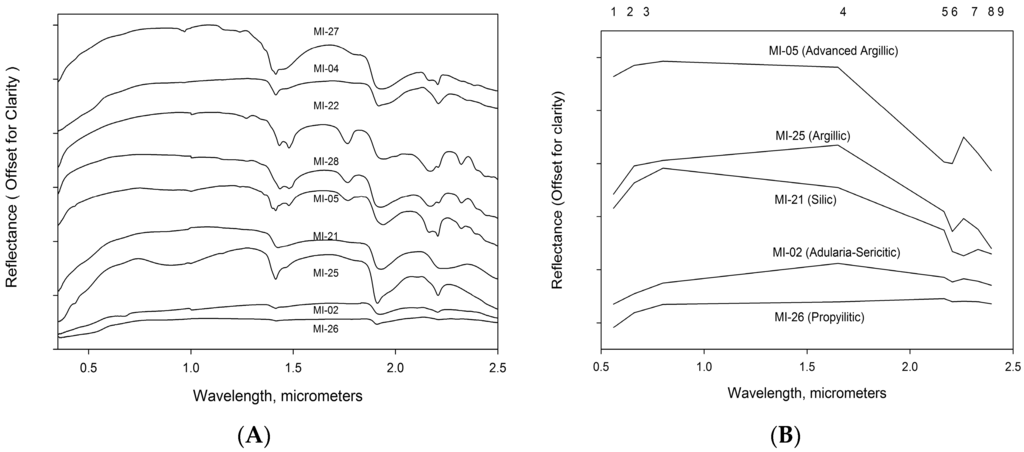
Figure 6.
(A): Laboratory spectra of field samples representing the alteration zones. Numbers in labels indicate field site (Table 1); (B): spectra representative of the alteration zones (shown in Figure 3A) resampled to the nine ASTER VNIR + SWIR bandwidths. ASTER band wavelength position shown at top.
4.2. Spectral Emissivity
Many common rock-forming minerals such as quartz, feldspars, olivines, pyroxenes, micas, and clay minerals have spectral features in the 8–14 μm wavelength region (Figure 7A) [9,11,14,19,21,30,31]. The emissivity minima features of quartz are related to fundamental asymmetric Si-O stretching vibrations (reststrahlen bands) characterised by emission minima near 8.40 and 8.95 μm, separated by a sharp emission maximum at 8.63 μm. The reststrahlen bands of quartz are the strongest of any silicate mineral [9,21,31]. Alunite produces second-order absorption features with a minimum around 9.9 μm, while kaolinite has multiple absorption features at 9.0, 9.68, 9.92, and 10.95 μm. Orthoclase and muscovite show a moderately intense emission minimum centered near 9.7 μm.
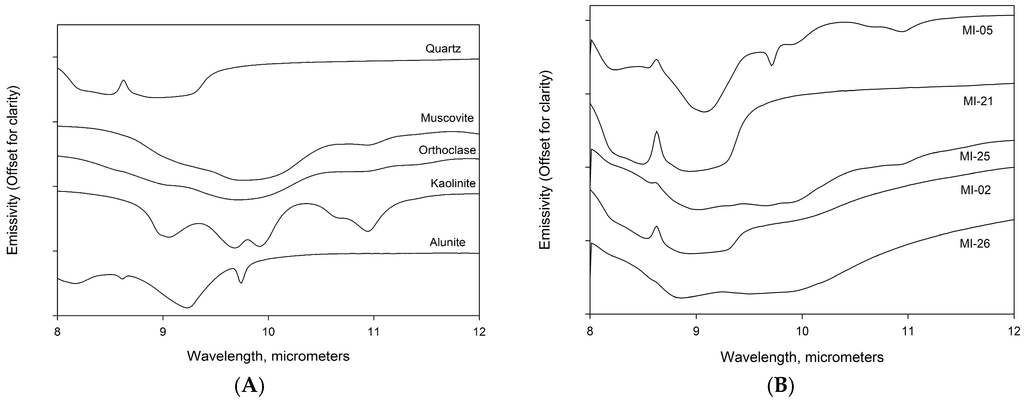
Figure 7.
(A): Laboratory thermal-infrared emissivity infrared spectral of important hydrothermal alteration minerals [27]; (B): Calculated thermal-infrared emissivity spectra of field samples representing the alteration zones. Numbers in labels indicate field site (Table 1).
The XRD analyses show that silicate-based minerals make up a significant proportion of the rock samples collected on Milos. Using the results from the XRD analyses, the emission spectra from the Jet Propulsion Laboratory, and the Arizona State University spectral libraries, emission spectra for the sampled rocks were generated (Figure 7B). The emission spectra from the sample representative of the silicic alteration zone has a very strong double absorption feature between 8.4 and 8.95 μm produced by the almost pure quartz mineralogy. The emissivity spectra from the advanced argillic zone has two distinctive absorption features at 9.2 and 9.9 μm. The argillic and the propylitic emission spectra are similar, with a broad absorption feature from 8.95 to 10 μm. There is a distinguishable shift of the absorption feature to longer wavelengths moving from the silic to the advanced argillic-argillic-propylitic alteration zones.
5. Results of ASTER Image Analysis
The accuracy of the mineralogical maps output from the analysis of the ASTER SWIR and TIR datasets were assessed using the alteration zones map [2] and XRD analyses of rock samples.
5.1. SWIR Data
The resampled ASTER laboratory spectra of the field samples retain definition of the most intense absorption features, particularly the intense absorption feature centered near 2.205 μm (Figure 6B). The different alteration zones are differentiable despite the significant decrease in spectral resolution. The argillic spectrum has a single differentiable feature centered on 2.205 μm, with the shoulder at 2.165 μm significantly lower than the shoulder at 2.260 μm. The adularia-sericite spectrum is also centered on 2.205 μm, but the higher wavelength shoulder is located at 2.330 μm. The advanced argillic spectrum has a pronounced absorption feature which extends from 2.165 to 2.330 μm with a distinct gradient between 2.205 and 2.260 μm. The silicified sinter (silicic) spectrum has a distinct absorption feature extending to 2.330 μm. Both the adularia-sericitic and the slightly altered dacite samples only have one very weak absorption feature centered at 2.216 μm
The spectral endmembers representing rocks containing spectrally-dominant alunite-kaolinite, illite-smectite-sericite, and hydrous silica identified using the PPI processing are shown in (Figure 8). Only three spectral distinct mineralogical endmembers could be resolved from the imagery. The spectra representative of the advanced argillic alteration zone shows the distinctive, intensive, broad absorption feature between bands five and six are characteristic of significant alunite content with secondary kaolinite. The spectra representative of the argillic alteration zone shows the distinctive (but relatively weak) absorption feature in band six, while the spectra representative of hydrous silica shows a distinctive spectra edge between bands five and nine. The spectral responses from sericite, smectite, and illite in the propylitic and adularia-sericitic alteration zones were not sufficient to differentiate from the argillic zone. The overall shapes of the ASTER-derived spectra are different from the field spectra resampled to the ASTER bandwidths because of the effects of several factors that influence the spectra, but are obviated in the laboratory. They include the presence of variable mineral mixtures, grain-size variations, residual atmospheric absorption features, and ASTER calibration errors [30].
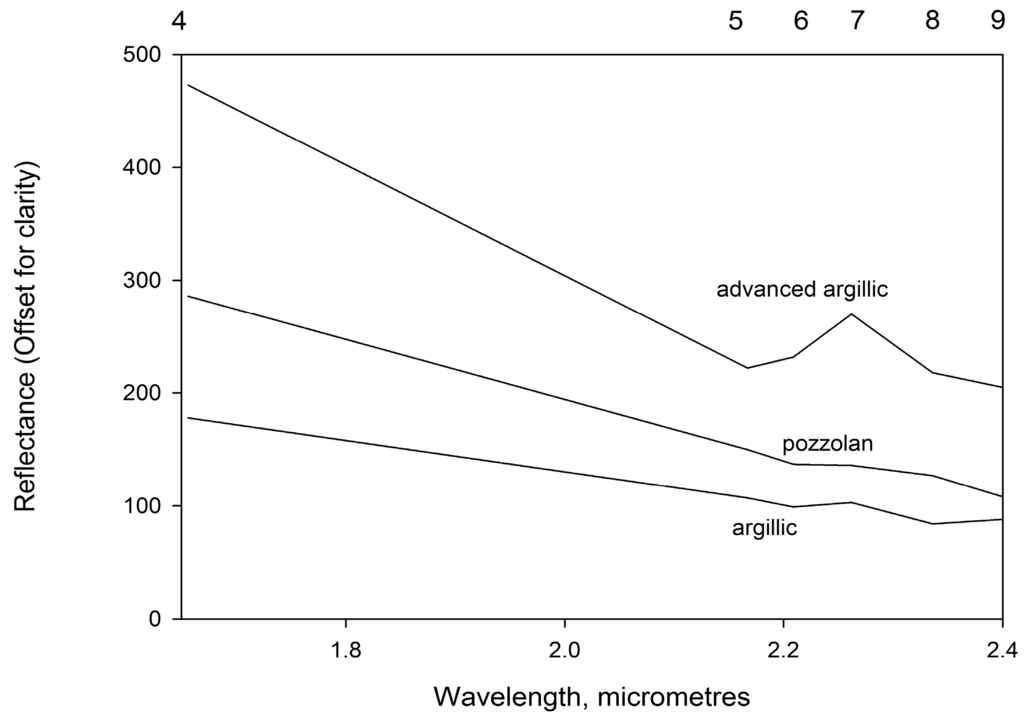
Figure 8.
ASTER image spectra used as reference in match-filter processing of SWIR data to map advanced argillic, argillic, and hydrous silica classes which are shown in Figure 9. ASTER band wavelength position shown at top. ASTER band wavelength position shown at top.
5.2. Results
The results of the band ratio and matched analysis of the SWIR image are shown in Figure 9. In both the band ratio and MF images, the degree of match is indicated by higher numbers representing good matches, and vice versa [28,29]. Pixels corresponding to the highest degree of match for each class were transferred digitally to the aerial photography mosaic and assigned a colour. Determination of the threshold range to represent each class was based on the coherence of the spatial distribution of pixels and lack of widely scattered pixels. Pixels that are not colour-coded are unclassified. The overall distribution of altered rocks is very similar in both the band ratio and MF images.
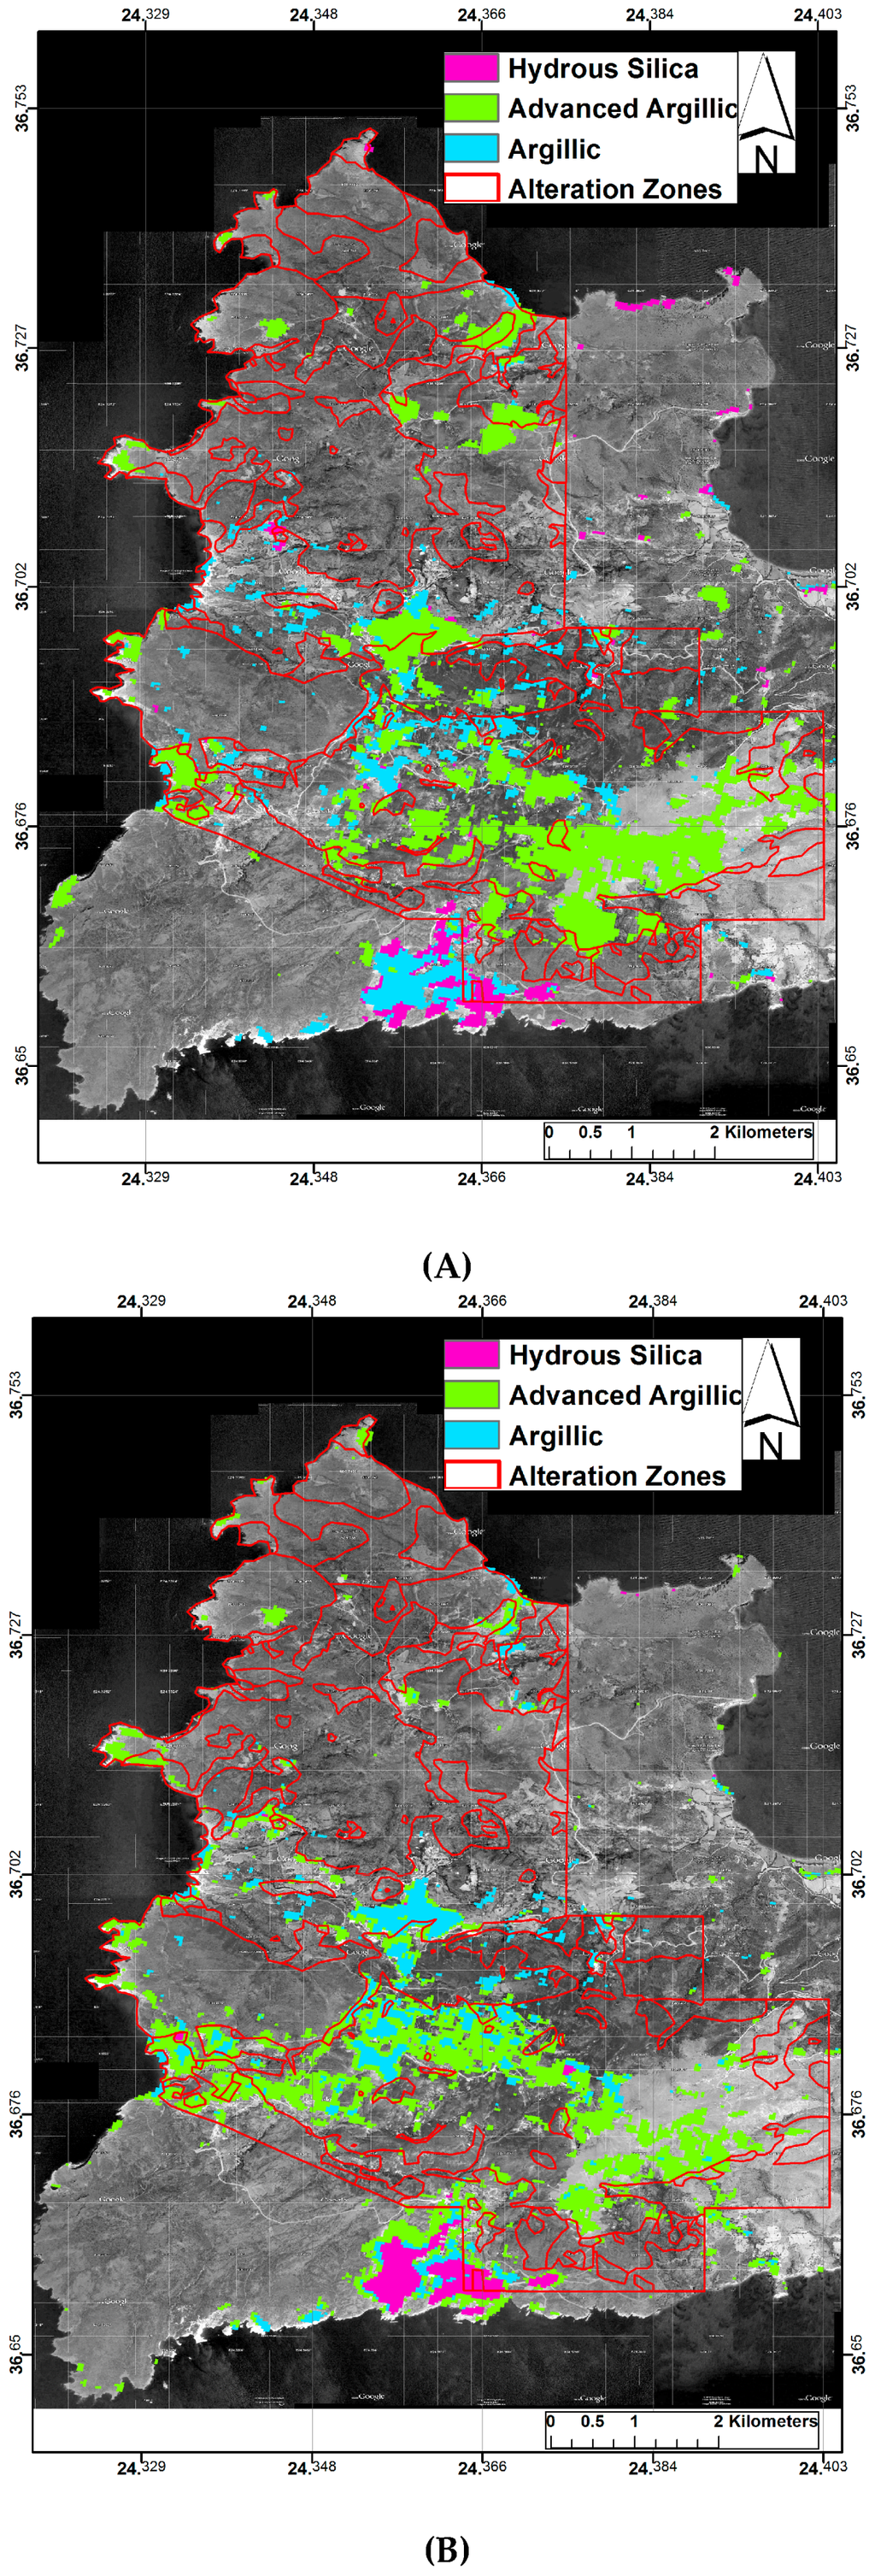
Figure 9.
Results of (A) Band Ratio and (B) Matched Filter analysis of SWIR data with map of alteration zones [2] overlain showing the distribution of three classes of hydrothermally altered rocks superposed on aerial photography grey-tone mosaic of the study area: green—advanced argillic (alunite-kaolinite-Pyrophyllite); blue—argillic (sericite-illite-smectite); and purple—hydrous silica (hydrous silica-jarosite-sericite).
The advanced argillic altered rocks are distributed unevenly across the study area with a discontinuous belt trending northwest to southeast across the central section of western Milos. There are also a number of significant advanced argillic discrete occurrences in the northern part of the study area. The distribution of the argillic alteration rocks are mainly located in a belt trending northwest to southeast across the centre of the study area.
There are additional small occurrences found peripherally to some of the advanced argillic occurrences. The hydrous silica index resolves the pozzolan quarries on the southern coast of the study area very clearly. In addition, there are a few very small, discrete occurrences in the centre and north of the study area. The samples M-04, MI-05, MI-25, and MI-27 are located in the mapped argillic altered zone, supporting the accuracy of the ASTER-derived maps of advanced argillic alteration. Sample MI-26 is indicative of slightly altered/country rock which again supports the accuracy of the ASTER-derived mineralogy maps.
5.3. TIR Data
Resampling the high-resolution laboratory spectra to the five ASTER TIR bandpasses results in a general loss of definition of specific absorption features, except for the main quartz reststrahlen feature located in ASTER band 12 (Figure 10A). Only three spectral endmembers were identified from the PPI analysis of the TIR wavelength imagery representing the silicic (quartz), advanced argillic (alunite-kaolinite) and country rock (Figure 10B). The spectra representative of the silicic alteration zone shows the distinctive, intense, broad emissivity minimum between bands 10 and 12 characteristic of a very high quartz content. The spectra representative of the advanced argillic alteration zone shows a distinctive emissivity minimum in band 12 but with higher values in bands 10 and 11. The spectra representative of the country rock also shows an emissivity minimum between bands 11 and 12 with a weak emissivity feature in band 14. Spectral endmembers representing the argillic and propylitic alteration zones were not identifiable. The coarse spatial resolution of the ASTER TIR data can have a significant impact on the capability to map surface mineralogy. Despite the effects due to the size of the field-of-view and surface and atmospheric effects, the generated emissivity spectra of MI-21 and MI-05 are similar to the ASTER-derived emissivity spectra.

The results of the Quartz Index (QI) and MF of the TIR imagery are shown in Figure 11, overlain by the alteration map [2]. The overall distribution of silicic rocks is very similar in both the QI and MF images. The silicic altered rocks are distributed unevenly across the study area, with a discontinuous belt trending across the central section of western Milos and a significant proportion aligned across the Profitis Ilias ridge. There are also a number of discrete occurrences in the central and northern parts of the study area. The distribution of the argillic alteration rocks in the MF image are associated peripherally to the silicic altered rocks. The distribution of the country rocks correlates closely with the distribution mapped by [2].
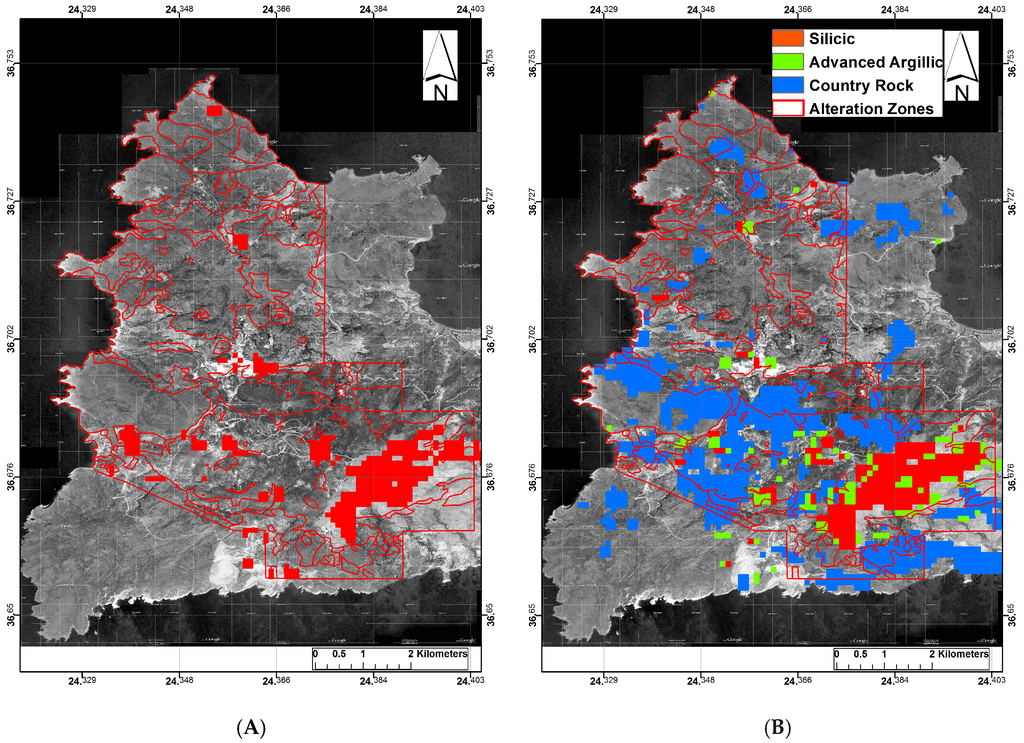
Figure 11.
Results of (A) Quartz Index and (B) Matched Filter analysis of TIR data with map of alteration zones [2] overlain showing the distribution of three classes of hydrothermally altered rocks superposed on aerial photography grey-tone mosaic of the study area: green—advanced argillic; red—silicic; and blue—country rock.
5.4. Integration of ASTER Mineralogical Maps with Topography
Integration of the mineralogical composition maps produced from the analysis of the SWIR and TIR datasets with a Digital Elevation Model (DEM) provides additional information into the spatial and altitudinal distribution of the altered rocks, which enhances understanding of the three-dimensional extent of the alteration zones and their association with the different styles (depths) of alteration, providing a methodology to differentiate the different styles of the multiple alteration events that have occurred on western Milos.
The discontinuous belt of alteration minerals across the centre of the study area is aligned along a ridge with the majority of the silicic alteration zone being location on Profitis Ilias. The spatially discrete alteration occurrences located in the centre and north of the study area are located at significantly lower altitudes. By utilising the conceptual models of the different styles of mineralisation, we can propose differentiating these alteration occurrences on the basis of their current altitude, with the occurrences located at the higher altitude (>250 m) being associated with a low sulfidation epithermal Au-Ag mineralization (Figure 12A) and those at a lower altitude (<250m) being associated with with advanced argillic alteration (Figure 12B) [3].

Figure 12.
Results of Matched Filter analysis of SWIR and TIR data superposed on aerial photography grey-tone mosaic of the study area: green—advanced argillic; red—silicic and blue—argillic; (A) alteration mineralisation distribution above 250 m altitude; (B) alteration mineralisation distribution below 250 m altitude.
6. Discussion
The analysis of the spectral reflectance data in the SWIR imagery clearly outlined the alteration zones from the country rocks. Despite the significant reduction in spectral resolution in the ASTER SWIR data, the hydrous silica, argillic, and advanced argillic altered rocks were clearly identifiable and differentiable. The laboratory spectra of the propylitic, phyllic, and adularia-sericite alteration zones showed that the absorption features were weak, which could explain why these alteration zones were not clearly identifiable in the ASTER data. The spatial distribution of the identified altered rocks were similar in the band ratio and MF analysis, with a discontinuous belt of altered rock running across the centre of the study area clearly visible and with small, discrete occurrence in the central and northern parts of western Milos. Advanced argillic outcrops were very clearly identifiable because of the high alunite and natro-alunite concentrations and the excellent rock exposure. The argillic alteration zones are usually smaller in extent and are often found peripheral to the advanced argillic outcrops.
Although ASTER TIR data has the potential to overcome a significant limitation of the SWIR data—the identification of silicate minerals—mixtures of quartz with other minerals can also affect spectral shape. The presence of these minerals in sufficient concentrations will decrease the prominence of the diagnostic quartz emissivity peak at band 11 or create an emissivity absorption feature at those wavelengths. The presence of montmorillonite, kaolinite, or muscovite (among other minerals) will result in a substantial decrease in emissivity between bands 10 and 12. ASTER SWIR [26,27] can be used to identify many rock-forming minerals that will affect the TIR spectral response. The absence of an ASTER band near 9.8 μm—resulting from intense atmospheric absorption—is an important limitation in discriminating alunite and kaolinite from quartz.
The results of the band ratios and MF analysis gave similar results, which matched closely to the alteration zones mapped by [2] and the XRD sample compositions. Spectral matching techniques should in theory produce more accurate results, particularly if field spectra from the study area are available for use. However, in practice, issues relating to sampling in terms of how representative the ground targets are relative to the ASTER image can cause significant problems. While band ratios are a relatively imprecise method of quantifying absorption feature shape and can show significant confusion between surface materials with similar spectral properties, they can often produce better results than the matched-filter technique.
Integration of topographic data with surface composition data can provide additional insight into the nature of alteration processes. The western part of Milos hosts a wide range of hydrothermal alteration styles which were generated at a variety of depths. The present-day topographic distribution of these alteration events has been further affected by tectonic and erosional processes, such that, epithermal Ag-Au mineralisation now outcrops in a discrete higher altitudinal zone, whereas as the advanced argillic alteration occurs at significantly lower altitudes.
7. Conclusions
This study has demonstrated that ASTER SWIR and TIR imagery have the capability to resolve multiple styles of alteration mineralisation. The TIR datasets are essential in order to resolve non-hydrous silicates associated with hydrothermal alteration and thus fully characterise all the alteration zones associated with hydrothermal alteration processes. The integration of topographic data, combined with a clear understanding of conceptual models of mineralisation, provides a powerful additional tool to help identify and differentiate multiple styles of alteration.
Acknowledgments
This research was supported by a grant award from the Natural Environment Research Council (GA/09F/139) and by loans of field spectrometers from the NERC Field Spectroscopy Facility. J.N. and S.K. publish with permission of the Executive Director, British Geological Survey (NERC). Funding was also provided by the Greece-UK bilateral research project - Mapping Epithermal Alteration zones associated with Gold Mineralisation using ASTER satellite data.
Author Contributions
Graham Ferrier and Jon Naden conceived the original research idea. Graham Ferrier undertook analysis of the remote sensing data and led writing the paper. Jon Naden provided the geological context to interpret the remote sensing results. Graham Ferrier, Jon Naden, Athanassios Ganas and Simon Kemp undertook the field sampling campaign. Simon Kemp did the quantitative XRD analyses. Richard Pope assisted in the image processing.
Conflicts of Interest
The authors declare no conflict of interest.
References
- Kilias, S.P. Microbial mat-related structures in the Quaternary Cape Vani manganese-oxide (-barite) deposit, NW Milos island, Greece. Microb. Mats Siliciclastic Depos. Syst. Time Soc. Sediment. Geol. Spec. Publ. 2012, 101, 97–110. [Google Scholar]
- Alfieris, D.; Voudouris, P.; Spry, P.G. Shallow submarine epithermal Pb–Zn–Cu–Au–Ag–Te mineralization on western Milos Island, Aegean Volcanic Arc, Greece: Mineralogical, geological and geochemical constraints. Ore Geol. Rev. 2013, 53, 159–180. [Google Scholar] [CrossRef]
- Naden, J.; Kilias, S.P.; Darbyshire, D.B.F. Active geothermal systems with entrained seawater as analogues for transitional continental magmato-ydrothermal and volcanic-hostedmassive sulfide mineralization—The example of Milos Island, Greece. Geology 2005, 33, 541–544. [Google Scholar] [CrossRef]
- Kilias, S.P.; Naden, J.; Cheliotis, I.; Shepherd, T.J.; Constandinidou, H.; Crossing, J.; Simos, I. Epithermal gold mineralisation in the active Aegean volcanic arc: The Profitis Ilias deposit, Milos Island, Greece. Miner. Depos. 2001, 36, 32–44. [Google Scholar] [CrossRef]
- Petersen, M.; Westhues, T.; Hannington, M.D.; Gemmell, J.B.; Sharpe, R.; Peters, M.; Strauss, H.; Lackschewitz, K.; Augustin, N.; Gibson, H.; et al. Drilling shallow-water massive sulfides at the Palinuro Volcanic Complex, Aeolian Island Arc, Italy. Econ. Geol. 2014, 109, 2129–2157. [Google Scholar] [CrossRef]
- Polymeanakou, P.N.; Godelitsas, A.; Argyraki, A.; Carey, S.; Gamalestsos, P.; Mertzimekis, T.J.; Stathopoulou, E.; Goettlicher, J.; Steininger, R.; Betzelou, K.; et al. New insights into hydrothermal vent processes in the unique shallow-submarine arc-volcano, Kolumbo (Santorini), Greece. Sci. Rep. 2013, 3. [Google Scholar] [CrossRef]
- Sherlock, R.L.; Roth, T.; Spooner, E.T.C.; Bray, C.J. Origin of the Eskay Creek precious metal-rich volcanogenic massive sulfide deposit: Fluid inclusion and stable isotope evidence. Econ. Geol. 1999, 94, 803–804. [Google Scholar] [CrossRef]
- Fujisada, H. Design and performance of ASTER instrument. Proc. SPIE 1995, 2583, 16–25. [Google Scholar]
- Hunt, G.R.; Ashley, P. Spectra of altered rocks in the visible and near infrared. Econ. Geol. 1979, 74, 1613–1629. [Google Scholar] [CrossRef]
- Clark, R.N.; Swayze, G.A.; Gallagher, A. Mapping minerals with imaging spectroscopy. US Geol. Surv. Off. Miner. Resour. Bull. 1993, 2039, 141–150. [Google Scholar]
- Abrams, M.; Hook, S.J. Simulated ASTER data for geologic studies. IEEE Trans. Geosci. Remote Sens. 1995, 33, 692–699. [Google Scholar]
- Ferrier, G.; Wadge, G. The application of imaging spectrometry data to mapping alteration zones associated with gold mineralization in southern Spain. Int. J. Remote Sens. 1996, 17, 331–350. [Google Scholar] [CrossRef]
- Ferrier, G.; White, K.; Griffiths, G.; Bryant, R.; Stefouli, M. The mapping of hydrothermal alteration zones on the island of Lesvos, Greece using an integrated remote sensing dataset. Int. Remote Sens. 2002, 23, 341–356. [Google Scholar] [CrossRef]
- Rowan, L.C.; Mars, J.C. Lithologic mapping in the mountain pass, California area using advanced spaceborne thermal emission and reflection radiometer (ASTER) data. Remote Sens. Environ. 2003, 84, 350–366. [Google Scholar] [CrossRef]
- Azizi, H.; Tarverdi, M.A.; Akbarpour, A. Extraction of hydrothermal alterations from ASTER SWIR data from east Zanjan, northern Iran. Adv. Space Res. 2010, 46, 99–109. [Google Scholar] [CrossRef]
- Haselwimmer, C.E.; Riley, T.R.; Liu, J.G. Assessing the potential of multispectral remote sensing for lithological mapping on the Antarctic Peninsula: Case study from Eastern Adelaide Island, Graham Land. Antarct. Sci. 2010, 22, 299–318. [Google Scholar] [CrossRef]
- Haselwimmer, C.E.; Riley, T.R.; Liu, J.G. Lithologic mapping in the Oscar II Coast area, Graham Land, Antarctic Peninsula using ASTER data. Int. J. Remote Sens. 2011, 32, 2013–2035. [Google Scholar] [CrossRef]
- Pour, A.M.; Hashim, M. The application of ASTER remote sensing data to porphyry copper and epithermal gold deposits. Ore Geol. Rev. 2012, 44, 1–9. [Google Scholar] [CrossRef]
- Rockwell, B.W. Description and Validation of an Automated Methodology for Mapping Mineralogy, Vegetation, and Hydrothermal Alteration Type from ASTER Satellite Imagery with Examples from the Sa Juan Mountains. In U.S. Geological Survey Scientific Investigations Map 3190; U.S. Geological Survey: Reston, VA, USA, 2012; p. 35. [Google Scholar]
- Van der Meer, F.; van der Werff, H.M.A.; van Ruitenbeek, F.J.A.; Hecker, C.A.; Bakker, W.H.; Noomen, M.F.; van der Meijde, M.; Carranza, E.J.M.; Boudewijn de Smeth, J.; Woldai, T. Multi- and hyperspectral geologic remote sensing: A review. Int. J. Appl. Earth Obs. Geoinform. 2012, 14, 112–128. [Google Scholar] [CrossRef]
- Salisbury, J.W. Infrared (2.1–25 um) spectra of minerals. In Johns Hopkins Studies in Earth and Space Sciences; Johns Hopkins University Press: Baltimore, MD, USA, 1991. [Google Scholar]
- Stewart, A.L.; McPhie, J. An upper Pliocene coarse pumice breccia generated by a shallow submarine explosive eruption, Milos, Greece. Bull. Volcanol. 2004, 66, 15–28. [Google Scholar] [CrossRef]
- Mars, J.C.; Rowan, L.C. Spectral assessment of new ASTER SWIR surface reflectance data products for spectroscopic mapping of rocks and minerals. Remote Sens. Environ. 2010, 114, 2011–2025. [Google Scholar] [CrossRef]
- Gillespie, A.; Rokugawa, S.; Matsunaga, T.; Cothern, J.; Hook, S.; Kahle, A. A temperature and emissivity separation algorithmfor advanced spaceborne thermal emission and reflection radiometer (ASTER) images. IEEE Trans. Geosci. Remote Sens. 1998, 36, 1113–1126. [Google Scholar] [CrossRef]
- Rockwell, B.W.; Hofstra, A.H. Identification of quartz and carbonate minerals across northern Nevada using ASTER thermal emissivity data—Implications for geologic mapping and mineral resource investigations in well-studied and frontier areas. Geosphere 2008, 4, 218–246. [Google Scholar] [CrossRef]
- Harsanyi, J.C.; Chang, C.I. Hyperspectral image classification and dimensionality reduction: An orthogonal subspace projection approach. IEEE Trans. Geosci. Remote Sens. 1994, 32, 779–785. [Google Scholar] [CrossRef]
- Baldridge, A.M.; Hook, S.J.; Grove, C.I.; Rivera, G. The ASTER Spectral Library Version 2.0. Remote Sens. Environ. 2009, 113, 711–715. [Google Scholar] [CrossRef]
- Boardman, J. Automating spectral unmixing of AVIRIS data using convex geometry concepts. In Summaries 4th Annual. JPL Airborne Geoscience Workshop; NASA Jet Propulsion Laboratory Publication 93–26: Boulder, CO, USA, 1993; Volume 1, pp. 11–14. [Google Scholar]
- Boardman, J.W. Leveraging the high dimensionality of AVIRIS data for improved subpixel target unmixing and rejection of false positives: Mixture tunded matched filtering. In Summaries of the Seventh JPL Airborne Geoscience Workshop; NASA Jet Propulsion Laboratory Publication 97–1: Boulder, CO, USA, 1998; pp. 55–56. [Google Scholar]
- Rowan, L.C.; Schmidt, R.G.; Mars, J.C. Distribution of hydrothermally altered rocks in the Reko Diq, Pakistan mineralized area based on spectral analysis of ASTER data. Remote Sens. Environ. 2006, 104, 74–87. [Google Scholar] [CrossRef]
- Christensen, P.R.; Bandfield, J.L.; Hamilton, V.E.; Howard, D.A.; Lane, M.D.; Piatek, J.L.; Stefanov, W.L. A thermal emission spectral library of rock-forming minerals. J. Geophys. Res. 2000, 105, 9735–9739. [Google Scholar] [CrossRef]
© 2016 by the authors; licensee MDPI, Basel, Switzerland. This article is an open access article distributed under the terms and conditions of the Creative Commons Attribution (CC-BY) license (http://creativecommons.org/licenses/by/4.0/).